Volume 36 Issue 2
Mar.  2019
Turn off MathJax
Article Contents

XIAHOU Zuoying, ZHU Hong, JIN Guihong, WANG Jiajia, FAN Xiaoyue, ZHOU Jiexin, ZHANG Mingru, HE Yunhe. Modeling the geographic distribution of Platycrater arguta[J]. Journal of Zhejiang A&F University, 2019, 36(2): 247-254. doi: 10.11833/j.issn.2095-0756.2019.02.005
Citation: XIAHOU Zuoying, ZHU Hong, JIN Guihong, WANG Jiajia, FAN Xiaoyue, ZHOU Jiexin, ZHANG Mingru, HE Yunhe. Modeling the geographic distribution of Platycrater arguta[J]. Journal of Zhejiang A&F University, 2019, 36(2): 247-254. doi: 10.11833/j.issn.2095-0756.2019.02.005

Modeling the geographic distribution of Platycrater arguta

doi: 10.11833/j.issn.2095-0756.2019.02.005
  • Received Date: 2018-03-01
  • Rev Recd Date: 2018-04-16
  • Publish Date: 2019-04-20
  • To find the geographical distribution pattern of the National Level Ⅱ wild protected plant Platycrater arguta and to understand its geographical migration patterns with climate change, DIVA-GIS software and its integrated BIOCLIM and DOMAIN models were used in combination with 80 precision distribution points. Distribution point information was used to forecast the potential distribution area and analysis included the Receiver Operating Characteristic (ROC) curve test for the main climatic factors affecting distribution and a principal component analysis. The precise distribution information of P. arguta was imported into DIVA-GIS software, and the potential distribution area of P. arguta was predicted through the modelling panel. Prediction results from the two models both indicated that current potential distribution areas of P. arguta were concentrated at the junction of Zhejiang, Jiangxi, and Fujian Provinces in China as well as Shikoku Island in Japan. The optimum living area for P. arguta was greatly reduced with future climate estimates, and the low-grade habitat area shifted overall to the west and to higher altitudes. The ROC curve test showed that the area under the curve (AUC) values of both models reached more than 0.9 indicating that model prediction results were credible. The principal component analysis of 19 climatic variables showed that annual precipitation (BIO12), the most humid seasonal precipitation (BIO16), and the warmest seasonal precipitation (BIO18) were the major climatic factors that affected distribution of Platycrater arguta indicating that water was the main factor. Thus, research and protection strategies should be carried out based on predicted distribution areas.
  • [1] ZHANG Jie, YIN Dejie, GUAN Haiyan, QU Qiqi, DONG Li.  An overview of Sedum spp. Research . Journal of Zhejiang A&F University, 2018, 35(6): 1166-1176. doi: 10.11833/j.issn.2095-0756.2018.06.022
    [2] CUI Jing, WU Jigui, HUANG Bogao, JIANG Wanjie, FAN Yaqian, CHENG Jin.  The mechanisms of reproductive isolation in orchids . Journal of Zhejiang A&F University, 2016, 33(4): 695-702. doi: 10.11833/j.issn.2095-0756.2016.04.020
    [3] LIU Yixi, ZHANG Hao, ZHU Shengchao.  Diversity and geographical distribution of Pteridophytes in Wenzhou . Journal of Zhejiang A&F University, 2016, 33(5): 778-783. doi: 10.11833/j.issn.2095-0756.2016.05.008
    [4] MA Dandan, CHEN Zhenghai, ZHANG Fenyao, XIE Wenyuan, CHEN Feng.  A new record of Aspleniaceae from Zhejiang Province, China . Journal of Zhejiang A&F University, 2015, 32(3): 488-489. doi: 10.11833/j.issn.2095-0756.2015.03.024
    [5] LI Yadan, DU Huaqiang, ZHOU Guomo, GU Chengyan, XU Xiaojun, SUN Shaobo, GAO Guolong.  Chlorophyll content in Phyllostachys violascens related to hyper-spectral vegetation indices and development of an inversion model . Journal of Zhejiang A&F University, 2015, 32(3): 335-345. doi: 10.11833/j.issn.2095-0756.2015.03.002
    [6] SHEN Ya-mei, QIAN Chao, FAN Yi-rong, TONG Zai-kang.  Pollen morphology of 9 Magnolia species and 3 cultivars . Journal of Zhejiang A&F University, 2012, 29(3): 394-400. doi: 10.11833/j.issn.2095-0756.2012.03.011
    [7] WANG Xiu-rong, DING Gui-jie, LIU Lie-zhi, LI Ping.  Flowering behavior and spatial-temporal distribution characteristics of Jatropha curcas in Luodian . Journal of Zhejiang A&F University, 2012, 29(3): 388-393. doi: 10.11833/j.issn.2095-0756.2012.03.010
    [8] WANG Li-min, CHEN Zheng-hai, MA Dan-dan, XIA Guo-hua, LI Gen-you.  Four newly recorded plants in the limestone mountainous region of Zhejiang Province . Journal of Zhejiang A&F University, 2012, 29(3): 467-469. doi: 10.11833/j.issn.2095-0756.2012.03.024
    [9] MA Jin, LIU Zhi-gao, ZHENG Gang.  Differential proteomics and its application in plant salt stress . Journal of Zhejiang A&F University, 2011, 28(1): 139-143. doi: 10.11833/j.issn.2095-0756.2011.01.022
    [10] YOU Hai-mei, KOIKE Fumito.  Population dynamics of Oxalis griffithii using the Lefkovitch matrix model . Journal of Zhejiang A&F University, 2011, 28(1): 66-71. doi: 10.11833/j.issn.2095-0756.2011.01.011
    [11] WANG Wei-guo, YOU Han-jie, CHEN Hao-liang, ZHANG Hong-wei, JIN Xiao-feng.  A genus and a species of Cruciferae newly recorded from Zhejiang,China . Journal of Zhejiang A&F University, 2009, 26(2): 294-296.
    [12] XIA Guo-hua, LI Gen-you.  Saxifraga stolonifera f. sepaloides:a new form of Saxifraga from Zhejiang,China . Journal of Zhejiang A&F University, 2008, 25(5): 679-680.
    [13] YE Xi-yang, LI Gen-you, MA Dan-dan, XIE Wen-yuan, WANG Yue-pei.  A newly escaped plant species in Zhejiang Province :Hypochaeris radicata . Journal of Zhejiang A&F University, 2007, 24(5): 647-648.
    [14] WANG Guo-ming, XUBin-fen, WANG Mei-qin, CHEN Bin.  Resources of wild woody ornamental plants in Zhoushan Archipelago . Journal of Zhejiang A&F University, 2007, 24(1): 55-59.
    [15] MA Dan-dan, LI Gen-you, SHI Bai-lin, YE Xi-yang.  Lillium concolor var. pulchellum: a new geographical distribution plant in Zhejiang . Journal of Zhejiang A&F University, 2007, 24(1): 119-120.
    [16] SU Xiao-ling.  New record of plants in Zhejiang :Primula merrilliana Schltr . . Journal of Zhejiang A&F University, 2006, 23(4): 475-476.
    [17] LI Gen-you, CHEN Zheng-hai, YAN Fu-bin, LIN Xue-feng, ZHONG Tai-lin, MA Dan-dan.  New geographical distribution plants from Wenling in Zhejiang . Journal of Zhejiang A&F University, 2006, 23(5): 592-594.
    [18] SHI Bai-lin, LI Gen-you, JIN Zu-da, ZHONG Tai-lin.  Two newly recorded species from Zhejiang wetland vegetation . Journal of Zhejiang A&F University, 2006, 23(4): 472-474.
    [19] LIN Xin-chun, YU Zhi-xiong.  Characters of leaf epidermis of Magnoliaceae and its taxonomic significance . Journal of Zhejiang A&F University, 2004, 21(1): 33-39.
    [20] QI Heng-nian, SHOU Tao, JIN Shui-hu.  Leaf characteristics-based computer-aided plant identification model . Journal of Zhejiang A&F University, 2003, 20(3): 281-284.
  • [1]
    NI Jian, SONG Yongchang. Relationship between climate and distribution of main species of subtropical evergreen broad-leaved forest in China[J]. Chin J Plant Ecol, 1997, 21(2):115-129.
    [2]
    IPCC. IPCC, 2013, Technical summary[G]//STOCKER T, QIN D, PLATTNER G, et al. IPCC, Climate Change 2013: the Physical Science Basis, Contribution of Working Group Ⅰ to the Fifth Assessment Report of the Intergovernmental Panel on Climate Chang. Cambridge: Cambridge University Press, 2013: 710-719.
    [3]
    QI Xinshuai. Biogeographic Studies on the Genus Platycrater (Hydrangeaceae) Endemic to East China and South Japan[D]. Hangzhou: Zhejiang University, 2013.
    [4]
    LI Guoqing, LIU Changcheng, LIU Yuguo, et al. Advances in theoretical issues of species distribution models[J]. Acta Ecol Sin, 2013, 33(16):4827-4835.
    [5]
    XU Zhonglin, PENG Huanhua, PENG Shouzhang. The development and evaluation of species distribution models[J]. Acta Ecol Sin, 2015, 35(2):557-567.
    [6]
    LU Jianzhong, WENG Ensheng, WU Xiaowen, et al. Potential distribution of Colidago canadensis in China[J]. Acta Phytotaxon Sin, 2007, 45(5):670-674.
    [7]
    ZHANG Haitao, LUO Du, MU Xidong, et al. Predicting the potential suitable distribution area of the apple snail Pomacea canaliculata in China based on multiple ecological niche models[J]. Chin J Appl Ecol, 2016, 27(4):1277-1284.
    [8]
    GONG Wei, XIA Qing, CHEN Hongfeng, et al. Prediction of potential distributions of Bretschneidera sinensis, an rare and endangered plant species in China[J]. J South China Agric Univ, 2015, 36(4):98-104.
    [9]
    GAO Bei, WEI Haiyan, GUO Yanlong, et al. Using GIS and MaxEnt to analyze the potential distribution of Abies chensiensis[J]. Chin J Ecol, 2015, 34(3):843-852.
    [10]
    MA Songmei, NIE Yingbin, DUAN Xia, et al. The potential distribution and population protection priority of Amygdalus mongolica[J]. Acta Ecol Sin, 2015, 35(9):2960-2966.
    [11]
    ZHANG Xingwang, LI Yao, FANG Yanming. Geographical distribution and prediction of potential ranges of Quercus acutissima in China[J]. Acta Bot Boreal-Occident Sin, 2014, 34(8):1685-1692.
    [12]
    WANG Gang, MENG Yanqiong, SUN Jing, et al. Modeling the geographic distribution of Rhododendron maculiferum[J]. J Northwest A & F Univ Nat Sci Ed, 2013, 41(5):173-177.
    [13]
    WANG Juan, NI Jian. Modeling the distribution of five Caragana species in temperate northern China[J]. Chin J Plant Ecol, 2009, 33(1):12-24.
    [14]
    XU Xiaoting, YANG Yong, WANG Lisong. Geographic distribution and potential distribution estimation of Pseudotaxus chienii[J]. Chin J Plant Ecol, 2008, 32(5):1134-1145.
    [15]
    LI Yao, ZHANG Xingwang, FANG Yanming. Predicting the impact of global warming on the geographical distribution pattern of Quercus variabilis in China[J]. Chin J Appl Ecol, 2014, 25(12):3381-3389.
    [16]
    LE Xingui, TAN Ceming, LI Linhai, et al. New discovery on flaky community of Platycrater arguta of Yangjifeng Nature Reserve in Guixi City, Jiangxi, China[J]. J Jiangxi For Sci Technol, 2008(4):42-43.
    [17]
    TAO Xiaoyu. Genetic Diversity and Phylogeography of Genus Platycrater (Hydrangeaceae) Endemic to East China and South Japan[D]. Hangzhou: Zhejiang University, 2008.
    [18]
    GOVINDASAMY B, DUFFY P B, COQUARD J. High-resolution simulations of global climate, part 2:effects of increased greenhouse cases[J]. Clim Dynam, 2003, 21(5/6):391-404.
    [19]
    BUSBY J R. BIOCLIM:a bioclimate analysis and prediction system[J]. Plant Protect Quart, 1991, 6(1):64-68.
    [20]
    CARPENTER G, GILLISON A N, WINTER J. DOMAIN:a flexible modelling procedure for mapping potential distributions of plants and animals[J]. Biodiv Conserv, 1993, 2(6):667-680.
    [21]
    CAO Xiangfeng, QIAN Guoliang, HU Baishi, et al. Prediction of potential suitable distribution area of Flaveria bidentis in China based on niche models[J]. Chin J Appl Ecol, 2010, 21(12):3063-3069.
    [22]
    RAES N, ter STEEGE H. A null-model for significance testing of presence-only species distribution models[J]. Ecography, 2007, 30(5):727-736.
    [23]
    CHEN Pingfu, WILEY E O, MCNYSET K M. Ecological niche modeling as a predictive tool:silver and bighead carps in North America[J]. Biol Invas, 2007, 9(1):43-51.
    [24]
    ZHANG Lifang, QIU Lihong. Flowering phenology, floral traits and breeding system of Platycrater arguta[J]. Guihaia, 2017, 37(10):1301-1311.
    [25]
    ZHANG Lifang, LIN Changyong, YU Qun, et al. The morphological structure and germination characters of seed of rare and endangered species Platycrater arguta[J]. Acta Agric Univ Jiangxi. 2015, 37(3):497-503.
    [26]
    ZHU Gengping, LIU Guoqing, BU Wenjun, et al. Ecological niche modeling and its applications in biodiversity conservation[J]. Biodivers Sci, 2013, 21(1):90-98.
    [27]
    ZHU Hong, YOU Luxiang, LI Yongfu, et al. Modeling the geographical distribution pattern and climatic limited factors of Cerasus schneideriana[J]. J Trop SubtropBot, 2017, 25(4):315-322.
    [28]
    CAO Fuxiang, XU Qingjun, CAO Shoujin, et al. Advances of global warming impact on sepcies distribution[J]. J Cent South Univ For Technol, 2008, 28(6):86-89.
    [29]
    SHAO Hui, TIAN Jiaqian, GUO Ke, et al. Effects of sample size and species traits on performance of BIOCLIM in predicting geographical distribution of tree species:a case study with 12 deciduous Quercus species indigenous to China[J]. Chin J Plant Ecol, 2009, 33(5):870-877.
    [30]
    ZHANG Qin, ZHANG Dongfang, WU Mingli, et al. Predicting the global areas for potential distribution of Gastrodia elata based on ecological niche models[J]. Chin J Plant Ecol, 2017, 41(7):770-778.
  • 加载中
通讯作者: 陈斌, bchen63@163.com
  • 1. 

    沈阳化工大学材料科学与工程学院 沈阳 110142

  1. 本站搜索
  2. 百度学术搜索
  3. 万方数据库搜索
  4. CNKI搜索

Figures(1)  / Tables(4)

Article views(4688) PDF downloads(131) Cited by()

Related
Proportional views

Modeling the geographic distribution of Platycrater arguta

doi: 10.11833/j.issn.2095-0756.2019.02.005

Abstract: To find the geographical distribution pattern of the National Level Ⅱ wild protected plant Platycrater arguta and to understand its geographical migration patterns with climate change, DIVA-GIS software and its integrated BIOCLIM and DOMAIN models were used in combination with 80 precision distribution points. Distribution point information was used to forecast the potential distribution area and analysis included the Receiver Operating Characteristic (ROC) curve test for the main climatic factors affecting distribution and a principal component analysis. The precise distribution information of P. arguta was imported into DIVA-GIS software, and the potential distribution area of P. arguta was predicted through the modelling panel. Prediction results from the two models both indicated that current potential distribution areas of P. arguta were concentrated at the junction of Zhejiang, Jiangxi, and Fujian Provinces in China as well as Shikoku Island in Japan. The optimum living area for P. arguta was greatly reduced with future climate estimates, and the low-grade habitat area shifted overall to the west and to higher altitudes. The ROC curve test showed that the area under the curve (AUC) values of both models reached more than 0.9 indicating that model prediction results were credible. The principal component analysis of 19 climatic variables showed that annual precipitation (BIO12), the most humid seasonal precipitation (BIO16), and the warmest seasonal precipitation (BIO18) were the major climatic factors that affected distribution of Platycrater arguta indicating that water was the main factor. Thus, research and protection strategies should be carried out based on predicted distribution areas.

XIAHOU Zuoying, ZHU Hong, JIN Guihong, WANG Jiajia, FAN Xiaoyue, ZHOU Jiexin, ZHANG Mingru, HE Yunhe. Modeling the geographic distribution of Platycrater arguta[J]. Journal of Zhejiang A&F University, 2019, 36(2): 247-254. doi: 10.11833/j.issn.2095-0756.2019.02.005
Citation: XIAHOU Zuoying, ZHU Hong, JIN Guihong, WANG Jiajia, FAN Xiaoyue, ZHOU Jiexin, ZHANG Mingru, HE Yunhe. Modeling the geographic distribution of Platycrater arguta[J]. Journal of Zhejiang A&F University, 2019, 36(2): 247-254. doi: 10.11833/j.issn.2095-0756.2019.02.005
  • 气候变化与植物物种地理分布之间的相互关系,不仅是传统的植物生态学和生物地理学的重点研究领域,也是目前全球生态学的研究热点之一。从植物生长环境的角度出发,植物种的地理分布受到土壤、气候、地形等生态因子的影响,其中气候是决定植物种分布的最主要因素,同时植物地理分布区的动态变化也是全球气候变化的最直接反应[1]。政府间气候变化专门委员会(IPCC)第5次评估报告(AR5)指出,自1980年以来,全球平均气温呈上升趋势,至2012年为止,全球平均气温升高(0.85 ± 0.20)℃,并且近60 a升高了0.72 ℃。根据政府间气候变化专门委员会第5次报告的预测,全球平均气温将升高0.30~4.80 ℃[2]。全球气温升高必然改变生态环境,从而对植物种的地理分布格局造成影响。蛛网萼Platycrater arguta为绣球花科Hydrangeaceae蛛网萼属Platycrater的落叶灌木,第三纪孑遗植物,分布于中国浙江南部、江西东北部和福建北部,日本九州、四国等地也有,是东亚植物区系中典型的中国-日本间断分布物种[3],属于国家Ⅱ级保护植物。蛛网萼夏季开花,具二型花,花型优美,具有良好的观赏价值;叶片代为茶饮用,有较好的开发前景。根据多年的野外调查,蛛网萼分布区域极其狭窄,对生境要求极其苛刻,必须要在荫蔽度较高且常年有水分的石壁上才能生长。物种分布模型(SDMs),又称生态位模型,是根据物种的分布信息和相应的环境变量信息,通过特定的算法计算出两者之间的关系,从而将这种关系应用于所研究的地理区域,并对物种可能的生态位进行估计[4-5]。目前,物种分布模型已经被广泛用于外来生物的入侵机制研究[6-7],珍稀濒危植物保护[8-10],生物多样性监测[11-13]等领域。DIVA-GIS是国际马铃薯中心(CIP)开发的一款结合地理信息系统和物种分布数据处理的软件,兼具绘图功能,操作简便,其整合的BIOCLIM模型和DOMAIN模型已经被广泛用于预测物种的潜在分布区[14-15]。本研究利用该软件分析蛛网萼的分布格局,并预测其在气候变化条件下可能的分布区,丰富蛛网萼的生物地理学研究内容,为其保护工作提供依据。

  • 蛛网萼实际地理分布点通过查阅标本信息、相关文献和实地调查获得。标本信息通过中国数字植物标本馆(CVH,http://www.cvh.ac.cn/),教学标本资源共享平台(MNH,http://mnh.scu.edu.cn/)和全球生物多样性信息网络(GBIF,https://www.gbif.org/)筛选。同时查阅相关文献[16-17],将每份标本的地理位置尽量精确到乡镇及以下区域,排除重复记录和模糊记录,去除引种记录,利用百度地图拾取坐标系统(http://api.map.baidu.com/lbsapi/getpoint/index.html)析出每份标本的精确坐标,并结合Google Earth确认,最终获得蛛网萼80个精确的有效实际地理分布点。由于用于预测的空间插值气候数据精度为2.5',所以为了消除误差,在做分布区预测时每个2.5'×2.5'的网格只取1条有效记录。

  • 气候数据来源于世界气候数据库(WorldClim,http://www.worldclim.org/)。目前的气候数据是根据1950-2000年世界各地的气象站观测信息,利用空间插值法生成的全球气候数据,空间分辨率为2.5';未来气候数据是由美国国家大气研究中心(NCAR)研发的全球大气环流谱模式CCM3模型,在二氧化碳倍增情境下模拟的2100年气候数据[18],空间分辨率为2.5'。数据内包含的19个气候环境变量用作预测物种分布的主要变量,包括年平均气温(BIO1),昼夜温差月平均值(BIO2),等温性(BIO3),温度季节性变化(BIO4),最暖月最高气温(BIO5),最冷月最低气温(BIO6),气温年较差(BIO7),最湿季平均气温(BIO8),最干季平均气温(BIO9),最暖季平均气温(BIO10),最冷季平均气温(BIO11),年降水量(BIO12),最湿月降水量(BIO13),最干月降水量(BIO14),降水量季节性变化(BIO15),最湿季降水量(BIO16),最干季降水量(BIO17),最暖季降水量(BIO18),最冷季降水量(BIO19)。世界各国地图数据来源于DIVA-GIS官方网站(http://www.diva-gis.org/)。

  • 将蛛网萼的精确坐标导入DIVA-GIS 7.5.0软件包,1个分布点代表 1个蛛网萼群落,利用Analysis-Point to Grid-Richness功能,统计每个1°×1°网格内出现的蛛网萼群落的数量。利用其内置的Design功能绘制多度分析图。

  • 利用DIVA-GIS软件包的Data-Extract Values by Points-From Climate Data功能,提取蛛网萼分布点的19个气候因子数据,将所有80个分布点按纬度分为3个样本较为均匀的梯度,分别为33.50°~36.00°,28.00°~33.50°和26.50°~28.00°,对其气候数据进行方差分析;将气候数据导入PAST 3.16(http://folk.uio.no/ohammer/past/)软件,通过Multivariate-Ordination-Principal components(PCA)功能对其进行主成分分析,得出影响蛛网萼分布的主要气候因子。

  • BIOCLIM模型利用已知的物种分布信息和环境信息,确定物种分布所需的环境变化范围,只要在这个范围的区域就认为是适合物种存在的[19]。DOMAIN模型则是利用Gower算法,生成分布点和分布点之间的相似矩阵,通过矩阵计算目标点上的环境变量的适宜程度,从而确定物种的分布范围[20]。BIOCLIM模型和DOMAIN模型的操作通过DIVA-GIS软件实现。将蛛网萼精确坐标处理成CSV格式,导入DIVA-GIS,然后在Tools-Options选项卡中将气候数据导入,在Modeling-Bioclim/Domain-Precdict选项卡中实现物种分布预测。

  • 受试者工作特征曲线(ROC,receiver operating characteristic curve)被广泛用于各种物种分布模型的精度检验[21-22],ROC曲线下的面积即为AUC值(area under curve),AUC值的取值范围为[0.5~1.0],值越大代表模型预测结果越可信,因其不受阈值影响,是目前公认的评价物种分布模型预测结果的最优方法之一[23]。具体操作方法为:在Modeling-Evaluation模块中,将随机取样获得的物种分布点的75%作为训练子集(sample size training data),剩余的25%作为测试子集(sample size test data),训练子集用于训练模型,测试子集用于验证模型,重复3次(表 1)。

    序号分布点纬度/(°)经度/(°)
    1中国浙江30.32119.43
    2中国浙江29.48119.53
    3中国江西28.63117.68
    4中国江西28.58117.64
    5中国浙江28.42121.26
    6中国浙江28.37121.11
    7中国浙江28.37121.07
    8中国浙江28.37121.10
    9中国浙江28.37121.10
    10中国浙江28.36121.06
    11中国浙江28.20118.91
    12中国浙江28.18118.91
    13中国江西28.10118.12
    14中国浙江28.06119.77
    15中国浙江28.03121.00
    16中国浙江28.03119.51
    17中国福建28.00118.17
    18中国江西27.99117.04
    19中国浙江27.94119.18
    20中国江西27.94117.38
    21中国江西27.94117.68
    22中国福建27.94117.85
    23中国江西27.93117.37
    24中国浙江27.93119.22
    25中国江西27.91117.35
    26中国江西27.91117.26
    27中国江西27.90117.33
    28中国浙江27.89119.19
    29中国浙江27.85119.15
    30中国江西27.80117.22
    31中国江西27.80117.50
    32中国福建27.76117.58
    33中国浙江27.76119.21
    34中国江西27.75117.19
    35中国福建27.73117.72
    36中国福建27.73117.78
    37中国浙江27.69119.14
    38中国福建27.63117.90
    39中国福建27.45118.02
    40中国浙江27.05119.15
    41中国江西26.51114.17
    42日本九州32.82131.37
    43日本九州32.57131.10
    44日本九州31.43131.27
    45日本四国32.72131.18
    46日本四国33.55133.52
    47日本四国33.58133.17
    48日本本州33.72135.98
    49日本本州34.98137.78
    50日本本州35.10137.82
    51日本九州32.11131.40
    52日本九州35.43136.78
    53日本本州33.65135.67
    54日本四国33.67133.83
    55日本本州36.00138.00
    56日本九州32.10130.88
    57日本九州31.72131.37
    58日本九州33.20129.95
    59日本九州31.74131.37
    60日本本州35.65139.27
    61日本本州35.67139.32
    62日本本州35.02137.84
    63日本本州33.63135.94
    64日本九州33.35131.19
    65日本本州34.41135.80
    66日本四国33.56133.12
    67日本四国33.52133.06
    68日本四国33.17132.63
    69日本四国33.53133.21
    70日本四国33.80133.97
    71日本四国33.73134.04
    72日本四国33.48133.08
    73日本四国33.65133.24
    74日本四国33.53133.06
    75日本四国33.81133.44
    76日本四国33.51133.24
    77日本四国33.74133.94
    78日本四国33.70133.36
    79日本四国33.45133.21
    80日本四国33.81133.97

    Table 1.  Distribution records of Platycrater arguta

  • 多度分析结果表明:蛛网萼在中国的分布点主要集中在江西、浙江、福建3个省份,在江西与福建交界的武夷山脉一带分布尤为集中;而在日本,九州、本州、四国均有分布,其中在四国高知一带分布较为集中。结合当地的地理情况,可知蛛网萼的生长环境是需要一定海拔的。

  • 表 2可知:各气候因子之间的差异性不大,可知气候因子对蛛网萼分布的影响与纬度的关系不大;而主成分分析表明,第1主成分的方差贡献率为95%以上,可以代表蛛网萼分布点的主要气候变量信息(表 3)。从表 4可知:第1主成分中年降水量(BIO12),最湿季降水量(BIO16)和最暖季降水量(BIO18)的载荷值较高,可将其定义为“水分因子”。由此可见,水分是对蛛网萼分布影响较为显著的气候限制因子。

    气候指标33.50°~36.00°N28.00°~33.50°N26.50°~28.00°N
    平均值±标准差最小值最大值平均值±标准差最小值最大值平均值±标准差最小值最大值
    BIO113.19 ± 2.21 b8.6216.7815.07 ± 2.45 a8.9217.5115.28 ± 1.73 a11.7218.25
    BIO28.15 ± 1.05 a6.7510.657.82 ± 1.016.369.637.64 ± 0.49 a6.418.73
    BIO327.14 ± 1.94 a23.8429.9226.8 ± 2.78 a23.2932.0027.25 ± 1.20 a23.7329.88
    BIO4795.69 ± 37.84 a723.60914.83780.63 ± 38.96 a694.42877.20739.66 ± 30.86 b674.42799.19
    BIO528.03 ± 2.35 a22.7032.1029.37 ± 2.62 a22.5033.2028.85 ± 2.17 a24.4032.50
    BIO6-1.89 ± 2.54 b-8.202.800.23 ± 2.55 a-5.703.700.81 ± 1.45 a-2.004.70
    BIO729.92 ± 1.93 a27.0035.6029.14 ± 1.43 a27.3032.5028.04 ± 1.11 b26.2030.00
    BIO821.25 ± 2.25 ab17.8725.6322.28 ± 2.63 a17.4526.0719.83 ± 1.98 b17.6727.18
    BIO94.09 ± 2.66 b-1.687.937.43 ± 2.71 a1.2512.908.51 ± 2.85 a4.6814.55
    BIO1023.02 ± 2.05 b18.5526.2324.54 ± 2.36 a18.4827.3324.03 ± 1.97 ab19.9027.42
    BIO113.45 ± 2.53 b-1.687.935.34 ± 2.62 a-1.138.975.86 ± 1.48 a2.928.97
    BIO122 207.15 ± 402.63 a1 420.003 254.002 159.81 ± 553.20 a1 453.003 424.001 979.33 ± 136.29 a1 611.002 131.00
    BIO13325.08 ± 57.21 a203.00442.00355.15 ± 114.36 a222.00623.00326.89 ± 29.50 a221.00353.00
    BIO1460.77 ± 15.04 a43.00101.0059.96 ± 15.48 a38.0098.0048.96 ± 3.38 b40.0052.00
    BIO1550.19 ± 3.38 b42.7153.3955.34 ± 5.22 a48.4364.0057.18 ± 4.82 a49.5966.77
    BIO16859.19 ± 137.88 a562.001 156.00925.19 ± 301.14 a568.001 622.00876.33 ± 94.39 a587.00958.00
    BIO17221.77 ± 42.88 a142.00327.00216.48 ± 44.17 a163.00331.00186.59 ± 9.36 b163.00197.00
    BIO18801.96 ± 134.29 a550.001 137.00803.89 ± 253.23 a486.001 384.00686.52 ± 63.26 b533.00798.00
    BIO19222.69 ± 42.86 a142.00327.00236.41 ± 42.39 a185.00348.00240.22 ± 19.22 a184.00259.00
    说明:同行两两之间若有1个相同字母则代表差异性不显著(P>0.05),反之则代表差异显著(P<0.05)

    Table 2.  Climatic indexes of Platycrater arguta

    主成分特征值方差贡献率/%累积方差贡献率/%
    PC1238 016.0095.414 095.414 0
    PC26 891.522.762 698.176 6
    PC32 676.091.072 899.249 4

    Table 3.  Contribution of variance of first three principal compenent

    气候因子PC1
    BIO1-0.001 630 0
    BIO2-0.000 110 0
    BIO30.000 444 0
    BIO4-0.022 710 0
    BIO5-0.002 220 0
    BIO6-0.001 390 0
    BIO7-0.000 830 0
    BIO8-0.000 180 0
    BIO9-0.002 300 0
    BIO10-0.001 760 0
    BIO11-0.001 310 0
    BIO120.837 050 0
    BIO130.147 850 0
    BIO140.023 403 0
    BIO150.002 295 0
    BIO160.380 960 0
    BIO170.072 615 0
    BIO180.349 890 0
    BIO190.059 784 0

    Table 4.  Loadings of first principal compenent relative to 19 environmental variable

  • BIOCLIM模型对蛛网萼当下分布区的预测结果表明:目前适宜蛛网萼生存的区域除了已知的武夷山一带、雁荡山一带,在桂林、吉安和黄山一带也有较高的分布可能性。日本的尾鹫一带、长门一带、四国整体以及九州北部均有较高的潜在分布可能性。韩国济州也有极高的分布可能。DOMAIN模型对当下的预测表明蛛网萼的潜在最适区分布在建德和长沙等地,而在日本的潜在最适分布区则与目前已知的分布区域无甚差异。

    在二氧化碳倍增的未来气候背景下,BIOCLIM模型对蛛网萼的预测显示其最适分布区逐步向东南方向偏移,主要在云和、丽水一带,并且日本的最适分布区整体向东迁移,集中在四万十市和和歌山;DOMAIN模型则表示未来蛛网萼的分布区与当下相比有一定的缩小。

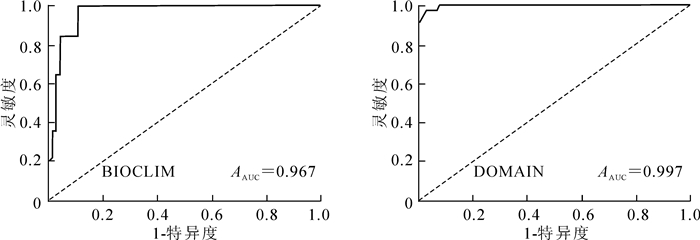
  • 以1-特异度为横坐标,灵敏度为纵坐标绘制ROC曲线,结果如图 1所示。BIOCLIM模型的ROC检验结果显示其AUC值为0.967,DOMAIN模型的AUC值则为0.997,均显著高于随机测试AUC(0.500),说明这2种模型预测的结果都是较为可信的。

    Figure 1.  ROC curve based on the predict of BIOCLIM and DOMAIN models

  • 蛛网萼繁育系统为兼性异交类型与专性异交类型且需要传粉者[24],其繁殖策略是产生大量的小种子用来占据更多适宜的生活位。但张丽芳等[25]的研究发现:蛛网萼种子的发芽条件极其苛刻,导致其发芽率低下。同时我们在野外观察发现蛛网萼的生境要求非常严格,必须在常年有水的石壁附近才能生长,且其种群自我更新绝大部分是以根蘖的形式,极难见到实生苗。这导致了蛛网萼种群遗传多样性的缺失,加之人为等因素使其生境破碎化,蛛网萼种群很难进行大面积的扩张,这也是其种群数量有限的原因之一。生境要求的苛刻,加之自我更新能力有限,推测是导致其如今极其狭窄的分布格局的部分原因。

    一般来说,气候因素是决定物种大尺度空间分布的主要因素[26],气候的变化往往会影响物种的分布格局。朱弘等[27]对浙闽樱桃Cerasus schneideriana分布相关的气候因子做主成分分析,得出年降水量和夏季降水量是影响其分布的主要气候因子。王娟等[13]研究了5种锦鸡儿属Caragana的植物分布与15个气候指标之间的关系,得出年降水量、湿润指数等对其中2种锦鸡儿属植物的地理分布有重要影响。以上结果均表明,水分对植物的地理分布有不可忽视的作用。本研究通过差异性分析和主成分分析法分析了与蛛网萼相关的19个气候因子,结果显示:19个气候因子之间的差异并不是很大,表明纬度对于蛛网萼的地理分布影响不大;在足以代表 19个气候变量信息的第1主成分中,年降水量的载荷值最高,结合实地对其生境的调查,可知该气候变量对蛛网萼的地理分布影响较大。可推测蛛网萼分布格局与水分的关系较为密切。

    基于当下气候数据的预测结果表明:蛛网萼的分布需要一定海拔,除了已知的分布带以外,中国广西湖南交界、湖南江西交界、湖南西北部以及韩国济州一带都是适生区。目前,蛛网萼的标本信息都较陈旧,缺乏分布信息的更新,而模型预测结果显示江西湖南交界的北部以及湖南广西交界处存在蛛网萼的可能性较大,可作为野外调查的重点区域。由于算法的不同[19-20],2种模型预测出的结果不尽相同,但高度适生区都显示出破碎化,反映出蛛网萼的生存现状已经极其恶劣。BIOCLIM模型中对于蛛网萼中低度适生区的预测集中在赣湘交界和赣浙皖交界区,因为算法的原因,DOMAIN模型对于蛛网萼中低度适生区的预测较为连续,且DOMAIN模型的结果基本覆盖了BIOCLIM模型的结果,两者的预测结果较为接近;2种结果均表明蛛网萼的中低度适生区范围较大,一定程度上反应了这些地区的生境有成为蛛网萼生活区的潜力。陶晓瑜[17]对蛛网萼的群体遗传结构研究表明,蛛网萼的种群之间有一定程度的分化,在保护其遗传多样性的前提下,就地保护的措施是较为妥当的。

    在未来气候背景的预测结果中,2种模型均显示蛛网萼的适生区有明显的缩小,且高度适生区有向东部高海拔地区迁移的趋势,这与曹福祥等[28]的报道中提到的全球变暖环境下物种向高海拔地区迁移的结论一致。对于中低度适生区的预测,2种模型均显示有向西迁移的趋势。邵慧等[29]研究表明:BIOCLIM模型用于狭域分布型的物种预测具有较高的模拟准确度;而张琴等[30]对天麻Gastrodia elata的研究表明:对于广布型物种的预测,DOMAIN模型比BIOCLIM模型表现更为出色。尽管两者对不同分布型物种的预测结果不一致,但在本研究中,两者对于蛛网萼的分布区迁移趋势预测基本一致。根据本研究结果,建议对蛛网萼可能的分布区域开展专项调查,以完善其地理分布与资源信息;在做好已有资源保护的同时,加强对浙江东部和福建北部潜在分布地区的生态保护,为其分布扩散提供有利条件。

Reference (30)

Catalog

    /

    DownLoad:  Full-Size Img  PowerPoint
    Return
    Return