


-
湿地为全球三大生态系统之一,因其稳定环境、保护物种基因和提供资源等功能而被称为“地球之肾”“生物基因库”和“人类摇篮”[1]。湿地植被作为湿地的重要组成部分,在湿地生态系统中发挥着促淤、净化水环境、为鸟类和鱼类提供食物等关键性作用[2],其分布状况反映出湿地的水质、土壤等分布特征和健康信息[2]。杭州湾是中国滨海湿地的南北分界线,物种、群落和生境多样性丰富,代表了中北亚热带过渡湿地类型的动植物区系[3]。因此,详细了解和掌握该区湿地植被的分布状况有助于正确认识并发挥湿地的资源优势和生态屏障作用,同时,也可为湿地植被恢复技术和区域生物多样性及其形成机制研究提供数据支持。传统的实地调查方法耗时费力、更新速度慢且无法实现大范围动态监测。基于遥感技术提取湿地植被信息逐渐成为湿地研究的热点。在遥感分类方法方面,面向对象、支持向量机、决策树模型、神经网络等方法被广泛应用,如WANG等[4]通过北京1号小卫星数据提取时间序列归一化植被指数(normalized difference vegetation index, NDVI)和植被水分指数(vegetation-water index, VWI),采用可支持向量机(support vector machine, SVM)实现了鄱阳湖湿地植被功能型分类。在湿地植被的提取结果方面,植被划分大多不精细或是只提取单一植被类型,如张雪红[5]基于Landsat-8数据构建决策树模型,有效提取出红树林的分布信息。近年来,随着高分辨率和高光谱影像普及,越来越多高质量的遥感影像被用于湿地植被信息提取,如DECHKA等[6]基于IKONOS影像进行纹理特征和NDVI分析,通过线性判别和无监督ISODATA算法获取湿地植被群落信息。徐菲楠等[7]基于QuickBird影像,利用地物光谱、植被指数、纹理特征通过模糊分类法提取额济纳绿洲的主要植被覆盖类型。李明泽等[8]基于高光谱数据用光谱角制图(spectral angle mapping, SAM)方法得到扎龙湿地的6种典型植被分布状况。ZHANG等[9]利用面向对象方法分析Hyperion数据并经过机器学习分类,识别出南佛罗里达州Kissimmee河谷湿地的14种植被群落。总体来看,随着遥感数据日益多样化,湿地植被提取研究日趋深化,研究方法逐渐由基于像元向面向对象转变、植被分类提取也更加精细。高分辨率影像与面向对象分析方法结合不仅在较大程度上解决了基于像元的传统方法难以克服的光谱混淆、混合像元等问题,而且能充分挖掘影像的纹理与形状信息,有利于提高分类精度[10-12]。而随机森林算法是基于决策树的新型机器学习算法,因其分类精度优、运算速度快和算法稳定等特点而被广泛应用[13-14]。目前,基于高分影像将2种方法结合应用到滨海湿地植被分类上的研究鲜有报道。本研究以杭州湾南岸QuickBird影像和野外调查数据为数据源,在QuickBird影像最优分割尺度的基础上将面向对象分析与随机森林模型相结合,高精度地提取湿地植被信息。
HTML
-
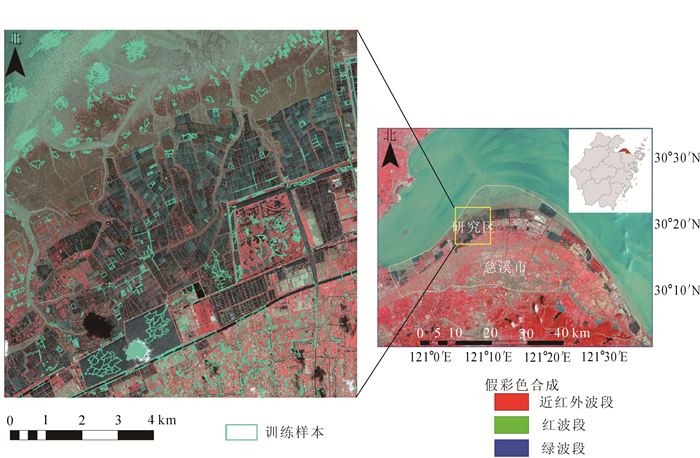
杭州湾滨海湿地类型以浅海水域和潮间淤泥海滩为主。研究区(30°16'32.98"N ~30°21'59.99"N,121°4'36.91"E~121°10'52.05"E)是杭州湾南岸滩涂淤涨最快的区段之一,也是围垦利用最为突出的区段之一。该区域湿地具有调节气候、净化环境、调蓄洪水、保护海岸线和维护生物多样性等多种生态功能[15](图 1)。研究区主要土地利用类型有耕地、水体、不透水地表、田埂等;湿地植被主要有芦苇Phragmites communis,海三棱藨草Scirpus mariqueter,互花米草Spartina alterniflora,南方碱蓬Suaeda australis等[16]。

Figure 1. Location of the study area
-
遥感数据为2013年9月4日9:29的QuickBird影像,云量为0.7%,为退潮时刻,潮高仅145 cm,空间分辨率高(全色波段0.6 m)。由于遥感数据获取时存在误差,对所采用的影像进行辐射校正,主要是辐射定标和大气校正,来消除依附于辐射亮度的各种失真。为增强图像分辨率,选用Gram-schmidt方法对全色波段与多光谱波段进行了融合,较好地保持影像的纹理和光谱信息。
-
通过野外实地考察,建立影像判读标志,运用目视解译方法在最优分割结果的图像上,随机选择对象作为训练样本。为便于植被信息提取,结合中国科学院土地利用遥感监测分类系统[17],将研究区土地覆盖分为芦苇、海三棱藨草、互花米草、南方碱蓬、人工植被、光滩、耕地、水体、不透水地表、田埂、其他等共11类地物,各地物样本个数分别为56,82,15,8,71,188,143,555,76,29,13个。
-
在图像预处理的基础上,借助eCognition Developer 8.9软件对QuickBird影像进行分割,对比自上而下的棋盘分割和四叉树分割易产生正方形对象,选用符合实际且被广泛应用的多尺度分割。多尺度分割算法是一种自下而上的分割算法,从单个像元开始向上逐渐合并成较大的对象,直到满足所设置的异质性阈值为止。异质性阈值是由用户设定以衡量形状/颜色和紧致度/平滑度的权重参数。考虑到光谱在植被信息提取中重要作用以及紧致度的不敏感性,定义形状颜色权重参数分别为0.1和0.9,紧致度和平滑度均为0.5,分割尺度的范围为[20, 200],并以步长10进行多次分割。对19次的多尺度分割的结果分别计算并导出每个对象的光谱均值、方差及面积,便于下一步评价最优分割尺度。
-
目前评价最优尺度的方法主要有3种:一是凭借经验,这种方法具有一定的主观性;二是选取尺度鉴别指标,但往往会强调某个因素的作用;三是构建最优分割尺度计算模型,这种方法是从对象内的同质性和对象间的异质性来判断分割的质量,是一种全局最优判断方法[18]。故本研究根据JOHNSON等[19]研究理论,利用近红外、红、绿3个波段对研究区QuickBird影像多尺度分割的结果进行定量化计算,得到度量对象内差异性的加权方差(weighted variance, wVar)和度量对象间整体相似度的全局Moran指数(Moran’s index, MI),全局评分(global score, GS)以及平均全局评分(average global score, AGS)。JOHNSON等[19]证明了平均全局评分最低的分割尺度是加权方差和空间自相关的最低组合,可被定义为最优分割尺度。
-
光谱、纹理、形状、位置等特征值是区分不同地物的重要变量。通过eCognition Developer 8.9导出最优分割尺度下对象层中每个对象的各类特征值变量(表 1~2),组成一个数据集。光谱特征是遥感图像分类的最主要特征,除利用对象的各个波段均值和标准差这2个变量以外,还考虑近红外和红外波段是植被光谱特征的敏感波段,蓝、绿和红波段在提取水体上具有较好的效果,故在滨海湿地植被分类中多基于上述波段构建特征变量,如归一化植被指数(NDVI)[20],归一化差值湿度指数(NDWI)[21],比值植被指数(RVI)[22]和土壤调整植被指数(SAVI)等[23-24]。纹理提取的方法主要有基于统计描述、基于小波变换、基于应用分形理论以及基于地统计学4种方法[25]。其中,基于统计描述的灰度共生矩阵(grey-level co-occurrence matrix,GLCM)被证明在植被分类中发挥着重要作用[26-27]。故选取灰度共生矩阵算法来提取对象的纹理信息。几何属性主要描述对象的形状和大小,研究区内覆盖着大量几何特征较规则的水产养殖塘和耕地,提取几何特征变量将有助于分类精度的提高。位置属性是指对象的中心点坐标以及到图像边框的距离,研究区内的地物类型大多与海岸线的位置相关,故提取对象的位置信息。
特征变量 特征名 详细描述 光谱 对象的值[i] 在某个图像层中的每个对象的平均值,计算出包含在对象中的所有像素的平均值 标准方差[i] 在特定图像层中的每个对象的标准方差[i],计算来自对象中包含的所有像素的值 纹理 中值[i] 灰度共生矩阵的3个特征参数,计算对于每个对象,从一个像素出发逐个地计算包括其周围的像素,直到整个对象计算完毕 标准方差[i] 同质化[i] 几何 面积 与实际地理坐标相关连,对象面积为实际面积,一个像素所代表面积乘以像素个数 长度 每个对象外包矩形的长度 宽度 每个对象外包矩形的宽度 长宽比 每个对象外包矩形的长宽比 形状 边界指数 对象的真实周长与该对象最小包围矩形的周长之比,对象形状越不规则,该特征越大 形状指数 对象边长与对象面积开4次方的比值,用来表示对象边界的光滑性 圆度 对象最小外包椭圆与最大内包椭圆的半径之差 最长边长度 多边形最长边 位置 坐标中心点(X,Y) 对象X,Y坐标中心点 位置 计算了X坐标到左边框的距离和Y坐标到上边框的距离 Table 1. Spectral, shape and texture features of the object
指数类型 简称 计算公式 植被指数 NDVI[20] (ρNIR-ρR)/(ρNIR+ρR) RVI[22] ρNIR-ρR SAVI[23-24] 1.5×(ρNIR-ρR)/(ρNIR+ρR+0.5) OSAVI[28] (ρNIR-ρR)/(ρNIR+ρR+0.6) VARIgreen[29] (ρG-ρR)/(ρG+ρR-ρB) NGRDI[30] (ρG-ρR)/(ρG+ρR) 水体相关 NDWI[21] (ρG-ρNIR)/(ρG+ρNIR) 建筑相关 BAI (ρB-ρNIR)/(ρB+ρNIR) 阴影相关 SI (ρR+ρG+ρB+ρNIR)/4 说明:ρNIR,ρR,ρG,ρB分别指近红外光、红光、绿光和蓝光波段的反射率 Table 2. Object of a variety of index instructions
-
随机森林模型是基于决策树的新型机器学习算法。先从原始数据集中有放回地抽取N个新训练集,抽取数量约为原始数据集的2/3,并在新训练集中随机抽取K个属性生产决策树。最后,集合N棵决策树的预测结果,采用投票的方式决定新样本的类别,利用每次抽样未被抽到的1/3数据可估计内部误差[31]。在许多机器学习算法中,随机森林具有以下3个特点和优势:一是分类表现优异,能在未做特征选取和删除的条件下处理大数据;二是人工干预很少,通常不需要做数据预处理,能根据数据自行确定所用特征;三是运算速度快,易于做并行化处理。将最优分割尺度下提取的数据集和准备好的样本对象在WEKA(Waikato environment for knowledge analysis)[32]软件中进行基于随机森林模型分类。张晓羽等[33]研究证明:随机森林参数设置对分类精度影响不敏感,故本研究使用默认参数建立随机森林模型。
-
在ArcMap10.2中对每种类型分层创建至少30个随机点并在原始QuickBird图像上目视解译生成420个验证点。将验证结果与分类结果对比分析,由此得出混淆矩阵,并计算出制图精度、用户精度、总体精度和Kappa系数来评价此分类方法在滨海湿地植被分类中的精度。
2.1. 数据
2.1.1. 数据来源与预处理
2.1.2. 样本数据
2.2. 面向对象分析
2.2.1. 图像分割
2.2.2. 最优分割尺度计算模型
2.3. 对象特征变量提取
2.4. 随机森林算法分类
2.5. 精度验证
-
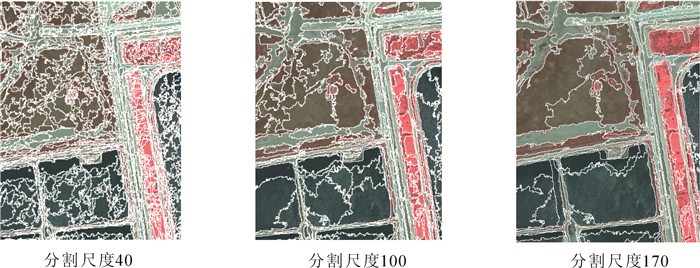
从图 2可以看出:同一区域,随着分割尺度的增大,分割的对象数量越来越少,而对象的数量直接影响运算速度和分类精度。当分割尺度太低时,对象数量大幅度增加,运算的速度将大大减慢。相反,当分割尺度太高时,对象数量减少,易造成不同地物分割为一个对象,从而降低分类精度。因此,对多尺度分割结果进行定量评价,找到最优分割尺度尤为重要。

Figure 2. Comparison of the segmentation results of different scales in the study area
-
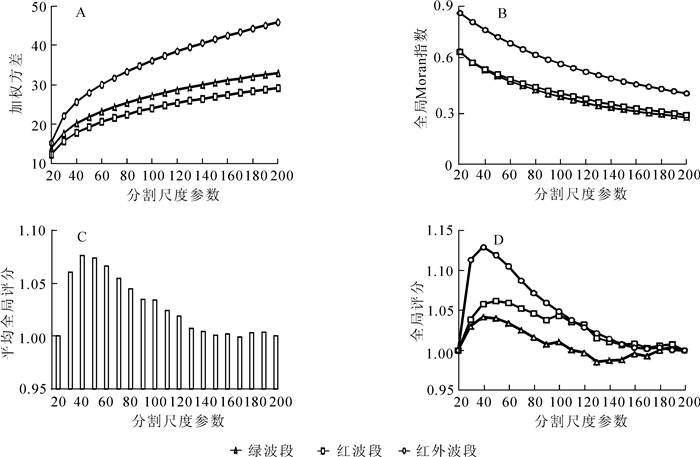
从图 3A和图 3B可知:随着分割尺度的增加,加权方差愈来愈大而全局Moran指数呈递减趋势。这说明随着分割尺度的不断增大,对象内部将增加更多不相似的像素(即对象内的同质性愈小),而对象间的差异性越来越显著(即对象间的异质性愈大)。在这种异质性更大的情况下,随着分割尺度的增加,方差将继续增加,全局Moran指数将继续减小,直到对象变得足够大以至于包含许多不同土地覆盖类型。比较所有多尺度分割的平均全局评分(图 3C)可知,分割尺度为170的图像层具有最低的平均全局评分(0.999 2)。此图像层在红波段和近红外的全局评分也较低(图 3D)。结果表明:分割尺度为170时,对象内部最均匀的同时,相邻对象的差异性最大,符合被广泛接受的最优分割尺度选择原则,所以170为研究区最优分割尺度。

Figure 3. Weighted variance(A), Moran's index(B), average global scores(C) and global scores values(D) for all single-scale segmentations
-
在170分割尺度的图像层上将QuickBird影像的光谱、纹理、形状、位置等信息融合成数据集后进行随机森林分类,最终根据分类系统将研究区内的地物类型分成5类滨海湿地植被和6类土地利用类型(图 4)。在整个研究区内分层随机选取420个点验证得到混淆矩阵和精度评价结果,从表 3中可以看出:分类总体精度为86.90%,Kappa系数为0.85。就滨海湿地植被而言,海三棱藨草的制图精度最高,达到100%,分类结果最好,芦苇次之。制图精度较差的为南方碱蓬和互花米草,其中南方碱蓬的精度只有63.33%。这主要是由于南方碱蓬大多分布在田埂或水体旁,不易与田埂、水体及光滩区分。5类滨海湿地植被的用户精度均达到85.00%以上。由此可以看出,在面向对象分析的基础上对滨海湿地植被进行随机森林模型分类的方法是可行的。

Figure 4. Results of classification
土地利用类型 芦苇 海三棱薦草 互花米草 南方碱蓬 人工植被 耕地 水体 不透水地表 光滩 田埂 其他 制图精度/% 用户精度/% 芦苇 57 0 0 0 0 3 0 0 0 0 0 95.00 93.44 海三棱薦草 0 30 0 0 0 0 0 0 0 0 0 100.00 90.91 互花米草 1 1 23 3 0 1 0 0 0 0 1 76.67 100.00 南方碱蓬 0 1 0 19 0 3 1 1 3 2 0 63.33 86.36 人工植被 3 0 0 0 80 2 1 0 0 1 3 88.89 96.39 耕地 0 0 0 0 2 28 0 0 0 0 0 93.33 65.12 水体 0 0 0 0 0 0 29 1 0 0 0 96.67 82.86 不透水地表 0 0 0 0 0 4 0 22 1 2 1 73.33 88.00 光滩 0 1 0 0 0 0 2 0 27 0 0 90.00 79.41 田埂 0 0 0 0 0 0 2 1 3 23 1 76.67 82.14 其他 0 0 0 0 1 2 0 0 0 0 27 90.00 81.82 总计 61 33 23 22 83 43 35 25 34 28 33 总体精度为86.90%,Kappa系数为0.85 Table 3. Error matrix and accuracy assessment for object-based classification based on the classification tree
3.1. 多尺度分割结果
3.2. 最优分割尺度选择
3.3. 图像分类及精度评价

-
在面向对象分类中,图像分割是基础步骤,分割质量的好坏直接影响着分类精度的高低,因此评价图像分割的质量在面向对象分析中起到至关重要的作用。本研究在最优分割尺度选择时采用JOHNSON等[19]提出的平均全局评分。这一指标综合考虑了各个波段的对象内的同质性和对象间的异质性,能够有效地克服主观性而达到客观、定量评价的目的。JOHNSON等[19]得出的最优分割尺度为70,研究区大小为150 m×150 m的市区;而本研究得出最优的分割尺度为170,研究区面积扩大近万倍、地物类型较多且植被较复杂的滨海湿地地区。可见,最优分割尺度会随研究区域的土地覆盖特点不同而产生明显变化。因此,在面向对象分类过程中,快速定量确定最优的图像分割尺度是十分必要的。本研究的分类结果也说明了用平均全局评分法定量确定图像分割尺度是高效的,对高分辨率遥感影像进行影像分割评价具有借鉴意义。
-
为了充分利用高分辨率遥感数据的信息,基于最优分割尺度的对象层采取了多种特征数据融合,用于随机森林模型分类。数据融合时提取对象的特征共有53个,包括21个光谱特征、17个纹理、4个几何、4个形状、4个位置。这53个特征参数均作为变量参与随机森林模型分类,充分挖掘和利用了原始图像的信息,有效地提高湿地植被分类的精度。井然等[11]利用航片影像一系列植被指数建立决策树对公园人工湿地植被分类,总体精度达到91.7%;乔婷等[34]应用SPOT-5结合隶属度和阈值提取东洞庭湖湿地植被信息,总体精度为87.69%。虽然这些研究都是运用的面向对象分析方法,但是分类方法与过程有很大的差异。本研究所采用的多种特征参与的随机森林分类方法提取滨海湿地植被,在研究区内分类类型多且地类混杂的情况下分类精度不低。这种将多特征融合与随机森林模型结合的面向对象分类方法适于高分辨遥感数据的滨海湿地植被分类。
耕地的用户精度较低,主要有2个原因:一是研究区内耕地上主要种植的是玉米Zea mays,蔬菜等农作物,这些作物的光谱特征和芦苇、南方碱蓬、人工植被在原始波段的蓝、绿波段光谱特征相似,分类时导致耕地易与芦苇、南方碱蓬、人工植被混淆;二是研究所用遥感图像拍摄于9月,恰好是一部分农作物收割的时候,所以其裸露地表和不透水地表不易区分。应加强位置特征的比例或数量,因为耕地集中分布于研究区东南部,与位于围垦区芦苇和南方碱蓬具有显著的位置差异。对于互花米草、南方碱蓬制图精度不够理想的问题,可能因其分布面积过小,选取的训练样本偏少造成,可以考虑增加训练样本数量。
-
研究区内典型的滨海湿地植被有海三棱藨草、芦苇、互花米草、南方碱蓬4类。海三棱藨草主要集中分布于潮间带,呈与海平面平行的条带状,面积为38.13 km2,分别占全区总面积的13.61%和湿地植被总面积的47.94%,为研究区面积最大的湿地植被。研究区域的滩涂是由杭州湾南岸海涂快速淤积而新生的盐沼湿地,处于自然状态,受人为影响较小,为海三棱藨草的发育和繁衍提供了良好的栖息环境。湿地植被中芦苇主要分布在离海岸较近的围垦区域,面积较大为16.93 km2,占湿地植被总面积的21.29%,仅次于海三棱藨草,其中杭州湾湿地公园有较大面积的芦苇。这一区域滩涂利用以水产养殖为主,土壤盐度下降,适宜芦苇大面积生长。南方碱蓬主要分布在田埂上或道路两旁,面积仅为11.95 km2,占湿地植被总面积的15.03%。而互花米草则零星分布且面积较小。
滨海湿地植被随着离海岸线距离远近依次呈现海三棱藨草-互花米草-芦苇-人工植被的空间分布特点,反映了人们利用滨海滩涂时,所引起的生态环境变化对植被分布的影响。海三棱藨草主要分布在新生滩涂形成的潮间带,土壤含盐量和含水量较高,它作为先锋物种,具有促淤和防浪的功能,这对滩涂生态环境的改造具有重要作用。互花米草紧随着海三棱藨草出现,显示了滩涂的抬升使土壤含盐量和含水量发生了变化。但由于近年来人类把互花米草作为入侵物种进行治理,研究区内互花米草的面积较少。随着向内陆延伸,芦苇面积逐渐增加,并伴随有南方碱蓬出现。人工植被的出现反映人类开始对湿地进行干预,改变植被的自然演替格局。这说明滩涂随着自然演变与人为开发利用,滨海湿地生态环境发生较大变化,湿地生态环境在空间的分异引起了适生植被在空间分布上的差异。由此,我们可以根据滨海湿地植被的分布特征推断其生长环境特征,达到对湿地生态环境监测和保护的目的。
4.1. 图像分割尺度对分类的影响
4.2. 随机森林模型对分类结果精度的影响
4.3. 滨海湿地植被分布特征
-
以QuickBird数据和野外考察数据为数据源,运用面向对象的思想,综合图像最优分割、特征融合以及随机森林模型分类方法,对杭州湾南岸部分区域的滨海湿地植被进行了分类与精度评价,得出以下结论:①运用全局最优评分法是获得图像最优分割尺度的客观高效的方法,对提高分类精度具有重要作用。②综合运用面向对象的特征融合、随机森林算法等方法,对高分辨率遥感影像,能有效精确提取湿地植被。③植被的空间分布反映了滨海湿地的开发利用程度、生态环境特征和健康状况,故可将滨海植被在海岸带的空间分布图作为评价滨海湿地的生态环境的重要信息。
 DownLoad: