Volume 37 Issue 4
Jul.  2020
Turn off MathJax
Article Contents

MAO Guangxian, TAN Wei, CHAI Zongzheng, ZHAO Yang, YANG Shenjun. Diameter-height model for Pinus massoniana plantations based on BP neural network[J]. Journal of Zhejiang A&F University, 2020, 37(4): 752-760. doi: 10.11833/j.issn.2095-0756.20190486
Citation: MAO Guangxian, TAN Wei, CHAI Zongzheng, ZHAO Yang, YANG Shenjun. Diameter-height model for Pinus massoniana plantations based on BP neural network[J]. Journal of Zhejiang A&F University, 2020, 37(4): 752-760. doi: 10.11833/j.issn.2095-0756.20190486

Diameter-height model for Pinus massoniana plantations based on BP neural network

doi: 10.11833/j.issn.2095-0756.20190486
  • Received Date: 2019-08-21
  • Rev Recd Date: 2020-01-16
  • Available Online: 2020-07-21
  • Publish Date: 2020-07-21
  •   Objective  To provide theoretical guidance for the management of the plantation of Pinus massoniana, a wood widely used in the south, this study is aimed at the establishment of a high-efficiency diameter-height Model.  Method  With 4 284 P. massoniana plants from 82 sample plots in central Guizhou Province as the study subjects, 6 generalized nonlinear models were selected to fit the diameter-height relationship. After the determination of the optimal number of hidden layer nodes, repeated training was conducted to establish the BP neural network-based model of diameter-height relationship for P. massoniana plantation.  Result  Among the 6 generalized nonlinear models, the model that fits the best is Korf function (R2=0.650) while the two hidden layers for BP neural network model were suitable for P. massoniana plantation with 1∶2∶1 as the appropriate model structure (number of input layer nodes∶number of hidden layer nodes∶number of output layer nodes) was and the model prediction accuracy reaching 0.717.  Conclusion  The generalized nonlinear model can fit the diameter-height relationship of P. massoniana plantation pretty well, yet in comparison, the BP neural network works better in that it’s not reliant on empirical models and has better fitting accuracy for the high R2 yet lower root mean squared error. [Ch, 5 fig. 5 tab. 35 ref.]
  • [1] RAN Jiaxuan, QI Yujiao.  Height-diameter model of Pinus massoniana and Schima superba mixed forest in central Guizhou Province . Journal of Zhejiang A&F University, 2024, 41(2): 343-352. doi: 10.11833/j.issn.2095-0756.20230363
    [2] WANG Yan, YU Yun, LIU Yong, WANG Kaiyong, ZHOU Xiaojie, WANG Yang.  Health assessment and influencing factors of Fraxinus pennsylvanica in Beijing core area . Journal of Zhejiang A&F University, 2022, 39(6): 1340-1349. doi: 10.11833/j.issn.2095-0756.20220109
    [3] LUAN Jingran, FENG Guohong, ZHU Yujie.  Visible/near infrared spectrum wood identification based on SPA-GA-BP neural network . Journal of Zhejiang A&F University, 2022, 39(3): 671-678. doi: 10.11833/j.issn.2095-0756.20210377
    [4] WU Lizhou, WANG Xiaohui, WANG Zhihui, FANG Xin, ZHU Tingyu, DING Lixia.  Crops identification based on hyperspectral data and random forest method . Journal of Zhejiang A&F University, 2020, 37(1): 136-142. doi: 10.11833/j.issn.2095-0756.2020.01.018
    [5] YIN Huanhuan, LIU Qinghua, ZHOU Zhichun, WAN Xueqin, YU Qixin, FENG Zhongping.  Genetic variation of wood basic density and fiber morphology and selection of Pinus massoniana . Journal of Zhejiang A&F University, 2020, 37(6): 1186-1192. doi: 10.11833/j.issn.2095-0756.20190720
    [6] LIU Guangwu, CHEN Chen, WANG Keli.  Density index model of the Pinus massoniana plantation based on artifical neural network (ANN) . Journal of Zhejiang A&F University, 2020, 37(1): 100-104. doi: 10.11833/j.issn.2095-0756.2020.01.013
    [7] JIA Penggang, XIA Kai, DONG Chen, FENG Hailin, YANG Yinhui.  Predicting DBH of a single Ginkgo biloba tree based on UAV images . Journal of Zhejiang A&F University, 2019, 36(4): 757-763. doi: 10.11833/j.issn.2095-0756.2019.04.016
    [8] WANG Huaijing, TAN Bingxiang, FANG Xiufeng, LI Shiming, LI Taixing.  Precise classification of forest types use Hyperion image based on the C5.0 decision tree algorithm . Journal of Zhejiang A&F University, 2018, 35(4): 724-734. doi: 10.11833/j.issn.2095-0756.2018.04.018
    [9] LEI Zeyong, HAN Yangang, ZHAO Guojun, ZHOU Yanping, ZHANG Yansong, YU Deliang.  Growth of Mongolian pine in Zhanggutai of Liaoning Province . Journal of Zhejiang A&F University, 2018, 35(2): 324-330. doi: 10.11833/j.issn.2095-0756.2018.02.017
    [10] LIU Jiancheng, WU Baoguo, CHEN Dong.  Research and construction of web crawler based forest management knowledge collection system . Journal of Zhejiang A&F University, 2017, 34(4): 743-750. doi: 10.11833/j.issn.2095-0756.2017.04.022
    [11] MA Zhongqing, ZHANG Qisheng.  Pinus massoniana pyrolysis: influence of temperature on yields and product properties . Journal of Zhejiang A&F University, 2016, 33(1): 109-115. doi: 10.11833/j.issn.2095-0756.2016.01.015
    [12] SHANG Zhenzhen, ZHOU Guomo, DU Huaqiang.  Relationship between above-ground biomass and DBH for Phyllostachys edulis stands based on fractal theory . Journal of Zhejiang A&F University, 2013, 30(3): 319-324. doi: 10.11833/j.issn.2095-0756.2013.03.002
    [13] WEI Xiao-hui, SUN Yu-jun, MA Wei.  A height growth model for Cunninghamia lanceolata based on Richards’ equation . Journal of Zhejiang A&F University, 2012, 29(5): 661-666. doi: 10.11833/j.issn.2095-0756.2012.05.004
    [14] SUN Meng-jun, XU Jun.  Division of high conservation value forest based on forest management of county level . Journal of Zhejiang A&F University, 2011, 28(6): 878-883. doi: 10.11833/j.issn.2095-0756.2011.06.007
    [15] HUANG Chu-dong, SHAO Yun, LI Jing, LIU Jing-hui, CHEN Jie-qiong.  Urban forest research based on regression tree techniques and ASTER imagery . Journal of Zhejiang A&F University, 2008, 25(2): 240-244.
    [16] SHI Yong-jun, XU Xiao-jun, DU Hua-qiang, ZHOU Guo-mo, JIN Wei, ZHOU Yu-feng.  Remote sensing image based bamboo forest monitoring with a back propagation(BP) neural network . Journal of Zhejiang A&F University, 2008, 25(4): 417-421.
    [17] WEN Zuo-wu.  Comparison of productivity between first and second rotation stands of Pinus massoniana planted in different densities . Journal of Zhejiang A&F University, 2004, 21(1): 22-27.
    [18] ZHENG Ren-hua, CHEN Guo-jin, FU Zhong-hua, YU Bai-nan, YANG Zong-wu, FU Yu-shi, PAN Qiong-rong.  Genetic evaluation and selection of plus tree progeny of masson pine . Journal of Zhejiang A&F University, 2001, 18(2): 144-149.
    [19] Xie Zhegen, Liu Anxing, Chen Xuetang, Chen Antong, Xu Zufu..  Study on Relative Tree Height Models. . Journal of Zhejiang A&F University, 1998, 15(1): 69-75.
    [20] Ding Guijie.  Study on Standard Height Curve Model of Masson Pine Planted Forests. . Journal of Zhejiang A&F University, 1997, 14(3): 225-230.
  • [1]
    MEHTÄTALO L, de MIGUEL S, GREGOIRE T G. Modeling height-diameter curves for prediction [J]. Can J For Res, 2015, 45(7): 826 − 837.
    [2]
    LI Chunming, LI Lixue. Height-diameter relationship for Quercus variabilis Blume plantations based on nonlinear mixed model [J]. J Beijing For Univ, 2009, 31(4): 7 − 12.
    [3]
    ZHANG Lianjin, SUN Changzhong, XIN Xuebing, et al. Allometric relationship between height and diameter at breast height of different stand in Beijing Jiulong Mountain [J]. J Cent South Univ For Technol, 2014, 34(12): 66 − 70.
    [4]
    CHAI Zongzheng, TAN Wei, LI Yuanyuan, et al. Generalized nonlinear height-diameter models for a Cryptomeria fortunei plantation in the Pingba region of Guizhou Province, China [J]. Web Ecol, 2018, 18(1): 29 − 35.
    [5]
    DONG Jie, SHI Yuli. Tree height-diameter model in Jiagedaqi [J]. J Northeast For Univ, 2017, 45(2): 6 − 11, 21.
    [6]
    WANG Dongzhi, ZHANG Dongyan, ZHANG Zhidong, et al. Height-diameter relationship for conifer mixed forest based on nonlinear mixed-effects model [J]. Sci Silv Sin, 2016, 52(1): 30 − 36.
    [7]
    LU Jun, ZHANG Huiru, LEI Xiangdong, et al. Height-diameter models for saplings in a spruce-fir mixed forest in Changbai Mountains [J]. J Beijing For Univ, 2015, 37(11): 10 − 25.
    [8]
    LIU Xin, WANG Haiyan, LEI Xiangdong, et al. Generalized height-diameter model for natural mixed spruce-fir coniferous and broadleaf forests based on BP neural network [J]. For Res, 2017, 30(3): 368 − 375.
    [9]
    DONG Yunfei, SUN Yujun, WANG Yifu, et al. Generalized height-diameter model for Chinese fir based on BP neural network [J]. J Northeast For Univ, 2014, 42(7): 154 − 156, 165.
    [10]
    SHEN Jianbo, LEI Xiangdong, LI Yutang, et al. Prediction mean height for Larix olgensis plantation based on Bayesian-regularization BP neural network [J]. J Nanjing For Univ Nat Sci Ed, 2018, 42(2): 147 − 154.
    [11]
    XU Buqiang, ZHANG Qinliang, MI Hongzhuo, et al. Growth model of Pinus tabulaeformis plantation based on BP neural network [J]. J Northeast For Univ, 2011, 39(12): 33 − 35.
    [12]
    JIN Xingji, JIA Weiwei, LI Fengri. Whole stand growth model for natural Dahurian larch forests based on BP ANN [J]. Bull Bot Res, 2008, 28(3): 370 − 374, 384.
    [13]
    LIU Jianzhong, YU Na. Quality spatial evaluation of Pinus massoniana and control measures of low-efficiency forest in Guizhou Province [J]. Hubei Agric Sci, 2016, 55(20): 5202 − 5206.
    [14]
    HE Jing, WEI Xiaoli, XU Hai. Tree species diversity of Pinus massoniana forest in Guizhou Province [J]. J West China For Sci, 2016, 45(3): 26 − 29, 37.
    [15]
    WANG Ke, TAN Wei, QI Yujiao. Initial effects of close-to-nature thinning on a natural secondary Pinus massoniana pure forest in central Guizhou [J]. J Zhejiang A&F Univ, 2019, 36(5): 886 − 893.
    [16]
    PU Ruiliang, GONG Peng, YANG R. Forest yield prediction with an artificial neural network and multiple regression [J]. Chin J Appl Ecol, 1999, 10(2): 129 − 134.
    [17]
    PESCHEL W. Mathematical methods for growth studies of trees and forest stands and the results of their application [J]. Tharandter Forstl Jahrb, 1938, 89: 169 − 247.
    [18]
    CURTIS R O. Height-diameter and height-diameter age equations for second-growth Douglas fir [J]. For Sci, 1967, 13(4): 365 − 375.
    [19]
    PEARL R, REED L J. On the rate of growth of the population of the United States since 1790 and its mathematical representation [J]. Proc Nati Acad Sci, 1920, 6(6): 275 − 288.
    [20]
    WEIBULL W. A statistical distribution function of wide applicability [J]. J Appl Mech, 1951, 18(3): 293 − 297.
    [21]
    GOMPERZ B. On the nature of the function expressive of the law of human mortality, and on a new mode of determining the value of life contingencies [J]. Phil Trans Roy Soc London, 1832, 115: 513 − 585.
    [22]
    LUNDQVIST B. On the height growth in cultivated stands of pine and spruce in Northern Sweden [J]. Medd Fran Statens Skogsforskningsinst, 1957, 47(2): 1 − 64.
    [24]
    LUO Hengchun, ZHANG Chao, WEI Anchao, et al. Average DBH growth model of a stand with environmental parameters for Pinus yunnanensis in central Yunnan, China [J]. J Zhejiang A&F Univ, 2018, 35(6): 1079 − 1087.
    [25]
    HUANG S S, TITUS S J, WIENS D P. Comparison of nonlinear height-diameter functions for major Alberta tree species [J]. Can J For Res, 1992, 22(9): 1297 − 1304.
    [26]
    GUPTA A, SRIVASTAVA R, JABEEN N, et al. Height estimation model for Eucalyptus tereticornis grown under semiarid conditions of India [J]. Indian J Agrofor, 2008, 10(2): 34 − 39.
    [27]
    KALBI S, FALLAH A, BETTINGER P, et al. Mixed-effects modeling for tree height prediction models of Oriental beech in the Hyrcanian forests [J]. J For Res, 2018, 29(5): 1195 − 1204.
    [28]
    SHARMA R P, VACEK Z, VACEK S, et al. Modelling individual tree height-diameter relationships for multi-layered and multi-species forestsin central Europe [J]. Trees, 2019, 33(1): 103 − 119.
    [29]
    HUANG Xuguang, ZHOU Junchao, HUANG Bohua, et al. Study of oak growth dynamic simulation system based on artificial neural network [J]. J Henan Agric Univ, 2015, 49(2): 190 − 194.
    [30]
    XU Zhiyang. Height-diameter model for Pinus massoniana based on BP neural network [J]. For Inventory Plann, 2015, 40(2): 6 − 8, 73.
    [31]
    DU Zhi, GAN Shishu. Height-diameter models for Cunninghamia lanceolata and Pinus massoniana based on BP neural network [J]. Cent South For Inventory Plann, 2017, 36(4): 36 − 39.
    [32]
    WANG Yifu, SUN Yujun, GUO Xiaoyu. Single-tree biomass modeling of Pinus massoniana based on BP neural network [J]. J Beijing For Univ, 2013, 35(2): 17 − 21.
    [33]
    AHMADI K, ALAVI S J, TABARI M, et al. Non-linear height-diameter models for oriental beech (Fagus orientalis Lipsky) in the Hyrcanian forests, Iran [J]. Biotechnol Agron Soc Environ, 2013, 17(3): 431 − 40.
    [34]
    SU Chongyu, WANG Yuduo. BP neural network optimized by improved adaptive genetic algorithm computer engineering and applications [J]. Ind Control Comput, 2019, 32(1): 67 − 69.
    [35]
    LI Song, LIU Lijun, ZHAI Man. Prediction for short-term traffic flow based on modified PSO optimized BP neural net work [J]. Syst Eng-Theory Pract, 2012, 32(9): 2045 − 2049.
  • 加载中
通讯作者: 陈斌, bchen63@163.com
  • 1. 

    沈阳化工大学材料科学与工程学院 沈阳 110142

  1. 本站搜索
  2. 百度学术搜索
  3. 万方数据库搜索
  4. CNKI搜索

Figures(5)  / Tables(5)

Article views(2450) PDF downloads(84) Cited by()

Related
Proportional views

Diameter-height model for Pinus massoniana plantations based on BP neural network

doi: 10.11833/j.issn.2095-0756.20190486

Abstract:   Objective  To provide theoretical guidance for the management of the plantation of Pinus massoniana, a wood widely used in the south, this study is aimed at the establishment of a high-efficiency diameter-height Model.  Method  With 4 284 P. massoniana plants from 82 sample plots in central Guizhou Province as the study subjects, 6 generalized nonlinear models were selected to fit the diameter-height relationship. After the determination of the optimal number of hidden layer nodes, repeated training was conducted to establish the BP neural network-based model of diameter-height relationship for P. massoniana plantation.  Result  Among the 6 generalized nonlinear models, the model that fits the best is Korf function (R2=0.650) while the two hidden layers for BP neural network model were suitable for P. massoniana plantation with 1∶2∶1 as the appropriate model structure (number of input layer nodes∶number of hidden layer nodes∶number of output layer nodes) was and the model prediction accuracy reaching 0.717.  Conclusion  The generalized nonlinear model can fit the diameter-height relationship of P. massoniana plantation pretty well, yet in comparison, the BP neural network works better in that it’s not reliant on empirical models and has better fitting accuracy for the high R2 yet lower root mean squared error. [Ch, 5 fig. 5 tab. 35 ref.]

MAO Guangxian, TAN Wei, CHAI Zongzheng, ZHAO Yang, YANG Shenjun. Diameter-height model for Pinus massoniana plantations based on BP neural network[J]. Journal of Zhejiang A&F University, 2020, 37(4): 752-760. doi: 10.11833/j.issn.2095-0756.20190486
Citation: MAO Guangxian, TAN Wei, CHAI Zongzheng, ZHAO Yang, YANG Shenjun. Diameter-height model for Pinus massoniana plantations based on BP neural network[J]. Journal of Zhejiang A&F University, 2020, 37(4): 752-760. doi: 10.11833/j.issn.2095-0756.20190486
  • 胸径和树高是林业调查的重要因子,胸径通常易测且结果精准,但树高的测量往往低效费时,结果偏差相对较大[1]。因此,为了更加方便准确地获得林木树高,李春明等[2]通过非线性混合效应模型很好地模拟了栓皮栎Quercus variabilis树高与胸径的关系;张连金等[3]通过幂函数模拟了12种不同林分的胸径与树高关系;CHAI等[4]选取常用的16个林业模型对贵州省平坝区柳杉Cryptomeria fortunei人工林树高-胸径进行拟合,选出了拟合精度相对较高的3个模型。此类研究通常需要从常用的生长模型或其扩展模型中选出很多模型作为候选模型,再对它们分别进行拟合,通过一系列的模型评价指标对其进行筛选,再结合树种生物学特性及模型的适用性选择出表现最好的模型。然而候选模型的种类和数量常常因人而异,少则几种[5-6],多则有几十种[7],过少则精度不佳,过多则计算量大,费时费力。但是,林木的生长过程复杂,导致传统的模型难以达到较高的预测精度。人工神经网络不依赖现存模型,可以最大限度地逼近任意非线性变化趋势。BP(back propagation)神经网络也称误差反向传播网络,在很多领域均有应用,是当前应用最广的神经网络模型之一,也是林业研究中常用的模型。在林业调查中,通过建立树高-胸径的关系模型来预测树高往往具有事半功倍的效果,同时在林木生长预测、生物量的估计,森林资源的监测与评价中具有较高的使用价值[4]。刘鑫等[8]、董云飞等[9]运用BP神经网络分别拟合了天然云冷杉Abies fabri针阔混交林和杉木Cunninghamia lanceolata的树高曲线,表明BP神经网络有操作简单、拟合精度高、泛化能力强等特点。目前以BP神经网络预测树高的研究主要集中于长白山落叶松Larix olgensis[10]、油松Pinus tabuliformis[11]、兴安落叶松Larix gmelinii[12]等树种构成的林分。马尾松Pinus massoniana作为南方主要用材树种,由于经营不及时、地理环境特殊等原因,大面积马尾松人工林林分结构不合理等[13-16],并且对其树高模型预测方面的研究还较少。基于此,本研究以黔中马尾松人工林为对象,通过胸径-树高建立BP神经网络,并与6个候选模型中筛选出的最佳模型进行比较,探究模型在马尾松人工林树高预测中的表现和适用性,以期为马尾松人工林树高估测及森林资源的监测与评价提供理论依据。

    • 研究区(26°10′~27°21′N,106°59′~107°16′E)位于黔中息烽县、开阳县、乌当区、龙里县、平坝区5个县(区),该区地貌类型复杂多样,按形态划分为山地、丘陵和坝地三大类型;地势起伏较大,大致呈东西向延展,西部、南部较高,东部、北部较低,地形坡度大多都在25°以下;平均海拔1 200 m左右,属于亚热带湿润温和型气候,年均气温15.3 ℃,年均降水量1 200 mm;森林土壤主要有黄壤、石灰土和紫色土。黄壤为地带性土壤,一般土层较深厚。常见乔木主要有马尾松、枫香Liquidambar formosana、华山松Pinus armandii、柳杉、楸树Catalpa bungei、梓树Catalpa ovata、亮叶桦Betula luminifera、白栎Quercus fabri、麻栎Quercus acutissima等。

    • 数据来源于5个黔中县(区)马尾松可持续经营试点区域经营对照样地,起源为人工林,未实施过任何经营措施,且人为干扰相对较小。其中,样地数为息烽县4个,开阳县8个,乌当区22个,龙里县16个,平坝区32个,样地大小为25 m×25 m,调查林分基本情况(坡向、坡位、海拔、郁闭度等),对样地中胸径大于5 cm的林木进行每木检尺并通过网格计算其相对位置,记录因子有树高、胸径、冠幅、第一活枝高、林木质量、相对位置,在样地的4个角及中间设置5个5 m×5 m的样方,记录主要灌木的平均高度、地径、株数、冠幅、盖度,同时设置5个1 m×1 m的的样方,记录主要草本的平均高度、盖度。

    • 基于胸径-树高散点图(图1)进行模型拟合,其中,训练数据3 430株,验证数据854株。基于模型的数学特性及模型参数的生物学意义,选择常用的6个非线性生长模型(表1)。

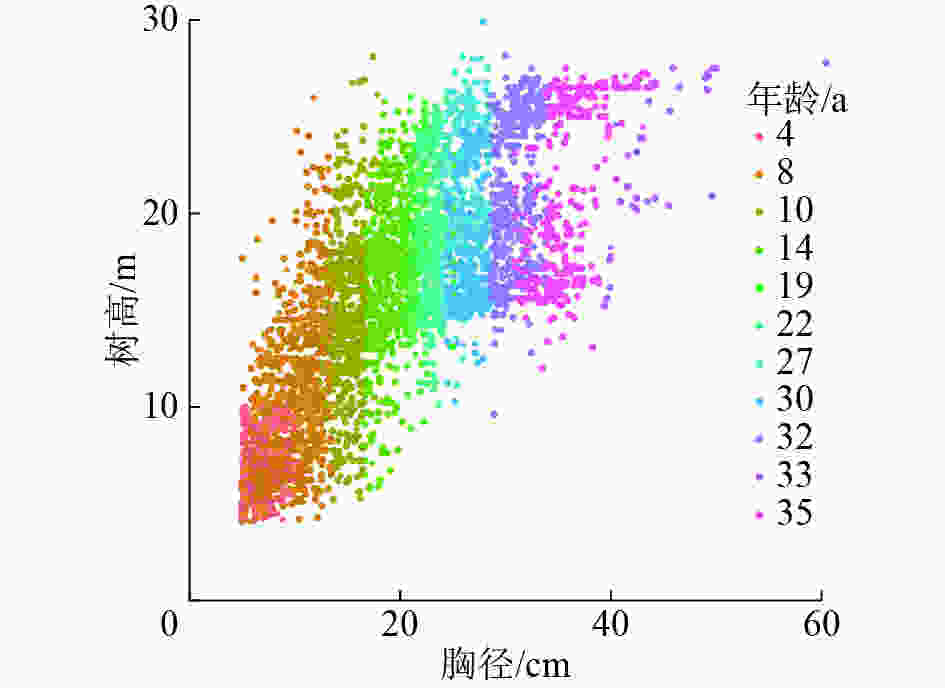
      Figure 1.  Diameter-height scatter diagram for model fitting data for P. massoniana

      模型名称参数/个表达式参考文献
      Näslund2${H\left( D \right) = 1.3 + \dfrac{{{D^2}}}{{{{\left( {aD + b} \right)}^2}}}}$[17]
      Curtis2${H\left( D \right) = 1.3 + \dfrac{{aD}}{{{{\left( {1 + D} \right)}^b}}}}$[18]
      Logistic3${H\left( D \right) = 1.3 + \dfrac{a}{{1 + b{\rm{exp}}\left( { - cD} \right)}}}$[19]
      Weibull3${H\left( D \right) = 1.3 + a\left[ {1 - {\rm{exp}}\left( { - b{D^c}} \right)} \right]}$[20]
      Gomperz3${H\left( D \right) = 1.3 + a{\rm{exp}}\left[ { - b{\rm{exp}}\left( { - cD} \right)} \right]}$[21]
      Korf3${H\left( D \right) = 1.3 + a{\rm{exp}}\left( { - b{D^{ - c}}} \right)}$[22]
        说明:H表示树高;D表示胸径;abc为模型参数

      Table 1.  Nonliner diameter-height growth models selected for use

    • 这是多层前馈神经网络的一种,其特点为:信号向前传播,误差反向传播(图2)。过程主要分为2个阶段:第1阶段是信号向前传播,由输入层经过一到多个的隐藏层,最后到达输出层;第2阶段是误差反向传播的过程,从输出层到隐藏层,再到输入层,根据误差调节隐藏层到输出层的权重和偏置,直到达到目标误差限或预设训练次数为止。神经网络的基本组成单元见图3x1~xn(1,2,3,$\cdots $n)为神经元的输入信号,ω1~ωn(1,2,3,$\cdots $n)为权重,b为偏置,∑为求和节点,σ为激活函数。根据Kolmog-orov定理,单隐层的BP神经网络就可以无限逼近任意连续的非线性曲线[16]。但过分拟合会导致模型的泛化能力差,所以在实际的应用中还要结合样本本身的特性来控制拟合程度。

      Figure 2.  BP neural network structure

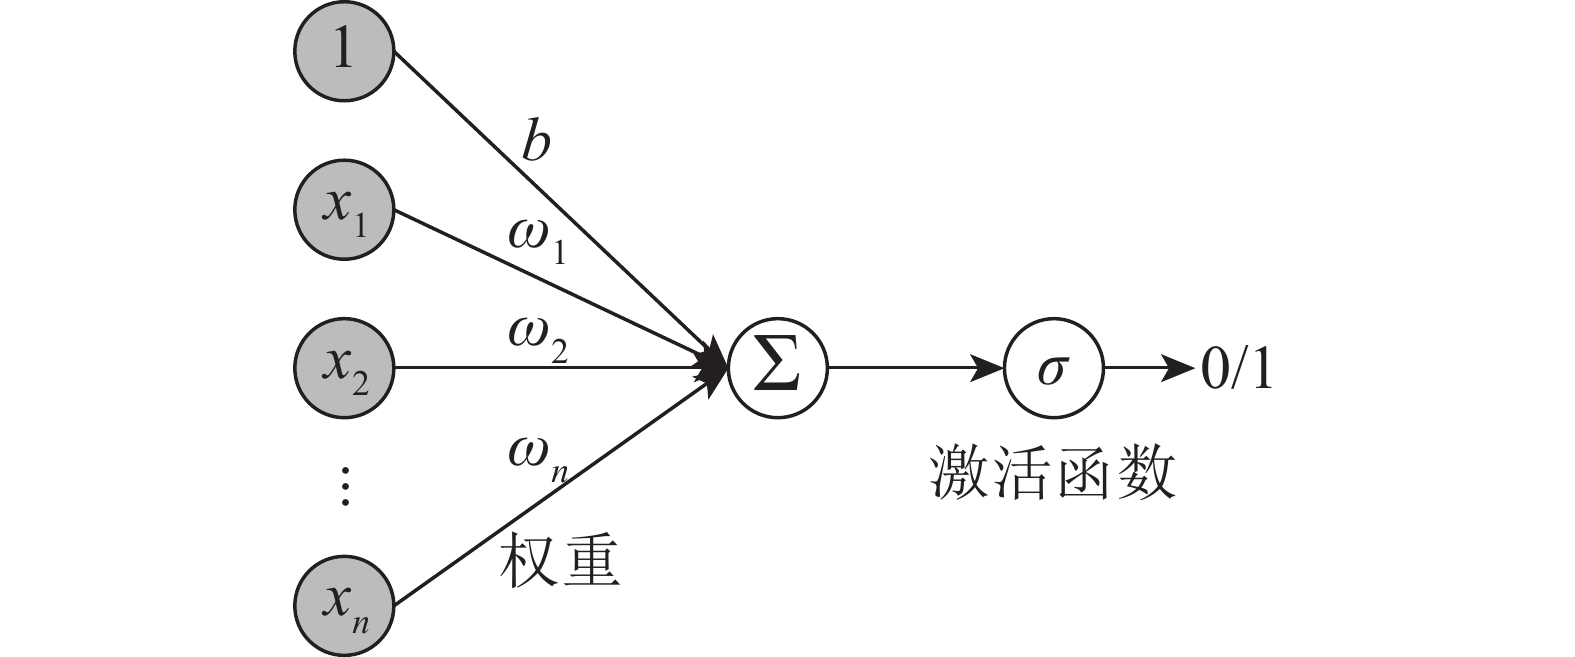
      Figure 3.  BP neural structure

    • 基于Matlab(2016a)软件自带工具箱nntool,建立单隐层的BP神经网络以估测树高,以输入层为胸径,以输出层为树高。根据BP神经网络的隐层节点数可用${N_h} = $$\sqrt {{N_{{\rm{in}}}} + {N_{{\rm{out}}}}} + h$,其中:Nh为隐层节点数,Nin为输入层节点数,Nout为输出层节点数,h为1~10的整数[23]。本研究通过在范围内逐个测试,对比其估测精确度及泛化能力以确定最佳隐层节点数。建模时,设置目标精度为0.001,最大迭代次数为1 000,学习率为0.01,因胸径-树高关系曲线形似“高关型曲线”,所以以sigmoid(logsig)函数为隐层传递函数,以purelin函数输出层传递函数,Levenberg-Marquardt算法相对其他算法有缩短训练时间的特点,因此以Levenberg-Marquardt算法为模型训练算法。

    • 对胸径-树高模型的选择通过决定系数(R2)、相对平均绝对误差(RMA)、均方根误差(RMSE)和Akaike信息准则(AIC)评价模型的拟合效果(表2),R2越大、RMA越小、RMSE越小、AIC越小,模型的拟合精度越高。

      评价指标表达式
      决定系数(R2)${{R^2} = 1 - \dfrac{{\mathop \sum \limits_{i = 1}^n {{({H_i} - \widehat {{H_i}})}^2}}}{{\mathop \sum \limits_{i = 1}^n {{({H_i} - \overline {{H_i}} )}^2}}}\dfrac{{n - 1}}{{n - p - 1}}}$
      相对平均绝对误差(RMA)${ {R_{\rm{MA} } } = \displaystyle{\mathop \sum \limits_{i = 1}^n \left| {\dfrac{ {\left( { {H_i} - \widehat { {H_i} } } \right)} }{ {\widehat { {H_i} } } }} \right|}\Big/{n} \times 100\% }$
      均方根误差(RMSE)${{R_{\rm{MSE}}} = \sqrt {\dfrac{{\mathop \sum \limits_{i = 1}^n {{({H_i} - \widehat {{H_i}})}^2}}}{{n - p}}}} $
      Akaike信息准则(AIC)${{A_{\rm{IC}}} = n \times {\rm{ln}} {R_{\rm{MSE}}} + 2p}$
        说明:Hi表示树高实测值;${\widehat {{H_i}}}$表示树高预测值;${\overline {{H_i}}} $表示     树高平均值;n表示样本量;p表示模型参数数量

      Table 2.  Model performance criteria selected for this study

    • 数据统计使用Excel 2016,BP神经网络的构建及拟合使用Matlab(2016a)软件自带工具箱nntool,70%为训练数据,15%为验证数据,15%为测试数据;传统的胸径-树高模型的拟合主要使用R语言sampling程序包进行分层抽样,抽取80%为训练数据,20%为检测数据,借助lmfor程序包进行模型拟合,ggplot2程序包作图。

    • 所选样地马尾松平均年龄为18 a,胸径为5.0~60.4 cm,树高为4.1~29.9 m(表3)。训练数据包括3 430株林木,胸径为5.0~50.0 cm,树高为4.1~29.9 m,覆盖了整个径阶和树高范围。测试数据包括854株林木,胸径为5.0~60.4 cm,树高为4.1~27.8 m,基本覆盖所有径阶和树高范围,说明分层抽样的可靠性。

      径阶/cm株数/株胸径/cm树高/m
      平均值标准差最大值最小值平均值标准差最大值最小值
      6 370 5.90.6 6.9 5.0 7.12.218.7 4.0
      8 345 7.90.6 8.9 7.0 8.42.519.6 4.2
      10 300 9.90.610.9 9.0 9.83.124.3 4.2
      12 29411.90.612.911.012.44.026.0 4.3
      14 29714.00.614.913.014.43.924.3 5.2
      16 27515.90.616.915.015.34.026.9 5.3
      18 28918.00.618.917.016.84.028.1 5.8
      20 25720.00.620.919.018.03.325.3 6.7
      22 31222.00.622.921.018.73.426.0 8.9
      24 31423.90.624.923.019.23.626.310.1
      26 28726.00.626.925.019.73.728.110.3
      28 22827.90.628.927.020.03.829.9 9.6
      30 20529.90.630.929.020.33.528.213.3
      32 18131.90.632.931.021.13.927.512.8
      34 13233.90.634.933.020.64.027.012.0
      36 9035.80.636.935.021.54.427.513.6
      38 4337.80.638.937.022.24.327.013.1
      40 3340.00.640.939.024.03.827.015.2
      42 3042.00.642.941.025.12.527.320.2
      44 1543.60.444.343.025.62.227.320.6
      46 445.90.546.545.524.93.227.520.4
      50 849.40.450.049.026.32.227.520.9
      60 160.460.460.427.827.827.8
      训练数据3 43019.59.350.0 5.015.96.029.9 4.1
      验证数据 85419.39.360.4 5.015.76.027.8 4.1
         说明:“−”表示空值

      Table 3.  Summary statis for all sampled trees and trees used for model calibration and validation

    • 所有的模型拟合都是基于3 430株林木的胸径,拟合结果如图4所示。整体来看,Logistic模型拟合效果最差,对于胸径较小和中等(5.0~25.0 cm)的林木,除Logistic模型外,其他模型的拟合效果都比较好;对于胸径较大的林木,由于林木树高分化严重,所以6个模型拟合效果都不是很好。

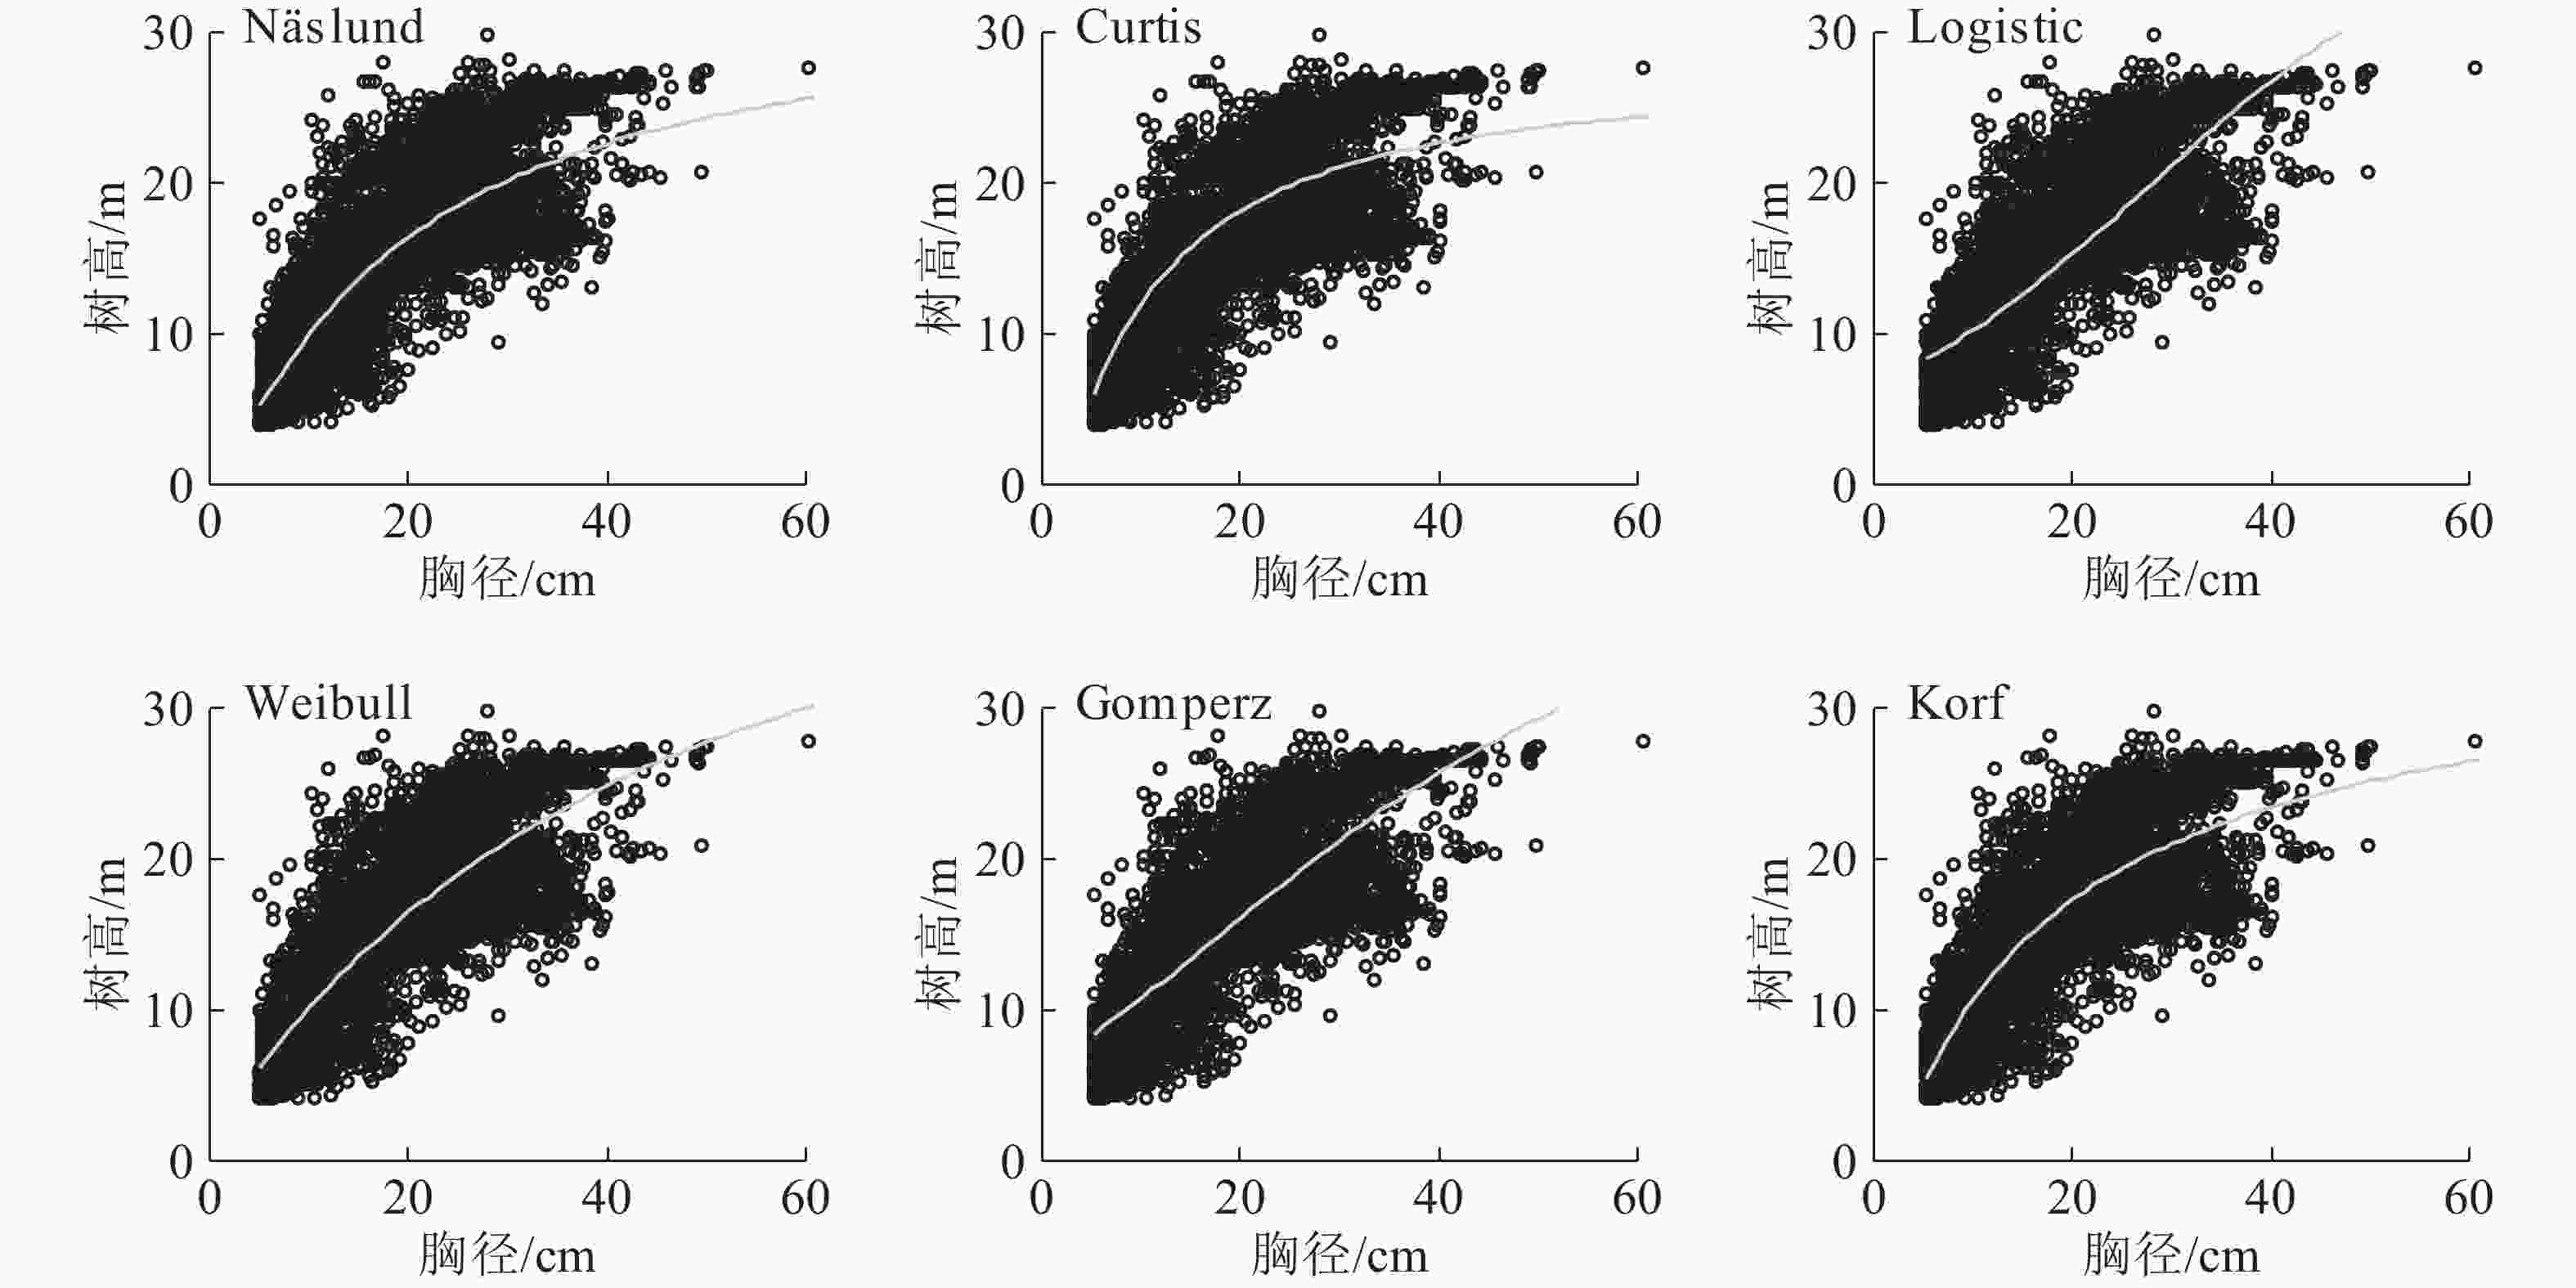
      Figure 4.  Six nonliner diamerter-height cureves for a P. massoniana plantation

      从6个非线性模型中选择出对马尾松胸径-树高关系拟合效果最佳的模型,拟合结果如表4所示。由表4可知:除了Logistic模型外,其他模型拟合效果都较好,R2最小值为0.568,R2从小到大依次为Logistic模型、Gomperz模型、Curtis模型、Weibull模型、Näslund模型、Korf模型,RMSE从大到小依次为Logistic模型、Gomperz模型、Curtis模型、Weibull模型、Korf模型;RMSE最大值仅为4.218。综合考虑4个评价标准,Korf模型拟合效果最佳。

      模型abc训练样本验证样本
      R2RMA/%RMSEAICR2RMA/%RMSEAIC
      Näslund1.6140.1760.63525.0184.04423 176.400.62320.0893.6304 626.377
      Curtis27.159.5380.62623.8084.09423 282.510.62218.6453.6344 628.369
      Logistic37.185.8040.0640.56827.2104.40223 903.700.55121.6523.9634 777.537
      Weibull37.180.0310.9410.62924.6404.07923 252.320.61519.6003.6714 646.573
      Gomperz37.182.0160.0390.60325.7974.21823 538.000.58920.4933.7904 701.199
      Korf37.186.7960.6980.65023.5853.96323 003.990.64118.8773.5454 587.180
         说明:“−”表示空值

      Table 4.  Parmeter estimates and performance criteria of 6 nonlinear meight-diameter models for a P. massoniana plantation

    • 用于模型测试的林木854株,胸径(5.0~60.4 cm)。由表4可知:表现最佳的是Korf模型,检测样本的模型拟合结果与训练样本一致,Korf模型和Näslund模型能够较好地预测林木树高,可选取这2个模型作为研究区马尾松人工林胸径-树高预测模型。此外,由于Korf模型为3参数模型,较2参数模型复杂,但是当研究区大、样本较复杂时有较好的拟合效果,而2参数模型较适合于小面积、数据量较小的情况。因此,选用Korf模型为最佳的胸径-树高模型。

    • 以胸径为输入变量,以树高为输出变量,建立隐层为Nh的BP神经网络。根据经验公式求得隐层数为2.414~11.414,由于神经网络训练结果有一定的波动,为增加模型的容错率,一次将隐层数设置为2~11的整数,每个节点数训练10次并计算R2RMSE的平均值(表5),随着隐层节点数的增加,所有数据RMSE最大仅为3.742,大部分R2都大于0.700,但在测试数据中存在R2小于0.700的情况。对于训练数据和验证数据,随着隐层节点的增大,R2也逐渐增大,RMSE对于训练数据和验证数据的变化情况与R2相同,随着隐层节点数的增加逐渐减小;对于测试数据,因为是独立验证样本,未参与建模,所以测试数据的R2RMSE上下波动,最大和最小分别为0.717和3.513。

      节点数决定系数R2均方根误差RMSE
      训练
      数据
      验证
      数据
      测试
      数据
      训练
      数据
      验证
      数据
      测试
      数据
      20.7120.7170.7173.5463.6553.513
      30.7130.7130.7093.5353.6433.554
      40.7140.7140.6953.5273.5643.554
      50.7150.7140.6953.3463.5123.645
      60.7220.7200.7033.3353.4123.616
      70.7240.7210.7103.3103.3453.598
      80.7260.7260.7083.2823.3123.612
      90.7260.7260.7053.2563.2453.721
      100.7280.7280.7093.2383.2313.645
      110.7290.7290.7013.2343.2033.742

      Table 5.  Average statistics of fitting with different hidden layers for 10 times

      对于测试数据,随着隐层数的增加,预测精度未得到明显提升。为进一步确定隐层节点数量,将神经网络的预测树高与对应的胸径建立散点图,当数据出现过拟合时说明该隐层节点数已不可取。从图5可见:从节点数为3开始就出现了分化及变形,所以确定此时已经出现过拟合的情况。考虑到模型的实用性及马尾松的生物学特性,故选择图像出现过拟合时隐层节点数的前一个节点数作为最佳隐层节点数,即最佳隐层节点数为2。

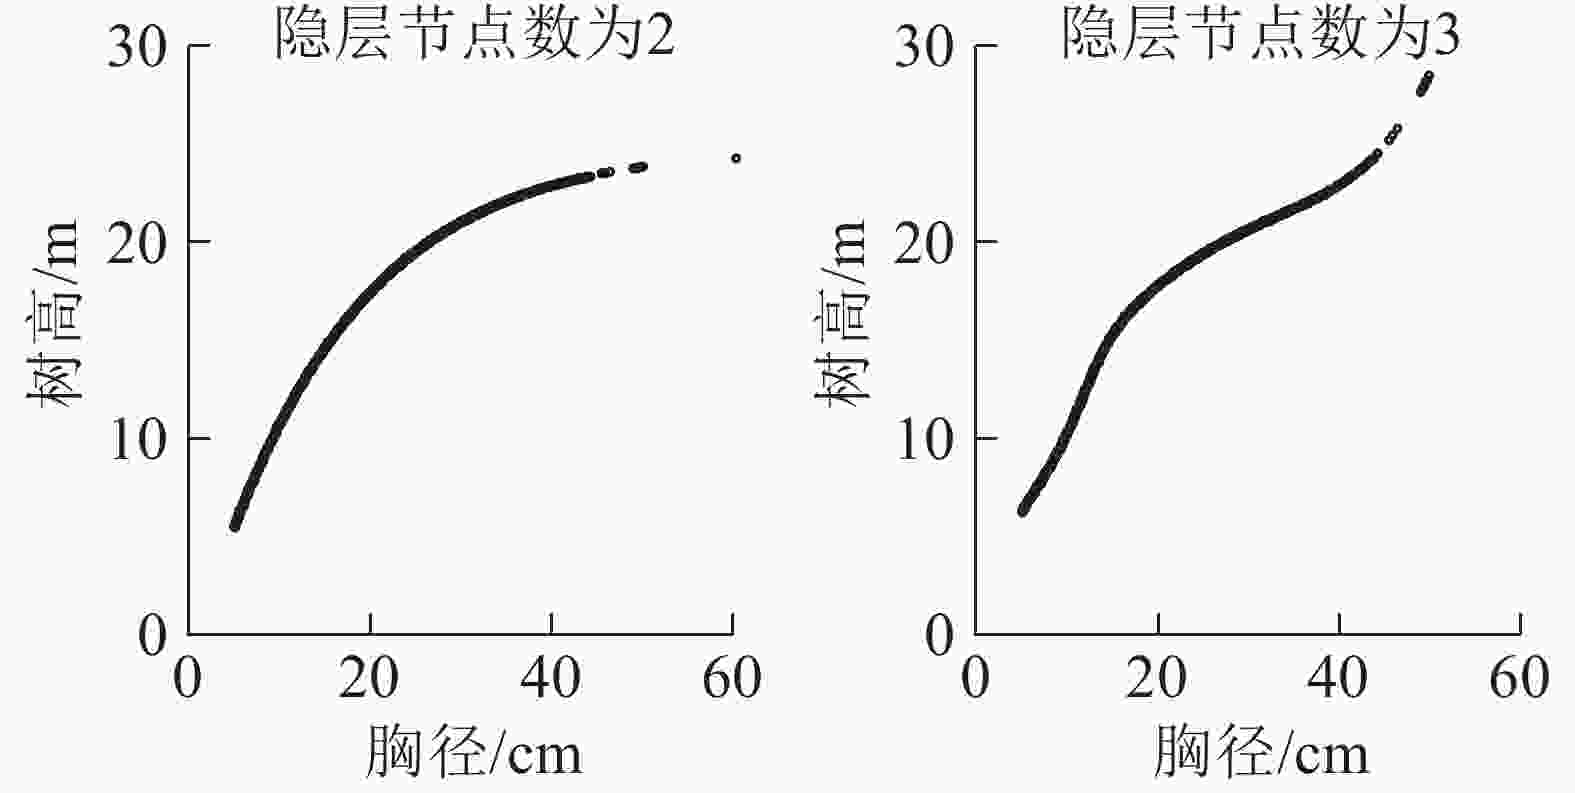
      Figure 5.  Diameter-height scatter diagram for over-fitting

    • 确定最佳隐层节点数后,在同一个隐层节点数的基础上不断训练模型,最终选择合适的结构[输入层节点数(Nin)∶隐层节点数(Nh)∶输出层节点数(Nout)=1∶2∶1]为最后的模型,经训练得到的传递函数模型:h1=logsig(2.580 6+0.510 32D);h2=logsig(1.614 1+1.512 8D);H=purelin(1.111+2.155 1h1+1.403 5h2)。其中:hi为隐层神经元的输出,i=1,2;D为胸径;purelin为线性函数;logsig为对数S型函数;H为树高。

    • 运用6个广义非线性模型(表4)与BP神经网络(表5)对82块样地的抽样数据对比发现:广义非线性模型的R2均为0.500~0.700,RMSE最小为3.963;而BP神经网络训练数据、验证数据、测试数据的R2均大于0.700,RMSE最大仅为3.742,优于广义非线性模型的最大值。因此,在马尾松胸径-树高建模方面,BP神经网络模型比广义非线性模型效果好。

    • 在研究胸径-树高的关系时,模型选择不但要考虑模型的性能及拟合精度,还需考虑其生物学意义[24]。尽管所有模型都具有较好的拟合效果,但是Weibull、Näslund、Korf、Gomperz、Curtis这5个模型对马尾松人工林胸径-树高关系拟合的效果相近,均具有较高的R2和较低的RMARMSEAIC。与此前的大部分研究结果相似[25-27],CHAI等[4]表明:Weibull和Näslund模型的拟合精度最高。SHARMA等[28]通过对挪威云杉Picea abies胸径-树高关系的拟合也发现:Weibull模型有较好的拟合精度。这可能是因为这几个模型具有较好的灵活性,能够通过参数来调节曲线形状以适应各个树种的生长情况。此外,树高的生长随着胸径的生长逐渐变大后趋于平缓,生长曲线呈S型,而这5个函数都是S型模型,因而拟合效果较好。

      本研究显示:最佳模型结构(输入节点数∶隐藏层节点数∶输出层节点数)为1∶2∶1,训练数据、验证数据、测试数据的R2分别达0.712、0.717、0.717,RMSE分别达3.546、3.655、3.513。与传统模型相比,BP神经网络模型的R2均明显大于传统模型,RMSE均小于传统模型,这与黄旭光等[29]、徐志扬[30]的结果相似,说明BP神经网络在建模方面比传统模型更具有优越性。杜志等[31]通过对杉木和马尾松的树高曲线拟合得到相同结论。王轶夫等[32]在对马尾松生物量模型的研究中也发现:BP神经网络优于传统模型。由于无限逼近原理,所以在拟合过程中容易出现过拟合的情况,本研究通过输入变量与输出变量所形成的散点图判断得出:当隐层节点数为3时出现过拟合。本研究结果可为研究区马尾松人工林的经营节约调查成本,提高经营效率。充分考虑地理因素所训练出的模型具有较广的适用性[33],后续研究应充分调查不同立地条件下的该类林分,增加样本量和调查因子,增多神经网络的输入变量,以提高模型的泛化能力。

      BP神经网络在拟合效果上虽然较传统模型好,但是其内部结构并不清楚,无法展示其详细的内部计算过程,这是BP神经网络的不足之处。同时,为了预防BP神经网络过早的产生过拟合,后续研究可使用改进的自适应遗传算法[34]、改进粒子群算法[35]等优化BP神经网络以达到更好的预测效果。

    • 本研究选用6个林业常用的传统模型,对胸径-树高关系进行拟合,结果发现:除了Logistic模型外,其他5个候选模型均表现较好。考虑研究区较大,所以选择具3个参数的Korf模型作为马尾松胸径-树高模型。而用BP神经网络对树高进行估测显示:最佳模型结构(输入节点数∶隐藏层节点数∶输出层节点数)为1∶2∶1,BP神经网络模型的R2均明显大于传统模型,RMSE均小于传统模型,说明BP神经网络在建模方面比传统模型更具有优越性,更适合黔中地区马尾松人工林树高预测。

Reference (35)

Catalog

    /

    DownLoad:  Full-Size Img  PowerPoint
    Return
    Return