Volume 40 Issue 5
Sep.  2023
Turn off MathJax
Article Contents

DOU Xiaowen, WU Dengyu, ZHANG Xiaojing, TANG Mengping. Study on the factors affecting breast-height basal area increment of evergreen broad-leaved forest in Mount Tianmu[J]. Journal of Zhejiang A&F University, 2023, 40(5): 1063-1072. doi: 10.11833/j.issn.2095-0756.20220651
Citation: DOU Xiaowen, WU Dengyu, ZHANG Xiaojing, TANG Mengping. Study on the factors affecting breast-height basal area increment of evergreen broad-leaved forest in Mount Tianmu[J]. Journal of Zhejiang A&F University, 2023, 40(5): 1063-1072. doi: 10.11833/j.issn.2095-0756.20220651

Study on the factors affecting breast-height basal area increment of evergreen broad-leaved forest in Mount Tianmu

doi: 10.11833/j.issn.2095-0756.20220651
  • Received Date: 2022-10-18
  • Accepted Date: 2023-02-14
  • Rev Recd Date: 2023-01-20
  • Available Online: 2023-04-24
  • Publish Date: 2023-09-26
  •   Objective  The objective is to study the growth model of breast-height basal area of evergreen broad-leaved forest and to explore the factors affecting breast-height basal area increment (BAI) of evergreen broad-leaved forest, so as to provide a theoretical basis for evergreen broad-leaved forest management.   Method  Taking the evergreen broad-leaved forest in Mount Tianmu as the research object. Firstly, the correlation between BAI and diameter at breast height (DBH), competition and terrain factors were analyzed. Secondly, the differences of BAI among different diameter classes, crown diameter classes and competition classes were discussed. And finally, based on the ridge regression analysis, the individual tree growth model with logarithm of BAI as the dependent variable was established to quantitatively describe the relationship between BAI and DBH, competition and terrain factors.   Result  The Spearman’s correlation coefficients between BAI and DBH, crown diameter, and competition were 0.531, 0.427 and −0.34 respectively. BAI was extremely significant different among trees of different diameter classes (P<0.01), and increased with increase of DBH. There was a significant difference (P<0.01) in BAI among trees with different competition classes, and trees with low competition level had the largest BAI. Individual tree growth models based on average diameter grade were superior to those based on individual tree, and the regression parameters of DBH in both types of models were extremely significant (P<0.01).   Conclusion  In the evergreen broad-leaved forest of Mount Tianmu, the main factors affecting BAI are DBH, crown diameter and competition index. [Ch, 3 fig. 4 tab. 45 ref.]
  • [1] TAN Cancan, NIE Wen, LIU Yifu, WANG Ya, DONG Yao, HUANG Ruizhi, LIU Jianfeng, SHI Shengqing, CHANG Ermei, ZHAO Xiulian, JIANG Zeping, JIA Zirui.  Tree growth model and bark thickness model of three Quercus species based on trunk analysis . Journal of Zhejiang A&F University, 2023, 40(3): 589-597. doi: 10.11833/j.issn.2095-0756.20220455
    [2] LI Chao, PEI Shunxiang, ZHANG Lianjin, GUO Jia, XIN Xuebing.  Applicability evaluation of competition indexes for Pinus tabuliformis plantations in Beijing . Journal of Zhejiang A&F University, 2019, 36(6): 1115-1124. doi: 10.11833/j.issn.2095-0756.2019.06.008
    [3] TANG Sijia, TANG Mengping, ZHAO Saisai, DU Xiufang, SHEN Qianyong, PANG Chunmei.  Competitive spatial patterns for Moso bamboo on Mount Tianmu . Journal of Zhejiang A&F University, 2018, 35(2): 199-208. doi: 10.11833/j.issn.2095-0756.2018.02.002
    [4] WANG Jinchi, RAN Qixiang, DENG Huafeng, HUANG Guosheng, WANG Xuejun.  Stand growth model for Pinus tabulaeformis using measurement error method . Journal of Zhejiang A&F University, 2018, 35(1): 68-74. doi: 10.11833/j.issn.2095-0756.2018.01.009
    [5] LUO Hengchun, ZHANG Chao, WEI Anchao, ZHANG Yi, HUANG Tian, YU Zhexiu.  Average DBH growth model of a stand with environmental parameters for Pinus yunnanensis in central Yunnan, China . Journal of Zhejiang A&F University, 2018, 35(6): 1079-1087. doi: 10.11833/j.issn.2095-0756.2018.06.011
    [6] FANG Guojing, TANG Mengping.  Spatial continuity for DBH in dominant populations of an evergreen broadleaved forest in National Nature Reserve of Mount Tianmu, China . Journal of Zhejiang A&F University, 2014, 31(5): 663-667. doi: 10.11833/j.issn.2095-0756.2014.05.001
    [7] CHEN Xiaorong, CHEN Yuanyuan, LUO Zhengrong, DING Bingyang.  A 5-year mid-mountain subtropical evergreen broadleaved forest study in Baishanzu,east China . Journal of Zhejiang A&F University, 2013, 30(6): 821-829. doi: 10.11833/j.issn.2095-0756.2013.06.004
    [8] DU Hua-qiang, TANG Meng-ping, CUI Rui-rui.  Spatial heterogeneity of soil nutrients in an evergreen broadleaved forest of Mount Tianmu,Zhejiang . Journal of Zhejiang A&F University, 2011, 28(4): 562-568. doi: 10.11833/j.issn.2095-0756.2011.04.007
    [9] YE Geng-ping, LIU Juan, JIANG Pei-kun, ZHOU Guo-mo, WU Jiao-sen.  Soil respiration during the growing season with intensive management of Phyllostachys pubescens . Journal of Zhejiang A&F University, 2011, 28(1): 18-25. doi: 10.11833/j.issn.2095-0756.2011.01.004
    [10] YANG Guo-ping, GONG He-de, ZHENG Zheng, ZHANG Yi-ping, LIU Yu-hong, LU Zhi-yun.  Caloric values and ash content of six dominant tree species in an evergreen broadleaf forest of Ailaoshan,Yunnan Province . Journal of Zhejiang A&F University, 2010, 27(2): 251-258. doi: 10.11833/j.issn.2095-0756.2010.02.015
    [11] GONG He-de, ZHANG Yi-ping, LIU Yu-hong, YANG Guo-ping, LU Zhi-yun, LU Hua-zheng.  nterception capability in an evergreen broad-leaved forest of Ailaoshan,Yunnan Province . Journal of Zhejiang A&F University, 2008, 25(4): 469-474.
    [12] FANG Guo-jing, TANG Meng-ping, ZHANG Xue-lian.  The mingling index with evergreen broadleaf forests on Mount Tianmu . Journal of Zhejiang A&F University, 2008, 25(2): 216-220.
    [13] JIANG Ting, TANG Meng-ping.  Quantitative relationships with competition of dominant tree populations in an evergreen broad-leaved forest on Mount Tianmu . Journal of Zhejiang A&F University, 2008, 25(4): 444-450.
    [14] YANG Tong-hui, DA Liang-jun, LI Xiu-peng.  Biomass of evergreen broad-leaved forest in Tiantong National Forest Park, Zhejiang Province (II) Aboveground biomass and its allocation pattern . Journal of Zhejiang A&F University, 2007, 24(4): 389-395.
    [15] CAO Yong-hui, XIAO Jiang-hua, CHEN Shuang-lin, WU Bo-lin, WU Ming, ZHANG De-ming.  Effect of everygreen brood-leaved trees on Phyllostachys pubescens growth and their competition in the mixed forest . Journal of Zhejiang A&F University, 2006, 23(1): 35-40.
    [16] YANG Tong-hui, DA Liang-jun, SONG Yong-chang, YANG Yong-chuan, WANG Liang-yan.  Biomass of evergreen broad-leaved forest in Tiantong National Forest Park , Zhejiang Province (Ⅰ)Community structure and fresh weight biomass of main tree species . Journal of Zhejiang A&F University, 2005, 22(4): 363-369.
    [17] JIN Ze-xin.  On species diversity of secondary successional community of evergreen broad-leaved forests at Mount Tiantai of Zhejiang . Journal of Zhejiang A&F University, 2002, 19(2): 133-137.
    [18] ZHOU Guo-mo, GUO Ren-jian WEI Xin-liang, WANG Xue-jun, .  Growth model and cutting age of Chinese fir planted forest in Zhejiang Province . Journal of Zhejiang A&F University, 2001, 18(3): 219-222.
    [19] YU Yi-wu, JIANG Zhi-biao, HU Yong-xu.  Stand characteristerics of evergreen broad-leaved forest with Schima superba in Hangzhou . Journal of Zhejiang A&F University, 1999, 16(3): 242-246.
    [20] Chen Guorui Li Tianyou, Yu Yiwu, Jian Qiuyi, .  Effect of Broadleaved Evergreen Forest in Hangzhou on Temperature and Humidity in the Forest . Journal of Zhejiang A&F University, 1994, 11(2): 151-158.
  • [1]
    TANG Shouzheng, DU Jishan. Determining basal area growth process of thinnined even aged stands by crown competition factor [J]. Scientia Silvae Sinicae, 1999, 35(6): 35 − 41.
    [2]
    WANG Jianjun, ZENG Weisheng, MENG Jinghui. Individual-tree basal area growth model for Cunninghamia lanceolata with the consideration of thinning and tree mortality in the prediction interval [J]. Journal of Northwest Forestry University, 2017, 32(3): 181 − 185.
    [3]
    LU Jun. Individual Tree Growth Models of Natural Mixed Forest in Changbai Mountains[D]. Harbin: Northeast Forestry University, 2005.
    [4]
    LUO Baoyue. Individual Tree Growth Model of Main Tree Species in Coniferous and Broad-leaved Mixed Forest in Jiaohe, Jilin[D]. Beijing: Beijing Forestry University, 2020.
    [5]
    WYKOFF W R. A basal area increment model for individual conifers in the northern Rocky Mountains [J]. Forest Science, 1990, 36(4): 1077 − 1104.
    [6]
    MONSERUD R A, STERBA H. A basal area increment model for individual trees growing in even- and uneven-aged forest stands in Austria [J]. Forest Ecology Management, 1996, 80(1): 57 − 80.
    [7]
    OZDEMIR E. Individual tree basal area increment model for sessile oak (Quercus petraea (Matt.) Liebl.) in coppice-originated stands [J/OL]. Environmental Monitoring Assessment , 2021, 193: 357[2022-09-18]. doi:10.1007/s10661-021-09128-5.
    [8]
    STERBA H, BLAB A, KATZENSTEINER K. Adapting an individual tree growth model for Norway spruce (Picea abies L. Karst. ) in pure and mixed species stands [J]. Forest Ecology Management, 2002, 159(1/2): 101 − 110.
    [9]
    MAN Jingluan, YANG Wei. Based on multiple collinearity processing method [J]. Mathematical Theory and Application, 2010, 30(2): 105 − 109.
    [10]
    LI Li, HUI Shurong, HUI Gangying, et al. A study on the minimum area of forest spatial investigation [J]. Forest Resources Management, 2007(2): 47 − 51.
    [11]
    BAO Weikai, LIU Zhaoguang, LIU Chaolu, et al. Fifteen-year changes of tree layer in secondary Castanopsis-Schima humid evergreen broad-leaved forest in central subtropics of western China [J]. Acta Phytoecologica Sinica, 2000, 24(6): 702 − 709.
    [12]
    ZHANG Yifeng, TANG Mengping. Analysis on spatial structure dynamic characteristics of evergreen broad-leaved forest in Tianmu Mountain [J]. Acta Ecologica Sinica, 2021, 41(5): 1959 − 1969.
    [13]
    LONG Junsong, TANG Mengping. Relationship spatial structure and terrain factors of evergreen broad-leaved forest in Mount Tianmu [J]. Journal Zhejiang A&F University, 2021, 38(1): 47 − 57.
    [14]
    HE Jinsheng, CHEN Weilie, LI Linghao. Community diversity of the main types of the evergreen broad-leaved forest in the eastern part of the middle subtropical China [J]. Acta Phytoecologica Sinica, 1998, 22(4): 303 − 311.
    [15]
    QIU Fengying, XIAO Fuming, GUO Jie, et al. Carbon storage of evergreen broad-leaved forest, Jinpenshan, Jiangxi Province [J]. Journal of Central South University of Forestry and Technology, 2020, 40(1): 105 − 113.
    [16]
    TANG Mengping, ZHOU Guomo, SHI Yongjun, et al. Study of dominant plant populations and their spatial patterns in evergreen broadleaved forest in Tianmu Mountain, China [J]. Journal of Plant Ecology, 2006, 30(5): 743 − 752.
    [17]
    MENG Xianyu. Forest Mensuration [M]. 3rd ed. Beijing: China Forestry Publishing House, 2006: 173 − 174.
    [18]
    ZHANG Huiru. Research Methods and Practice of Forest Management [M]. Beijing: China Forestry Publishing House, 2018: 194 − 195.
    [19]
    WEINER J, DAMGAARD C. Size-asymmetric competition and size-asymmetric growth in a spatially explicit zone-of-influence model of plant competition [J]. Ecological Research, 2006, 21(5): 707 − 712.
    [20]
    WU Mingqin, SUN Yujun, GUO Xiaoyu, et al. Predictive models of crown volume and crown surface area for Korean larch [J]. Journal of Northeast Forestry University, 2014, 42(5): 1 − 5.
    [21]
    LOONEY C E, D’AMATO A W, PALIK B J, et al. Size-growth relationship, tree spatial patterns, and tree-tree competition influence tree growth and stand complexity in a 160-year red pine chronosequence [J]. Forest Ecology and Management, 2018, 424: 85 − 94.
    [22]
    HEGYI F. A simulation model for managing jack-pine stands [M]//FRIES J. Growth Models for Tree and Stand Simulation. Stockholm: Royal College of Forestry, 1974: 74 − 90.
    [23]
    TANG Mengping, CHEN Yonggang, SHI Yongjun, et al. Intraspecific and interspecific competition analysis of community dominant plant population based on Voronoi diagram [J]. Acta Ecologica Sinica, 2007, 27(11): 4707 − 4716.
    [24]
    COOMES D A, ALLEN R B. Effects of size, competition and altitude on tree growth [J]. Journal of Ecology, 2007, 95(5): 1084 − 1097.
    [25]
    STAGE A R, SALAS C. Interactions of elevation, aspect, and slope in models of forest species composition and productivity [J]. Forest Science, 2007, 53(4): 486 − 492.
    [26]
    BARIBAULT T W, KOBE R K, FINLEY A O. Tropical tree growth is correlated with soil phosphorus, potassium, and calcium, though not for legumes [J]. Ecological Monographs, 2012, 82(2): 189 − 203.
    [27]
    CHEN Binghong, JIN Quanfeng, CHAI Hongling, et al. Spatiotemporal distribution and correlation factors of PM2.5 concentrations in Zhejiang Province [J]. Acta Scientiae Circumstantiae, 2021, 41(3): 817 − 829.
    [28]
    FU Jingjing, WU Zhiwei, YAN Saijia, et al. Effects of climate, vegetation, and topography on spatial patterns of burn severity in the Great Xing’an Mountains [J]. Acta Ecologica Sinica, 2020, 40(5): 1672 − 1682.
    [29]
    CHI Xiulian, TANG Zhiyao, XIE Zhongqiang, et al. Effects of size, neighbors, and site condition on tree growth in a subtropical evergreen and deciduous broad-leaved mixed forest, China [J]. Ecology and Evolution, 2015, 5(22): 5149 − 5161.
    [30]
    FIEN E K P, FRAVER S, TEETS A, et al. Drivers of individual tree growth and mortality in an uneven-aged, mixed-species conifer forest [J/OL]. Forest Ecology and Management, 2019, 449(4): 117446[2022-09-18]. doi: 10.1016/j.foreco.2019.06.043.
    [31]
    CANHAM C D, LEPAGE P T, COATES K D. A neighborhood analysis of canopy tree competition: effects of shading versus crowding [J]. Canadian Journal of Forest Research, 2004, 34(4): 778 − 787.
    [32]
    MULLER-LANDAU H C, CONDIT R S, HARMS K E, et al. Comparing tropical forest tree size distributions with the predictions of metabolic ecology and equilibrium models [J]. Ecology Letters, 2006, 9: 589 − 602.
    [33]
    de GROOTE S R E, VANHELLEMONT M, BAETEN L, et al. Competition, tree age and size drive the productivity of mixed forests of pedunculate oak, beech and red oak [J]. Forest Ecology and Management, 2018, 430: 609 − 617.
    [34]
    DOU Xiaowen, TANG Mengping. Gravitational model-based competitive analysis of forest trees [J]. Chinese Journal of Applied Ecology, 2022, 33(10): 2695 − 2704.
    [35]
    POMPA-GARCÍA M, VIVAR-VIVAR E D, SIGALA-RODRÍGUEZ J A, et al. What are contemporary Mexican conifers telling us? A perspective offered from tree rings linked to climate and the NDVI along a spatial gradient [J/OL]. Remote Sensing, 2022, 14(18): 4506[2022-09-18]. doi: 10.3390/rs14184506.
    [36]
    KAHRIMAN A, ŞAHIN A, SÖNMEZ T, et al. A novel approach to selecting a competition index: the effect of competition on individual-tree diameter growth of Calabrian pine [J]. Canadian Journal of Forest Research, 2018, 48(10): 1217 − 1226.
    [37]
    REICH P B, TJOELKER M G, WALTERS M B, et al. Close association of RGR, leaf and root morphology, seed mass and shade tolerance in seedlings of nine boreal tree species grown in high and low light [J]. Functional Ecology, 1998, 12(3): 327 − 338.
    [38]
    BAKER T R, BURSLEM D F R P, SWANIE M D. Associations between tree growth, soil fertility and water availability at local and regional scales in Ghanaian tropical rain forest [J]. Journal of Tropical Ecology, 2003, 19: 109 − 125.
    [39]
    REICH P B, OLEKSYN J. Climate warming will reduce growth and survival of Scots pine except in the far north [J]. Ecology Lettets, 2008, 11: 588 − 597.
    [40]
    EGHDAMI H, WERNER W, de MARCO A, et al. Influence of ozone and drought on tree growth under field conditions in a 22 year time series [J/OL]. Forests, 2022, 13: 1215[2022-09-18]. doi: 10.3390/f13081215.
    [41]
    OUYANG Lei, LU Longwei, WANG Chunlin, et al. A 14-year experiment emphasizes the important role of heat factors in regulating tree transpiration, growth, and water use efficiency of Schima superba in south China [J/OL]. Agricultural Water Management, 2022, 273: 107902[2022-09-18]. doi: 10.1016/j.agwat.2022.107902.
    [42]
    LEI Xiangdong, LI Yongci, XIANG Wei. Individual basal area growth model using multi-level linear mixed model with repeated measures [J]. Scientia Silvae Sinicae, 2009, 45(1): 74 − 80.
    [43]
    POKHAREL B, DECH J P. Mixed-effects basal area increment models for tree species in the boreal forest of Ontario, Canada using an ecological land classification approach to incorporate site effects [J]. Forestry, 2012, 85(2): 255 − 270.
    [44]
    GONG Zhaosong, ZENG Siqi, HE Dongbei, et al. A study on the basal area growth model of Phoebe zhennan secondary forest in Hunan Province [J]. Forest Resources Management, 2020(2): 87 − 93, 140.
    [45]
    CHEN Zhefu, XIAO Huashun, LONG Shisheng. Growth model for individual tree of secondary Pinus massoniana forest in Hunan Province based on mixed effect [J]. Journal of Central South University of Forestry and Technology, 2021, 41(1): 100 − 108.
  • 加载中
通讯作者: 陈斌, bchen63@163.com
  • 1. 

    沈阳化工大学材料科学与工程学院 沈阳 110142

  1. 本站搜索
  2. 百度学术搜索
  3. 万方数据库搜索
  4. CNKI搜索

Figures(3)  / Tables(4)

Article views(271) PDF downloads(38) Cited by()

Related
Proportional views

Study on the factors affecting breast-height basal area increment of evergreen broad-leaved forest in Mount Tianmu

doi: 10.11833/j.issn.2095-0756.20220651

Abstract:   Objective  The objective is to study the growth model of breast-height basal area of evergreen broad-leaved forest and to explore the factors affecting breast-height basal area increment (BAI) of evergreen broad-leaved forest, so as to provide a theoretical basis for evergreen broad-leaved forest management.   Method  Taking the evergreen broad-leaved forest in Mount Tianmu as the research object. Firstly, the correlation between BAI and diameter at breast height (DBH), competition and terrain factors were analyzed. Secondly, the differences of BAI among different diameter classes, crown diameter classes and competition classes were discussed. And finally, based on the ridge regression analysis, the individual tree growth model with logarithm of BAI as the dependent variable was established to quantitatively describe the relationship between BAI and DBH, competition and terrain factors.   Result  The Spearman’s correlation coefficients between BAI and DBH, crown diameter, and competition were 0.531, 0.427 and −0.34 respectively. BAI was extremely significant different among trees of different diameter classes (P<0.01), and increased with increase of DBH. There was a significant difference (P<0.01) in BAI among trees with different competition classes, and trees with low competition level had the largest BAI. Individual tree growth models based on average diameter grade were superior to those based on individual tree, and the regression parameters of DBH in both types of models were extremely significant (P<0.01).   Conclusion  In the evergreen broad-leaved forest of Mount Tianmu, the main factors affecting BAI are DBH, crown diameter and competition index. [Ch, 3 fig. 4 tab. 45 ref.]

DOU Xiaowen, WU Dengyu, ZHANG Xiaojing, TANG Mengping. Study on the factors affecting breast-height basal area increment of evergreen broad-leaved forest in Mount Tianmu[J]. Journal of Zhejiang A&F University, 2023, 40(5): 1063-1072. doi: 10.11833/j.issn.2095-0756.20220651
Citation: DOU Xiaowen, WU Dengyu, ZHANG Xiaojing, TANG Mengping. Study on the factors affecting breast-height basal area increment of evergreen broad-leaved forest in Mount Tianmu[J]. Journal of Zhejiang A&F University, 2023, 40(5): 1063-1072. doi: 10.11833/j.issn.2095-0756.20220651
  • 断面积生长模型是森林生长和收获预估的重要基础[1]。目前,在区域尺度上,较为常见的,是基于抽样方法的多个小样地(400~600 m2)调查数据,并用逐步回归的方法[24]建立某个树种的单木断面积生长模型,模型的自变量包括林木大小、竞争、地形等因子[58]。由于逐步回归法直接剔除共线性自变量,导致完全忽视被剔除变量的影响。岭回归分析是一种专门用于共线性数据分析的有偏估计方法。针对共线性的病态数据,岭回归既保留了全部自变量,又在一定程度上减少了多重共线性对回归结果的影响[9]。但是,岭回归在单木断面积生长模型研究中应用较少。已有研究表明:在群落尺度上,为精准掌握森林空间结构,样地面积至少为2 500 m2[10]。然而,基于群落大型固定样地,建立包含森林空间结构变量的单木断面积生长模型研究少见报道。因此,岭回归分析应用于建立大型固定样地的单木断面积生长模型的问题值得探讨,可以在不剔除自变量的基础上,对含有不同自变量的模型进行比较,定量描述不同自变量对胸高断面积生长量的影响。

    常绿阔叶林是中国亚热带最复杂、生产力最高、生物多样性最丰富的顶级森林群落,对保护环境、维持全球性碳循环平衡和人类可持续发展等都具有极重要的作用[11]。目前,对常绿阔叶林的研究集中在空间结构[1213]、生物多样性[14]、碳储量[15]等方面,而关于单木断面积生长量的研究少见报道。本研究以浙江天目山国家级自然保护区内常绿阔叶林为对象,分析林木大小、竞争因子、地形因子与胸高断面积生长量的相关性,再对不同胸径大小、冠幅和竞争等级的胸高断面积生长量进行差异性分析,最后基于岭回归,建立以胸高断面积生长量对数为因变量的单木生长模型,定量描述胸高断面积生长量与胸径、竞争和地形因子的关系,为常绿阔叶林经营提供理论依据。

    • 天目山国家级自然保护区位于浙江省杭州市临安区西北部(30°18′30″~30°24′55″N, 119°24′11″~119°28′21″E),距杭州市中心94 km,总面积为4 284 hm2。该保护区属中亚热带向北亚热带过渡气候,受海洋暖湿气流影响,季风盛行,气候温和。年平均气温为 8.8~14.8 ℃,最冷月平均气温为−2.6~3.4 ℃,最热月平均气温为19.9~28.1 ℃。雨水充沛,年降水量为1 390~1 870 mm。森林类型多样,主要有常绿阔叶林、常绿落叶阔叶混交林、落叶阔叶林、落叶矮林、针叶林和毛竹Phyllostachys edulis林等[16]

    • 2005年,在研究区内选择代表性地段,设置100 m×100 m的常绿阔叶林固定样地,样地中心地理坐标为: 30°19′40″N, 119°26′12″E,并用相邻格子调查法将样地划分成10 m×10 m的网格单元。对网格单元进行每木检尺,记录树种、胸径、树高、活枝下高、冠幅等,并以样地西南角为原点,采用激光对中全站仪(徕卡TCR702)测定每株林木的坐标及海拔。2020年对该样地进行复查。本研究采用2005和2020年2期调查数据,从中筛选出2期均存活且胸径≥5 cm的活立木共计733株。其中,常绿阔叶优势树种有细叶青冈Cyclobalanopsis gracilis、短尾柯Lithocarpus brevicaudatus、青冈C. glauca、小叶青冈C. myrsinifolia、豹皮樟Litsea coreana等,占全部活立木的51.99%。

    • 林木的生长量指一定间隔期内林木各种调查因子的变化量,分为总生长量、定期生长量、连年生长量、定期平均生长量和总平均生长量等[17]。本研究采用2005—2020年15 a间林木胸高断面积的定期生长量。计算公式为:

      式(1)中:BAI为林木胸高断面积生长量(cm2);$D_{t_1} $和$D_{t_2} $分别为林木在t1t2时的胸径(cm)。

    • 单木生长模型主要有潜在生长量修正法、回归分析法和生长分析法[18]。本研究采用回归分析法,建立林木胸高断面积生长量对数与林木大小、竞争和立地等因子之间的回归方程[58]

      式(2)中:BAI为胸高断面积生长量;$f(x_1) $为林木大小因子的函数;$f(x_2) $为林木竞争因子的函数;$f(x_3) $为林木立地因子的函数;a为常数项;bcd为方程参数。

    • 林木大小是影响林木断面积生长量的最重要因子[6]。林木胸径是反映林木大小的最直观因子,也是预测林木生长最重要的因子之一[19]。林木胸径平方能够很好地表述林木生长趋势,即林木在幼龄时生长速度较快,成熟时生长达到顶峰,随后生长速度开始逐渐下降[2]。此外,用胸径对数进行建模分析也较常见[56]。冠幅直接影响林木进行生理活动的能力[20],因此在林木生长模型中常作为反映林木大小的变量。如 MONSERUD等[6]发现:冠长率能解释奥地利针叶树种和阔叶树种断面积生长量14%~47%的变异。本研究选取林木的胸径平方、胸径对数和冠幅来代表林木大小。这里,冠幅用冠幅半径表示,计算公式为:

      式(3)中:Cr为林木冠幅半径(m);L1L2分别为林木东西、南北冠幅半径(m)。因此,林木大小因子的函数表达式为:

      式(4)中:D为林木胸径; b1b2b3为方程参数。

    • 林木竞争限制林木生长[21]。本研究选取Hegyi竞争指数[22]及其对数形式来表示林木竞争因子的大小。其中,竞争木的选择采用汤孟平等[23]提出的基于Voronoi图的方法。Hegyi竞争指数的计算公式为:

      式(5)中: IC为对象木i的竞争指数;DiDj分别为对象木i和竞争木j的胸径(cm);Lij为对象木i与竞争木j之间的距离(m);ni为对象木i所在竞争单元的竞争木株数。因此,林木竞争因子的函数表达式为:

      式(6)中: c1c2为方程的参数。

    • 地形是影响林木生长的重要因素。如COOMES等[24]在研究新西兰的森林时,发现随着海拔的升高,林木生长率有下降的趋势;STAGE 等[25]发现:坡度、坡向、海拔的交互作用影响森林的物种组成和森林的生产力;BARIBAULT等[26]发现:森林地形的差异会导致林木间的生长有很大的不同。根据前人构建的生长模型[56],选取海拔、坡度和坡向作为模型的立地因子。其中,采用坡向指数(As)来代表坡向。坡向指数的计算公式为[2728]

      式(5)中:As为坡向指数;θ为坡向值(0°~360°)。因此,立地因子的函数表达式为:

      式(8)中:Al为林木所处的海拔;Sl为林木所处的坡度;d1d2d3分别为方程参数。将式(4)、式(6)、式(8)代入式(2)得到最终的林木胸高断面积生长模型:

    • 在 Excel 2019 中对数据进行预处理。基于林木的三维坐标,利用ArcMap 10.7插值分析提取坡度、方位角数据;基于 ArcMap 10.7 和 Python 语言编程计算每株林木的竞争指数;在 SPSS 26中采用Kolmogorov-Smirnov检验法对各因子进行正态性分析,并利用Spearman相关系数进行相关性分析;利用SPSSAU采用Kruskal-Wallis检验法(K-W)和Nemenyi法分析不同胸径大小、竞争条件下林木胸高断面积生长量的差异性,采用岭回归方法建立单木生长模型。

    • 在常绿阔叶林样地内,计算活立木在2005年时的胸径、冠幅、海拔、坡度、坡向指数、竞争指数及2005—2020年间胸高断面积生长量的均值、标准差(表1)。对各变量进行Kolmogorov-Smirnov检验,发现所有变量的显著性都小于0.05,均不符合正态分布,故用Spearman 相关系数进行相关性分析(表2)。结果表明:胸高断面积生长量与胸径、冠幅均呈现极显著正相关(P<0.01),与竞争指数呈现极显著负相关(P<0.01),与地形因子的相关系数均不显著。说明天目山常绿阔叶林的林木胸径、冠幅对林木胸高断面积的生长起到正向作用,竞争对林木胸高断面积生长起到负向作用,地形因子对林木胸高断面积生长的影响小。胸径和冠幅均与竞争指数极显著负相关(P<0.01),说明竞争抑制林木胸径和冠幅的生长。冠幅与海拔极显著正相关(P<0.01),说明海拔影响林木冠幅的生长。坡向指数与冠幅显著负相关(P<0.05),说明坡向影响林木冠幅的生长。

      项目胸径/cm冠幅/m海拔/m坡度/(°)坡向指数竞争指数2005—2020年胸高断
      面积生长量/cm²
      均值  13.15 1.86 631.53 42.50 0.41 8.44 74.80
      标准差 8.70 0.79 19.61 15.88 0.48 16.38 93.61

      Table 1.  Statistics results of each variable

      变量胸径冠幅海拔坡度坡向指数竞争指数胸高断面积生长量
      胸径 1.000
      冠幅 0.714** 1.000
      海拔 0.069 0.129** 1.000
      坡度 −0.024 −0.032 −0.006 1.000
      坡向指数 −0.035 −0.078* −0.065 0.052 1.000
      竞争指数 −0.618** −0.374** −0.020 −0.068 0.038 1.000
      胸高断面积生长量 0.531** 0.427** 0.019 −0.069 0.014 −0.340** 1.000
        说明: * P<0.05;** P<0.01。

      Table 2.  Correlation coefficients of each variable

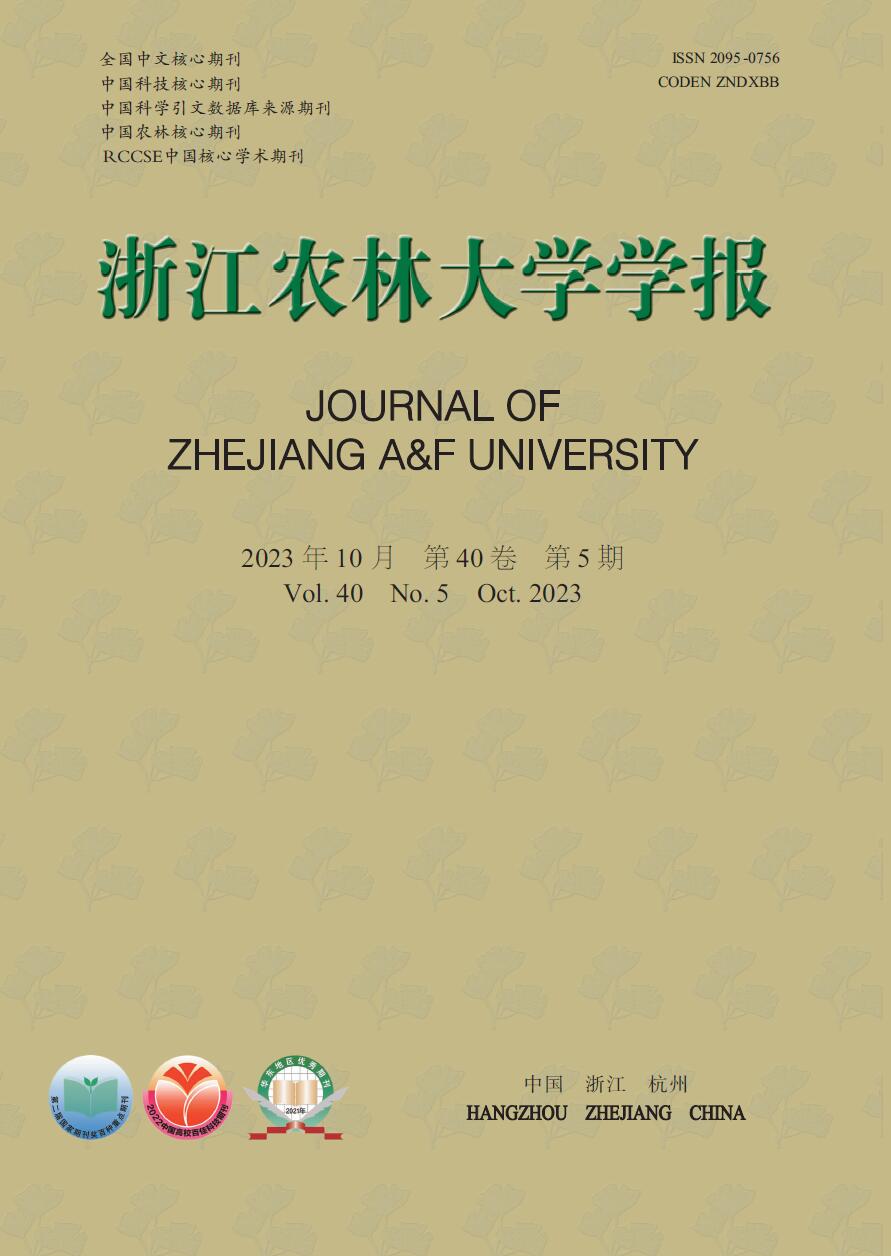
    • 样地林木胸径均值为13.15 cm,胸径最小值为5.00 cm,最大值为50.30 cm。根据林木胸径均值和分布范围,将其分为3个径级:[5.00, 9.00)、[9.00, 13.00)、[13.00, +∞),分别表示为Ⅰ径级、Ⅱ径级、Ⅲ径级。对不同径级林木的胸高断面积生长量进行Kruskal-Wallis非参数检验。结果显示:Ⅰ径级、Ⅱ径级和Ⅲ径级的胸高断面积生长量中位数分别为22.50、49.68和86.71 cm2,K-W检验的统计量(H)=185.84,P<0.01,存在极显著差异,表明胸高断面积生长量随着林木胸径的增加而增加。用Nemenyi法进一步证明(图1):Ⅰ径级、Ⅱ径级、Ⅲ径级林木的胸高断面积生长量两两之间差异极显著(P<0.01)。说明林木胸径大小是导致胸高断面积生长量差异的主要因子之一。

      Figure 1.  Breast-height basal area increment for different diameter classes        

    • 样地林木冠幅均值为1.86 m,冠幅最小值为0.25 m,最大值为6.11 m。根据林木冠幅均值和分布范围,将其分为3个等级:[0.25, 1.35)、[1.35, 2.45)、[2.45, +∞),分别表示为Ⅰ冠幅、Ⅱ冠幅、Ⅲ冠幅。对不同冠幅等级林木的胸高断面积生长量进行Kruskal-Wallis非参数检验。结果显示:Ⅰ冠幅、Ⅱ冠幅和Ⅲ冠幅林木的胸高断面积生长量的中位数分别为24.03、37.37和90.65 cm2H=96.627,P=0.000<0.01,存在极显著差异,林木胸高断面积生长量随着林木冠幅的增加而增加。用Nemenyi法进一步证明(图2):Ⅰ冠幅与Ⅱ冠幅、Ⅲ冠幅林木的胸高断面积生长量两两之间差异极显著(P<0.01)。说明,林木冠幅大小是导致胸高断面积生长量差异的主要因素之一。

      Figure 2.  Breast-height basal area increment for different crown classes

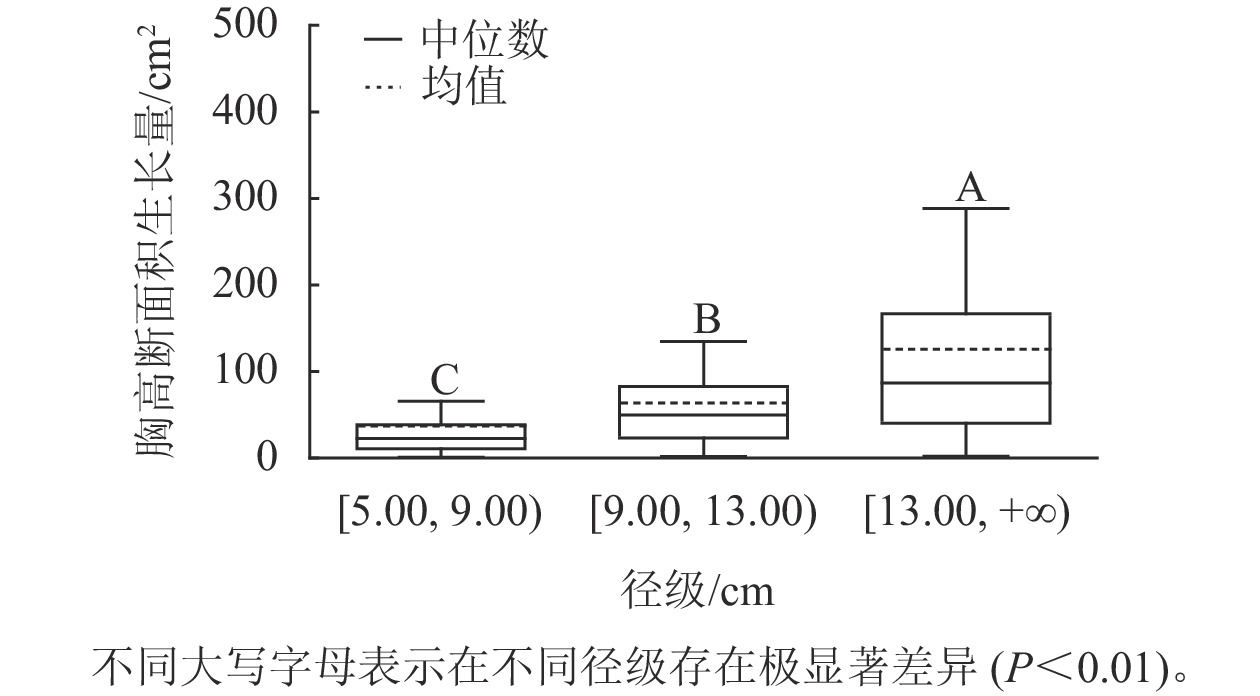
    • 样地林木竞争指数均值为8.44,竞争指数最小值为0.47,最大值为217.79。根据林木竞争指数均值和分布范围,将其分为3个等级:[0, 4.00)、[4.00, 8.00)、[8.00, +∞),分别用Ⅰ竞争、Ⅱ竞争和Ⅲ竞争表示,对应3个竞争强度等级:低度、中度、强度。不同等级的竞争指数代表林木受到的竞争压力大小不同,数值越大,竞争压力越大。对不同竞争强度等级林木的胸高断面积生长量进行K-W非参数检验。结果显示:Ⅰ竞争、Ⅱ竞争和Ⅲ竞争林木的胸高断面积生长量的中位数分别为67.90、27.14和29.90 cm2H=67.434,P<0.01,存在极显著差异;不同竞争强度等级的林木的胸高断面积生长量不同,低度竞争强度的林木胸高断面积生长量最大。用Nemenyi法进一步证明(图3):低度竞争与中度竞争、强度竞争林木的胸高断面积生长量呈现极显著差异(P<0.01)。低度竞争林木的胸高断面积生长量中位数最大,说明林木受到的竞争压力越小,有利于提高林木胸高断面积生长量。

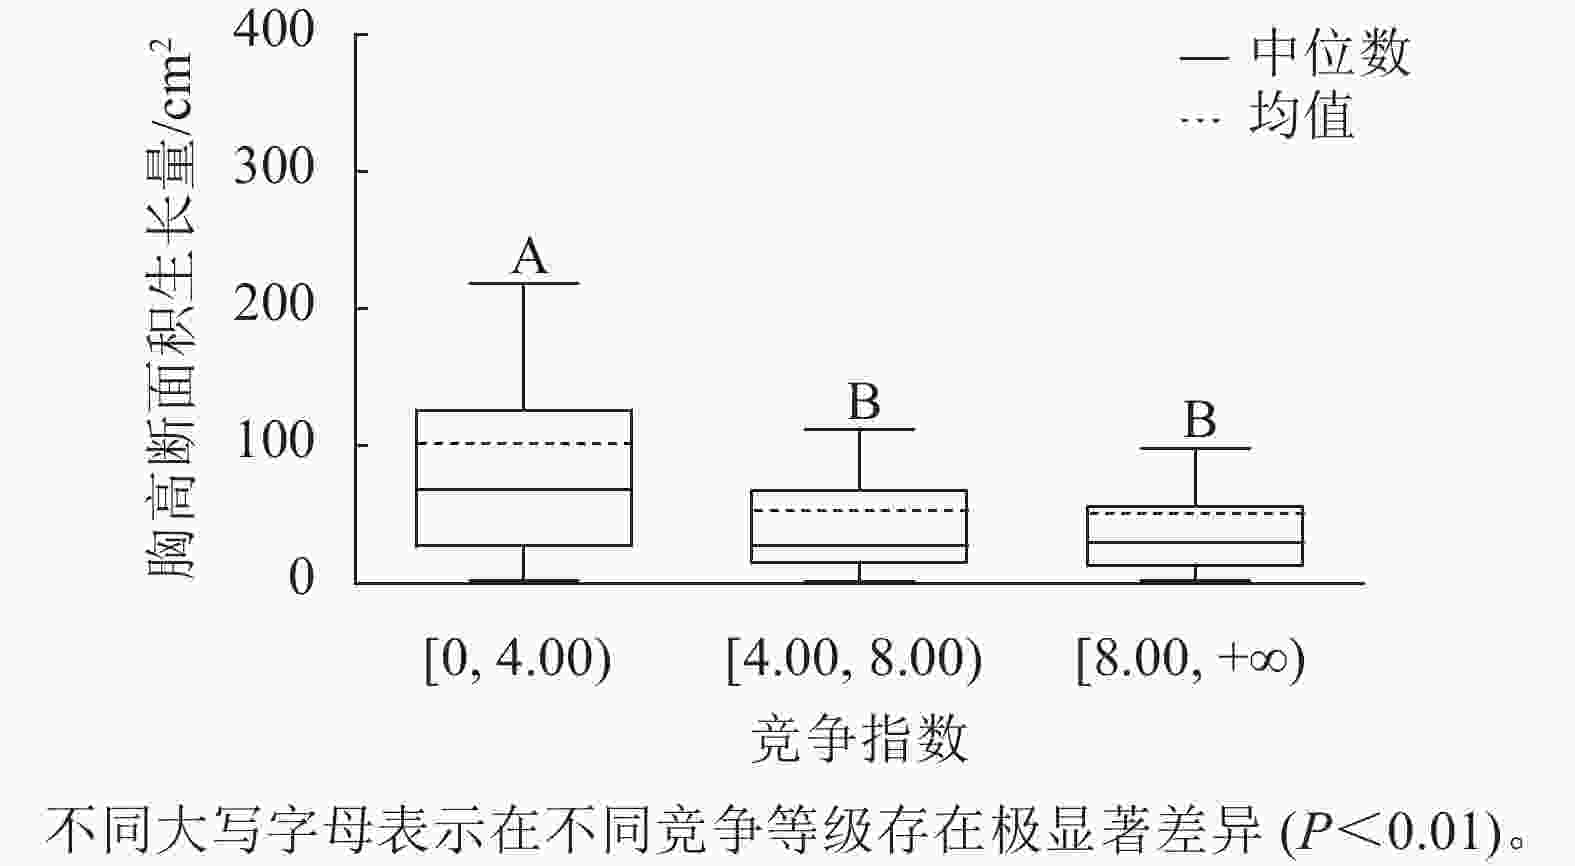
      Figure 3.  Breast-height basal area increment for different competition classes

    • 因为冠幅、竞争指数与胸径相关系数的绝对值均大于0.6,所以进行最小二乘回归时存在共线性问题。因此,本研究为探究胸径和竞争指数对胸高断面积生长量的影响,以式(9)为基础模型,林木胸高断面积生长量对数为因变量,冠幅、海拔、坡度和坡向指数为控制变量,分别以胸径平方、胸径对数、竞争指数和竞争指数对数的不同组合为自变量进行岭回归,得到基于单株林木的单木生长模型(表3);对2005年调查的林木胸径按2 cm为组距进行径阶整化,对林木大小因子、竞争因子和立地因子计算其每一径阶的平均值,以每一径阶内林木胸高断面积生长量对数的平均值为因变量,冠幅、海拔、坡度和坡向指数等因子的平均值为控制变量,分别以每一径阶内胸径平方、胸径对数、竞争指数和竞争指数对数的平均值的不同组合为自变量进行岭回归,得到基于径阶平均值的单木生长模型(表4)。其中2类岭回归模型的K值采用SPSSAU给予的推荐值。

      模型常数lnDD2CrlnICICAlSlAsR2调整R2F
      模型12.472**0.350**0.000**0.169**−0.063**0.0020.000−0.002*0.0430.2670.25832.895**
      模型22.510**0.438**0.202**−0.087**0.0020.000−0.003*0.0400.2480.24034.091**
      模型33.121**0.001**0.226**−0.097**0.0020.000−0.003*0.0380.2280.22130.639**
      模型43.435**0.300**−0.148**0.0020.000−0.003*0.0310.1650.15823.970**
      模型52.459**0.348**0.000**0.169**−0.051**0.000−0.003*0.0430.2640.25637.076**
      模型62.323**0.369**0.000**0.173**0.0010.000−0.0020.0430.2650.25837.325**
      模型72.330**0.367**0.000**0.173**0.000−0.002*0.0430.2640.25843.402**
      模型82.497**0.437**0.202**−0.075**0.000−0.003*0.0400.2440.23839.076**
      模型92.303**0.473**0.211**0.7260.000−0.0020.0400.2420.23638.712**
      模型103.107**0.001**0.226**−0.087**0.000−0.003*0.0380.2250.21935.221**
      模型112.941**0.001**0.238**0.0000.000−0.0020.0370.2200.21334.109**
        说明: D. 胸径; Cr. 冠幅;IC. Hegyi竞争指数;Al. 海拔; Sl. 坡度; As. 坡向指数;*P<0.05;** P<0.01;表中数值均为模型回归系数。

      Table 3.  Individual tree growth models based on individual tree

      模型常数lnDD2CrlnICICAlSlAsR2调整R2F
      模型1211.245*0.351**0.000**0.232**−0.098−0.037**−0.0140.0130.2870.9490.91730.114**
      模型1311.2861.238**0.252−0.1020.057−0.0190.0180.3840.9560.93343.045**
      模型1412.499*0.000**0.266**−0.128**−0.058**−0.015*0.0120.2320.9310.89727.004**
      模型1515.728**0.285**−0.156**−0.063**−0.019*0.0150.2190.8430.78013.395**
      模型169.9040.470**0.264**−0.120*−0.0130.0110.2540.9510.92739.004**
      模型1713.085*0.404**0.000**0.213**−0.045**−0.018*0.0140.2430.9470.92035.603**
      模型1812.101*0.555**0.000**0.249**−0.017*0.0130.1720.9450.92443.334**
      模型1913.520*0.796**0.293**−0.122−0.021*0.0190.3600.9470.92544.235**
      模型2014.260*1.341**0.1970.045−0.025*0.0210.3780.9520.93349.636**
      模型2112.695**0.000**0.283**−0.160**−0.015*0.0100.1460.8580.80215.164**
      模型2214.932**0.000**0.261**−0.071**−0.019*0.0140.1540.9220.89029.406**
        说明: D. 胸径; Cr. 冠幅;IC. Hegyi竞争指数;Al. 海拔; Sl. 坡度; As. 坡向指数;*P<0.05; ** P<0.01;表中数值均为模型回归系数。

      Table 4.  Individual tree growth models based on average of diameter grade

      在基于单株林木的单木生长模型中(表3),比较模型2和模型3、模型8和模型10、模型9和模型11,发现含有胸径对数的模型比含有胸径平方的模型拟合精度高;比较模型1~模型4,发现含有胸径因子的模型拟合精度优于不含胸径的模型;比较模型1、模型5、模型6和模型7,有无竞争指数对模型的拟合精度影响小;比较模型1~模型11,发现模型中常数项、胸径对数、胸径平方、冠幅和竞争指数对数的回归系数均极显著(P<0.01),说明胸径、冠幅和竞争指数对数是单木生长模型中的重要因子;比较模型1~模型11的R2及调整后的R2,模型1是基于单株林木的单木生长模型中的最优模型,该模型中的常数项、胸径对数、胸径平方、冠幅、竞争指数对数和坡度等回归系数显著(P<0.05)。

      在基于径阶平均值的单木生长模型中(表4),比较模型13和模型14、模型19和模型21、模型20和模型22,发现含有胸径对数的模型比含有胸径平方的模型拟合精度高;比较模型12~模型15,发现含有胸径因子的模型拟合精度优于不含胸径因子的模型;比较模型12、模型16、模型17和模型18,有无竞争指数对模型的拟合精度影响小;比较模型12~模型22,发现模型中胸径对数和胸径平方的回归系数均显著(P<0.05),说明胸径是基于径阶平均值的单木生长模型中的重要因子;比较模型12~模型22的R2及调整后的R2,得出模型13是基于径阶平均值单木生长模型中的最优模型,该模型中胸径对数的回归系数极显著(P<0.01)。

      比较表3表4中的模型,发现2类生长模型中胸径因子的回归系数均显著,且含有胸径因子的模型拟合精度均优于不含胸径因子的模型;基于径阶平均值的单木生长模型拟合精度高于基于单株林木的单木生长模型。

    • 通过对胸径与胸高断面积生长量进行Spearman相关分析和Kruskal-Wallis检验,发现胸径与胸高断面积生长量呈正相关,且胸高断面积生长量随着胸径的增大而增大。该结论与多数学者的研究一致,如CHI等[29]在研究中国神农架常绿落叶阔叶混交林的林木大小、相邻木和立地条件对林木生长的影响时发现,林木的生长量与初始胸径大小具有显著的相关关系 ,并且随着初始胸径的增大而增大。FIEN等[30]对美国缅因州中部的异龄林单木生长和死亡的影响因子进行了研究,认为树种的胸高断面积与胸径均呈显著正相关。有研究表明:林木生长通常会先随胸径的增大而增加,在达到一定阶段后又会随胸径的增大而减小[31]。但也有研究指出:不同的森林类型,林木生长与胸径的关系有较大差异[32]

      竞争与胸高断面积生长量的Spearman相关分析表明:竞争与胸高断面积生长量呈现负相关关系,低度竞争强度有助于林木生长。这个结论与前人的研究结果基本一致,de GROOTE等[33]研究了比利时北部森林竞争对夏栎Quercus robur、欧洲山毛榉Fagus sylvatica和红槲栎Q. rubra生长的影响,指出竞争与断面积生长量呈负相关。窦啸文等[34]在研究天目山针阔混交林竞争对生长的影响时,证实林木胸高断面积生长量与Hegyi竞争指数服从对数函数关系,且胸高断面积生长量与竞争指数显著负相关。

      分析地形因子与胸高断面积生长量的相关性发现:海拔、坡向、坡度等地形因子与胸高断面积生长量的相关性较小。POMPA-GARCÍA等[35]研究了地形对墨西哥针叶树生长的影响,指出林木基部断面积生长量随海拔的变化有显著差异,海拔1 001~1 500 m的地区林木基部断面积生长量较高。本研究所选取的林木在同一固定样地内,海拔范围为575~677 m,地形变化不大,因此对林木生长影响较小。

      本研究中竞争指数的回归系数并非都在单木生长模型达显著水平,这可能与竞争指数的选择有关。有研究表明:在选择与距离有关的竞争指数时,包含树冠因子的竞争指数优于胸径大小比值的竞争指数[31]。而本研究中冠幅因子的回归系数均在单木生长模型达到显著水平,这也验证了这一观点。但是,也有学者认为采用与距离无关的竞争指数的生长模型的拟合精度优于采用与距离相关的竞争指数的生长模型[36]。针对常绿阔叶林的生长模型,与距离无关的竞争指数是否优于与距离有关的竞争指数值得探讨。

      林木生长还受光照、温度、 水和土壤等因子的影响[3741],本研究未考虑这些因素。近些年来,有学者构建了不同树种的生长混合效应模型,发现混合效应模型的拟合精度明显优于一般模型[4245]。因此,在进一步研究中,可构建多因子的混合效应模型,综合分析影响林木胸高断面积生长量的因素。

    • 通过对浙江天目山国家级自然保护区内的常绿阔叶林的林木胸高断面积生长量的影响因子进行分析,得出以下主要结论:①胸径、冠幅和竞争指数与胸高断面积生长量的相关性高,地形因子与胸高断面积生长量的相关性低。②不同径级、冠幅等级和竞争指数等级的胸高断面积生长量差异性显著。③基于径阶平均值的单木生长模型拟合精度高于基于单株林木的单木生长模型,且胸径和冠幅的回归系数均显著。④影响常绿阔叶林胸高断面积生长量的主要因子是林木胸径、冠幅和竞争指数,海拔、坡度等地形因子对胸高断面积生长量的影响不大。

Reference (45)

Catalog

    /

    DownLoad:  Full-Size Img  PowerPoint
    Return
    Return