QIAN Li, ZHANG Chao, QI Peng, et al. Sourcing and evaluating heavy metal pollution in the urban topsoil of Yongkang City[J]. Journal of Zhejiang A&F University, 2016, 33(3): 427-433. DOI: 10.11833/j.issn.2095-0756.2016.03.008
Citation: QIAN Li, ZHANG Chao, QI Peng, et al. Sourcing and evaluating heavy metal pollution in the urban topsoil of Yongkang City[J]. Journal of Zhejiang A&F University, 2016, 33(3): 427-433. DOI: 10.11833/j.issn.2095-0756.2016.03.008

Sourcing and evaluating heavy metal pollution in the urban topsoil of Yongkang City

DOI: 10.11833/j.issn.2095-0756.2016.03.008
  • Received Date: 2015-04-10
  • Rev Recd Date: 2015-05-27
  • Publish Date: 2016-06-01
  • To assess pollution characteristics and the degree of heavy metal pollution and to discuss their probable sources, the topsoil of Yongkang City was divided into seven zones based on a survey of the region. Altogether 203 urban soil samples were collected, and ten kinds of heavy metal elements were analyzed. Then a single factor evaluation and the Nemerow integrated pollution index for different functional zones were employed to investigate pollution characteristics of heavy metals. Also a multivariate statistical analysis was used to analyze sample dates. Results showed that mean concentrations for heavy metals (in mg·kg-1) were As (6.57), Co(10.57), Cr(119.55), Cu(22.97), Mn(528.51), Ni 22.45), Pb(37.67), Ti(5 751.81), V(84.37), and Zn(90.25). The single factor integrated pollution index for order of different heavy metals was Cr > Ni > V > Co > Ti > Cu > Zn > Mn > Pb > As, and the Nemerow integrated pollution index order was industrial zone > traffic zone > parkland zone > residential zone > woodland zone > municipal zone > cultivated land. Results of the principal component analysis indicated that Cr, Cu, Ni, Pb, and Zn were mainly from hardware manufacturing industry and local transportation; As and V came from industrial and natural soil forming processes; and Co and Ti mainly originated from hardware manufacturing industry.[Ch, 2 fig. 8 tab. 22 ref.]
  • [1] WANG Shuang, DONG Bin, WANG Yiguang, ZHAO Hongbo.  Analysis and evaluation of flower and fruit characteristics of different Prunus mume cultivars . Journal of Zhejiang A&F University, 2024, 41(1): 113-123. doi: 10.11833/j.issn.2095-0756.20230213
    [2] WANG Xiaoxuan, HE Shiyang, YE Zihao, HU Yingbin, FU Weijun, WU Jiasen.  Spatial variability and affecting factors of soil fertility in Chinese hickory stands at village scale . Journal of Zhejiang A&F University, 2023, 40(4): 811-819. doi: 10.11833/j.issn.2095-0756.20220544
    [3] WANG Yan, YU Yun, LIU Yong, WANG Kaiyong, ZHOU Xiaojie, WANG Yang.  Health assessment and influencing factors of Fraxinus pennsylvanica in Beijing core area . Journal of Zhejiang A&F University, 2022, 39(6): 1340-1349. doi: 10.11833/j.issn.2095-0756.20220109
    [4] HUO Yan, ZHAO Xueqing, HUANG Houyi, HUANG Xianbin, XU Yunfang, ZHU Zunling, YUAN Zhaohe.  Phenotypic genetic diversity of ornamental pomegranate cultivars . Journal of Zhejiang A&F University, 2020, 37(5): 939-949. doi: 10.11833/j.issn.2095-0756.20190619
    [5] TANG Sijia, TANG Mengping, SHEN Qianyong, DU Xiufang, PANG Chunmei.  Relationship of spatial structure and regeneration dynamics in Phyllostachys edulis . Journal of Zhejiang A&F University, 2018, 35(1): 1-9. doi: 10.11833/j.issn.2095-0756.2018.01.001
    [6] LIU Xiaoxiao, DAI Wei, DAI Aona.  Soil enzyme activity and their kinetics in broadleaf forests of Beijing mountainous areas . Journal of Zhejiang A&F University, 2018, 35(5): 794-801. doi: 10.11833/j.issn.2095-0756.2018.05.002
    [7] LIANG Licheng, YU Shuquan, ZHANG Chao, QIAN Li, QI Peng.  Spatial distribution and ecological risk assessment of heavy metals in Yongkang City . Journal of Zhejiang A&F University, 2017, 34(6): 972-982. doi: 10.11833/j.issn.2095-0756.2017.06.002
    [8] ZHANG Guanglai, LI Lu, LIAO Wenmei.  Principal component analysis of China's forestry industry competitiveness . Journal of Zhejiang A&F University, 2016, 33(6): 1078-1084. doi: 10.11833/j.issn.2095-0756.2016.06.022
    [9] TOU Peiming, SUN Shufang, ZHANG Xinfeng, SI Jinping, LIU Jingjing.  Mineral elements in Chrysanthemum morifolium at different harvest stages . Journal of Zhejiang A&F University, 2013, 30(6): 858-862. doi: 10.11833/j.issn.2095-0756.2013.06.009
    [10] ZHENG Rong.  Canonical correlation and principal components analysis of different production areas of Dendrocalamopsis oldhami with quality indicators of bamboo shoots and its soil nutrients . Journal of Zhejiang A&F University, 2012, 29(5): 710-714. doi: 10.11833/j.issn.2095-0756.2012.05.012
    [11] YANG Jian-hua, LI Shu-fang, FAN Zhi-yuan, XI Xue-liang, ZOU Wei-lie, LIU Jiao, PAN Li.  Principal component analysis for major economic characteristics of Carya illinoensis and selection of superior cultivars . Journal of Zhejiang A&F University, 2011, 28(6): 907-910. doi: 10.11833/j.issn.2095-0756.2011.06.011
    [12] WANG Rong.  Principal component analysis and evaluation of waterfowl habitats along the coastline of Fujian Province . Journal of Zhejiang A&F University, 2011, 28(3): 472-478. doi: 10.11833/j.issn.2095-0756.2011.03.020
    [13] DU Li-hua, JIANG Hao, XUE Liang-yi, RUAN Xiao, WANG Qiang.  Analysis of metallic elements in Porphyra haitanensis by ICP-OES . Journal of Zhejiang A&F University, 2010, 27(5): 790-793. doi: 10.11833/j.issn.2095-0756.2010.05.025
    [14] WANG Gen-mei, ZHANG Huan-chao, YANG Li.  A pot experiment for poplar growth and soil quality with sewage sludge application . Journal of Zhejiang A&F University, 2010, 27(3): 385-390. doi: 10.11833/j.issn.2095-0756.2010.03.011
    [15] DAI Wen-sheng, LI Zhang-ju, CHENG Xiao-jian, YU Wei-wu, FU Qing-gong.  Mineral elements in Torreya grandis 'Merrillii' seeds and their forest soils . Journal of Zhejiang A&F University, 2006, 23(4): 393-399.
    [16] Zhu Xi, Chen Changqing, Ni Yingsheng.  A Prelilninary Survey of Amphibian Fauna in Yongkang of zhejiang. . Journal of Zhejiang A&F University, 1996, 13(2): 197-199.
    [17] Chen Changqing, Zhu Xi, Ni Yingsheng, Chen Xiefu.  Terrestrial Vertebrates in YongkangCity。 . Journal of Zhejiang A&F University, 1996, 13(2): 163-169.
    [18] Zi luXi, Jiang Yongjin, Yu Tianxi, Zhou Quanlou.  A Preliminary Survey of reptilies in Yongkang City. . Journal of Zhejiang A&F University, 1996, 13(2): 194-196.
    [19] Zhuxi, Chen Changqi, Jiang youngjin, Yu tianxi.  Studies on the Avifauna in Yongkang of Zhejiang . Journal of Zhejiang A&F University, 1996, 13(2): 174-193.
    [20] ZiluXi, Ni Yingsheng, Yu Tianxi, Tong Zhusheng.  A Preliminary Survey of Mammals in Yongkang City. . Journal of Zhejiang A&F University, 1996, 13(2): 170-173.
  • [1]
    ZHANG Hao, WANG Ji, ZENG Xibai, et al. Heavy metal pollution in urban soil and eco-environmental effect [J]. Admin Tech Environ Monit, 2010, 22(2): 11-18.
    [2]
    LIN Xiaofeng. Assessment of Heavy Metal Pollution in the Urban Topsoil of Quanzhou City [D]. Quanzhou: Hua Qiao University, 2011.
    [3]
    HE Yusheng. Pollution characteristics and ecological risk assessment of heavy metals in Haikou urban soils [J]. Chin J Ecol, 2014, 33(2): 421-428.
    [4]
    LUO Xiaosan, YU Shen, ZHU Yongguan, et al. Trace metal contamination in urban soils of China [J]. Sci Total Environ, 2012, 421/422(3): 17-30.
    [5]
    XIA Xinghui, CHEN Xi, LIU Ruimin, et al. Heavy metals in urban soils with various types of land use in Beijing, China[J]. J Hazardous Mater, 2011, 186(2/3): 2043-2050.
    [6]
    LU Ying, GONG Zitong, ZHANG Ganlin, et al. Heavy metal concentration in Nanjing urban soils and their affecting factors [J]. Chin J Appl Ecol, 2004, 15(1): 123-126.
    [7]
    DUAN Huimin. The Study on Heavy Metal Pollution of Urban Soils in Yongkang [D]. Jinhua: Zhejiang Normal University, 2012.
    [9]
    WANG Qinghua, DONG Yanxiang, ZHENG Wen, et al. Soil geochemical bascline values and environmental background values in Zhejiang, China [J]. Geol Bull China, 2007, 26(5): 590-597.
    [11]
    KANG Caixia. Study on Evaluation and Spatial Distribution Characteristics of Heavy Metal Pollution in Soil of Harbin Base on GIS and Geo-statistice [D]. Changchun: Jilin University, 2009.
    [12]
    LI Yuwen, WANG Su, CUI Xiaoyang. The different land-use types characteristics of heavy metal pollution in China’s Northeastern Old Industrial Base [J]. Environ Sci Manage, 2011, 36(3): 118-122.
    [13]
    HAN Yongming, DU Peixuan, CAO Junji, et al. Multivariate analysis of heavy metal contamination in urban dusts of Xi’an, Central China [J]. Sci Total Environ, 2006, 355(1/3): 176-186.
    [14]
    XU Jinduo. Research on Spatial Distribution and Pollution Evaluation of Hearvy Metals in Soil of Jinhua City Based on GIS [D]. Nanjing: Nanjing Normal University, 2008.
    [15]
    MA Wanghai, CAO Bin, YANG Jinfeng, et al. Characteristics of urban heavy metal pollution [J]. J Cent Univ National Nat Sci Ed, 2008, 17(1/2): 66-73.
    [16]
    PATERSON E, SANKA M, CLARK L. Urban soils as pollutant sinks: a case study from Aberdeen, Scotland [J]. Appl Geochem, 1996, 11(1/2): 129-131.
    [18]
    BI Xiangyang, LIANG Siyuang, LI Xiangdong. A novel in situ method for sampling urban soil dust: particle size distribution, trace metal concentrations, and stable lead isotopes [J]. Environ Pollut, 2013, 177(4): 48-57.
    [19]
    ZHU Zongmin, SUN Guangyi, BI Xiangyang, et al. Identification of trace metal pollution in urban dust from kindergartens using magnetic, geochemical and lead isotopic analyses [J]. Atmo Environ, 2013, 77(3): 9-15.
    [22]
    FACCHINELLI A, SACCHI E, MALLEN L. Multivariate statistical and GIS-based approach to identify heavy metal sources in soils [J]. Environ Poll, 2001, 114(3): 313-324.
  • Created with Highcharts 5.0.7Amount of accessChart context menuAbstract Views, HTML Views, PDF Downloads StatisticsAbstract ViewsHTML ViewsPDF Downloads2024-052024-062024-072024-082024-092024-102024-112024-122025-012025-022025-032025-040Highcharts.com
    Created with Highcharts 5.0.7Chart context menuAccess Class DistributionFULLTEXT: 28.2 %FULLTEXT: 28.2 %META: 71.1 %META: 71.1 %PDF: 0.7 %PDF: 0.7 %FULLTEXTMETAPDFHighcharts.com
    Created with Highcharts 5.0.7Chart context menuAccess Area Distribution其他: 3.3 %其他: 3.3 %其他: 0.0 %其他: 0.0 %China: 0.9 %China: 0.9 %Falls Church: 0.0 %Falls Church: 0.0 %Rochester: 0.0 %Rochester: 0.0 %[]: 0.1 %[]: 0.1 %上海: 1.1 %上海: 1.1 %东莞: 0.0 %东莞: 0.0 %丽水: 0.1 %丽水: 0.1 %六安: 0.0 %六安: 0.0 %兰辛: 0.0 %兰辛: 0.0 %凉山: 0.0 %凉山: 0.0 %北京: 22.0 %北京: 22.0 %十堰: 0.0 %十堰: 0.0 %南充: 0.1 %南充: 0.1 %南阳: 0.2 %南阳: 0.2 %博阿努瓦: 0.1 %博阿努瓦: 0.1 %台州: 0.8 %台州: 0.8 %合肥: 0.0 %合肥: 0.0 %呼和浩特: 0.0 %呼和浩特: 0.0 %哈尔滨: 0.2 %哈尔滨: 0.2 %哥伦布: 0.0 %哥伦布: 0.0 %嘉兴: 0.1 %嘉兴: 0.1 %天津: 0.3 %天津: 0.3 %宁德: 0.0 %宁德: 0.0 %宜春: 0.2 %宜春: 0.2 %平顶山: 0.0 %平顶山: 0.0 %广州: 0.2 %广州: 0.2 %张家口: 0.9 %张家口: 0.9 %扬州: 0.0 %扬州: 0.0 %朝阳: 0.1 %朝阳: 0.1 %杭州: 2.1 %杭州: 2.1 %格兰特县: 0.0 %格兰特县: 0.0 %武汉: 0.2 %武汉: 0.2 %汕头: 0.0 %汕头: 0.0 %深圳: 0.3 %深圳: 0.3 %温州: 0.2 %温州: 0.2 %湖州: 0.3 %湖州: 0.3 %漯河: 0.1 %漯河: 0.1 %漳州: 0.0 %漳州: 0.0 %潍坊: 0.0 %潍坊: 0.0 %石嘴山: 0.1 %石嘴山: 0.1 %石家庄: 0.3 %石家庄: 0.3 %纽约: 0.0 %纽约: 0.0 %绍兴: 0.3 %绍兴: 0.3 %芒廷维尤: 5.9 %芒廷维尤: 5.9 %芝加哥: 0.3 %芝加哥: 0.3 %苏州: 0.2 %苏州: 0.2 %衢州: 0.3 %衢州: 0.3 %西宁: 56.7 %西宁: 56.7 %西安: 0.1 %西安: 0.1 %运城: 0.2 %运城: 0.2 %郑州: 0.4 %郑州: 0.4 %重庆: 0.0 %重庆: 0.0 %金华: 0.4 %金华: 0.4 %长春: 0.0 %长春: 0.0 %长沙: 0.2 %长沙: 0.2 %长治: 0.0 %长治: 0.0 %阳泉: 0.2 %阳泉: 0.2 %青岛: 0.0 %青岛: 0.0 %黔西南: 0.2 %黔西南: 0.2 %其他其他ChinaFalls ChurchRochester[]上海东莞丽水六安兰辛凉山北京十堰南充南阳博阿努瓦台州合肥呼和浩特哈尔滨哥伦布嘉兴天津宁德宜春平顶山广州张家口扬州朝阳杭州格兰特县武汉汕头深圳温州湖州漯河漳州潍坊石嘴山石家庄纽约绍兴芒廷维尤芝加哥苏州衢州西宁西安运城郑州重庆金华长春长沙长治阳泉青岛黔西南Highcharts.com
  • Cited by

    Periodical cited type(15)

    1. 赵鹏,肖佩文,Muhammad ADNAN,肖保华,薛生国. 中南某废弃铅冶炼场地土壤剖面重金属污染成因及风险评估. 矿物岩石地球化学通报. 2023(02): 360-368 .
    2. 李梦飞. 河南某钢铁冶炼厂土壤重金属污染评价及来源解析. 化工管理. 2023(27): 67-72 .
    3. 杨双喜,王海滨,张朝阳,汪娌娜,俞幸幸,洪丽虹,张琦. 宁波市海曙区地产蔬菜7种重金属污染特征及健康风险评估. 中国公共卫生管理. 2022(06): 836-840 .
    4. 马佳燕,马嘉伟,柳丹,傅伟军,叶正钱. 杭嘉湖平原水稻主产区土壤重金属状况调查及风险评价. 浙江农林大学学报. 2021(02): 336-345 . 本站查看
    5. 彭博,刘鹏,王妍,张叶飞,杨波. 普者黑流域表层水和沉积物中重金属污染特征及风险评价. 浙江农林大学学报. 2021(04): 746-755 . 本站查看
    6. 任加国,龚克,马福俊,谷庆宝,武倩倩. 基于BP神经网络的污染场地土壤重金属和PAHs含量预测. 环境科学研究. 2021(09): 2237-2247 .
    7. 胡飞跃,贾黎黎. 珠江口西岸土壤重金属元素相关性分析. 云南地质. 2021(04): 400-407 .
    8. 刘春跃,王辉,白明月,赵悦铭,吴昊,王晓旭,赵思聪. 沈阳市老城区表层土壤重金属分布特征及风险评价. 环境工程. 2020(01): 167-171 .
    9. 张雪梅. 广州某区重点企业土壤重金属污染及生态风险评价. 广州化工. 2020(15): 152-154+197 .
    10. 张华兵,李玉凤,韩爽,张亚楠,刘玉卿. 江苏盐城滨海湿地入海河流重金属污染的时空分布特征. 环境污染与防治. 2020(12): 1491-1495 .
    11. 陈洁,施维林,张一梅,宋吟玲. 电镀厂遗留场地污染分析及健康风险空间分布评价. 环境工程. 2018(04): 153-159 .
    12. 罗婷,丁颖,孙健雄,邹伟民,周峰. 江苏苏北湿地土壤重金属污染特征及评价. 环境化学. 2018(05): 984-993 .
    13. 王冠,陈裕颖,夏敦胜,任非凡,方爱冬,马丽娟. 上海城市表土磁性特征对重金属污染的指示作用. 环境科学学报. 2018(08): 3302-3312 .
    14. 郭秋松,刘志强,朱薇,张魁芳. 水钴矿湿法冶金废渣抑制钴、钒浸出毒性工艺研究. 环境工程技术学报. 2018(01): 98-103 .
    15. 宋立杰,诸毅,安淼,戴世金,赵由才,林姝灿. 土壤重金属污染修复技术综述. 山东化工. 2018(10): 203-207 .

    Other cited types(6)

通讯作者: 陈斌, bchen63@163.com
  • 1. 

    沈阳化工大学材料科学与工程学院 沈阳 110142

  1. 本站搜索
  2. 百度学术搜索
  3. 万方数据库搜索
  4. CNKI搜索

Figures(2)  / Tables(8)

Article views(3146) PDF downloads(560) Cited by(21)

Related
Proportional views

Sourcing and evaluating heavy metal pollution in the urban topsoil of Yongkang City

doi: 10.11833/j.issn.2095-0756.2016.03.008

Abstract: To assess pollution characteristics and the degree of heavy metal pollution and to discuss their probable sources, the topsoil of Yongkang City was divided into seven zones based on a survey of the region. Altogether 203 urban soil samples were collected, and ten kinds of heavy metal elements were analyzed. Then a single factor evaluation and the Nemerow integrated pollution index for different functional zones were employed to investigate pollution characteristics of heavy metals. Also a multivariate statistical analysis was used to analyze sample dates. Results showed that mean concentrations for heavy metals (in mg·kg-1) were As (6.57), Co(10.57), Cr(119.55), Cu(22.97), Mn(528.51), Ni 22.45), Pb(37.67), Ti(5 751.81), V(84.37), and Zn(90.25). The single factor integrated pollution index for order of different heavy metals was Cr > Ni > V > Co > Ti > Cu > Zn > Mn > Pb > As, and the Nemerow integrated pollution index order was industrial zone > traffic zone > parkland zone > residential zone > woodland zone > municipal zone > cultivated land. Results of the principal component analysis indicated that Cr, Cu, Ni, Pb, and Zn were mainly from hardware manufacturing industry and local transportation; As and V came from industrial and natural soil forming processes; and Co and Ti mainly originated from hardware manufacturing industry.[Ch, 2 fig. 8 tab. 22 ref.]

QIAN Li, ZHANG Chao, QI Peng, et al. Sourcing and evaluating heavy metal pollution in the urban topsoil of Yongkang City[J]. Journal of Zhejiang A&F University, 2016, 33(3): 427-433. DOI: 10.11833/j.issn.2095-0756.2016.03.008
Citation: QIAN Li, ZHANG Chao, QI Peng, et al. Sourcing and evaluating heavy metal pollution in the urban topsoil of Yongkang City[J]. Journal of Zhejiang A&F University, 2016, 33(3): 427-433. DOI: 10.11833/j.issn.2095-0756.2016.03.008
  • 城市土壤作为地球土壤圈的重要组成部分,是构成城市环境的一部分,在人类居住环境质量、城市生态功能等方面有着重要的作用[1]。随着城市化的推进,人类活动将大量的污染物带入城市环境中[2],城市土壤中的重金属通过地面扬尘、食物链传递等途径破坏城市生态环境,造成了城市环境污染,并在一定程度上威胁人类的健康[3]。中国对于城市土壤重金属的研究起步较晚,但目前相关学者已对许多大中型城市[4],如海口[3]、北京[5]、南京[6]等地土壤铅(Pb),锌(Zn),铜(Cu),铬(Cr),钛(Ti)等重金属污染含量、分布、来源等方面进行研究。浙江省永康市主要以防盗门、滑板车、五金机械、建材等为主要支柱产业,产业的集聚,给当地带来了巨大的规模效应,但却对周边环境造成了一定程度的影响[7]。本研究基于浙江省土壤表层背景值[8]和金衢盆地土壤背景值[9],研究土壤表层重金属来源,为全面了解永康城市土壤表层重金属的污染现状积累基础资料,准确评估永康市城市发展、规划管理及环境保护提供参考依据。

  • 永康市,隶属浙江省金华市,位于浙江省中部低山丘陵地区,地理坐标为28°46′~29°07′N,119°53′~120°21′E。永康市是浙江中部城市群副中心城市,五金机械、电动工具、防盗门、保温杯、滑板车等制造业集中,是全国现代五金产业中心之一[7]。本次研究土壤采集的采样点遍及永康市城市范围,西启城西新区,东至五金工业园,北启西城街道,南至江南街道。

  • 本研究在永康市城区7种不同土地利用类型内采集土壤样品,利用手持式能量色散型X射线荧光分析仪研究砷(As),钴(Co),铬(Cr),铜(Cu),锰(Mn),镍(Ni),铅(Pb),钛(Ti),钒(V),锌(Zn)共10种重金属元素的特征。

  • 本次土壤采集的采样点按照《全国土壤污染状况调查点布置技术规定》进行布点,并参照土地利用类型,在7种土地利用类型上布置样点共计203个,于2014年10月17日至2014年10月18日在永康市市区进行现场土壤样本采样。在203个样点中,交通用地24个,工业用地25个,住宅用地30个,市政文教用地11个,公园绿地18个,林地33个,耕地62个。

  • 土壤样品的元素质量分数分析利用X-MET7000手持式能量色散型X射线荧光(EDXRF)分析仪,测试完成于浙江农林大学生态学实验室。手持式能量色散X射线荧光分析仪(国家农业信息化工程技术研究中心、北京普析通用仪器有限公司研制),配置Ag靶微型X光管、Al+Mo滤片、电子冷却S-i PIN探测器。测试电压30 kV,测试电流40 μA。

  • 单因素评价分析可以分别反映不同污染物对环境的污染程度。在本研究中,为了同时反映当地区域的土壤表层重金属特征,以金衢盆地土壤元素背景值作为重金属评价标准的临界值。Pi=Ci/Si。其中:Pi为第i种重金属的污染分指数;Ci为第i种重金属元素的实测质量分数;Si为重金属评价标准的临界值,本研究中为金衢盆地土壤元素背景值[7]Pi≤1表示未污染,1<Pi≤2表示存在潜在污染,2<Pi≤3表示造成轻度污染,Pi>3表示当地区域土壤已受到该元素重度污染。

  • 内梅罗指数法是当前国内外进行综合污染指数计算的最常用方法之一。公式为:${P_n} = \sqrt {\frac{{P_{{\text{imax}}}^{\text{2}} + P_{{\text{iave}}}^{\text{2}}}}{2}} $。其中:Pn为内梅罗污染综合指数;Pimax为污染物种最大的污染指数;Piave为各污染元素指数的算术平均值。根据内梅罗污染指数,可将污染等级划分为5个不同等级[10-12],具体划分标准如表 1

    土壤综合污染等级 土壤综合污染指数 污染程度 污染水平
    Pn≤0.7 安全 清洁
    0.7 < Pn≤1.0 警戒线 尚清洁
    1.0 < Pn≤2.0 轻污染 污染物超过起初污染值,作物开始污染
    2.0 < Pn≤3.0 中污染 土壤和作物污染明显
    Pn>3.0 重污染 土壤和作物污染严重

    Table 1.  Classification standard of the Nemerow integrated pollute index

  • 永康市城市土壤表层重金属元素质量分数如表 2所示。重金属砷、钴、铬、铜、锰、镍、铅、钛、钒、锌在永康市城市土壤表层的平均质量分数分别为6.57,10.57,119.55,22.97,528.51,22.45,37.67,5 751.81,84.37,90.25 mg·kg-1

    项目 元素质量分数/(mg•kg-1)
    最小值 0;01 0;12 56;43 1;41 53.67 8;28 1.80 2 628;59 0;89 39.21
    最大值 46.75 66;49 740;82 440;55 1 728;69 78.11 264.01 10 244.50 229;47 932.17
    平均值 6.57 10.57 119.55 22;97 528.51 22;45 37.67 5 751.81 84;37 90;25
    变异系数/%, 105.21 92.80 47;46 176.97 54.13 34;95 68.19 23.13 109.67 94;65
    金衢盆地背景值 6.49 7;20 45.37 18.03 429.10 12.45 35.12 4 091.00 53.51 72.13
    浙江省背景值 9.20 13.20 55;99 17.60 620.51 24;60 35.70 4 406.11 73;60 70;60
    说明: 样本数n=203

    Table 2.  Concentration of heavy metals of the soils in Yongkang

    本研究中,变异系数值越大则表明该重金属元素在土壤中的分布受人为因素影响越大,反之则表明受自然源控制显著[13]。由表 2可知:永康市城市土壤表层重金属质量分数的离散程度较大,其中铜质量分数的变异系数最高,属强变异;钒和砷的变异系数次之,同属强变异。由此可见:永康市人为活动对城市土壤中重金属质量分数的干扰程度较强,部分区域的重金属污染已比较显著[14]

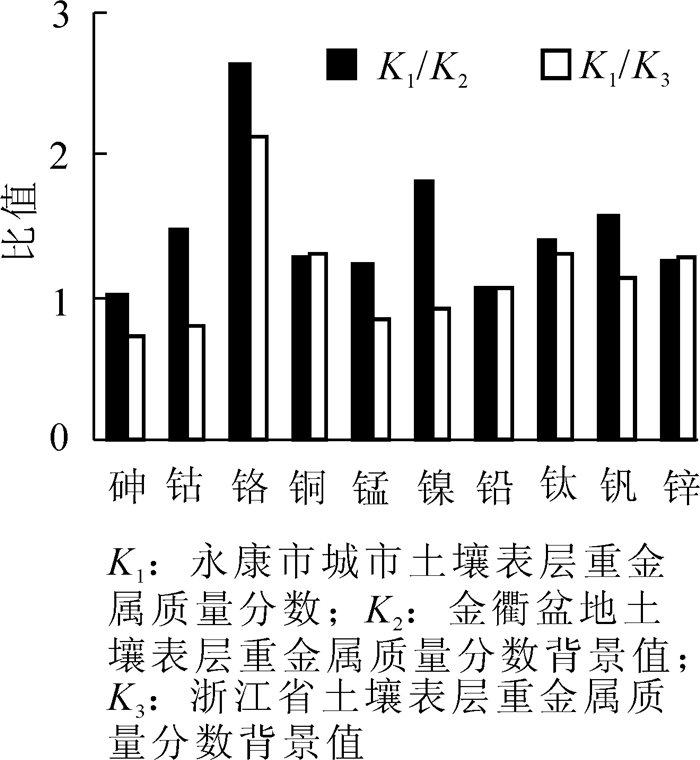
    永康市城市土壤表层重金属质量分数与浙江省土壤表层背景值和金衢盆地土壤背景值的比值如图 1所示,其中,金属铬有明显的富集现象,其质量分数分别是浙江省土壤表层背景值的2.1倍和金衢盆地土壤背景值的2.6倍。

    Figure 1.  Enrichments of heavy metals of the soils in Yongkang

  • 运用单因素污染指数对永康市城市土壤表层中10种重金属进行污染程度评价,评价结果如表 3表 4所示。由表 3可知:永康市城市土壤表层受重金属污染的状况并没有十分严重,除铬的污染程度达到轻度污染,其余各元素都处于潜在污染。各元素的染指数由大到小依次为铬>镍>钒>钴>钛>铜>锌>锰>铅>砷。由表 4可知:铬在研究区的污染程度最为普遍,所有样点的土壤表层都在一定程度上受到该元素的污染,表现为重度污染样点占所有采样点的14.78%,轻度污染样点占所有采样点的72.91%。

    项目
    最小值 0.002 0.016 1.243 0.078 0.125 0.665 0.051 0.643 0.017 0.544
    最大值 7.203 9.234 16.328 24.434 4.027 6.274 7.514 2.944 4.288 12.943
    平均值 1.012 1.468 2.635 1.274 1.232 1.803 1.073 1.406 1.577 1.251
    污染程度 潜在污染 潜在污染 轻度污染 潜在污染 潜在污染 潜在污染 潜在污染 潜在污染 潜在污染 潜在污染

    Table 3.  Single-factor pollution index of heavy metals of city topsoil in Yongkang

    污染程度
    未污染 120 86 0 131 91 3 115 11 106 110
    潜在污染 54 77 25 55 89 142 79 180 10 77
    轻度污染 17 18 148 4 18 50 5 12 26 7
    重度污染 12 22 30 13 5 8 4 0 61 9

    Table 4.  Results of city topsoil single-factor pollution index of heavy metals in Yongkang

  • 单因素评价分析虽然能较明显地反映出各重金属元素对土壤的污染程度,但由于土壤中各重金属元素间存在一定的联系,共同对土壤产生作用,所以运用单因素评价对土壤污染评价并不能如实反映各重金属元素的共同作用。本研究用内梅罗综合污染指数法来评价永康市城市表层土壤重金属元素的综合污染程度。由表 5可知:永康市城市表层土壤受重金属的复合污染已不容忽视,永康市城市表层土壤的平均内梅罗综合污染指数为2.63,为中度污染,此时土壤和作物相应也受到中等程度的重金属污染。不同用地类型下的城市表层土壤均呈现为轻度及以上污染水平,平均内梅罗综合污染指数由高到低排序为:工业用地>交通用地>公园绿地>住宅用地>林地>市政文教用地>耕地。

    永康市 交通用地 工业用地 住宅用地 市政文教用地 公园绿地 林地 耕地
    最大值 17.94 6.59 17.94 10.60 1.32 6.73 5.35 4.33
    最小值 0.88 1.48 1.82 1.37 2.11 1.88 0.99 0.87
    平均值 2.63 3.20 3.74 2.72 1.88 2.84 1.98 1.83
    污染程度 中度污染 重度污染 重度污染 中度污染 轻度污染 中度污染 轻度污染 轻度污染

    Table 5.  Nemerow integrated pollute index of heavy metals of city topsoil in cultivated land

  • 相关系数(r)是用于研究变量之间线性相关程度的指标[15]。在本研究中,相关系数的值代表各金属元素的同源性,若为正代表两者具有同源的可能性,反之亦然;而相关系数的绝对值越大,说明变量间的线性相关越强,同源的可能性越大。通过表 6可知:永康市城市土壤表层中大多数重金属之间存在着显著或极显著的相关性,其中,66.67%为正相关关系,33.33%为负相关关系。铜和锌的相关性最大,为0.894,呈极显著正相关;铬和铜、铬和镍、铜和镍、铬和锌的相关性次之。由此可知:研究区内的土壤表层中,铬、铜、镍、锌这4种重金属污染可能具有相同的污染源。与此同时,锌和铅、锌和镍、铅和镍均呈极显著正相关,且相关系数较大;钴与钛也呈极显著正相关。

    1
    0.281** 1
    0.211** 0.128 1
    0.083 -0.064 0.800** 1
    0.121 0.193** 0.165* 0.145* 1
    0.195LL -0.023 0.784** 0.735** 0.025 1
    -0.230** -0.109 0.348** 0.597** 0.080 -0.427** 1
    -0.074 0.500** -0.249** -0.268** 0.072 -0.280** -0.054 1
    0.451** -0.126 0.148* 0.084 -0.001 0.155* -0.119 -0.419** 1
    0.103 -0.089 0.717** 0.894** 0.255** 0.643** 0.641** -0.252** 0.102 1
    说明: **P < 0.01; *P < 0.05

    Table 6.  Relation coefficient of heavy metals of the urban soils in Yongkang

  • 对研究区采集的203个样本得到的砷、钴、铬、铜、锰、镍、铅、钛、钒、锌等10种重金属质量分数进行主成分分析,分析得出主成分贡献率、累计贡献率、因子负荷矩阵如表 7表 8所示,其中旋转方式为最大方差旋转。由结果分析可知,永康市城市土壤表层重金属污染来源主要由3个主成分所支撑,累积贡献率为72.20%,说明该结果在很大程度上能真实地反映出永康市城市土壤表层重金属污染来源的情况。其中,3个主成分因子F1F2F3对永康市城市土壤表层重金属污染的贡献率分别为37.88%,17.55%和16.77%。表 8为永康市城市土壤表层重金属主成分分析的因子载荷矩阵。由表 8可知:主成分因子F1包括铬、铜、镍、铅、锌,其贡献率为37.88%。由于永康市五金机械、防盗门、保温杯等制造业集中,而铬、镍是不锈钢的主要化学成分,所以工业来源是铬与镍的主要来源之一;铜、铅通常被认为与交通运输状况有关,主要受机动车污染排放影响[16-17],土壤中的铜、铅也来源于工业“三废”排放、城市生活垃圾和废水;研究表明:土壤中所累积的锌元素主要来源汽车轮胎的老化[4, 18-19]。近几年来,永康市民用汽车拥有量由2009年的9.5万辆[20]增长到了2013年的19.1万辆[21],短短4 a总量增长了1倍多。因此,因子F1主要可以归纳为是五金业与交通源的混合源。砷和钒在因子F2中有较高的负荷,因子F2的贡献率为17.55%。已知土壤中钒元素主要来源于工业生产与“三废”排放;永康市城市土壤表层中砷的质量分数与金衢盆地土壤背景值较为接近,说明其主要受土母质的影响。因而可知,因子F2可以归纳为工业与自然源的混合源。因子F3主要有钴与钛元素,其贡献率为16.76%。据了解,钴元素多用于硬质合金、磁铁、陶瓷和特殊玻璃的制造;而钛元素多用于合金的制造,也常用于油漆、橡胶、纸的颜料和某些轻质材料的制造。因此,因子F3也可以归结于五金业在永康市的盛行。

    主成分因子 旋转前 旋转后
    特征根 贡献率/% 累计贡献率/% 特征根 贡献率/% 累计贡献率 /%
    F1 3.85 38.50 38.50 3.79 37.88 37.88
    F2 1.72 17.24 55.74 1.76 17.55 55.43
    F3 1.65 16.46 72.20 1.68 16.76 72.20

    Table 7.  Characteristic vectors,eigenvalues and contribution rate of PCA in Yongkang

    重金属元素 主成分因子负荷量
    F1 F2 F3
    0.064 0.809 0.337
    -0.056 0.088 0.877
    0.851 0.230 0.146
    0.948 0.026 -0.015
    0.212 0.072 0.449
    0.825 0.195 -0.014
    0.701 -0.420 -0.080
    -0.286 -0.415 0.705
    0.071 0.804 -0.259
    0.924 0.015 0.000

    Table 8.  Factor load matrix of components

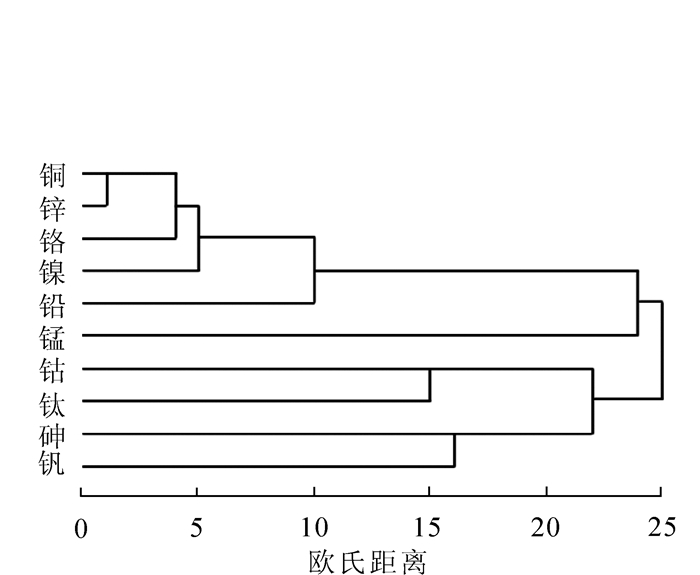
  • 元素聚类分析可以有效地揭示不同元素间的来源相似性,可以用来检验主成分分析的结果。图 2为基于永康市203个城市土壤表层样点各重金属元素含量所得到的聚类树状图,研究区所研究的10种重金属可以大致分为4类,即铜、锌、铬、镍与铅聚成一类;钴与钛聚为一类;砷与钒聚为一类;锰自成一类。这与因子分析得到的分类结果几乎一致。聚类图上的距离轴反映了组间元素的关联程度,距离越小,关联度越显著[22],反之亦然。由此可知:在第一类中铜、锌、铬、镍这4个元素的关联度较为显著,其中铜和锌与铬和镍各自间的距离最近,这与利用元素相关性研究元素间来源的结果一致(表 7)。

    Figure 2.  Cluster analysis of heavy metals of urban soils in Yongkang

  • 基于永康市城市表层土壤203个样本数据,分析测试了砷、钴、铬、铜、锰、镍、铅、钛、钒、锌等10种重金属元素的质量分数,评价了重金属的污染程度,并在一定程度上探讨了各元素的来源,得到以下结论:①永康市城市表层土壤中重金属砷、钴、铬、铜、锰、镍、铅、钛、钒、锌的平均质量分数分别为6.57,10.57,119.55,22.97,528.51,22.45,37.67,5 751.81,84.37,90.25 mg·kg-1。②永康市城市表层土壤受重金属污染的状况整体上并没有十分严重,但个别元素在局部地区污染较为严重,各元素的平均单因素污染指数由大到小依次为铬>镍>钒>钴>钛>铜>锌>锰>铅>砷。③研究区表层土壤均呈现为轻度污染及以上污染水平,平均内梅罗综合污染指数由高到低排序为:工业用地>交通用地>公园绿地>住宅用地>林地>市政文教用地>耕地。④永康市城市土壤表层重金属污染主要受工业制造、交通运输及自然成土的影响,其中以五金制造最为突出。

Reference (22)

Catalog

/

DownLoad:  Full-Size Img  PowerPoint
Return
Return