Volume 35 Issue 2
Mar.  2018
Turn off MathJax
Article Contents

YU Jiajun, YU Shuquan, LIANG Licheng, ZHANG Chao, ZHOU Wenchun. Dynamic changes and development of water retention in Liandu District[J]. Journal of Zhejiang A&F University, 2018, 35(2): 189-198. doi: 10.11833/j.issn.2095-0756.2018.02.001
Citation: YU Jiajun, YU Shuquan, LIANG Licheng, ZHANG Chao, ZHOU Wenchun. Dynamic changes and development of water retention in Liandu District[J]. Journal of Zhejiang A&F University, 2018, 35(2): 189-198. doi: 10.11833/j.issn.2095-0756.2018.02.001

Dynamic changes and development of water retention in Liandu District

doi: 10.11833/j.issn.2095-0756.2018.02.001
  • Received Date: 2017-02-12
  • Rev Recd Date: 2017-04-12
  • Publish Date: 2018-04-20
  • Water retention, a most important ecosystem service that is key to water source protection planning, reflects the ability of an ecosystem to keep the water, as well as showing water available for human consumption. To better understand the characteristics of water retention and to better protect the water environment of Liandu District in southwest Zhejiang Province, this study evaluated the quantity and spatial characteristics of its water retention. The assessment was carried out using the InVEST (integrated valuation of ecosystem services and tradeoffs) model. Then a simulation of water retention for Liandu in 2030 was conducted by the CA-Markov Model. The main results showed that from 1994 to 2015, the city area increased by 6.11×10⁴ hm2, the total area of forest increased 1.35×10⁴ hm2, and by contrast, the rocky area decreased 1.91×10⁵ hm2. For the study area the average water retention in 1994 was 69.98 mm, in 2001 was 98.40 mm, in 2008 was 82.36 mm, and in 2015 was 114.01 mm; total water retention in 1994 was 1.11×10⁸ m3, in 2001 was 1.56×10⁸ m3, in 2008 was 1.23×10⁸ m3, and in 2015 was 1.83×10⁸ m3. Overall, water retention increased 62.92%. Underlying surface and climatic features were the two greatest factors affecting water retention with soil hydraulic conductivity, having a standardized coefficient of 0.644, being the most important. Also, a large difference in spatial distribution for different time periods was found. In general, the southern and northern parts of the study area had better water retention with the central parts not as good. The simulation showed that the average water retention of the study area was 112.90 mm, and total water retention was 1.81×10⁸ m3 with the northwest region having a greater water retention potential. Thus, combining the InVEST Model and CA-Markov Model provided a favorable reference for effective management of water retention.
  • [1] TANG Xu, ZHENG Jie, FENG Yan, LI Yankun, WANG Shijun, ZHANG Dahong.  County-level forest ecological security evaluation and spatial analysis in Yunnan Province . Journal of Zhejiang A&F University, 2018, 35(4): 684-694. doi: 10.11833/j.issn.2095-0756.2018.04.014
    [2] PEI Jianchuan, ZHANG Shuting, YANG Jinyan, ZHANG Jin.  Nitrogen removal in landscape water bodies using a vertical ecological module in Yuhuang Shannan Fund Town . Journal of Zhejiang A&F University, 2018, 35(6): 987-996. doi: 10.11833/j.issn.2095-0756.2018.06.001
    [3] PENG Chenchen, CAI Yumei, BIAN Zhenxing.  Delineating an ecological red line in Yantai, Shandong Province . Journal of Zhejiang A&F University, 2018, 35(5): 818-828. doi: 10.11833/j.issn.2095-0756.2018.05.005
    [4] QIU Wenxin, ZHANG Yong, YU Jiajun, ZHANG Chao, ZHENG Chaochao, YU Shuquan.  Feasibility verification with field application of a water conservation module using the InVEST Model . Journal of Zhejiang A&F University, 2018, 35(5): 810-817. doi: 10.11833/j.issn.2095-0756.2018.05.004
    [5] GAO Changjun, WEI Long, JIA Peng, TIAN Huiling, LI Shuguang.  Coastal wetland ecosystem evaluation in Guangdong Province by eliminating the double counting . Journal of Zhejiang A&F University, 2017, 34(1): 152-160. doi: 10.11833/j.issn.2095-0756.2017.01.021
    [6] JIN Wenjiang, HOU Ping, ZHANG Wei, LIANG Licheng, YU Fei.  Spatial distributions and ecological risks of heavy metals in surface sediments and riparian soils of the Aojiang River Basin, Wenzhou . Journal of Zhejiang A&F University, 2017, 34(6): 963-971. doi: 10.11833/j.issn.2095-0756.2017.06.001
    [7] ZENG Qi, LIU Jian, YU Kunyong, ZHANG Jinzhao, ZHENG Wenying, CHEN Zhanghao.  Coupling research on functional regionalization and ecological vulnerability in the Jinsiwan Forest Park . Journal of Zhejiang A&F University, 2017, 34(5): 833-840. doi: 10.11833/j.issn.2095-0756.2017.05.009
    [8] WANG Fan, JIANG Hong, NIU Xiaodong.  Research advances in water vapor isotopic composition and its application in the hydrological research . Journal of Zhejiang A&F University, 2016, 33(1): 156-165. doi: 10.11833/j.issn.2095-0756.2016.01.021
    [9] HE Tao, SUN Yujun.  Dynamic monitoring of forest carbon stocks based on the InVEST model . Journal of Zhejiang A&F University, 2016, 33(3): 377-383. doi: 10.11833/j.issn.2095-0756.2016.03.002
    [10] CHEN Yonggen, ZHOU Chuanbin, ZHU Huifang, WANG Rusong.  Solid waste management and resource strategies in the developed rural region . Journal of Zhejiang A&F University, 2015, 32(6): 940-946. doi: 10.11833/j.issn.2095-0756.2015.06.018
    [11] WANG Lin, JING Yuanshu, ZHANG Yue.  Spatio-temporal variation for vegetative NPP in the lower-middle reaches of the Yangtze River based on MODIS data . Journal of Zhejiang A&F University, 2015, 32(6): 829-836. doi: 10.11833/j.issn.2095-0756.2015.06.002
    [12] YI Wuying, SU Weici, ZHOU Wenlong, TANG Jingang, ZHANG Fengtai.  An ecological security early warning simulation city based on the CA Model in Huaxi District of Guiyang City, China . Journal of Zhejiang A&F University, 2015, 32(3): 369-375. doi: 10.11833/j.issn.2095-0756.2015.03.006
    [13] YAN Wenbo, LIU Dan, PENG Danli, LI Song, CHEN Junren, YE Zhengqian, WU Jiasen, WANG Hailong.  Technology advances of ecological restoration and environmental remediation of heavy metal mines . Journal of Zhejiang A&F University, 2015, 32(3): 467-477. doi: 10.11833/j.issn.2095-0756.2015.03.021
    [14] WANG Shi, WU Yongbo, CHEN Jie, DING Xiaoye.  Carbon balance of Brassica oleracea var. botrytis from Chongming Ecological Agriculture Park in Shanghai . Journal of Zhejiang A&F University, 2014, 31(2): 190-195. doi: 10.11833/j.issn.2095-0756.2014.02.005
    [15] LI Zheng-cai, XU De-ying, YANG Xiao-sheng, FU Mao-yi, SUN Xue-zhong, XI Jin-rong.  Organic carbon storage in forest debris of seven vegetation cover types . Journal of Zhejiang A&F University, 2007, 24(5): 581-586.
    [16] LI De-hui, LI Xian-wei, WANG Qiao, RONG Li, YANG Miao, LIUShuo.  A review of forest root respiration-determinants and response to global change . Journal of Zhejiang A&F University, 2007, 24(2): 231-238.
    [17] DAI Jian-bing, YU Yi-wu, CAO Qun.  Summary of research on wetland protection and management . Journal of Zhejiang A&F University, 2006, 23(3): 328-333.
    [18] HE Jia-fei, ZHOU Wei, LI Ming-hui.  Preliminary observation on reproductive ecology of Kaloula verrucosa . Journal of Zhejiang A&F University, 2006, 23(3): 311-315.
    [19] FU Xiao-ping, TIAN Da-lun, HUANG Zhi-yong.  模拟酸雨对植物形态学效应的影响 . Journal of Zhejiang A&F University, 2006, 23(5): 521-526.
    [20] JIANG Wen-wei, LIU Tong, DING Li-xia, WEN Guo-sheng, ZHANG Wan-rong, ZHONG Tai-lin.  Progress in spatial heterogeneity research in landscape ecology . Journal of Zhejiang A&F University, 2003, 20(3): 311-314.
  • [1]
    LEEMANS H B J, de GROOT R S. Millennium ecosystem assessment:ecosystems and human well-being:a framework for assessment[J]. Physiol Teachnol, 2003, 34(9):534.
    [2]
    GRIZZETTI B, LANZANOVA D, LIQUETE C, et al. Assessing water ecosystem services for water resource management[J]. Environ Sci Policy, 2016, 61:194-203.
    [3]
    CHEN Yaning, LI Zhi, FAN Yuting, et al. Research progress on the impact of climate change on water resources in the arid region of northwest China[J]. Acta Geogr Sin, 2014, 69(9):1295-1304.
    [4]
    ZHANG Biao, LI Wenhua, XIE Gaodi, et al. Water conservation function and its measurement methods of forest ecosystem[J]. Chin J Ecol, 2009, 28(3):529-534.
    [5]
    FU Bin, XU Pei, WANG Yukuan, et al. Spatial pattern of water retetnion in Dujiangyan County[J]. Acta Ecol Sin, 2013, 33(3):789-797.
    [6]
    POLASKY S, NELSON E, PENNINGTON D, et al. The impact of land-use change on ecosystem services, biodiversity and returns to landowners:a case study in the State of Minnesota[J]. Environ Resour Econ, 2011, 48(2):219-242.
    [7]
    NELSON E, MENDOZA G, REGETZ J, et al. Modeling multiple ecosystem services, biodiversity conservation, commodity production, and tradeoffs at landscape scales[J]. Front Ecol Environ, 2009, 7(1):4-11.
    [8]
    LEH M D K, MATLOCK M D, CUMMINGS E C, et al. Quantifying and mapping multiple ecosystem services change in West Africa[J]. Agric Ecosyst Environ, 2013, 165(1751):6-18.
    [9]
    SÁNCHEZ-CANALES M, BENITO A L, PASSUELLO A, et al. Sensitivity analysis of ecosystem service valuation in a Mediterranean watershed[J]. Sci Total Environ, 2012, 440(1):140-153.
    [10]
    VIGERSTOL K L, AUKEMA J E. A comparison of tools for modeling freshwater ecosystem services[J]. J Environ Manage, 2011, 92(10):2403-2409.
    [11]
    ZHOU Bin. Forest Landscape Optimization based on Ecosystem Services for Mountainous Area of Beijing[D]. Beijing: Beijing Forestry University, 2011.
    [12]
    BAO Yubin, LI Ting, LIU Hui, et al. Spatial and temporal changes of water conservation of Loess Plateau in northern Shaanxi Province by InVEST model[J]. Geogr Res, 2016, 35(4):664-676.
    [13]
    BAI Yang, ZHENG Hua, ZHUANG Changwei, et al. Ecosystem services valuation and its regulation in Baiyangdian baisn:based on InVEST model[J]. Acta Ecol Sin, 2013, 33(3):711-717.
    [14]
    PAN Tao, WU Shaohong, DAI Erfu, et al. Spatiotemporal variation of water source supply service in Three Rivers Source Area of China based on InVEST model[J]. Chin J Appl Ecol, 2013, 24(1):183-189.
    [15]
    JIA Fangfang. InVEST Model Based Ecosystem Services Evaluation with Case Study on Ganjiang River Basin[D]. Beijing: China University of Geosciences, 2014.
    [16]
    WANG Jiwei, LIU Kang, WENG Naiyi. Research on water conservation service function of forest ecological system in upstream of Hanjiang River based on In-VEST model[J]. Bull Soil Water Conserv, 2014, 34(5):213-217.
    [17]
    YANG Guoqing, LIU Yaolin, WU Zhifeng. Analysis and simulation of land-use temporal and spatial pattern based on CA-Markov model[J]. Geom Inf Sci Wuhan Univ, 2007, 32(5):414-418.
    [18]
    CHEN Yanfen. Dynamic Analysis of Public Welfare Forest Resouce in Liandu, Lishui, Zhejiang[D]. Hangzhou: Zhejiang A&F University, 2011.
    [19]
    JIANG Diwei. Spatiotemporal Analysis and Prediction of Land Use/Land Cover Changes in Ningbo City[D]. Hangzhou: Zhejiang University, 2015.
    [20]
    ZHANG Jinghua, FENG Zhiming, JIANG Luguang. Progress on studies of land use/land cover classification systems[J]. Resour Sci, 2011, 33(6):1195-1203.
    [21]
    SUN Zhen, JIA Shaofen, LÜAifeng, et al. 2016. Precision estimation of the average daily precipitation simulated by IPCC AR5 GCMs in China[J]. J Geo-inf Sci, 2016, 18(2):227-237.
    [22]
    LIAO Yaoming, ZHANG Qiang, CHEN Deliang. Precipition simulation in China with a weather generator[J]. Acta Geogr Sin, 2004, 59(5):689-698.
    [23]
    YANG Hui. Research on Soil And Water Conservation of Several Vegetation Types of Ecological Forest in Zhejiang[D]. Nanjing: Nanjing Forest University, 2007.
    [24]
    COSBY B J, HORNBERGER G M, CLAPP R B, et al. A statistical exploration of the relationships of soil moisture characteristics to the physical properties of soils[J]. Water Resour Res, 1984, 20(6):682-690.
    [25]
    ZHOU Wenzuo. A Study on Available Water Capacity of Main Soil Types in China based on Geographic Information System[D]. Nanjing: Nanjing Agricultural University, 2003.
    [26]
    WANG Xiaoxue, SHEN Huitao, LI Xuyong, et al. Concepts, processes and quantification methods of the forest water conservation at the multiple scales[J]. Acta Ecol Sin, 2013, 33(4):1019-1030.
    [27]
    PENG Shunlei, YOU Wenhui, SHEN Huitao. Effect of syndynamic on soil saturated hydraulic conductivity[J]. Trans CSAE, 2010, 26(11):78-84.
    [28]
    LIANG Xiangfeng, ZHAO Shiwei, ZHANG Yang, et al. Effects of vegetation rehabilitation on soil saturated hydraulic conductivity in Ziwuling Forest Area[J]. Acta Ecol Sin, 2009, 29(2):636-642.
  • 加载中
通讯作者: 陈斌, bchen63@163.com
  • 1. 

    沈阳化工大学材料科学与工程学院 沈阳 110142

  1. 本站搜索
  2. 百度学术搜索
  3. 万方数据库搜索
  4. CNKI搜索

Figures(4)  / Tables(5)

Article views(3069) PDF downloads(838) Cited by()

Related
Proportional views

Dynamic changes and development of water retention in Liandu District

doi: 10.11833/j.issn.2095-0756.2018.02.001

Abstract: Water retention, a most important ecosystem service that is key to water source protection planning, reflects the ability of an ecosystem to keep the water, as well as showing water available for human consumption. To better understand the characteristics of water retention and to better protect the water environment of Liandu District in southwest Zhejiang Province, this study evaluated the quantity and spatial characteristics of its water retention. The assessment was carried out using the InVEST (integrated valuation of ecosystem services and tradeoffs) model. Then a simulation of water retention for Liandu in 2030 was conducted by the CA-Markov Model. The main results showed that from 1994 to 2015, the city area increased by 6.11×10⁴ hm2, the total area of forest increased 1.35×10⁴ hm2, and by contrast, the rocky area decreased 1.91×10⁵ hm2. For the study area the average water retention in 1994 was 69.98 mm, in 2001 was 98.40 mm, in 2008 was 82.36 mm, and in 2015 was 114.01 mm; total water retention in 1994 was 1.11×10⁸ m3, in 2001 was 1.56×10⁸ m3, in 2008 was 1.23×10⁸ m3, and in 2015 was 1.83×10⁸ m3. Overall, water retention increased 62.92%. Underlying surface and climatic features were the two greatest factors affecting water retention with soil hydraulic conductivity, having a standardized coefficient of 0.644, being the most important. Also, a large difference in spatial distribution for different time periods was found. In general, the southern and northern parts of the study area had better water retention with the central parts not as good. The simulation showed that the average water retention of the study area was 112.90 mm, and total water retention was 1.81×10⁸ m3 with the northwest region having a greater water retention potential. Thus, combining the InVEST Model and CA-Markov Model provided a favorable reference for effective management of water retention.

YU Jiajun, YU Shuquan, LIANG Licheng, ZHANG Chao, ZHOU Wenchun. Dynamic changes and development of water retention in Liandu District[J]. Journal of Zhejiang A&F University, 2018, 35(2): 189-198. doi: 10.11833/j.issn.2095-0756.2018.02.001
Citation: YU Jiajun, YU Shuquan, LIANG Licheng, ZHANG Chao, ZHOU Wenchun. Dynamic changes and development of water retention in Liandu District[J]. Journal of Zhejiang A&F University, 2018, 35(2): 189-198. doi: 10.11833/j.issn.2095-0756.2018.02.001
  • 人类从生态系统中直接或间接地获得的益处被定义为生态系统服务功能[1]。生态系统服务功能与人类的生存息息相关,为人和自然的连接提供了一种可以进行价值评估的方法,并为保护和恢复生态系统提供了论据基础[2]。20世纪中期以来,全球气候变暖,气温的上升加速了全球水循环变化,也加剧了极端水文事件的发生,导致了全球水资源的重新分配[3]。水源涵养服务功能是生态系统服务中的极为重要的组成部分,开展水源涵养功能现状和未来变化的研究,对理解不同区域尺度在全球变暖趋势下的响应具有重要意义。目前,测量水源涵养能力的方法主要有土壤蓄水能力法、综合蓄水能力法、林冠截流剩余量法、水量平衡法、降水储存量法、年径流量法、地下径流增长法和多因子回归法[4]。InVEST(integrated valuation of ecosystem services and tradeoffs)模型由斯坦福大学、大自然保护协会、世界自然基金会和其他相关机构共同开发[5],其水源涵养功能模块主要是基于水量平衡法进行测算。InVEST模型在国外已有诸多成功应用[6-10],国内利用InVEST模型进行的水源涵养研究主要集中在空间格局评价方面[11-16],对历年的时空序列变化分析较少,结合CA-Markov模型[17]进行未来的预测尚未见到报道。浙江省丽水市莲都区是浙江八大水系中瓯江水系、灵江水系和飞云江水系的发源地。本研究利用InVEST水源涵养功能模块和CA-Markov土地利用预测模型相结合的方法,分析莲都区水源涵养功能的时空变化特征,可为浙江省提出的“五水共治”重大决策部署提供科学依据,为区域水源涵养功能规划提供理论指导。

  • 莲都区地处浙江省丽水市瓯江上中游,位于28°06′~28°44′N,119°32′~120°08′E,总面积为1 502 km2。地处括苍山、洞宫山、仙霞岭3条山脉之间。境内地形可分为河谷平原、丘陵、山地3种,其中,低丘和高丘占全区总面积的57.0%,低山、中山面积占全区总面积的30.2%,平均海拔为381 m。气候属中亚热带季风气候类型,雨水充沛,温暖湿润,四季分明,具有明显的山地立体气候特征[18]

  • 利用InVEST模型对水源涵养功能进行评价。该模型主要根据水量平衡原理,通过降水、植物蒸腾、地表蒸发、根系深度和土壤深度等参数计算产水量。在产水量的基础上,考虑土壤厚度、渗透性、地形等因素的影响,利用地形指数、流速系数和土壤饱和导水率对产水量进行修正。根据式(1)计算获得水源涵养量:

    式(1)中:R为水源涵养量(mm);Ve为流速系数;K为土壤饱和导水率(cm·d-1),根据式(2)计算;IT为地形指数,无量纲,根据式(3)计算;Y为产水量,根据式(4)计算。

    土壤饱和导水率基于Cosby土壤饱和导水率传递函数计算。式(2)中,SC分别代表砂粒和黏粒的含量(%)。

    式(3)中:DA为集水区栅格数量;SD为土壤深度;PS为百分比坡度。

    式(4)中:Yjx为年产水量;Px为年均降水量;$A_{xj}^{\rm{ET}} $为土地利用类型j栅格上单元x的年均蒸散量,由式(5)计算。

    式(5)中:Rxj为土地利用类型j上栅格单元x的干燥指数,无量纲,为潜在蒸发量与降水量的比值,根据式(6)计算;${{\omega }_{x}} $为植物年需水量和降水量的比值,是描述自然气候和土壤性质的参数,根据式(8)计算。

    式(6)中:k为作物系数,是作物蒸散量ET与潜在蒸散量$E_{\rm{0}}^{\rm{T}} $的比值;$ E_{\rm{0}}^{\rm{T}}$是指假设平坦地面被特定矮秆绿色植物全部遮蔽,同时土壤保持充分湿润情况下的蒸散量,采用式(7)计算。

    式(7)中:$ E_{\rm{0}}^{\rm{T}}$为潜在蒸发量(mm·d-1);RA为太阳顶层辐射(MJ·m-2·d-1);Tavg为日最高气温均值和日最低气温均值的平均值(℃);TD为日最高气温均值和日最低气温均值的差值(℃);P为月均值降水量。

    式(8)中:Z为Zhang系数,表征降水季节性特征的一个常数,其值为1~10,降水主要集中在冬季时,其值接近于10,降水主要集中与夏季或季节分布均匀时,其值接近于1。$A_{x}^{\rm{WC}} $为植被有效可利用水。

  • 元胞自动机(cellular automata, CA)是由Von NEUMANN等在20世纪40年代最早提出的一种时间、空间和状态都离散的网格动力学模型。马尔可夫链(Markov)是预测事件发生概率的一种数学方法,是基于随机理论形成的一种具备“无后效性”的特殊随机运动过程,即t+1时刻的状态只与t时刻的状态有关[19]。CA-Markov模型是综合了Markov链对长时间序列的预测和CA元胞自动机基于空间关系和规则动力学模拟的优点,能更加准确地从时间和空间上模拟土地利用类型变化的情况。

    式(9)中:StSt+1为tt+1时刻土地利用系统状态;Pij为状态转移矩阵。式(10)中,St, St+1tt+1时刻元胞状态;Udd维的元胞空间及网格单元;Ntt时刻邻居的状态组合;f为转换规则。

  • 根据模型所需参数,对各参数进行获取及本地化处理。以1994年5月12日、2001年4月13日Landsat 5遥感影像、2008年7月5日Landsat 5遥感影像以及2015年10月13日Landsat 8 OLI影像为数据源,参考“GLC2000土地覆被分类系统”将土地覆被类型[20]主要分为裸地、农田、城镇、水体、针叶林、灌丛、阔叶林、竹林和针阔混交林等9类,采用随机森林法进行土地覆被类型分类。降水等气候数据根据莲都区及周边地区气象站记录的各年份数据进行插值获得,2030年气候数据来自于国家气候中心参与政府间气候变化专门委员会(IPCC)时根据北京气候中心模型模拟所得[21-22];土壤深度参考浙江省森林资源二类清查数据和1:50万浙江省土壤数据;根系深度及流速系数参数根据研究区前期外业调查和周边地区已有研究,进行本地化处理获得,尽量保证参数符合实际情况;土壤饱和水率[23]参考1:50万浙江省土壤数据,利用COSBY等[24]的土壤传递函数计算获得;植物可利用水根据外业调查所得田间持水量数据,参考周文佐[25]的研究结果进行处理获得;地形数据来源于日本地球遥感数据分析中心提供的30 m分辨率全球数字高程模型数据。

    本研究利用InVEST模型计算水源涵养功能时均以30 m × 30 m分辨率的栅格图为参数来源,同样也是以该分辨率栅格作为最小单位对结果进行输出计算。输出结果为水源涵养深度(mm)。通过单位换算汇总得出研究区水源涵养总量(m3)。以乡镇矢量边界对研究区各地区水源涵养量进行统计,从而分析研究区水源涵养功能的数量及空间变化特征。

    对遥感影像进行解译后,由于地物光谱特征存在“异物同谱”和“同物异谱”现象,因此,2015年土地覆被类型是利用高精度影像和野外实地调查数据对研究区土地覆被类型分类进行精度验证。对于1994,2001和2008年土地覆被类型分类无法进行野外实地调查验证的问题,根据土地覆被类型具有一定规律性的特点,结合相关年份的统计年鉴、森林资源二类小班调查数据和当时的土地利用现状图等辅助方法加以验证。验证结果显示,研究区1994,2001,2008和2015年土地覆被类型遥感解译精度分别为76.3%,78.6%,81.4%和84.3%,达到了研究所需要求。

  • 表 1可以看出:2015年研究区针叶林的面积最大,达6.08×10⁴ hm2,其次是针阔混交林和阔叶林,分别为2.55×10⁴ hm2和2.16×10⁴ hm2,裸地、水体和灌木林的面积较小。1994-2015年,城镇、阔叶林、竹林和针阔混交林面积均有不同程度增加,其中,针阔混交林增幅最大,其次分别是城镇、阔叶林和竹林。裸地、农田、水体和针叶林面积均有不同程度的下降,其中,针叶林和裸地下降幅度最大,其次分别是农田和水体面积。

    土地覆被类型 1994 2001 2008 2015
    比例/% 面积/(×104 hm2) 比例/% 面积/(×104 /m2) 比例/% 面积/(×104 /m2) 比例/% 面积/(×104 /m2)
    裸地 14.43 2.17 7.46 1.12 2.46 0.37 1.69 0.25
    农田 7.66 1.15 7.84 1.18 7.41 1.11 7.56 1.14
    城镇 3.22 0.48 4.31 0.65 5.52 0.83 7.29 1.09
    水体 1.22 0.18 1.42 0.21 1.26 0.19 1.01 0.15
    针叶林 54.29 8.15 49.66 7.46 49.03 7.37 40.46 6.08
    灌木林 0.79 0.12 3.21 0.48 1.51 0.23 1.52 0.23
    阔叶林 7.38 1.11 7.94 1.19 9.65 1.45 14.41 2.16
    竹林 3.46 0.52 6.02 0.90 9.59 1.44 9.08 1.36
    针阔混交林 7.54 1.13 12.13 1.82 13.58 2.04 16.99 2.55

    Table 1.  Area and proportion of land cover in different years

    图 1研究区土地覆被空间分布状况可以看出:1994-2001年,研究区中北部地区裸地面积显著减少,被以针叶林为主的林地所替代;竹林、阔叶林和针阔混交林面积增长明显,主要集中在研究区南部,峰源乡和莲都林场等地。2001-2008年,裸地面积持续减少,竹林、阔叶林和针阔混交林面积持续增加,在北部和东部部分地区增长明显;同时在此期间,城镇面积增长迅速,主要在万象街道和白云街道原有城镇基础上呈现辐射型扩张,并在南明山街道地区发展形成新城区。2008-2015年,城镇面积持续在研究区中部南明山街道等地快速扩张。同时,研究区北部和南部地区针叶林面积下降,阔叶林和针阔混交林面积提高。1994-2015年,莲都区北部地区裸地被以针叶林为主的林地替代,南部地区针叶林逐渐被竹林、阔叶林和针阔混交林所替代,土地覆被类型空间分布格局变化较大。此外,21 a间莲都区中部城镇扩张明显,人为活动增加,对生态环境干扰加剧。

    Figure 1.  Spatial characterisitic of land cover from 1994 to 2015

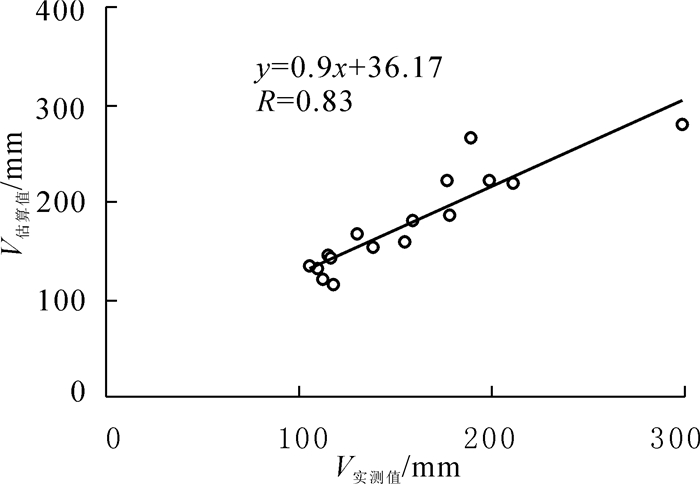
  • 通过查询黄渡、小白岩、上显滩3个水文站和五里亭水库的水文记录,获得1994,2001,2008和2015年研究区的径流深度数据。根据气象数据查询可知:研究区1994,2001,2008和2015年降水量分别为1 453.0,1 460.0,1 147.0和1 674.0 mm。根据相关研究[26]可知:蒸散量约占实际降水量的30%。通过研究区降水量、蒸散量和径流深度可以计算水源涵养深度(V),公式为V=P-E-C。其中:P为降水量,E为蒸散量,C为径流深度。将相关参数代入计算,得出研究区各年份各水文记录点的水源涵养深度值,并将实测结果与InVEST模型所得估算结果进行检验,结果如图 2所示。由图 2可知:估算值对实测值的回归方程为y=0.9x+36.17,R2为0.83,表明方程拟合程度较高,InVEST模型能够较为真实地反映研究区水源涵养功能。

    Figure 2.  Accuracy test of InVEST model

  • 1994-2015年,研究区水源涵养功能提高明显。从表 2可以看出:1994年研究区水源涵养总量为1.11×10⁸ m3,水源涵养深度为69.98 mm;2001年研究区水源涵养总量为1.57×10⁸ m3,水源涵养深度为98.40 mm;2008年研究区水源涵养总量达1.23×10⁸ m3,水源涵养深度为82.36 mm;2015年研究区水源涵养总量达1.83×10⁸ m3,水源涵养深度为114.01 mm。21 a间研究区水源涵养功能提高了62.92%。研究区水源涵养功能提高并非匀速,不同时期变化情况有所不同。1994-2001年水源涵养总量提高了0.46×10⁸ m3,水源涵养深度提高了28.42 mm,年均水源涵养功能增长5.10%,2001-2008年水源涵养总量减少了0.34×10⁸ m3,水源涵养深度降低了16.04 mm,年均水源涵养功能减少2.33%; 2008-2015年,水源涵养总量增长了0.60×10⁸ m3,水源涵养深度提高了31.65 mm,年平均增长率为5.49%。但从研究区各年度水源涵养深度占降水量比例来看,1994年为4.82%,2001年为6.47%,2008年为7.18%,一直表现增长趋势,但2015年由于降水量过高,水源涵养深度占降水量6.81%,稍有下降。从表 2可以看出:21 a间研究区各乡镇水源涵养功能提高程度差异明显,其中,水源涵养总量增长明显的乡镇为雅溪镇和黄村乡,1994-2015年分别增长了9.72×10⁶ m3和9.68×10⁶ m3,分别提高了75.44%和71.42%。水源涵养总量增长较少的是万象街道,增长0.02×10⁴ m3,仅提高了5.71%。水源涵养深度提高最为明显的依然是雅溪镇和黄村乡,分别提高了82.70 mm和92.73 mm,提高比例分别为75.12%和70.94%。万象街道的水源涵养深度提高最少,仅1.10 mm,提升比例仅为4.07%。从表 3可以看出:研究区水源涵养功能变化呈现先增后减再增,总体提高的趋势。但各乡镇地区水源涵养功能前中后期变化特征并不一致,其中万象街道、莲都林场和大港头镇后期年平均增长速率高于前期;白云街道、紫金街道、仙渡乡、丽新畲族乡、峰源乡和南明山街道前后期年平均增长速率相近;其余各乡镇前期年平均增长速率高于后期。

    街道 1994 2001 2008 2015
    水源涵养深度/mm 水源涵养总量/(×104 m3) 水源涵养深度/mm 水源涵养总量/(×104 m3) 水源涵养深度/mm 水源涵养总量/(×104 m3) 水源涵养深度/mm 水源涵养总量/(×104 m3)
    万象街道 27.06 0.35 31. 07 0.40 17.55 20. 54 28.16 0. 37
    岩泉街道 81.98 7.88 119.69 11. 52 90. 48 783. 53 137.25 13.21
    市白云山林场 87.91 2.61 135.71 4. 02 102.59 273.64 151.68 4. 50
    白云街道 28.50 0.06 39.18 0. 09 29. 03 5. 92 40.93 0. 09
    雅溪镇 80.96 14.32 121. 65 21. 55 94. 81 1 511.84 141. 78 25.12
    紫金街道 65.49 4.35 89. 01 5. 91 68. 58 409. 99 100.69 6. 69
    联城街道 54.37 6.73 79.01 9. 77 62. 29 693. 42 93. 47 11. 56
    老竹畲族镇 64.81 6.01 95. 63 8. 88 78. 27 654. 37 114.29 10.62
    莲都林场 98.07 12.75 126.79 16.51 109.28 1 281.08 155.66 20. 28
    仙渡乡 53.58 3.75 74. 31 5. 21 60. 44 381.44 89. 90 6. 30
    丽新畲族乡 46.82 4. 16 65.14 5. 80 52. 93 424.14 76. 93 6. 85
    碧湖镇 53.34 12.03 79. 79 18.01 58. 9 1 196.41 90. 76 20. 49
    峰源乡 146.35 13.70 194.49 18.26 160.49 1355.9 229. 05 21. 50
    大港头镇 55.26 5. 56 66. 57 6. 71 54. 77 496. 61 82. 68 8. 33
    黄村乡 130.72 15.07 192.57 22. 27 147.47 1 534. 74 223. 45 25. 84
    太平乡 71.72 8.38 106.07 12.40 84. 39 887.99 127.27 14.88
    南明山街道 42.74 5.17 56.08 6.78 39.2 426.67 54.21 6.56

    Table 2.  Water retention of study area from 1994 to 2015

    乡镇名称 年平均增长率/%
    1994-2001 2001-2008 2008-2015 1994-2015
    万象街道 2.12 -6.22 5.38 0.58
    岩泉街道 6.57 -3.49 4.87 9.63
    市白云山林场 7.77 -3.49 4.62 10.36
    白云街道 5.36 -3.70 4.15 6.23
    雅溪镇 7.18 -3.15 4.73 10.73
    紫金街道 5.13 -3.28 4.56 7.68
    联城街道 6.47 -3.02 4.77 10.27
    老竹畲族镇 6.79 -2.59 4.50 10.91
    莲都林场 4.18 -1.97 4.26 8.39
    仙渡乡 5.53 -2.67 4.68 9.69
    丽新畲族乡 5.59 -2.68 4.46 9.19
    碧湖镇 7.08 -3.74 5.02 10.02
    峰源乡 4.70 -2.50 4.28 8.07
    大港头镇 2.92 -2.53 4.82 7.09
    黄村乡 6.76 -3.35 4.86 10.13
    太平乡 6.84 -2.92 4.81 11.06
    南明山街道 4.46 -4.30 3.96 3.83

    Table 3.  Characteristics of water retention function in different periods from 1994 to 2015
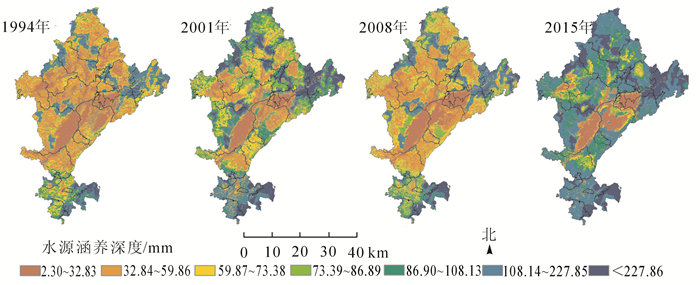
  • 图 3可以看出:研究区1994,2001,2008,2015年的水源涵养功能空间差异明显。1994年水源涵养深度为69.98 mm,仅东北部黄村乡、北部雅溪镇和南部峰源乡部分地区水源涵养功能较高。2001年水源涵养深度为98.40 mm,南部峰源乡、莲都林场和东北部黄村乡水源涵养功能好于其他地区,个别地区水源涵养深度达到300 mm以上,中部地区水源涵养功能较低;水源涵养深度较大的区域面积明显增大。2008年研究区水源涵养深度为82.36 mm,水源涵养功能空间格局整体与1994年相似,但略好于1994年。2015年水源涵养深度为114.01 mm,水源涵养功能较高的地区为南部峰源乡和莲都林场,其次是东北部黄村乡和雅溪镇,水源涵养功能较低的区域主要分布在中部白云街道、万象街道、南明山街道和碧湖镇等地。水源涵养深度较大的区域面积明显进一步增大。1994-2001年,研究区水源涵养深度仅中部城镇和农田呈现减少趋势,其他地区均有不同程度的增长,大部分地区增长量为20~40 mm,部分地区增长量达40 mm以上。2001-2008年,研究区水源涵养功能下降明显,其中北部和中部地区降幅较大。2008-2015年,研究区水源涵养功能增长迅速,其中中部和北部地区水源涵养功能变化最为剧烈,南部地区水源涵养功能已处于较高水准,因此增长并不明显。1994-2015年,研究区各地区水源涵养功能均有不同程度的增长,其中南部峰源乡和莲都林场尤为明显,其次是莲都区北部黄村乡、雅溪镇、岩泉街道和太平乡等地,中部地区虽有一定程度的提高,但部分地区水源涵养功能仍处于较低的水平。对比土地覆被类型变化和水源涵养功能可以看出,森林植被面积的提高能有效改善区域水源涵养功能状况。不过研究区2008年由于整体降水量较低,导致当年水源涵养量并不理想。

    Figure 3.  Spatial distribution characteristics of water retention in Liandu District

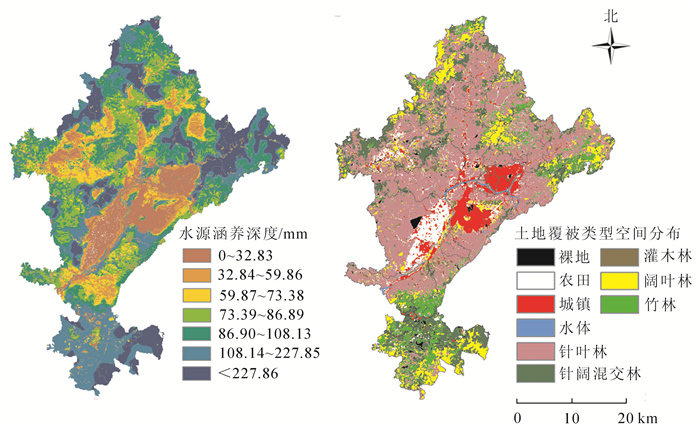
  • 选取2015年研究区水源涵养结果及其相关的12项因子(降水量、潜在蒸发量、植物可利用水、土壤深度、流速系数、土壤饱和导水率、地形指数、数字高程数据、实际蒸散量、森林面积比例、裸地城镇面积比例和阔叶、针阔混交林面积比例),基于Arc GIS平台,使用Arc GIS流域分析算法,将研究区划分为122个小流域,并以小流域为单位统计水源涵养量及各因子平均值。利用SPSS 19.0对统计数据进行逐步回归分析,保留显著因子、剔除非显著因子,方程最后得到R2为0.894,表明方程拟合程度较好,可信程度较高。由表 4可知:土壤饱和导水率对研究区水源涵养功能的正面影响最大,阔叶、针阔叶混交林面积比例和降水量的正面影响次之,并且土壤饱和导水率会随着植被的改善和群落的演替而提高[27-28],因此,森林结构的改善将进一步改善水源涵养;裸地、城镇面积比例有较高的负面影响,实际蒸散量的负面影响程度相对较小,但具有较高的负相关性。由此可以看出:影响研究区水源涵养功能的因素主要可分为两大类:气候因素和下垫面特征,其中下垫面特征对水源涵养功能的影响程度更高。下垫面特征因素表明当区域内土壤属性改善,阔叶林、针阔混交林面积增加,裸地及城镇面积减少时,相应的会增强区域内的水源涵养功能。气候因素表明当区域内获得更多的降水,并同时减少蒸散的情况下,水源涵养功能将随着提高。以上因素是相辅相成,共同对水源涵养功能发挥作用的。研究区1994-2015年水源涵养功能提高的原因,主要是21 a间研究区森林面积的增加和结构的改善。

    因素 标准化系数 显著性 偏相关性 方差膨胀因子
    土壤饱和导水率 0.644 0.000 0.824 1.842
    阔叶、针阔混交林面积比例 0.245 0.000 0.426 2.546
    降水量 0.194 0.000 0.344 2.633
    实际蒸散量 -0.225 0.000 -0.336 3.731
    裸地、城镇面积比例 -0.171 0.004 -0.267 3.583

    Table 4.  Influencing factors of water retention

  • 基于1994和2001年土地覆被类型分类结果数据,利用CA-Markov模型对莲都区2015年的土地覆被类型进行模拟,利用模拟结果与2015年土地覆被实际类型进行对比,检验其精度,得到Kappa系数为0.72,为中等一致性,模拟结果可信。基于2001和2015年土地覆被类型分类结果,利用CA-Markov模型对2030年莲都区土地覆被类型进行模拟预测(表 5)。如图 4所示:研究区2030年土地覆被类型整体与2015年差异不大。城镇、阔叶林、竹林和针阔混交林均有不同程度的增长,其中针阔混交林增幅最大,面积和比例分别增长了3.40×10⁴ hm2和2.27%,城镇、阔叶林和竹林的面积比例分别增长了1.10%,1.81%和1.49%。针叶林、灌木林、裸地、农田和水体呈现下降趋势,其中针叶林降幅最大,面积和比例分别下降了9.57×10⁴ hm2和6.37%;裸地、农田、水体和灌木林略有下降,降幅较小。从空间上来看,2015-2030年,研究区北部变化相对明显,原有针叶林逐渐被阔叶林、针阔混交林和竹林替代,变化部分主要发生于斑块交接区域。研究区城镇在原有基础上稳定发展,在瓯江两岸逐渐扩张并相互连接,同时碧湖镇的村落也逐步发展增大。虽然研究区城镇发展分布广泛,但由于研究区城镇周边公益林面积较大,限制了城镇的向外快速扩张。

    土地覆被类型 面积/(×104 hm2) 比例/%
    裸地 0.25 1.66
    农田 l.l3 7.52
    城镇 1.26 8.38
    水体 0.14 0.93
    针叶林 5.l3 34.09
    灌木林 0.21 1.40
    阔叶林 2.44 16.21
    竹林 1.59 10.56
    针阔混交林 2.89 19.25

    Table 5.  Area prediction of land cover of Liandu District in 2030

    Figure 4.  Prediction of land cover and water retention of Liandu District in 2030

  • 预测结果显示,研究区2030年水源涵养总量为1.81×10⁸ m3,水源涵养深度为112.90 mm,与2015年相比整体差异较小,略有下降。2030年研究区水源涵养能力最好为峰源乡和黄村乡,其水源涵养深度分别为228.27和223.29 mm,其次为莲都林场、市白云山林场、岩泉街道、雅溪镇、太平乡、紫金街道和老竹畲族乡,水源涵养深度均在100 mm以上,其余乡镇地区水源涵养深度均在100 mm以下。黄村乡和雅溪镇水源涵养总量较高,分别为2.32×10⁷ m3和2.23×10⁷ m3。根据模拟结果来看,莲都区在未来增强水源涵养功能的任务仍十分艰巨。重点应该关注北部和西部地区,这2个地区有较高的水源涵养潜力。建议对其林型结构进行逐步改善,提高当地的生物多样性水平,增强生态系统稳定性。南部地区为水源涵养最高的地区,应该继续维护其目前的森林建设水平,保持现状。中部地区是以城镇分布为主,难以实现较好的水源涵养能力。因此,应该注重城镇周边山体植被修复和城市内部绿地建设,有效利用各类绿地,提高单位面积的水源涵养能力。

  • 1994-2015年,莲都区土地覆被类型变化明显,森林面积和结构改善显著。针阔混交林、阔叶林和竹林面积分别增加了1.42×104,1.06×104和0.84×10⁴ hm2,裸地面积减少了1.91×10⁴ hm2。森林面积的增加有效地改善生态系统环境,有利于莲都区水源涵养功能建设和区域可持续发展。

    21 a间,莲都区水源涵养功能提高了69.92%,其中前期的增速要高于后期;从空间分布上来看,莲都区水源涵养功能南部地区好于北部地区,中部地区最差,其中雅溪镇和黄村乡的水源涵养功能最好,21 a间水源涵养深度分别提高了82.70和92.73 mm,万象街道的水源涵养功能最差,21 a间仅提高了1.10 mm。

    2030年模拟结果显示,莲都区水源涵养功能与2015年差异不大,水源涵养深度和总量分别为112.90 mm和1.81×10⁸ hm3,西部和北部地区水源涵养提升潜力较大。

    气候因素和下垫面特征是影响莲都区水源涵养功能的2个主要因素。下垫面因素中,土壤饱和导水率和不同土地覆被类型的面积比例对水源涵养功能有重要影响;在气候因素变化难以控制情况下,唯一措施就是通过改善植被来提高区域水源涵养功能,保障区域水资源安全。

Reference (28)

Catalog

    /

    DownLoad:  Full-Size Img  PowerPoint
    Return
    Return