Volume 39 Issue 4
Jul.  2022
Turn off MathJax
Article Contents

ZHOU Dongyang, WANG Xiaoyu, ZHU Xiangtao, ZHAN Misha, BAI Shangbin. Estimation and uncertainty analysis of carbon,nitrogen,and phosphorus concentrations in trunks of five dominant tree species in subtropical evergreen broadleaved forests[J]. Journal of Zhejiang A&F University, 2022, 39(4): 727-733. doi: 10.11833/j.issn.2095-0756.20220171
Citation: ZHOU Dongyang, WANG Xiaoyu, ZHU Xiangtao, ZHAN Misha, BAI Shangbin. Estimation and uncertainty analysis of carbon,nitrogen,and phosphorus concentrations in trunks of five dominant tree species in subtropical evergreen broadleaved forests[J]. Journal of Zhejiang A&F University, 2022, 39(4): 727-733. doi: 10.11833/j.issn.2095-0756.20220171

Estimation and uncertainty analysis of carbon,nitrogen,and phosphorus concentrations in trunks of five dominant tree species in subtropical evergreen broadleaved forests

doi: 10.11833/j.issn.2095-0756.20220171
  • Received Date: 2022-02-28
  • Accepted Date: 2022-05-17
  • Rev Recd Date: 2022-03-19
  • Available Online: 2022-07-20
  • Publish Date: 2022-08-20
  •   Objective  Tree trunk sampling is destructive and difficult to obtain in comparison with soil and litter sampling. Therefore, small-size sampling is often used to estimate its composition. The purpose of this study is to evaluate the uncertainty in estimating mass fraction and reserve of carbon, nitrogen, and phosphorus (C, N, P) in trunks of different tree species caused by small-size sampling.   Method  Based on the data sets of C, N, and P concentrations of five dominant tree species in subtropical evergreen broad-leaved forests, including Pinus massoniana, Cunninghamia lanceolata, Schima superba, Quercus glauca, and Phyllostachys edulis (sampling size n=18−32), Bootstrap method was used to compare the estimated differences between small-size samples (n=3−5) and full samples (n=18−32). By weighing the relationship between sampling quantity and variation, the recommended sampling quantity of corresponding index and the estimation error range of different sampling quantities are given.   Result  The variation of C concentration of P. massoniana was significantly higher than that of other tree species. A small sample size of n =3−5 caused an estimation error of about ±10%, but only ± 5% for other tree species. For P. massoniana, the estimation error was −4% to 5% when the sample size was increased to 10.   Conclusion  It is suggested to appropriately increase the sampling quantity (n=5−10) to reduce the estimation error when estimating and evaluating C, N and P reserves of P. massoniana forest. If a small sample size of n=3−5 is used, an estimation error range of ±10% should be taken into account. When estimating C, N and P concentration of other tree species, the estimation error is within the acceptable range when n =4−5. [Ch, 2 fig. 2 tab. 27 ref.]
  • [1] DOU Xiaowen, WU Dengyu, ZHANG Xiaojing, TANG Mengping.  Study on the factors affecting breast-height basal area increment of evergreen broad-leaved forest in Mount Tianmu . Journal of Zhejiang A&F University, 2023, 40(5): 1063-1072. doi: 10.11833/j.issn.2095-0756.20220651
    [2] HUANG Yijie, ZHANG Jialong, HU Yaopeng, CHENG Tao.  Uncertainty analysis of estimating aboveground biomass of Pinus densata by remote sensing . Journal of Zhejiang A&F University, 2022, 39(3): 531-539. doi: 10.11833/j.issn.2095-0756.20210473
    [3] WANG Xia, HU Haibo, CHENG Can, ZHANG Shuai, CHEN Jianyu, LU Honglin.  Soil PhytOC sequestration in Quercus acutissima forest in northern subtropics . Journal of Zhejiang A&F University, 2021, 38(1): 1-9. doi: 10.11833/j.issn.2095-0756.20200283
    [4] XU Qihu, LIN Liping, XUE Chunquan, LUO Yong, LEI Yuancai.  Component specific carbon content and storage of Cinnamomum camphora in Guangdong Province . Journal of Zhejiang A&F University, 2019, 36(1): 70-79. doi: 10.11833/j.issn.2095-0756.2019.01.010
    [5] SHI Jianjian, CAI Jianguo, LIU Pengpeng, WEI Yunlong.  Forest carbon storage function value at Hangzhou Huagangguanyu Park . Journal of Zhejiang A&F University, 2018, 35(5): 829-835. doi: 10.11833/j.issn.2095-0756.2018.05.006
    [6] PENG Yang, BAI Yanfeng, JIANG Chunqian, XU Rui, LIU Xiuhong.  Carbon storage differences for farmland with two rehabilitation approaches . Journal of Zhejiang A&F University, 2018, 35(2): 235-242. doi: 10.11833/j.issn.2095-0756.2018.02.006
    [7] YAN Dongfeng, GUO Dandan, WU Guicang, YANG Xitian.  Carbon and nitrogen distribution with forest tending in a natural secondary oak forest . Journal of Zhejiang A&F University, 2017, 34(2): 215-224. doi: 10.11833/j.issn.2095-0756.2017.02.003
    [8] YU Shuhong, ZHOU Guomo, SHI Yongjun, LÜ Yulong, SHEN Zhenming.  Net carbon sinks in the initial stages of moso bamboo stands . Journal of Zhejiang A&F University, 2016, 33(5): 807-815. doi: 10.11833/j.issn.2095-0756.2016.05.012
    [9] LI Meng, SHI Yongjun, ZHOU Guomo, ZHOU Dayong, ZHANG Jiao, ZHANG Yinghai.  Measurement of carbon sequestration of highway afforestation in Jiaxing, Zhejiang, China . Journal of Zhejiang A&F University, 2014, 31(3): 329-335. doi: 10.11833/j.issn.2095-0756.2014.03.001
    [10] BAI Yanfeng, ZHANG Shougong, JIANG Chunqian.  International comparison of carbon flows of harvested wood products . Journal of Zhejiang A&F University, 2014, 31(1): 72-77. doi: 10.11833/j.issn.2095-0756.2014.01.011
    [11] CHEN Xiaorong, CHEN Yuanyuan, LUO Zhengrong, DING Bingyang.  A 5-year mid-mountain subtropical evergreen broadleaved forest study in Baishanzu,east China . Journal of Zhejiang A&F University, 2013, 30(6): 821-829. doi: 10.11833/j.issn.2095-0756.2013.06.004
    [12] BAI Yanfeng, JIANG Chunqian, ZHANG Shougong, LEI Jingpin.  Carbon accounting approaches for wood products and potential applications . Journal of Zhejiang A&F University, 2013, 30(3): 423-427. doi: 10.11833/j.issn.2095-0756.2013.03.020
    [13] LI Cuiqin, ZHOU Yufeng, GU Lei, SHI Yongjun, SHEN Zhenming, XU Xiaojun, LI Ruijun.  Carbon transfer of Phyllostachys edulis filar products . Journal of Zhejiang A&F University, 2013, 30(1): 63-68. doi: 10.11833/j.issn.2095-0756.2013.01.009
    [14] SUN Chong, LIU Qijing.  Carbon storage changes for major forest types in Beijing . Journal of Zhejiang A&F University, 2013, 30(1): 69-75. doi: 10.11833/j.issn.2095-0756.2013.01.010
    [15] LIU Xin-xin, ZHANG Ming-ru, WEN Guo-sheng, ZHANG Jun, ZOU Lin-li, WU Gang.  Photosynthetic characteristics for fifteen potted seedlings common to Zhejiang Province . Journal of Zhejiang A&F University, 2012, 29(2): 173-179. doi: 10.11833/j.issn.2095-0756.2012.02.004
    [16] CUI Rui-rui, DU Hua-qiang, ZHOU Guo-mo, XU Xiao-jun, DONG De-jin, Lü Yu-long.  Remote sensing-based dynamic monitoring of moso bamboo forest and its carbon stock change in Anji County . Journal of Zhejiang A&F University, 2011, 28(3): 422-431. doi: 10.11833/j.issn.2095-0756.2011.03.012
    [17] CAI Li-sha, CHEN Xian-gang, GUO Yin, YIN Yao.  Carbon sequestration potential with the Grain for Green Program in Guizhou Province . Journal of Zhejiang A&F University, 2009, 26(5): 722-728.
    [18] TANG Meng-ping, ZHOU Guo-mo, SHI Yong-jun, CHEN Yong-gang, WU Ya-qi, ZHAO Ming-shui.  Minimum sampling area and species diversity of evergreen broadleaved forest community in Mount Tianmu . Journal of Zhejiang A&F University, 2006, 23(4): 357-361.
    [19] LI Zheng-cai, FU Mao-yi, XIE Jin-zhong, ZHOU Ben-zhi, XIAO Ti-quan, WU Ming.  Carbon sequestration of 5 ecological reestablishment vegetation types in Muchuan County of Sichuan . Journal of Zhejiang A&F University, 2004, 21(4): 382-387.
    [20] LI Cui-huan, YU Shu-quan, ZHOU Guo-mo.  Review of reserches in restoration of subtropical evergreen broad-leaved forests . Journal of Zhejiang A&F University, 2002, 19(3): 325-329.
  • [1]
    TANG Xuli, ZHAO Xia, BAI Yongfei, et al. Carbon pools in China’s terrestrial ecosystems: new estimates based on an intensive field survey [J]. Proc Natl Acad Sci USA, 2018, 115(16): 4021 − 4026.
    [2]
    LIU Guohua, FU Bojie, FANG Jingyun. Carbon dynamics of Chinese forests and its contribution to global carbon balance [J]. Acta Ecol Sin, 2000, 20(5): 733 − 740.
    [3]
    DENG Renju, YANG Wanqin, ZHANG Jian, et al. Carbon, nitrogen and phosphorus storage in soil organic layer of the subalpine forests in western Sichuan [J]. Chin J Appl Environ Biol, 2007, 13(4): 492 − 496.
    [4]
    XU Li, HE Nianpeng. Nitrogen storage and allocation in China’s forest ecosystems [J]. Sci Sin Terrae, 2020, 50(10): 1374 − 1385.
    [5]
    GIBBS H K, BROWN S, NILES J O, et al. Monitoring and estimating tropical forest carbon stocks: making REDD a reality [J]. Environ Res Lett, 2007, 2(4): 1 − 13.
    [6]
    SAATCHI S S, HARRIS N L, BROWN S, et al. Benchmark map of forest carbon stocks in tropical regions across three continents [J]. Proc Natl Acad Sci USA, 2011, 108(24): 9899 − 9904.
    [7]
    FANG Jingyun, GUO Zhaodi, PIAO Shilong, et al. Estimation of terrestrial vegetation carbon sink in China from 1981 to 2000 [J]. Sci Sin Terrae, 2007, 37(6): 804 − 812.
    [8]
    FANG Jingyun, CHEN Anping, ZHAO Shuqing, et al. Estimation biomass carbon of China’s forests: supplementary notes on report published in Science ( 291: 2320−2322) by Fang et al. (2001) [J]. Chin J Plant Ecol, 2002, 26(2): 243 − 249.
    [9]
    FANG Jingyun, CHEN Anping. Dynamic forest biomass carbon pools in China and their significance [J]. Acta Bot Sin, 2001, 43(9): 967 − 973.
    [10]
    XING Xuerong, HAN Xingguo, CHEN Lingzhi. A review on research of plant nutrient use efficiency [J]. Chin J Appl Ecol, 2000, 11(5): 785 − 790.
    [11]
    TANG Zhiyao, XU Wenting, ZHOU Guoyi, et al. Patterns of plant carbon, nitrogen, and phosphorus concentration in relation to productivity in China’s terrestrial ecosystems [J]. Proc Natl Acad Sci USA, 2018, 115(16): 4033 − 4038.
    [12]
    LAMLOM S H, SAVIDGE R A. A reassessment of carbon content in wood: variation within and between 41 North American species [J]. Biomass Bioenergy, 2003, 25(4): 381 − 388.
    [13]
    MARTIN A R, DORAISAMI M, THOMAS S C, et al. Global patterns in wood carbon concentration across the world’s trees and forests [J]. Nat Geosci, 2018, 11(12): 915 − 920.
    [14]
    MARTIN A R, ERICKSON D L, KRESS W J, et al. Wood nitrogen concentrations in tropical trees: phylogenetic patterns and ecological correlates [J]. New Phytol, 2014, 204(3): 484 − 495.
    [15]
    KANG Bing, LIU Shirong, ZHANG Guangjun, et al. Carbon accumulation and distributionin in Pinus massoniana and Cunninghamia lanceolata mixed forest ecosystem in Daqingshan, Guangxi of China [J]. Acta Ecol Sin, 2006, 26(5): 1320 − 1329.
    [16]
    ZHANG Zhijun, ZHANG Xiaoquan, WANG Yanhui, et al. Carbon storage and distribution of Pinus massoniana forest ecosystem in Tieshanping of Chongqing [J]. Sci Silv Sin, 2009, 45(5): 49 − 53.
    [17]
    DING Bo, DING Guijie, ZHANG Yaorong. Effects of density regulation on carbon storage of Pinus massoniana plantation ecosystem [J]. J Northwest For Univ, 2016, 31(3): 197 − 203.
    [18]
    PAN Jinwen, GUO Qiqiang, SUN Xueguang, et al. Contents and stoichiometric characteristics of C, N, P and K under different stand ages of Pinus massoniana plantations [J]. J Plant Nutr Fert, 2020, 26(4): 746 − 756.
    [19]
    ELSER J J, FAGAN W F, DENNO R F, et al. Nutritional constraints in terrestrial and freshwater food webs [J]. Nature, 2000, 408(6812): 578 − 580.
    [20]
    LI Yongjin, TANG Yuxi, TANG Jie, et al. Carbon storage characteristics of four kinds of young mixed forest ecosystem in China’s mid-subtropical area [J]. J Cent South Univ For Technol, 2019, 39(5): 56 − 62.
    [21]
    TANG Xuejun, WANG Weifeng, XIAO Shunzhen, et al. Plants and soil C, N and P ecological stoichiometry of Pinus tabulaeformis plantations in Chifeng City, Inner Mongolia [J]. Areal Res Dev, 2020, 39(3): 162 − 167.
    [22]
    ZHAO Rui, WANG Chuankuan, QUAN Xiankui, et al. Ecological stoichiometric characteristics of different organs of broad-leaved tree species in a temperate forest in Maoershan area, Heilongjiang Province [J]. Sci Silv Sin, 2021, 57(2): 1 − 11.
    [23]
    CAI Guojun, SUO Penchun, ZHANG Limin, et al. C, N, P stoichiometric characteristics in different organs of three constructive plants in karst peak-cluster depressions in southern Guizhou, Southwest China [J]. J Guizhou Norm Univ Nat Sci Ed, 2021, 39(5): 36 − 44.
    [24]
    ZHOU Yongjiao, WANG Mantang, WANG Zhaoying, et al. Nutrient and ecological stoichiometry of different root order fine roots of 59 evergreen and deciduous tree species in subtropical zone [J]. Acta Ecol Sin, 2020, 40(14): 4975 − 4984.
    [25]
    CAI Fei, ZOU Bing, ZHENG Jingming, et al. Fine root morphology and carbon and nitrogen contents of 11 tree species in subtropical ever green forest [J]. J Northwest A&F Univ Nat Sci Ed, 2014, 42(5): 45 − 54.
    [26]
    FU Ziqi. Root Morphology and Phosphprus Classification Characteristics of Different Tree Species in Subtropical Forests[D]. Changsha: Central South University of Forestry & Technology, 2021.
    [27]
    LIU Lu, GE Jielin, SHU Huawei, et al. C, N and P stoichiometric ratios in mixed evergreen and deciduous broadleaved forests in Shennongjia, China [J]. Chin J Plant Ecol, 2019, 43(6): 482 − 489.
  • 加载中
通讯作者: 陈斌, bchen63@163.com
  • 1. 

    沈阳化工大学材料科学与工程学院 沈阳 110142

  1. 本站搜索
  2. 百度学术搜索
  3. 万方数据库搜索
  4. CNKI搜索

Figures(2)  / Tables(2)

Article views(399) PDF downloads(39) Cited by()

Related
Proportional views

Estimation and uncertainty analysis of carbon,nitrogen,and phosphorus concentrations in trunks of five dominant tree species in subtropical evergreen broadleaved forests

doi: 10.11833/j.issn.2095-0756.20220171

Abstract:   Objective  Tree trunk sampling is destructive and difficult to obtain in comparison with soil and litter sampling. Therefore, small-size sampling is often used to estimate its composition. The purpose of this study is to evaluate the uncertainty in estimating mass fraction and reserve of carbon, nitrogen, and phosphorus (C, N, P) in trunks of different tree species caused by small-size sampling.   Method  Based on the data sets of C, N, and P concentrations of five dominant tree species in subtropical evergreen broad-leaved forests, including Pinus massoniana, Cunninghamia lanceolata, Schima superba, Quercus glauca, and Phyllostachys edulis (sampling size n=18−32), Bootstrap method was used to compare the estimated differences between small-size samples (n=3−5) and full samples (n=18−32). By weighing the relationship between sampling quantity and variation, the recommended sampling quantity of corresponding index and the estimation error range of different sampling quantities are given.   Result  The variation of C concentration of P. massoniana was significantly higher than that of other tree species. A small sample size of n =3−5 caused an estimation error of about ±10%, but only ± 5% for other tree species. For P. massoniana, the estimation error was −4% to 5% when the sample size was increased to 10.   Conclusion  It is suggested to appropriately increase the sampling quantity (n=5−10) to reduce the estimation error when estimating and evaluating C, N and P reserves of P. massoniana forest. If a small sample size of n=3−5 is used, an estimation error range of ±10% should be taken into account. When estimating C, N and P concentration of other tree species, the estimation error is within the acceptable range when n =4−5. [Ch, 2 fig. 2 tab. 27 ref.]

ZHOU Dongyang, WANG Xiaoyu, ZHU Xiangtao, ZHAN Misha, BAI Shangbin. Estimation and uncertainty analysis of carbon,nitrogen,and phosphorus concentrations in trunks of five dominant tree species in subtropical evergreen broadleaved forests[J]. Journal of Zhejiang A&F University, 2022, 39(4): 727-733. doi: 10.11833/j.issn.2095-0756.20220171
Citation: ZHOU Dongyang, WANG Xiaoyu, ZHU Xiangtao, ZHAN Misha, BAI Shangbin. Estimation and uncertainty analysis of carbon,nitrogen,and phosphorus concentrations in trunks of five dominant tree species in subtropical evergreen broadleaved forests[J]. Journal of Zhejiang A&F University, 2022, 39(4): 727-733. doi: 10.11833/j.issn.2095-0756.20220171
  • 森林是陆地生态系统中重要的养分储存库之一,有关森林碳(C)、氮(N)、磷(P)储量和潜力的研究在全球和区域尺度上都十分广泛[1-4]。地处中国亚热带地区的森林生态系统具有极高的碳密度和养分含量,准确评估其碳、氮、磷储量具有重要现实和理论意义[5-6]。植被养分储量评估的准确程度与生物量和养分含量密切相关。以往研究所涉及的平均生物量密度法、平均生物量转换因子法、改善模型连续生物量转换因子法和异速生长方程模型等[7-9],都是通过提高生物量估算精度以提升养分储量评估准确性;针对树木养分含量计算误差和不确定性的研究相对较少[10-11]。虽有部分研究关注了不同树种、部位、树龄等因素间养分含量的差异[12-14],但受取样方法所限,对树干养分含量的研究仍较匮乏。此外,林学和生态学领域通常采用的小样本取样法(取样量n=3~5)难以客观代表总体养分含量,增加样本数可在何种程度上提高估算结果的精度值得开展进一步研究。因此,本研究以浙江省五洩国家森林公园中5种具有代表性的亚热带常绿阔叶树种为研究对象,采用有放回抽样方法(Bootstrap)模拟并比较小样本取样(n=3~5)和完整样本取样(n=18~32)的估算结果,评估小样本取样产生的养分质量分数估算误差。权衡取样量和估算精度,分别提出估算碳、氮、磷储量的最优取样量,为相关野外研究工作提供取样方法的建议。

    • 研究样地位于浙江省绍兴市五洩国家森林公园(29°43′19.08″N,120°03′06.09″E),在森林公园中部无人为干扰的典型亚热带常绿阔叶林区域,设3个50 m × 50 m的样地作为长期固定监测样地。样地内优势树种为马尾松Pinus massoniana、杉木Cunninghamia lanceolata、木荷Schima superba、青冈Quercus glauca和毛竹Phyllostachys edulis。2018年11月于样地内随机选取一定数量的5种优势树种,分别截取1 m长度的树干圆盘,具体取样数为马尾松32、杉木21、木荷30、青冈30和毛竹18。将取样圆盘于45 ℃烘干至恒量,选取部分组织粉碎待用。采用元素分析仪测定碳和氮质量分数(Elementar Analysen system, Bran & Luebb GmbH,德国),采用Auto Analyzer测定磷质量分数(AA3, Bran+Luebb GmbH,德国)。

    • 采用单因素方差分析检测树种间和树种内部不同圆盘样本之间的碳、氮、磷质量分数差异。在不同树种的碳、氮、磷样本中(n=18~32),采用Bootstrap估算随取样量增加各树种养分估算值总平方误差变化情况。预计估算值的总平方误差将随取样量增加而减小,取样量较小时(n=3~5)估算误差最大,可能检测到一个处于中间区间建议取样量(ni)。利用随机抽样方式,比较常用的小样本(n=3~5)、ni与全样本导致的碳、氮、磷质量分数变异情况。所有统计和绘图工作利用R软件完成,其中利用“segmented”软件包进行阈值点的估算。
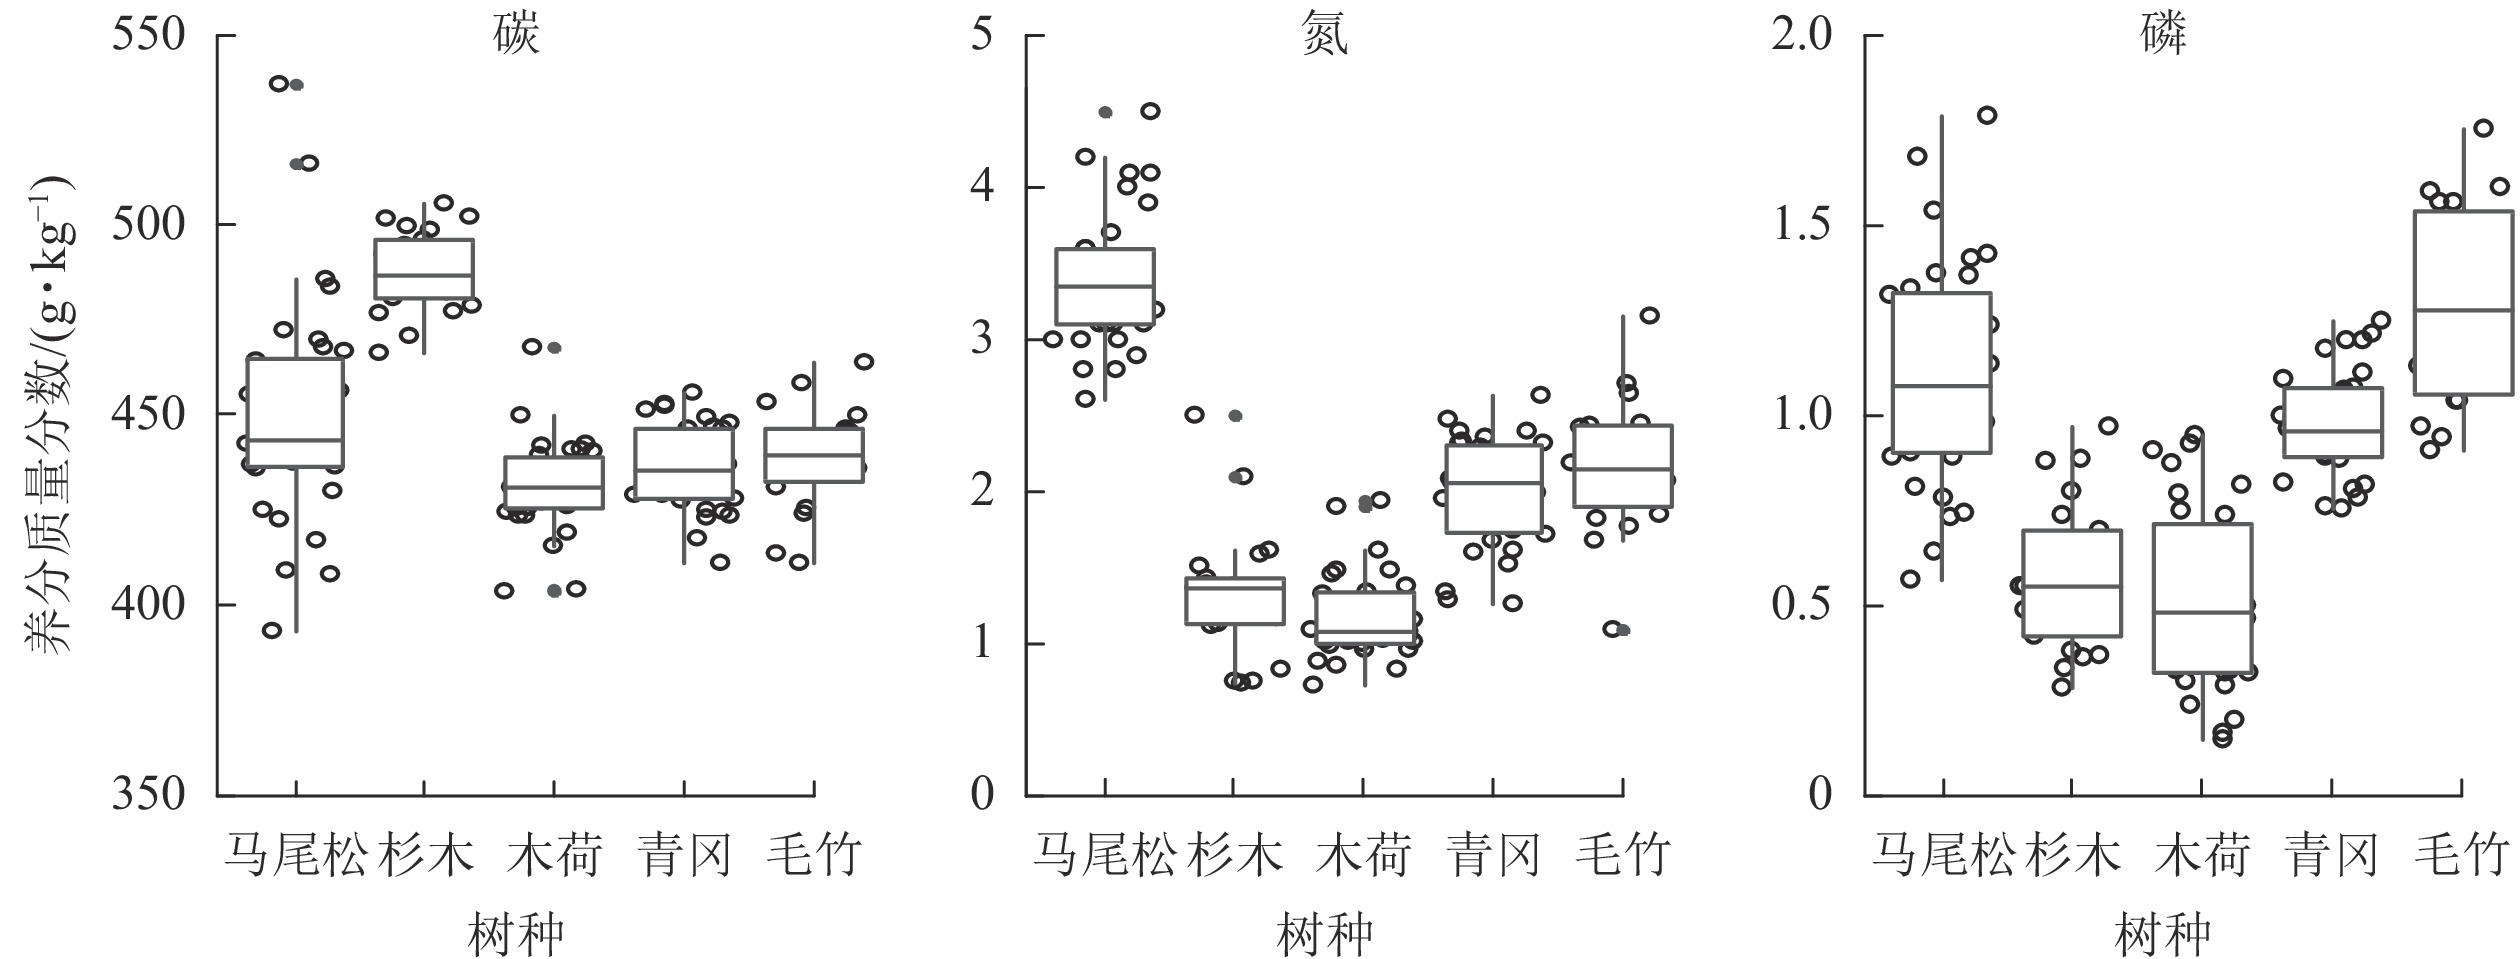
    • 图1表1可知:不同树种树干碳、氮、磷质量分数之间具有极显著差异(P<0.001);杉木碳质量分数极显著高于其他4个树种(P<0.001),木荷和青冈最低;马尾松氮质量分数最高(P<0.001),青冈和毛竹次之,杉木和木荷最低,但青冈和毛竹、杉木和木荷之间无显著差异;马尾松和毛竹的磷质量分数极显著高于其他树种(P<0.001),杉木和木荷较低,两者之间差异不显著。

      Figure 1.  Carbon (C), Nitrogen (N), and Phosphorus (P) concentration variation in the tree boles of five tree species in subtropical evergreen broadleaf forest

      表1可知:马尾松树干碳变异系数为7%,其他树种为2%~3%;马尾松氮变异系数最低,为12%,杉木最高,为31%,其他树种为20%~25%;青冈的磷变异系数最低,仅为14%,木荷最高,为46%,其他树种为20%~33%。总体上,树种之间的碳、氮、磷变异系数差异较大。马尾松碳变异幅度高于其他树种,氮变异系数低于其他树种;青冈磷变异系数较小,木荷较高,其他树种处于中间水平。

      树种样本数/个
      质量分数/(g·kg−1)变异系数/%质量分数/(g·kg−1)变异系数/%质量分数/(g·kg−1)变异系数/%
      马尾松32449.1±29.4 b73.4±0.4 a121.10±0.29 a26
      杉木 21487.6±10.7 a21.3±0.4 c315.80±0.19 c33
      木荷 30431.1±12.5 c31.2±0.3 c250.52±0.24 c46
      青冈 30435.9±11.5 c32.0±0.4 b200.98±0.14 b14
      毛竹 18438.6±14.1 bc32.2±0.5 b231.28±0.26 a20
        说明:数值为平均值±标准差。同列不同小写字母表示树种间差异极显著(P<0.001)

      Table 1.  Mean (standard deviation) and CV of C, N and P concentrations for 5 dominant tree species
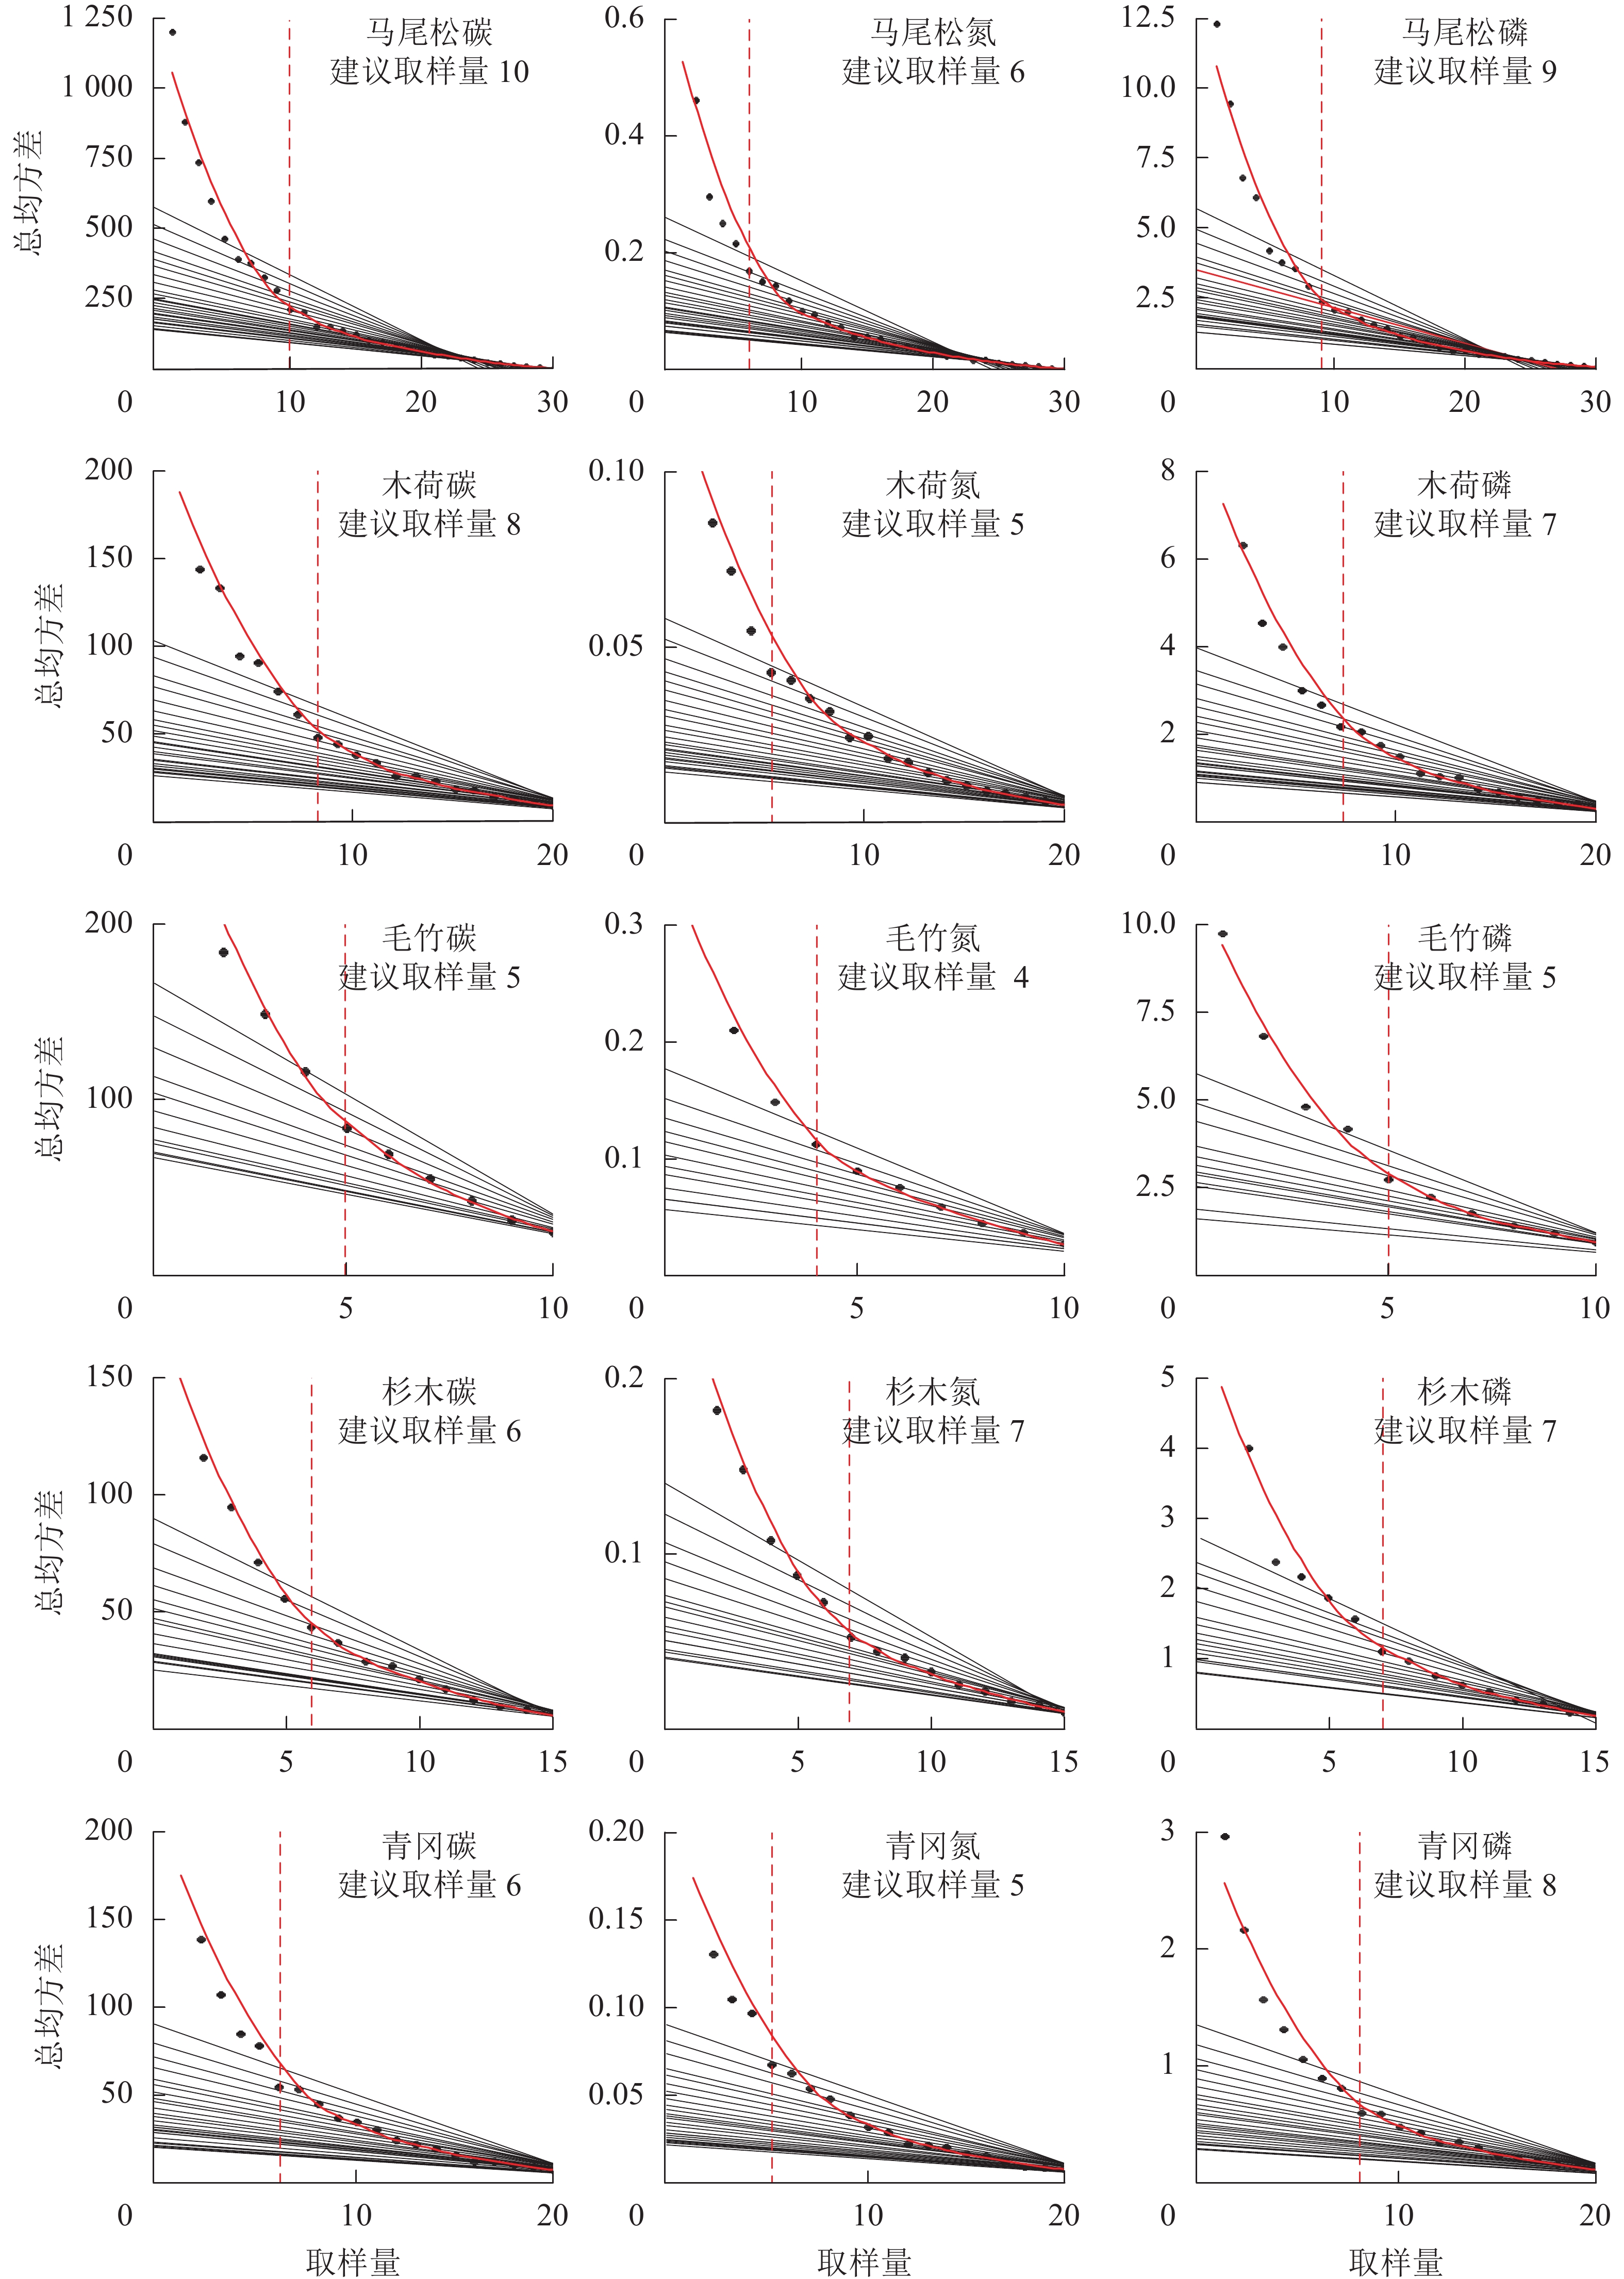
    • 图2可知:5个亚热带常绿阔叶林优势树种碳的建议取样量为5~10。其中马尾松建议取样量最大,为10,木荷为8,杉木和青冈为6,毛竹为5。亚热带常绿阔叶林优势树种氮的建议取样量为4~7。其中杉木建议取样数最大,为7,马尾松为6,木荷和青冈为5,毛竹最少,为4。亚热带常绿阔叶林优势树种磷的建议取样量为5~9。其中马尾松建议取样量最大,为9,青冈为8,杉木和木荷为7,毛竹最小,为5。

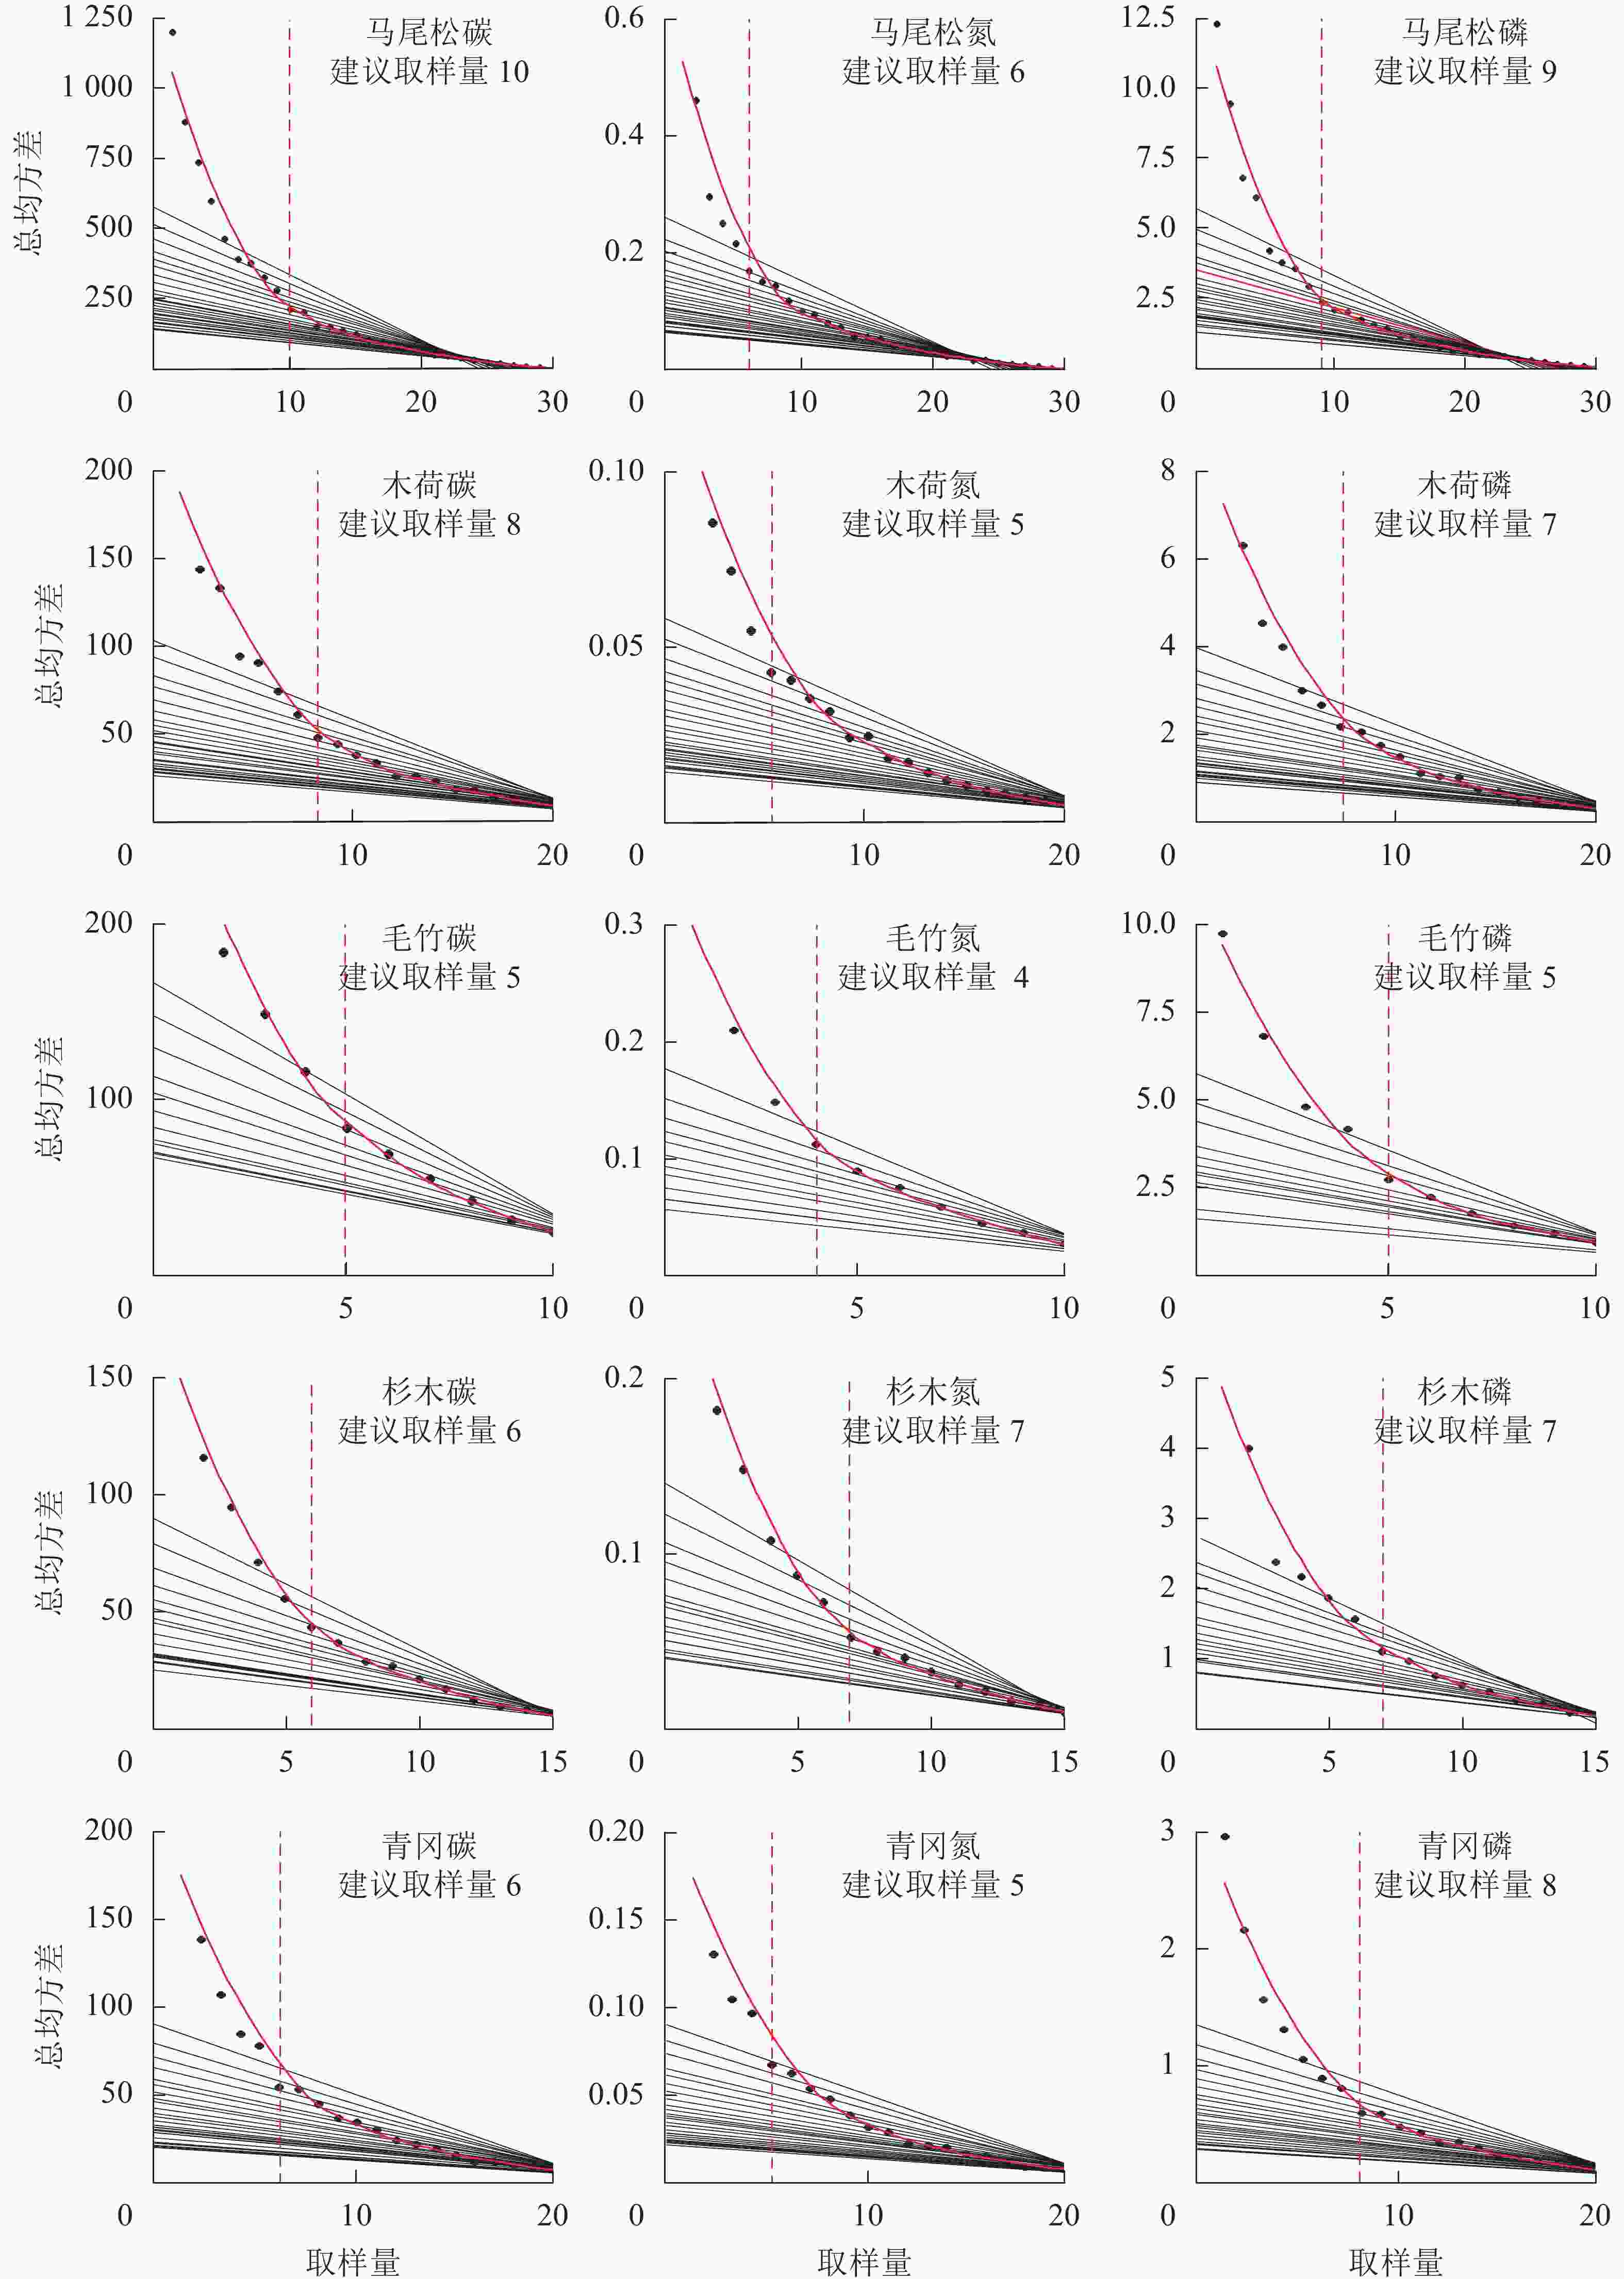
      Figure 2.  Trends of total squared error in the estimation of C, N, P concentration of tree boles with different sample sizes

    • 将该领域常用的小取样量(n=3~5)与上述估算的取样量进行比较(表2)发现:对于碳估算变化,马尾松由于树干碳质量分数变异较大,n=5小样本条件下质量分数估算误差为6%~7%,采样样本增加至n=10后估算误差为4%~5%;而对于其他树种,n=3即可保证5%的估算误差。对于氮质量分数变化,马尾松n=5小样本条件下氮质量分数为14%~15%,采样样本增加至n=10不能显著提高估算精度;其他树种也表现出一致规律,增加取样量不能有效降低估算误差。磷质量分数变异较大,增加样本没有显著降低取样误差,n=5小样本可以保证马尾松、杉木、木荷估算误差为30%~50%,而青冈和毛竹估算误差为15%~20%。

      养分树种总样本/建议取样量建议取样量估算误差/%估算误差/%
      n=3n=4n=5
      马尾松32/10−3.99~5.12−8.41~11.75−7.47~9.46−6.14~7.23
      杉木 21/6−1.90~2.00−3.36~2.92−2.81~2.58−2.09~1.87
      木荷 30/8−2.95~2.22−4.70~5.01−3.98~4.40−3.13~3.62
      青冈 30/6−2.89~2.78−4.32~3.97−3.20~3.02−3.14~2.88
      毛竹 18/5−3.37~3.30−5.15~4.48−3.37~3.76−3.37~3.30
      马尾松32/6−12.42~17.11−19.30~23.01−16.60~18.83−14.97~13.96
      杉木 21/7−26.46~27.03−41.27~51.44−31.67~44.95−29.82~37.00
      木荷 30/5−22.39~33.72−31.16~43.34−20.94~40.85−22.39~33.72
      青冈 30/5−21.63~20.36−31.89~20.93−23.86~20.70−21.63~20.36
      毛竹 18/4−26.04 ~25.65−30.48~30.12−26.04~25.65−19.74~19.71
      马尾松32/9−21.94~22.49−41.23~44.80−31.65~30.50−28.66~37.46
      杉木 21/7−30.70~26.10−42.85~46.81−40.42~49.80−38.35~43.98
      木荷 30/7−41.40~42.89−58.95~73.93−54.89~66.40−42.95~51.08
      青冈 30/8−11.79~13.29−18.32~20.15−18.76~17.18−15.07~17.55
      毛竹 18/5−18.06~22.52−24.53~26.72−22.01~24.37−18.06~22.52

      Table 2.  Comparison of the estimated extent of the population for different tree species suggested for ni and small sample size (n =3−5)

    • 相比于其他树种,马尾松的碳质量分数变异系数最大,建议采样样本数为10。马尾松是广泛分布于亚热带地区材用和造林树种,有关其碳含量的报道较多[15-18]。常绿阔叶林中,马尾松碳质量分数为41.78%~51.49%,平均为46.38%,变异系数约10%[18];而全国范围内,马尾松树干中碳平均质量分数为44.83%,变异系数约12%[11];全球尺度范围内,马尾松及同纬度地区陆生植物碳质量分数为46.4%,变异幅度约14%[19]。而在本研究中,样地尺度上马尾松树干碳质量分数为425.4~475.8 g·kg−1,平均值为450.0 g·kg−1,整体变异系数为7%。总体而言,碳质量分数变异幅度随尺度变大而升高。这些变异幅度指标可以为不同尺度水平下总碳质量分数估算的不确定性提供借鉴,即在全国范围内,关于马尾松的碳储量估算可能存在7%~12%的不确定性,而其他树种n=3~5小样本的估算误差在5%以下。李永进等[20]研究杉木等8种乡土树种碳质量分数时发现:树干、树枝、树叶和树根碳质量分数分别为454.7~500.0、426.0~474.0、448.4~495.8、436.0~490.4 g·kg−1,变异系数均在8%以上。唐学君等[21]研究内蒙古地区油松林碳储量变异情况时发现:油松人工林平均碳质量分数为502.49 g·kg−1,最大值为枝(514.20 g·kg−1),最小值为树干(485.58 g·kg−1),变异系数高达20%。赵瑞等[22]研究了东北常见的10个阔叶树种的碳质量分数,每个树种采样3个,各树种碳变异系数均约7%。以上研究结果与本研究结果相似。

      蔡国俊等[23]分析了黔南喀斯特峰丛洼地建群树种不同器官氮和磷化学计量特征,发现取样量为3时,氮和磷平均质量分数分别为(8.90±7.68)和(0.52±0.32) mg·g−1,变异系数分别为86.29%和61.54%,氮和磷质量分数变异较大。周永姣等[24]研究了亚热带59个常绿与落叶树种细根养分及化学计量特征,发现取样量为3时,根氮质量分数变异系数为42.14%~48.87%;而将采样样本数提高到4或5时,亚热带常绿阔叶林11个树种细根氮质量分数的总体变异系数可降至41.29%[25]。本研究也发现将采样强度由3提升至4或5时,树干氮质量分数估算误差显著降低。

      傅梓奇[26]测定了亚热带地区18个树种的根系磷质量分数(取样量为4或5),总体磷质量分数为0.3~0.8 g·kg−1 ,与本研究树干木质部的研究结果一致。刘璐等[27]对神农架常绿落叶阔叶混交林植物不同器官磷质量分数的研究发现:加权不同器官生物量(取样量为3)可知磷在不同整株植物中的总体变异系数为47.67%,这与本研究14%~46%的变异系数相吻合。另外,本研究还发现增加采样样本不能显著降低5个树种磷的估计误差。

    • 总体上,马尾松树干碳质量分数变异较大,在估算和评估马尾松林碳储量时,建议适当增加取样量(n=5~10)以降低估算误差,或在仍采用n=3~5小样本取样量的同时,将±10%估算误差范围考虑在内。对于其他树种的碳质量分数及所有树种的氮和磷质量分数,增加采样样本对估算误差的降低效果不明显,建议仍使用取样量n=4或n=5。

Reference (27)

Catalog

    /

    DownLoad:  Full-Size Img  PowerPoint
    Return
    Return