Volume 40 Issue 2
Apr.  2023
Turn off MathJax
Article Contents

ZHANG Heng, YUAN Shan, FU Zhiqiang, CHEN Ruifan, SHEN Chunhui, XI Ruchun. Comprehensive evaluation and index screening of excellent plants of Camellia semiserrata[J]. Journal of Zhejiang A&F University, 2023, 40(2): 374-381. doi: 10.11833/j.issn.2095-0756.20220376
Citation: ZHANG Heng, YUAN Shan, FU Zhiqiang, CHEN Ruifan, SHEN Chunhui, XI Ruchun. Comprehensive evaluation and index screening of excellent plants of Camellia semiserrata[J]. Journal of Zhejiang A&F University, 2023, 40(2): 374-381. doi: 10.11833/j.issn.2095-0756.20220376

Comprehensive evaluation and index screening of excellent plants of Camellia semiserrata

doi: 10.11833/j.issn.2095-0756.20220376
  • Received Date: 2022-06-02
  • Accepted Date: 2022-11-14
  • Rev Recd Date: 2022-11-10
  • Publish Date: 2023-04-20
  •   Objective  This study, with an investigation of the genetic variation characteristics of economic traits of Camellia semiserrata, is aimed to establish a prediction model based on the core evaluation indexes screened so as to provide a scientific basis for the formulation and utilization of C. semiserrata germplasm resources.  Method  With 31 excellent trees selected from the core production area of C. semiserrata as research subjects, a determination and analysis was conducted of 20 economic traits such as crown area, fruit yield per plant and oil yield per plant using multivariate statistical methods.  Result  (1) There were different degrees of variation in the 20 indicators of the participating strains of excellent trees, with a range of 3.25%−69.47% and between these indicators a total of 38 pairs of indicators reached the highly significant level (P<0.01) whereas 15 pairs reached the significant level (P<0.05). (2) With the principal component analysis, the 11 evaluation indicators were simplified into four independent composite indicators, with a cumulative contribution of 80.23%, retaining most of the information of each trait of the test material. (3) Based on the weights of the four integrated indicators and the values of the affiliation functions, the integrated scores of the excellent trees ranged from 0.151−0.674, with HY25, HY4, HY20, HY17 and HY1 displaying better comprehensive evaluation performance. (4) The prediction model was built for the evaluation of Camellia semiserrata excellent trees using a stepwise regression analysis with canopy area, fresh seed yield, dry seed yield, fresh fruit oil content, oil yield per plant and fruit yield efficiency per plant being the six core evaluation indicators. (5) The six core evaluation indicators can be classified into three categories using cluster analysis with categoryⅠ being the high quality type, categoryⅡ displaying better fecundity and quality whereas category Ⅲ being the fecundity type.  Conclusion  Single plant fruit yield, single plant fruit yield efficiency, canopy area, fruit yield efficiency per plant, oil yield per plant, fresh seed yield, dry seed yield and fresh fruit oil content can be used as important indicators to identify excellent trees of C. semiserrata and in accordance with this model, HY25, HY4, HY20, HY17 and HY1 were selected with favorable comprehensive evaluation. [Ch, 2 fig. 6 tab. 24 ref.]
  • [1] MA Bingru, CUI Jingxuan, WANG Yuyi, LIU Zijun, NING Ning, WANG Yunhe, YANG Limin, HAN Zhongming.  Comprehensive quality evaluation of Radix Saposhnikoviae based on multi-component contents determination . Journal of Zhejiang A&F University, 2024, 41(): 1-9. doi: 10.11833/j.issn.2095-0756.20230567
    [2] WANG Jie, ZHENG Guoquan.  Construction and measurement analysis of evaluation index system for rural spatial vitality in mountainous counties . Journal of Zhejiang A&F University, 2024, 41(4): 1-11. doi: 10.11833/j.issn.2095-0756.20230478
    [3] WANG Yannan, LAI Guozhen, HUANG Jianjian, LIU Liting, YU Liangsen, WEN Qiang, GONG Chun.  Potential distribution of Camellia chekiangoleosa under future climate change . Journal of Zhejiang A&F University, 2022, 39(5): 989-997. doi: 10.11833/j.issn.2095-0756.20210641
    [4] LIU Cuiyu, YAN Ming, HUANG Xianbin, YUAN Zhaohe.  Salt tolerance and screening for identification indexes with pomegranate cuttings . Journal of Zhejiang A&F University, 2018, 35(5): 853-860. doi: 10.11833/j.issn.2095-0756.2018.05.009
    [5] SONG Xianglan, YANG Yilin, WANG Lanying, KUANG Xiansong, HU Xiaokang, WU Yanxu, ZHAO Xiaoqing.  Economic traits of 5 cultivars of Camellia oleifera‘Ganzhou Oil’ . Journal of Zhejiang A&F University, 2015, 32(6): 983-989. doi: 10.11833/j.issn.2095-0756.2015.06.023
    [6] ZHU Guohua, WU Liming, YAN Fuhua, NI Rongxin.  Economic benefits analysis of elite cultivars of Camellia oleifera . Journal of Zhejiang A&F University, 2014, 31(4): 632-638. doi: 10.11833/j.issn.2095-0756.2014.04.021
    [7] YANG Jian-hua, LI Shu-fang, FAN Zhi-yuan, XI Xue-liang, ZOU Wei-lie, LIU Jiao, PAN Li.  Principal component analysis for major economic characteristics of Carya illinoensis and selection of superior cultivars . Journal of Zhejiang A&F University, 2011, 28(6): 907-910. doi: 10.11833/j.issn.2095-0756.2011.06.011
    [8] WU Qing-ling, DING Bing-yang, CHEN Xuan-xing.  Floristic analyses of seed plants in Shiyang Forest Park, Zhejiang Province . Journal of Zhejiang A&F University, 2010, 27(6): 896-902. doi: 10.11833/j.issn.2095-0756.2010.06.015
    [9] JIA Si-hen, FANG Wei-in, CHEN Fa-di, CHEN Su-mei, YANG Xue-meng.  Heat tolerance for summer blooming of Chrysanthemum . Journal of Zhejiang A&F University, 2009, 26(1): 52-57.
    [10] YE Rong-hua, SI Jin-ping, RUAN Xiu-chun, HUANG Wen-hua, GUO Bao-lin, XU Yuan-ke.  Growth and yield traits of Tripterygium wilfordii . Journal of Zhejiang A&F University, 2009, 26(2): 215-219.
    [11] CHEN Qiang, ZHOU Yue-hua, CHANG En-fu, LI Pin-rong, BI Bo, ZHAO Yong-hong, GUAN Jin-shu.  Selection of superior trees of Betula alnoides . Journal of Zhejiang A&F University, 2005, 22(3): 291-295.
    [12] HE Fu-ji, CHEN Bin-long, HE Hao-liang, FU Shun-hua, WANG Yi-feng.  Genetic analysis of main traits and selection of superior provenances and superior individuals of Atractylodes macrocephala . Journal of Zhejiang A&F University, 2005, 22(5): 524-529.
    [13] JI Ya-lan, ZHENG Si-wei, CAI Xi-ping.  Research on evaluating index system of the status and role of forestry . Journal of Zhejiang A&F University, 2003, 20(2): 162-167.
    [14] ZHANG Xiao-guang, WU Wei-gen.  Statistics and analysis of abstracts in forestry sci-tech periodicals . Journal of Zhejiang A&F University, 2002, 19(2): 193-197.
    [15] ZHENG Ren-hua, CHEN Guo-jin, FU Zhong-hua, YU Bai-nan, YANG Zong-wu, FU Yu-shi, PAN Qiong-rong.  Genetic evaluation and selection of plus tree progeny of masson pine . Journal of Zhejiang A&F University, 2001, 18(2): 144-149.
    [16] WU Yan-xiong.  Application of HTML help system in biological statistic analysis platform . Journal of Zhejiang A&F University, 2001, 18(1): 80-84.
    [17] WU Yan-xiong.  Preliminary study on Win Help topic file of biological statistic analysis platform . Journal of Zhejiang A&F University, 2000, 17(4): 421-424.
    [18] WU Yan-xiong, CHEN Mei-lan.  Editing and compiling Win Help project of biological statistic analysis platform . Journal of Zhejiang A&F University, 2000, 17(4): 425-429.
    [19] HUANG Bi-heng.  Statistical analysis on national economy of every city in Zhejiang Province . Journal of Zhejiang A&F University, 1999, 16(4): 420-424.
    [20] He Fuji, Wang Dongmi, Lu Shijun, Xu Jiquan, Gao Qiliang.  Result Analysis on Progeny Tests of Horsetail Beefwood Superlor Trees . Journal of Zhejiang A&F University, 1993, 10(2): 139-144.
  • [1]
    SUN Peiguang. Studies on Germplasm Characteristics and Variation of Camellia semiserrata Chi.[D]. Beijing: Beijing Forestry University, 2012.
    [2]
    RONG Daojun, LIU Jun, GUO Yexian, et al. Yield and fruit characters of Camellia semiserrata in Dongguan [J]. Forestry and Environmental Science, 2021, 37(2): 76 − 80.
    [3]
    ZHU Yixing, LIN Haimin, CHEN Xiu, et al. Mechanochemical-assisted extraction and antioxidant activities of kaempferol glycosides from Camellia oleifera Abel. meal [J]. Journal of Agricultural and Food Chemistry, 2011, 59(8): 3986 − 3993.
    [4]
    CHAVASIT V, PHOTI J, KRIENGSINYOS W, et al. Overcoming the trans fat problem in Thailand[J/OL]. Current Developments in Nutrition, 2019, 3(6): nzz045[2022-05-12]. doi: 10.1093/cdn/nzz045.
    [5]
    TRAN V T, KINGWASCHARAPONG P, TANAKA F, et al. Effect of edible coatings developed from chitosan incorporated with tea seed oil on Japanese pear[J/OL]. Scientia Horticulturae, 2021, 288: 110314[2022-05-12]. doi: 10.1016/j.scienta.2021.110314.
    [6]
    CHEN Fenglin, XIE Hai, YOU Changqiao, et al. Current situation and prospect of research, development and utilization of Camellia oleifera resources in China [J]. Life Science Research, 2021, 25(5): 425 − 431.
    [7]
    AI Jian’an, HUANG Xiujie, SU Zhuhua, et al. Development situation and countermeasures of Guangdong oil-tea industry in 2014 [J]. Guangdong Agricultural Sciences, 2015, 42(14): 1 − 6.
    [8]
    ZOU Yuling, ZHONG Qiuping, CAO Linqing, et al. Comprehensive evaluation of fruit traits and camellia oil quality of Camellia yuhsienensis clones [J]. Journal of Central South University of Forestry &Technology, 2021, 41(11): 46 − 55.
    [9]
    XIA Yingying, LIANG Bin, CHEN Linqiang, et al. Grafting affinity of Camellia semiserrata new varieties ‘Hongyu 1’ and ‘Hongyu 2’ [J]. Guangxi Forestry Scientce, 2018, 47(4): 447 − 450.
    [10]
    DING Xiaogang, ZHANG Yingzhong, CHEN Qinfeng, et al. Law of genetic variation of fruits in Camellia semiserrata [J]. Non-wood Forestry Research, 2012, 30(2): 23 − 27.
    [11]
    DONG Le, LI Tian, HUANG Wenyin, et al. Selection and comprehensive evaluation of excellent individual plant in Camellia chekiangoleosa [J]. Journal of Central South University of Forestry &Technology, 2021, 41(11): 35 − 45.
    [12]
    CHEN Jing, GUO Yujian, WANG Peixuan, et al. The selection of excellent trees and analysis of the genetic diversity of forty years old seedling forest of Camellia vietnamensis [J]. Chinese Journal of Tropical Crops, 2019, 40(12): 2347 − 2355.
    [13]
    WANG Peixuan, CHEN Jing, GUO Yujian, et al. Selectionn of excellent trees and preliminary evaluation of producing regions of Camellia vietnamensis seedling [J]. Non-wood Forestry Research, 2021, 39(4): 246 − 255.
    [14]
    LÜ Huanhuan, WU Yuefeng, LI Yu, et al. Variation and selection of excellent fruit traits in Camellia oleifera clones [J]. Journal of Forest and Environment, 2021, 41(5): 519 − 526.
    [15]
    LU Xianbo, XU Lianfeng, PANG Zhongyi, et al. Variation and selection of seedling growth traits among Juglans mandshurica provenances and families [J]. Forest Research, 2022, 35(1): 20 − 30.
    [16]
    WANG Xiuxiu, XING Aishuang, YANG Ru, et al. Comprehensive evaluation of phenotypic characters of nature population in upland cotton [J]. Scientia Agricultura Sinica, 2022, 55(6): 1082 − 1094.
    [17]
    QI Jiamin, ZHANG Peng, XI Ruchun, et al. Genetic variation and correlation analysis of fruit characters of Camellia gauchowensis Chang [J]. Journal of Central South University of Forestry &Technology, 2018, 38(4): 108 − 113.
    [18]
    FENG Xuanjun, PAN Liteng, XIONG Hao, et al. Investigation on important target traits and breeding potential of 120 sweet and waxy maize inbred lines in the south of China [J]. Scientia Agricultura Sinica, 2022, 55(5): 856 − 873.
    [19]
    FENG Jingqiu, ZHANG Fengping, HUANG Jialin, et al. Allometry between vegetative and reproductive traits in orchids[J/OL]. Frontiers in Plant Science, 2021, 12: 728843[2022-05-12]. doi: 10.3389/fpls.2021.728843.
    [20]
    LUCA P, PAOLO E, GUIDO C, et al. Morphological and carpological variability of walnut germplasm (Juglans regia L. ) collected in north-eastern Italy and selection of superior genotypes [J]. Scientia Horticulturae, 2017, 225: 615 − 619.
    [21]
    HENRY F K. The varimax criterion for analytic rotation in factor analysis [J]. Psychometrika, 1958, 23(3): 187 − 200.
    [22]
    YANG Yuchen, SHU Changqing, YAO Xiaohua, et al. Research on fruit quality of Changlin series of Camellia oleifera in northern production area [J]. Chinese Journal of Oil Crop Sciences, 2022, 44(3): 562 − 569.
    [23]
    TIAN Chaoguang. Studies on Camellia oleifera Abol’s Genetics Law of Important Economy Traits and Fatty Acid Composition[D]. Beijing: Chinese Academy of Forestry, 2000.
    [24]
    JIANG Ying. Genetic Relationship Analysis and Identify Breeding of Hybrid Progenies and Hybrid Parents of Camellia oleifera[D]. Fuzhou: Fujian Agriculture and Forestry University, 2011.
  • 加载中
通讯作者: 陈斌, bchen63@163.com
  • 1. 

    沈阳化工大学材料科学与工程学院 沈阳 110142

  1. 本站搜索
  2. 百度学术搜索
  3. 万方数据库搜索
  4. CNKI搜索

Figures(2)  / Tables(6)

Article views(266) PDF downloads(24) Cited by()

Related
Proportional views

Comprehensive evaluation and index screening of excellent plants of Camellia semiserrata

doi: 10.11833/j.issn.2095-0756.20220376

Abstract:   Objective  This study, with an investigation of the genetic variation characteristics of economic traits of Camellia semiserrata, is aimed to establish a prediction model based on the core evaluation indexes screened so as to provide a scientific basis for the formulation and utilization of C. semiserrata germplasm resources.  Method  With 31 excellent trees selected from the core production area of C. semiserrata as research subjects, a determination and analysis was conducted of 20 economic traits such as crown area, fruit yield per plant and oil yield per plant using multivariate statistical methods.  Result  (1) There were different degrees of variation in the 20 indicators of the participating strains of excellent trees, with a range of 3.25%−69.47% and between these indicators a total of 38 pairs of indicators reached the highly significant level (P<0.01) whereas 15 pairs reached the significant level (P<0.05). (2) With the principal component analysis, the 11 evaluation indicators were simplified into four independent composite indicators, with a cumulative contribution of 80.23%, retaining most of the information of each trait of the test material. (3) Based on the weights of the four integrated indicators and the values of the affiliation functions, the integrated scores of the excellent trees ranged from 0.151−0.674, with HY25, HY4, HY20, HY17 and HY1 displaying better comprehensive evaluation performance. (4) The prediction model was built for the evaluation of Camellia semiserrata excellent trees using a stepwise regression analysis with canopy area, fresh seed yield, dry seed yield, fresh fruit oil content, oil yield per plant and fruit yield efficiency per plant being the six core evaluation indicators. (5) The six core evaluation indicators can be classified into three categories using cluster analysis with categoryⅠ being the high quality type, categoryⅡ displaying better fecundity and quality whereas category Ⅲ being the fecundity type.  Conclusion  Single plant fruit yield, single plant fruit yield efficiency, canopy area, fruit yield efficiency per plant, oil yield per plant, fresh seed yield, dry seed yield and fresh fruit oil content can be used as important indicators to identify excellent trees of C. semiserrata and in accordance with this model, HY25, HY4, HY20, HY17 and HY1 were selected with favorable comprehensive evaluation. [Ch, 2 fig. 6 tab. 24 ref.]

ZHANG Heng, YUAN Shan, FU Zhiqiang, CHEN Ruifan, SHEN Chunhui, XI Ruchun. Comprehensive evaluation and index screening of excellent plants of Camellia semiserrata[J]. Journal of Zhejiang A&F University, 2023, 40(2): 374-381. doi: 10.11833/j.issn.2095-0756.20220376
Citation: ZHANG Heng, YUAN Shan, FU Zhiqiang, CHEN Ruifan, SHEN Chunhui, XI Ruchun. Comprehensive evaluation and index screening of excellent plants of Camellia semiserrata[J]. Journal of Zhejiang A&F University, 2023, 40(2): 374-381. doi: 10.11833/j.issn.2095-0756.20220376
  • 广宁红花油茶Camellia semiserrata属山茶科Theaceae山茶属Camellia红山茶组常绿乔木,其果大叶茂、种子含油率高、花色艳丽,为华南地区重要木本食用油料树种[1-2]。茶油是从油茶种子中提取的天然可食用性植物油之一,富含不饱和脂肪酸、维生素和保证人体生理机能正常运行所必需的营养元素等[35]。在红山茶组中,广宁红花油茶具有一定的栽培面积,认知度较高[6]。然而,由于老油茶园管理粗放、林龄较大,导致低产林面积不断扩大[7]。良种种质资源不足是限制油茶产业发展的关键因素,因此,开展广宁红花油茶良种选育,通过改造提升老油茶园,高标准建设新油茶园,对推动华南地区油茶产业高质量发展具有重要意义。品种选育是种质资源利用的基础,果实经济性状特征是反映经济树种优劣的重要指标[8]。相关研究人员根据广宁红花油茶育种目标,培育出一批生长快、果皮薄、出籽率高的新品种[9]。丁晓纲等[10]对广宁红花油茶果实经济性状进行研究,结果表明广宁红花油茶的鲜籽质量和单果籽数总体变异程度较大。荣道军等[2]研究表明:单株产果量与单果鲜籽质量、种子含油率与树高的相关系数较大。目前,浙江红花油茶C. chekiangoleosa[11]、越南油茶C. vietnamensis[12-13]等选育研究已有报道。广宁红花油茶作为13个主栽油茶物种之一,其良种选育工作亟需开展。本研究通过对广宁红花油茶核心区优树树体特征和果实经济特征开展调查,采用多元统计分析法对其进行综合评价,建立广宁红花油茶评价模型,以期为特色油茶良种选育提供科学依据。

    • 于2018—2020年,在广东省肇庆市广宁县和云浮市云安县等区域内开展广宁红花油茶资源普查,优树初选树龄为15 a年以上,林分起源为实生林,林分长势良好,没有严重病虫害。通过连续3 a观测其生长和经济性状指标,最终从145株红花油茶中初选出31株优树(HY1~HY31)。

    • 于2021年10月下旬,采收31株初选优树的成熟果实,30个·株−1。参考吕欢欢等[14]方法测定并计算优树胸径、树高、冠幅面积、单株产果量、单株产果效率、单株产油量、单株产油效率、单果鲜质量、果实纵径、果实横径、果皮厚度、果形指数、单果种子数、单果种子鲜质量、百粒重、鲜出籽率、干籽出仁率、干出籽率、种仁含油率、鲜果含油率等20个指标。其中单株产果效率为单株产果量与树干横截面积之比(kg·cm−2);单株产油效率为单株产油量与树干横截面积之比(g·cm−2)。

    • 采用Excel 2020统计分析各性状平均值、标准差、变异系数、隶属函数值;SPSS 22.0对各性状进行相关性分析、主成分分析及逐步回归分析;采用Origin Pro2019b进行聚类分析。隶属函数值计算公式为$ {U}{{(X}}_{{ij}}{)=}{{(X}}_{{ij}}-{{X}}_{{j}\text{min}}{)∕(}{{X}}_{{j}\text{max}}-{{X}}_{{j}\text{min}}{)} $。其中,Xij为第i品系第j个综合指标值,XjminXjmax分别为第j个综合指标的最小值和最大值。综合指标权重计算公式为$ {{W}}_{{i}}{=}{{P}}_{{i}}\left/{\displaystyle\sum _{i=1}^n{{P}}_{{i}}}\right. $。其中,Wi为第i个综合指标在所有综合指标中的权重,Pi为各品系第i个综合指标贡献率。综合评价得分(D)计算公式为$ {D}{=}\displaystyle\sum_{i=1}^n {U}{{(X}}_{{ij}}{) }{{W}}_{{i}} $

    • 对31株初选优树的20个主要性状指标进行统计分析(表1),结果表明:不同指标间存在不同程度的变异。3个生长指标的变异范围为14.66%~50.07%,其中,冠幅面积变异系数较大,树高变异系数较小;17个果实经济指标的变异范围为3.25%~69.47%,其中单株产油效率、单株产果效率、单株产果量、单株产油量、单果种子数和单果鲜质量变异系数较大,依次为69.47%、54.23%、51.52%、45.35%、34.20%、30.86%,说明这些经济性状变异较为丰富,有利于优树的比较和筛选,而种仁含油率、干籽出仁率、果实纵径、果实横径和果形指数变异系数均小于15%,性状较为稳定。

      指标冠幅面
      积/m2
      胸径/
      cm
      树高/
      m
      果实横
      径/mm
      果实纵
      径/mm
      果形
      指数
      单果鲜
      质量/g
      果皮厚/
      mm
      单果种
      子数/个
      单果种子
      鲜质量/g
      极小值   5.67 5.84 6.80 59.88 75.50 0.75 205.12 14.97 8.27 20.89
      极大值   31.14 41.00 11.20 95.70 119.42 1.16 675.89 28.68 34.78 74.74
      均值    14.86 13.47 8.49 72.59 85.06 0.92 303.27 17.63 15.04 50.89
      标准差   7.32 6.07 1.22 8.37 7.81 0.13 92.06 2.87 5.06 12.92
      变异系数/% 50.07 45.79 14.66 11.73 9.33 13.77 30.86 16.53 34.20 25.82
      指标 百粒
      重/g
      鲜出籽
      率/%
      干出籽
      率/%
      干籽出
      仁率/%
      种仁含
      油率/%
      鲜果含
      油率/%
      单株产
      果量/kg
      单株产
      油量/kg
      单株产果效
      率/(kg·cm−2)
      单株产油效
      率/(g·cm−2)
      极小值   223.67 7.96 5.67 53.92 55.94 2.10 16.13 0.42 0.04 0.86
      极大值   534.83 23.66 26.74 75.32 66.51 7.23 63.78 2.70 0.64 34.36
      均值    365.13 17.23 13.11 59.75 62.14 4.45 26.72 1.02 0.23 9.27
      标准差   70.58 3.58 3.80 4.27 1.99 1.22 13.54 0.46 0.12 6.33
      变异系数/% 19.65 21.11 29.50 7.27 3.25 27.79 51.52 45.35 54.23 69.47

      Table 1.  Variation in each individual index of 31 trees of C. semiserrata

    • 对20个单项指标进行Pearson相关性(表2)分析表明:共有38对指标达到极显著水平(P<0.01)、15对指标达到显著水平(P<0.05)。其中,果皮厚度与鲜出籽率、鲜果含油率呈极显著负相关,相关系数分别为−0.76和−0.67;果实纵径与单果鲜质量、鲜出籽率与干出籽率、鲜出籽率与鲜果含油率、干出籽率与鲜果含油率、单株产果量与单株产油量、单株产果效率与单株产油效率呈极显著正相关,相关系数分别为0.91、0.79、0.82、0.79、0.85、0.95;但冠幅面积、胸径、树高与百粒重,果实横径与单株产油量,种仁含油率、单株产油效率与单果种子鲜质量,鲜出籽率与单株产油量,单株产油量、单株产果效率与干籽出仁率以及鲜果含油率与单株产油量的相关系数较低。综上,说明各单项指标既存在一定的关联性,又相互较独立。

      指标冠幅面积胸径树高果实横径果实纵径果形指数单果鲜质量果皮厚单果种子数单果种子鲜质量
      冠幅面积 1
      胸径 0.66** 1
      树高 −0.13 −0.17 1
      果实横径 −0.19 0.26 0.03 1
      果实纵径 0.19 0.64** −0.04 0.51** 1
      果形指数 0.29 0.52** 0.02 0.32 0.26 1
      单果鲜质量 0.12 0.59** −0.06 0.62** 0.91** 0.38* 1
      果皮厚 0.19 0.61** −0.31 0.62** 0.72** 0.40* 0.74** 1
      单果种子数 −0.24 −0.08 0.02 0.24 0.23 −0.18 0.19 −0.17 1
      单果种子鲜质量 −0.25 −0.03 0.08 0.41* 0.44* −0.17 0.50** −0.07 0.66** 1
      百粒重 0 −0.02 0.02 0.04 0.31 −0.20 0.15 0.03 −0.32 0.31
      鲜出籽率 −0.24 −0.43* 0.08 −0.24 −0.36* −0.59** −0.41* −0.76** 0.49** 0.53**
      干出籽率 −0.27 −0.37* 0.03 −0.23 −0.26 −0.56** −0.42* −0.59** 0.64** 0.32
      干籽出仁率 −0.03 −0.06 0.06 −0.16 −0.20 −0.24 −0.19 −0.24 0.04 −0.12
      种仁含油率 −0.13 −0.15 0.05 −0.40* −0.19 −0.27 −0.22 −0.31 0.06 −0.01
      鲜果含油率 −0.26 −0.35 0.10 −0.28 −0.40* −0.56** −0.47** −0.67** 0.39* 0.27
      单株产果量 0.56** 0.55** −0.22 0.22 0.26 0.06 0.27 0.54** −0.20 −0.17
      单株产油量 0.49** 0.28 −0.13 0.01 −0.06 −0.19 −0.06 0.11 −0.07 −0.10
      单株产果效率 −0.22 −0.58** 0.17 −0.15 −0.31 −0.55** −0.22 −0.11 −0.06 −0.07
      单株产油效率 −0.19 −0.54** 0.24 −0.31 −0.22 −0.54** −0.26 −0.23 0.05 −0.02
      指标 百粒重 鲜出籽率 干出籽率 干籽出仁率 种仁含油率 鲜果含油率 单株产果量 单株产油量 单株产果效率 单株产油效率
      百粒重 1
      鲜出籽率 0.13 1
      干出籽率 0.06 0.79** 1
      干籽出仁率 −0.15 0.20 0.23 1
      种仁含油率 −0.17 0.23 0.29 0.31 1
      鲜果含油率 −0.07 0.82** 0.79** 0.57** 0.49** 1
      单株产果量 −0.03 −0.39* −0.36* −0.18 −0.25 −0.40* 1
      单株产油量 −0.13 0 −0.04 −0.01 −0.05 −0.01 0.85** 1
      单株产果效率 0.12 0.09 0.14 0.01 0.02 0.06 0.07 0.22 1
      单株产油效率 0.04 0.22 0.27 0.15 0.14 0.25 −0.06 0.18 0.95** 1
        说明:*表示在0.05水平(双侧)上显著相关;**表示在0.01水平(双侧)上显著相关

      Table 2.  Correlation of 20 individual indicators

    • 由于20个指标间存在一定的重叠性,因此根据相关性分析结果及选育目标,将地径、冠幅面积、单株产果量和单株产油量等11个指标进行主成分分析(表3)。以特征值大于1的原则提取4个主成分,累计贡献率达80.23%,代表了参试品种各指标的绝大部分信息。第1主成分贡献率为23.91%,其中单株产油量、单株产果量和冠幅面积的特征向量值较大,分别为0.91、0.89和0.77,可作为产量因素;第2主成分贡献率为23.20%,其中单株产果效率、单株产果效率和胸径的特征向量值较大,分别为0.98、0.92和−0.67,可作为产量效率因素;第3主成分贡献率为22.83%,鲜果含油率、鲜出籽率、干籽出仁率和单果鲜质量的特征向量值较大,分别为0.95、0.83、0.63和−0.56,可作为果实经济因素;第4主成分贡献率为10.29%,百粒重的特征向量值较大,为0.94,可作为百粒重因素。

      特征向量主成分1主成分2主成分3主成分4特征向量主成分1主成分2主成分3主成分4
      单株产油量 0.91 0.24 0.10 −0.08 鲜出籽率 −0.16 0.13 0.83 0.31
      单株产果量 0.90 0.04 −0.31 −0.02 干籽出仁率 0.03 −0.05 0.63 −0.27
      冠幅面积 0.77 −0.30 −0.07 0.02 单果鲜质量 0.14 −0.36 −0.56 0.25
      单株产果效率 0.05 0.98 −0.03 0.07 百粒重 −0.04 0.05 −0.06 0.94
      单株产油效率 0.03 0.92 0.15 0.03 特征值 2.63 2.55 2.51 1.13
      胸径 0.59 −0.67 −0.28 0.04 贡献率/% 23.91 23.31 22.83 10.29
      鲜果含油率 −0.14 0.08 0.95 0.02 累计贡献率/% 23.91 47.11 69.94 80.23

      Table 3.  Eigenvectors and contribution of the principal components of each trait

    • 将4个主成分得分采用隶属函数法进行归一化处理,计算各品系综合指标的隶属函数值,并根据各主成分贡献率计算其权重,依次为0.298、0.289、0.285和0.128,最后计算得出综合得分值(D)。表4表明:HY25综合表现最好,HY4、HY20、HY17和HY1次之,D分别为0.674、0.583、0.569、0.516和0.505;HY28、HY26、HY31、HY30和HY27综合表现较差,D均小于0.300。

      初选优树F1F2F3F4U(F1)U(F2)U(F3)U(F4)D排名
      HY10.1371.7260.806−2.0070.3180.7550.6730.0000.5055
      HY20.8560.113−0.540−0.1090.4760.4570.3470.4410.42915
      HY3−0.387−0.9911.7310.6440.2020.2530.8960.6160.46710
      HY41.8941.386−0.4180.1800.7040.6930.3770.5080.5832
      HY5−0.817−0.0620.6570.5140.1080.4250.6370.5860.41117
      HY6−0.172−0.8941.3870.1270.2500.2710.8130.4960.44812
      HY7−0.9380.081−0.165−0.8640.0810.4510.4380.2660.31326
      HY8−0.9940.022−0.1650.2980.0690.4400.4380.5350.34131
      HY91.344−0.701−0.074−0.7420.5830.3060.4600.2940.43114
      HY100.2380.9880.258−0.4650.3400.6190.5400.3580.4809
      HY11−0.866−0.1490.6900.3960.0970.4090.6450.5580.40219
      HY12−0.542−0.2960.046−1.1020.1680.3820.4890.3100.32725
      HY13−0.0290.546−0.1462.2990.2810.5370.4421.0000.4937
      HY14−0.7800.128−0.422−0.1900.1160.4600.3760.4220.32924
      HY150.4390.5680.0930.4800.3840.5410.5000.5780.4878
      HY160.060−0.2020.0940.2010.3010.3990.5010.5130.41316
      HY17−0.0771.0270.1671.5720.2710.6260.5180.8310.5164
      HY18−0.7560.0580.4541.3980.1310.4470.5880.7910.43413
      HY190.293−1.0041.710−1.1610.3520.2510.8920.1960.45611
      HY20−0.0793.048−0.0720.2990.2701.0000.4600.5360.5693
      HY31−0.3230.275−0.2840.7180.3160.4870.4090.6330.40318
      HY22−0.290−0.5892.158−0.3370.2240.3271.0000.3880.4966
      HY23−0.778−0.105−0.8781.6240.1160.4170.2660.8430.33922
      HY240.5570.586−1.776−0.6520.4100.5450.0480.3150.33423
      HY253.2390.0960.826−0.2551.0000.4540.6780.4070.6741
      HY26−0.866−0.138−1.095−1.6230.0970.4110.3130.0890.22030
      HY271.947−2.358−1.9760.8630.7160.0000.0000.6670.29927
      HY28−1.307−0.691−1.771−0.4080.0000.3080.0500.3710.15131
      HY290.165−1.5580.4340.5190.3240.1480.5830.5870.38020
      HY30−0.489−0.471−0.488−1.7310.1800.3490.3600.0640.26528
      HY31−0.677−0.440−1.241−0.4870.1380.3550.1780.3530.24029

      Table 4.  Overall assessment values and ranking of 31 trees of C. semiserrata

      将11个指标与综合得分值(D)进行相关性分析(表5)表明:除冠幅、胸径、单株产果量、百粒重和干籽出仁率与D无显著相关外(P>0.05),其余指标均与D显著相关(P<0.05),其中,D与单果鲜质量呈负相关,与其他指标呈显著正相关,单株产油量与D相关系数最大,为0.68。

      指标相关系数指标相关系数
      冠幅面积 0.27 单株产果效率 0.49**
      胸径 −0.14 单株产油效率 0.55**
      鲜出籽率 0.56** 鲜果含油率 0.54**
      单果鲜质量 −0.36* 百粒重 0.31
      单株产果量 0.34 干出籽率 0.31
      单株产油量 0.68**
        说明:*表示在0.05水平(双侧)上显著相关;**表示在0.01水平(双侧)上显著相关

      Table 5.  Correlation between the 11 indicators and the composite score
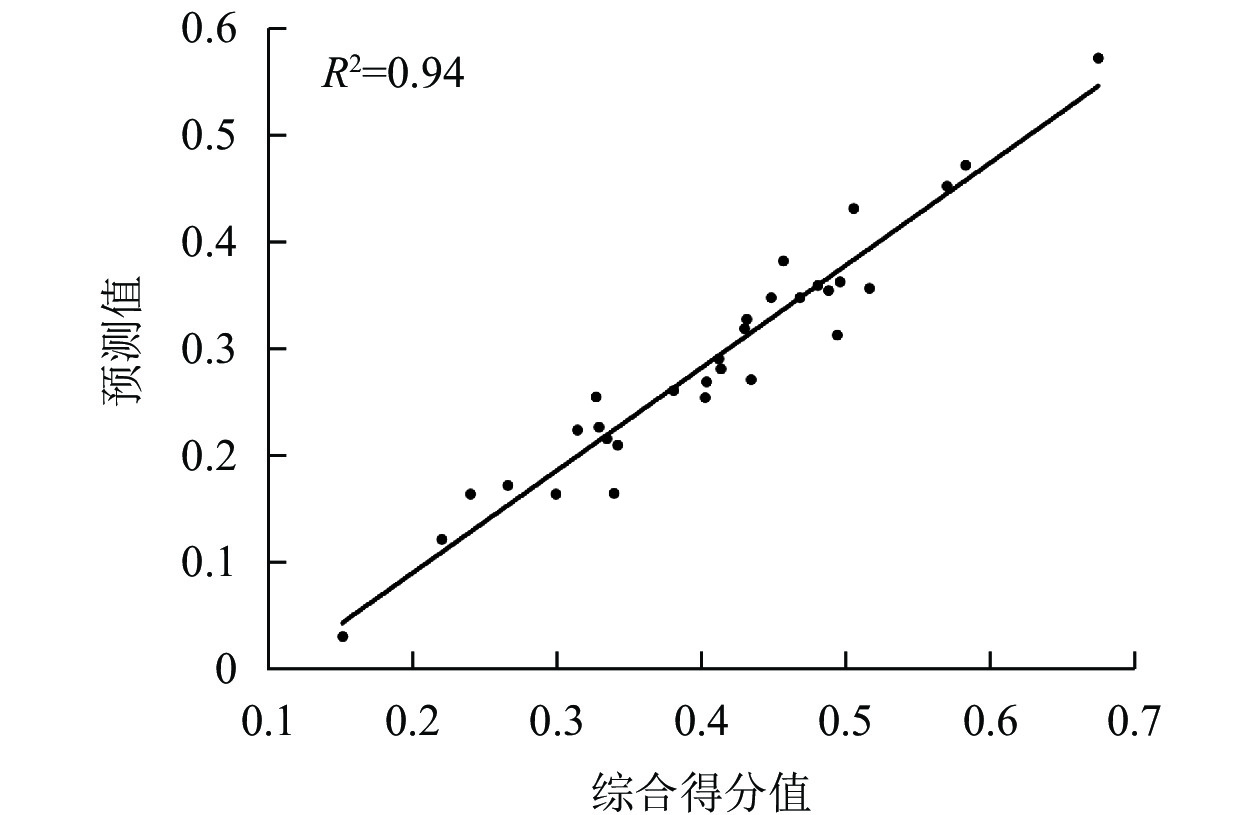
    • D为因变量(Y),11个单项指标为自变量(Xi),采用逐步回归分析拟合得到多元线性方程Y=−0.431+0.004X1+0.008X2+0.003X3+0.031X4+0.126X5+0.339X6 (R2=0.99,P<0.01),其中冠幅面积(X1)、鲜出籽率(X2)、干籽出仁率(X3)、鲜果含油率(X4)、单株产油量(X5)和单株产果效率(X6)是影响广宁红花油茶综合得分的重要因子。线性回归(图1)发现:预测值与实际值拟合效果较好(R2=0.94),表明该模型精确度较高。

      Figure 1.  Predicted and actual composite scores of 31 trees of C. semiserrata

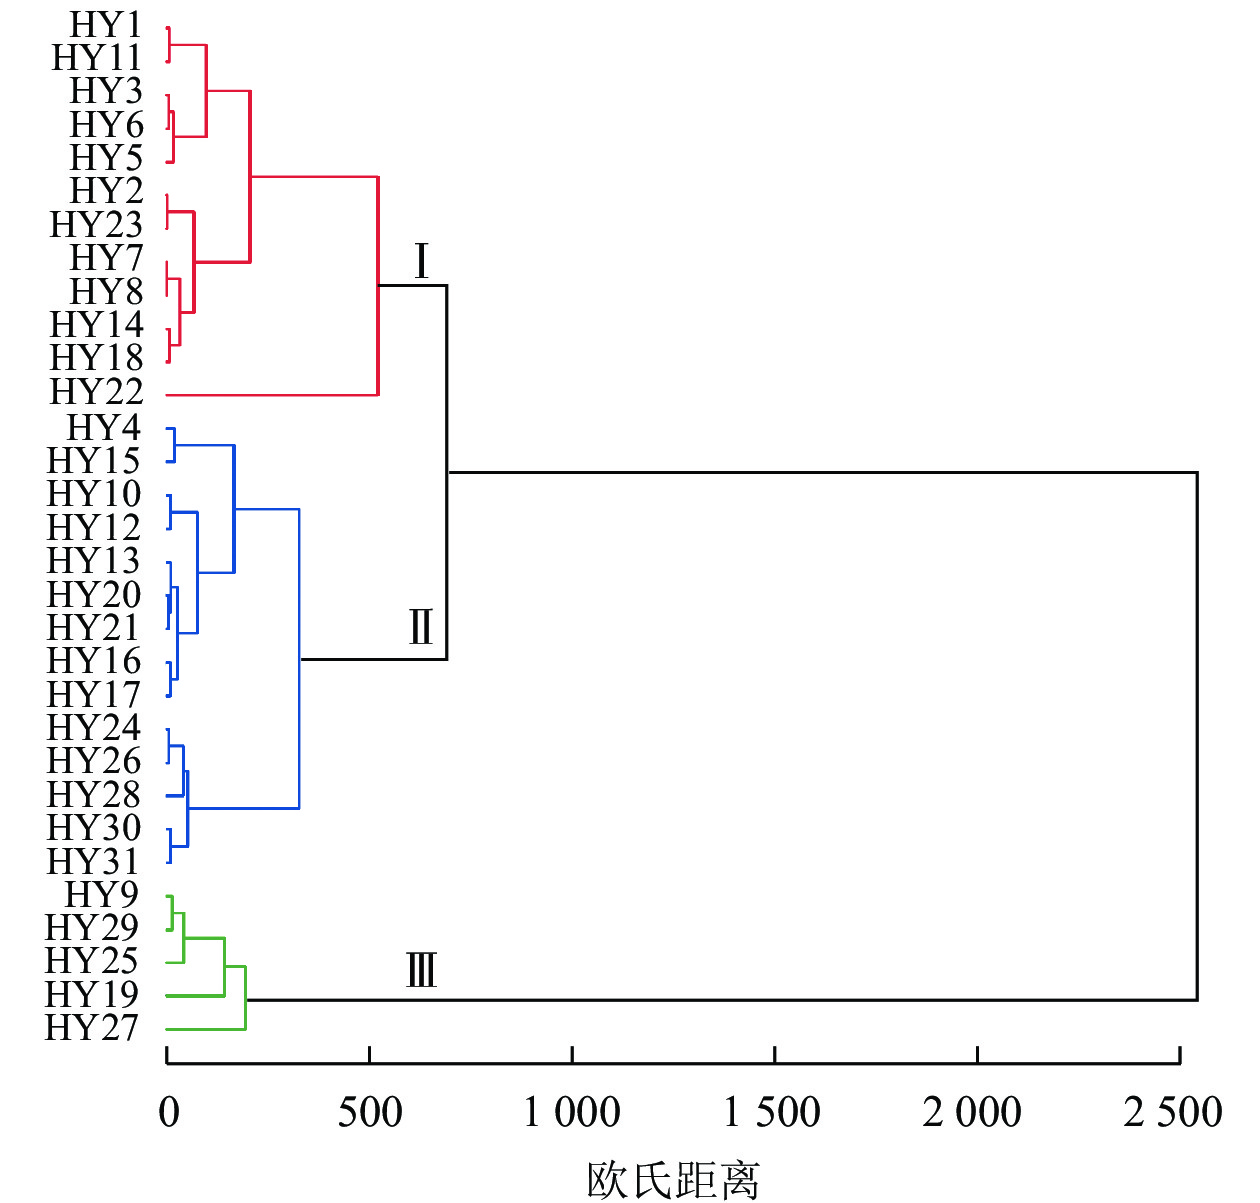
    • 采用欧氏距离法对31株初选优树的6个重要指标进行聚类分析,由图2可知:31株初选优树被分为3类:第Ⅰ类共有12株,包括HY1、HY11、HY3、HY6、HY5、HY2、HY23、HY7、HY8、HY14、HY18和HY22,占供试材料的38.71%;第Ⅱ类共有14株,包括HY4、HY15、HY10、HY12、HY13、HY20、HY21、HY16、HY17、HY24、HY26、HY28、HY30和HY31,占供试材料的45.16%;第Ⅲ类共有5株,包括HY9、HY29、HY25、HY19和HY27,占供试材料的16.13%。

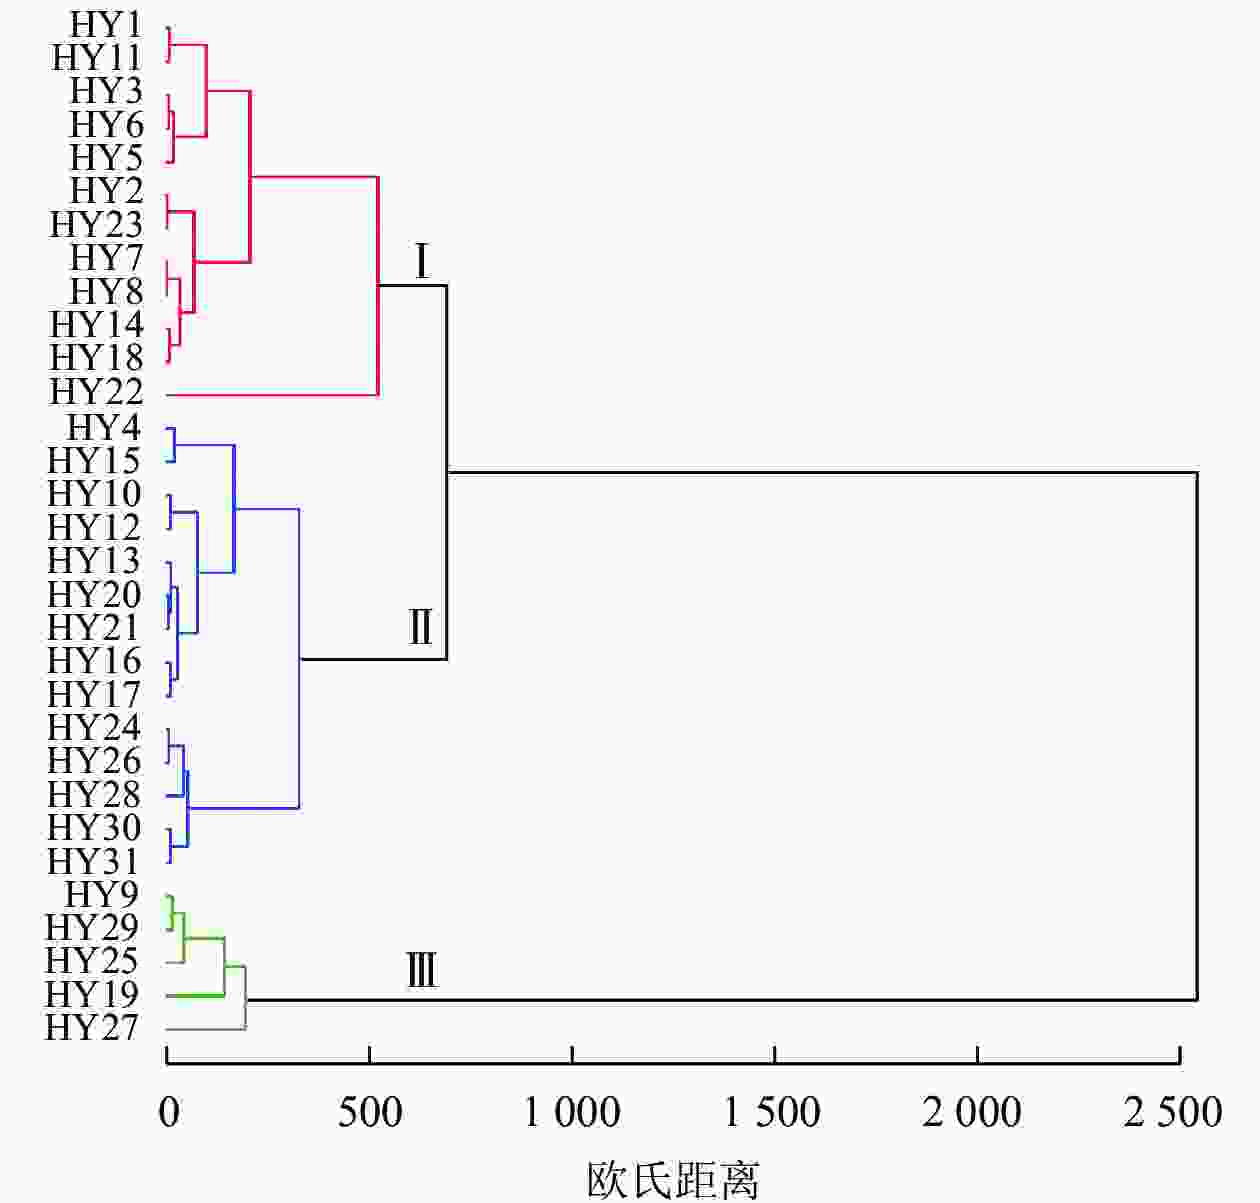
      Figure 2.  Cluster dendrogram of 31 trees of C. semiserrata

      聚类结果分析(表6)表明:第Ⅰ类主要特征为冠幅小、单株产油量和单株产果效率较低,鲜出籽率、干籽出仁率和鲜果含油率高;第Ⅱ主要特征为冠幅较大、鲜出籽率、鲜果含油率较低、干籽出仁率和单株产油量较高、单株产果效率高;第Ⅲ类主要特征为冠幅大、鲜出籽率和鲜果含油率较高、干籽出仁率高、单株产油量大、单株产果效率低。

      类别冠幅面
      积/m2
      鲜出籽
      率/%
      干籽出
      仁率/%
      鲜果含
      油率/%
      单株产
      油量/kg
      单株产果效
      率/(kg·cm−2)
      8.8719.4160.505.210.890.21
      14.8115.6958.863.881.000.28
      29.3816.3160.414.231.390.11

      Table 6.  Mean value of 6 traits of different types

    • 变异是林木遗传育种的主要研究内容[15],变异系数越大,品种改良时选择的潜力就越大[16]。本研究对31株广宁红花油茶初选优树的20个单项指标变异系数进行研究,各性状变异系数为3.25%~69.47%,变异幅度较大。其中地径、冠幅和单株产果量变异系数较大,这与荣道军等[2]和戚嘉敏等[17]的研究结果一致。植物各性状间的相关性分析对了解不同性状间的关系具有重要意义[18-19]。本研究中单果鲜质量与果实纵径和果皮厚度正相关系数分别达0.72和0.74,说明果实横径和果皮厚度是影响单果鲜质量的重要指标,这与前人的研究结果[17]相似。果皮厚度与鲜出籽率负相关系数最大,达−0.76。在生产中,果皮厚度会影响产品加工的难易,会直接影响单果鲜出籽率[20]

      对20个单项指标进行相关性分析,发现部分性状密切相关,且存在一定的重叠性。因此,对于高度相关的指标,只需选择其中一个进行综合评价,结合选育目标,最终筛选出11个重要经济性状。主成分分析可以直接区分各成分主要特征,且各成分间相对较独立,评价结果可信度较高[21]。杨雨晨等[22]对长林系列油茶进行主成分分析,将10个果实性状简化为4个相互独立的主成分,累计贡献率为86.44%,有效反映了油茶果实经济性状的大部分信息。本研究采用主成分分析将11个指标转化为4个综合指标,累计贡献率为80.23%,且4个综合指标区分合理,能较好地代表广宁红花油茶生长特征和果实特征的大部分信息。最终筛选出HY25、HY4、HY20、HY17和HY1等5株优树。采用逐步回归分析,建立了广宁红花油茶优树评价模型,筛选出冠幅面积、鲜出籽率、干籽出仁率、鲜果含油率、单株产油量和单株产果效率等6个指标,上述指标只需通过卷尺、游标卡尺、核磁共振仪和天平即可快速测量计算。

      聚类分析将31株初选优树分为3类,其中第Ⅰ类属于优质型;第Ⅱ类属于丰产性和优质性较好;第Ⅲ类属于丰产型。田朝光[23]对普通油茶进行杂交发现,子代出籽率、出仁率、含油率的大小受父本影响较小,而受母本影响较大。蒋莺[24]对5株油茶优树杂交后代进行分子标记发现:大部分杂交组合后代都具有偏母本的趋势。因此,后续可根据不同育种目标及单株特征进行杂交,如为获得高含油率、高出籽率和高出仁率类型,以第Ⅰ类作为母本,为获得高产型,则以第Ⅲ类为母本,并根据研究结果验证。

    • 31株广宁红花油茶初选优树各性状遗传变异丰富,其中,HY25、HY4、HY20、HY17和HY1综合表现较好,可作为提高经济效益的优良种质资源进行挖掘利用;冠幅面积、鲜出籽率、干籽出仁率、鲜果含油率、单株产油量和单株产果效率可作为广宁红花油茶优树评价的核心指标。

Reference (24)

Catalog

    /

    DownLoad:  Full-Size Img  PowerPoint
    Return
    Return