Volume 42 Issue 4
Aug.  2025
Turn off MathJax
Article Contents

ZHANG Jinwen, WANG Wenlong, NI Rongyu, et al. Prediction of soil heterotrophic respiration in China’s terrestrial ecosystems based on gradient boosting machine[J]. Journal of Zhejiang A&F University, 2025, 42(4): 774−783 doi:  10.11833/j.issn.2095-0756.20240667
Citation: ZHANG Jinwen, WANG Wenlong, NI Rongyu, et al. Prediction of soil heterotrophic respiration in China’s terrestrial ecosystems based on gradient boosting machine[J]. Journal of Zhejiang A&F University, 2025, 42(4): 774−783 doi:  10.11833/j.issn.2095-0756.20240667

Prediction of soil heterotrophic respiration in China’s terrestrial ecosystems based on gradient boosting machine

DOI: 10.11833/j.issn.2095-0756.20240667
  • Received Date: 2024-12-25
  • Accepted Date: 2025-05-31
  • Rev Recd Date: 2025-05-30
  • Available Online: 2025-08-01
  • Publish Date: 2025-08-01
  •   Objective  XGBoost and LightGBM models exhibit differentiated advantages within the gradient boosting decision tree framework. This study aims to systematically compare the performance differences between the two in estimating soil heterotrophic respiration (Rh), which will help to explore the potential of gradient boosting machines in ecosystem carbon flux prediction and promote the optimization of such models in large-scale carbon cycle simulations.   Method  A database of soil Rh and environmental factors in China’s terrestrial ecosystems was constructed based on the Global Soil Respiration Database (SRDB). XGBoost and LightGBM models were used to estimate and compare soil Rh from 2000 to 2023. The spatial pattern and main influencing factors of soil Rh in China’s terrestrial ecosystems were further investigated.   Result  (1) Both models demonstrated high predictive accuracy (R2 = 0.91 for the test set). XGBoost model showed strong fitting ability on the training set, while LightGBM model performed better in controlling the error on the test set. (2) The annual average values of soil Rh estimated by XGBoost and LightGBM models from 2000 to 2023 were 299.57 and 294.60 g·m−2·a−1, respectively, with interannual variations of 19.51 and 32.43 g·m−2·a−1, respectively. (3) The spatial distribution of soil Rh was high in the south and low in the north, mainly influenced by soil properties and leaf area index. This spatial heterogeneity reflected different responses of soil Rh to environmental changes.   Conclusion  The gradient boosting machine model demonstrates good adaptability in the modeling and prediction of large-scale soil Rh. It can effectively capture the spatiotemporal variations of soil Rh and demonstrate strong predictive ability. [Ch, 4 fig. 3 tab. 33 ref.]
  • [1] LI Ling, WANG Zhen, WANG Keqin, LI Yiran, LI Xuanping, MA Yanbo, YANG Jin, FENG Xiaowen.  Ecosystem service assessment and multi-scenario simulation in southwest alpine canyon region . Journal of Zhejiang A&F University, 2025, 42(4): 813-824. doi: 10.11833/j.issn.2095-0756.20240590
    [2] GUO Meimiao, ZHANG Bona, TANG Luyao, YE Linfeng, XIE Jiangbo, WANG Zhongyuan.  Regional differentiation patterns of common functional traits of Salix matsudana in precipitation gradient zones . Journal of Zhejiang A&F University, 2025, 42(2): 281-290. doi: 10.11833/j.issn.2095-0756.20240505
    [3] CAO Li, WANG Weifeng, MA Xuehong, WANG Xiangfu, LI Yu, LI Li, YU Shuiqiang.  Effects of thinning on soil heterotrophic respiration of oak-pine mixed forests in Qinling Mountains . Journal of Zhejiang A&F University, 2024, 41(1): 22-29. doi: 10.11833/j.issn.2095-0756.20230193
    [4] ZHU Chenghao, WANG Jianwu, XIE Binglou, WU Xiaonan, LUO Yibo.  City-county synchronized assessing and accuracy control of forest ecosystem services . Journal of Zhejiang A&F University, 2022, 39(2): 430-437. doi: 10.11833/j.issn.2095-0756.20210328
    [5] WANG Guan, WANG Jianxin, SUN Yu.  Lightweight plant disease recognition model for edge computing . Journal of Zhejiang A&F University, 2020, 37(5): 978-985. doi: 10.11833/j.issn.2095-0756.20190595
    [6] YANG Kaiye, GONG Hede, LI Jing, LIU Yuntong, SHA Liqing, SONG Qinghai, JIN Yanqiang, YANG Daxin, LI Peiguang, WEN Guojing, CHEN Aiguo, PANG Zhiqiang, ZHANG Yiping.  Dynamic characteristics of soil respiration of Savanna ecosystem in dry hot valley of Yuanjiang . Journal of Zhejiang A&F University, 2020, 37(5): 849-859. doi: 10.11833/j.issn.2095-0756.20190647
    [7] LIU Yuqing, ZHANG Huabing, ZHANG Yunfeng.  Spatio-temporal variation of ecosystem services value in Yancheng coastal zone . Journal of Zhejiang A&F University, 2019, 36(4): 774-782. doi: 10.11833/j.issn.2095-0756.2019.04.018
    [8] XIE Yi'na, ZHAO Lejing, LIU Yungen, WANG Yan, HOU lei, LI Xiaoling.  Development of tourism beautiful village complex ecosystem based on the coupling coordinated model . Journal of Zhejiang A&F University, 2018, 35(4): 743-749. doi: 10.11833/j.issn.2095-0756.2018.04.020
    [9] GAO Changjun, WEI Long, JIA Peng, TIAN Huiling, LI Shuguang.  Coastal wetland ecosystem evaluation in Guangdong Province by eliminating the double counting . Journal of Zhejiang A&F University, 2017, 34(1): 152-160. doi: 10.11833/j.issn.2095-0756.2017.01.021
    [10] YANG Jie, XIANG Tingting, JIANG Peikun, WU Jiasen, KE Hejia.  Phytolith-occluded organic carbon accumulation and distribution in a Dendrocalamopsis oldhami bamboo stand ecosystem . Journal of Zhejiang A&F University, 2016, 33(2): 225-231. doi: 10.11833/j.issn.2095-0756.2016.02.006
    [11] CHEN Liping, LI Pingheng, MO Lufeng, ZHOU Guomo, LI Jinrong.  Carbon flux extraction for a Phyllostachys violascens ecosystem based on the flux footprint analysis . Journal of Zhejiang A&F University, 2016, 33(1): 1-10. doi: 10.11833/j.issn.2095-0756.2016.01.001
    [12] XIE Zhen, WU Zhongliang, ZHU Yunfeng, WANG Yongjun.  Self-organization balance of Matsucoccus matsumurae in the pine forest ecological system . Journal of Zhejiang A&F University, 2013, 30(3): 392-395. doi: 10.11833/j.issn.2095-0756.2013.03.014
    [13] MENG Cifu, JIANG Peikun, XU Qiufang, ZHOU Guomo, SONG Zhaoliang, HUANG Zhangting.  PhytOC in plant ecological system and its important roles in the global soil carbon sink . Journal of Zhejiang A&F University, 2013, 30(6): 921-929. doi: 10.11833/j.issn.2095-0756.2013.06.018
    [14] CAI Xia, WANG Zu-hua, CHEN Li-juan.  Zoning with spatial division of forest ecosystem services in Chun’an County,Zhejiang Province . Journal of Zhejiang A&F University, 2011, 28(5): 727-734. doi: 10.11833/j.issn.2095-0756.2011.05.007
    [15] WANG Zu-hua, CAI Liang-liang, GUAN Qing-wei, CAI Xia.  Evaluation of forest ecosystem services in Chun’an County . Journal of Zhejiang A&F University, 2010, 27(5): 757-761. doi: 10.11833/j.issn.2095-0756.2010.05.019
    [16] XU Hua-chao, LUO You-qing.  Ecosystems attacked by Bursaphelenchus xylophilus:a review . Journal of Zhejiang A&F University, 2010, 27(3): 445-450. doi: 10.11833/j.issn.2095-0756.2010.03.020
    [17] 杨廉雁, 张树斌, 郑征.  Research progress on the hollow-bearing trees in forest ecosystems . Journal of Zhejiang A&F University, 2010, 27(6): 928-934. doi: 10.11833/j.issn.2095-0756.2010.06.021
    [18] BAI Jiang-li, PENG Dao-li, YU Xiao-hong.  Research progress of the restoration and reconstruction of degraded ecosystems . Journal of Zhejiang A&F University, 2005, 22(4): 458-463.
    [19] WANG Qian-hua, YU Shu-quan, ZHOU Guo-mo.  Study on microclimates of different ecosystems in hilly red soil areas . Journal of Zhejiang A&F University, 2005, 22(3): 255-258.
    [20] CHEN Jin-lin, WU Chun-lin, JIANG Zhi-lin, XU Xin-jian.  Litter decomposition and phosphorus release in an oak forest ecosystem . Journal of Zhejiang A&F University, 2002, 19(4): 367-371.
  • [1]
    BOND-LAMBERTY B, BAILEY V L, CHEN Min, et al. Globally rising soil heterotrophic respiration over recent decades [J]. Nature, 2018, 560(7716): 80−83.
    [2]
    BOND-LAMBERTY B, THOMSON A. A global database of soil respiration data [J]. Biogeosciences, 2010, 7(6): 1915−1926.
    [3]
    BOND-LAMBERTY B, WANG Chuankuan, GOWER S T. A global relationship between the heterotrophic and autotrophic components of soil respiration? [J]. Global Change Biology, 2004, 10(10): 1756−1766.
    [4]
    FAN Zhiping, WANG Hong, DENG Dongzhou, et al. Measurement methods of soil heterotrophic respiration and key factors affecting the temperature sensitivity of the soil heterotrophic respiration [J]. Chinese Journal of Ecology, 2008, 27(7): 1221−1226.
    [5]
    LIU Jiangnan, HU Junguo, LIU Haoqi, et al. Global soil respiration estimation based on ecological big data and machine learning model[J/OL]. Scientific Reports, 2024, 14: 13231[2024-11-25]. DOI: 10.1038/s41598-024-64235-w.
    [6]
    TANG Xiaolu, DU Jie, SHI Yuehong, et al. Global patterns of soil heterotrophic respiration–a meta-analysis of available dataset[J/OL]. CATENA, 2020, 191: 104574[2024-11-25]. DOI: 10.1016/j.catena.2020.104574.
    [7]
    HE Yue, DING Jinzhi, DORJI T, et al. Observation-based global soil heterotrophic respiration indicates underestimated turnover and sequestration of soil carbon by terrestrial ecosystem models [J]. Global Change Biology, 2022, 28(18): 5547−5559.
    [8]
    YAO Yitong, CIAIS P, VIOVY N, et al. A data-driven global soil heterotrophic respiration dataset and the drivers of its inter-annual variability[J/OL]. Global Biogeochemical Cycles, 2021, 35(8): e2020GB006918[2024-11-25]. DOI: 10.1029/2020GB006918.
    [9]
    CHEN Lin, XING Minfeng, HE Binbin, et al. Estimating soil moisture over winter wheat fields during growing season using machine-learning methods [J]. IEEE Journal of Selected Topics in Applied Earth Observations and Remote Sensing, 2021, 14: 3706−3718.
    [10]
    ZHANG Linqi, LIU Yi, REN Liliang, et al. Analysis of flash droughts in China using machine learning [J]. Hydrology and Earth System Sciences, 2022, 26(12): 3241−3261.
    [11]
    FU Pingfan, YANG Xiaojing, SU Zhicheng, et al. Prediction of soil moisture content based on ensemble learning: a case study of western Liaoning Province [J]. Soils, 2023, 55(3): 671−681.
    [12]
    LI Zhisheng, LIANG Xiguan, JIN Yukai, et al. A comparative study on edictive effect of PM2.5 in Beijing based on tree models [J]. Environmental Engineering, 2021, 39(6): 106−113.
    [13]
    ZHU Jiaying, AN Junlin, FENG Yuezheng, et al. Atmospheric ozone concentration prediction in Nanjing based on LightGBM [J]. Environmental Science, 2023, 44(7): 3685−3694.
    [14]
    HASHIMOTO S, CARVALHAIS N, ITO A, et al. Global spatiotemporal distribution of soil respiration modeled using a global database [J]. Biogeosciences, 2015, 12(13): 4121−4132.
    [15]
    LU Haibo, LI Shihua, MA Minna, et al. Comparing machine learning-derived global estimates of soil respiration and its components with those from terrestrial ecosystem models[J/OL]. Environmental Research Letters, 2021, 16(5): 054048[2024-11-25]. DOI: 10.1088/1748-9326/abf526.
    [16]
    ZHAN Xiaoyun, YU Guirui, ZHENG Zemei, et al. Carbon emission and spatial pattern of soil respiration of terrestrial ecosystems in China: based on geostatistic estimation of flux measurement [J]. Progress in Geography, 2012, 31(1): 97−108.
    [17]
    HARRIS I, JONES P D, OSBORN T J, et al. Updated high-resolution grids of monthly climatic observations–the CRU TS3.10 Dataset [J]. International Journal of Climatology, 2014, 34(3): 623−642.
    [18]
    JIAO Xinyu, LONG Mei, LIU Zhixiong. Spatiotemporal distribution and influencing factors of wild Cymbidium faberi from the perspective of historical geographic information system [J]. Journal of Zhejiang A&F University, 2023, 40(6): 1261−1272.
    [19]
    BUONTEMPO C, BURGESS S N, DEE D, et al. The Copernicus climate change service: climate science in action [J]. Bulletin of the American Meteorological Society, 2022, 103(12): E2669−E2687.
    [20]
    NACHTERGAELE F, van VELTHUIZEN H, VERELST L, et al. Harmonized World Soil Database Version 2.0[M]. Rome and Laxenburg: FAO, 2023.
    [21]
    HUANG Sheng. Above-ground Biomass Estimation in Hunan Province Based on Multi-source Data and Artificial Intelligence Algorithms[D]. Changsha: Central South University of Forestry & Technology, 2023.
    [22]
    WANG Hao, SHAO Wei, HU Yunfeng, et al. Assessment of six machine learning methods for predicting gross primary productivity in grassland[J/OL]. Remote Sensing, 2023, 15(14): 3475[2024-11-25]. DOI: 10.3390/rs15143475.
    [23]
    GUO Xu, GUI Xiaofan, XIONG Hanxiang, et al. Critical role of climate factors for groundwater potential mapping in arid regions: insights from random forest, XGBoost, and LightGBM algorithms[J/OL]. Journal of Hydrology, 2023, 621: 129599[2024-11-25]. DOI: 10.1016/j.jhydrol.2023.129599.
    [24]
    CHEN Han, ZHANG Chao, YU Shuquan. Potential distribution area of Taxus chinensis var. mairei in Liandu District based on a Stacking algorithm [J]. Journal of Zhejiang A&F University, 2019, 36(3): 494−500.
    [25]
    YAN Hongbo, LIANG Yuhao, LU Xianjian, et al. Remote sensing modeling and applications in drought monitoring based on XGBoost and fusion of multi-dimensional spatiotemporal data [J]. Journal of Geo-Information Science, 2024, 26(6): 1531−1546.
    [26]
    KE Guolin, MENG Qi, FINLEY T, et al. Lightgbm: a highly efficient gradient boosting decision tree[C]//von LUXBURG U, GUYON I. NIPS’17: Proceedings of the 31st International Conference on Neural Information Processing Systems. New York: Curran Associates Inc. , 2017: 3149−3157.
    [27]
    FU Jialong. Research on Runoff Forecast Based on LightGBM Model[D]. Wuhan: Huazhong University of Science and Technology, 2022.
    [28]
    XIAN Yang, SONG Jianghui, WANG Jingang, et al. Spatial interpolation of soil nutrients content based on environmental variables screening and machine learning [J]. Transactions of the Chinese Society for Agricultural Machinery, 2024, 55(10): 379−391.
    [29]
    LU Ruhua, ZHANG Pei, FU Zhaopeng, et al. Improving the spatial and temporal estimation of ecosystem respiration using multi-source data and machine learning methods in a rainfed winter wheat cropland[J/OL]. Science of the Total Environment, 2023, 871: 161967[2024-11-25]. DOI: 10.1016/j.scitotenv.2023.161967.
    [30]
    ZHANG Mei, HUANG Xianjin, CHUAI Xiaowei, et al. Spatial distribution and changing trends of net ecosystem productivity in China [J]. Geography and Geo-Information Science, 2020, 36(2): 69−74.
    [31]
    XIE Wei, CHEN Shutao, HU Zhenghua. Factors influencing the variability in soil heterotrophic respiration from terrestrial ecosystem in China [J]. Environmental Science, 2014, 35(1): 334−340.
    [32]
    HAN Guangxuan, ZHOU Guangsheng, XU Zhenzhu, et al. Biotic and abiotic factors controlling the spatial and temporal variation of soil respiration in an agricultural ecosystem [J]. Soil Biology and Biochemistry, 2007, 39(2): 418−425.
    [33]
    PAN Qilong, HARROU F, SUN Ying. A comparison of machine learning methods for ozone pollution prediction [J/OL]. Journal of Big Data, 2023, 10(1): 63[2024-11-25]. DOI:10.1186/s40537-023-00748-x.
  • 加载中
通讯作者: 陈斌, bchen63@163.com
  • 1. 

    沈阳化工大学材料科学与工程学院 沈阳 110142

  1. 本站搜索
  2. 百度学术搜索
  3. 万方数据库搜索
  4. CNKI搜索

Figures(4)  / Tables(3)

Article views(482) PDF downloads(29) Cited by()

Related
Proportional views

Prediction of soil heterotrophic respiration in China’s terrestrial ecosystems based on gradient boosting machine

doi: 10.11833/j.issn.2095-0756.20240667

Abstract:   Objective  XGBoost and LightGBM models exhibit differentiated advantages within the gradient boosting decision tree framework. This study aims to systematically compare the performance differences between the two in estimating soil heterotrophic respiration (Rh), which will help to explore the potential of gradient boosting machines in ecosystem carbon flux prediction and promote the optimization of such models in large-scale carbon cycle simulations.   Method  A database of soil Rh and environmental factors in China’s terrestrial ecosystems was constructed based on the Global Soil Respiration Database (SRDB). XGBoost and LightGBM models were used to estimate and compare soil Rh from 2000 to 2023. The spatial pattern and main influencing factors of soil Rh in China’s terrestrial ecosystems were further investigated.   Result  (1) Both models demonstrated high predictive accuracy (R2 = 0.91 for the test set). XGBoost model showed strong fitting ability on the training set, while LightGBM model performed better in controlling the error on the test set. (2) The annual average values of soil Rh estimated by XGBoost and LightGBM models from 2000 to 2023 were 299.57 and 294.60 g·m−2·a−1, respectively, with interannual variations of 19.51 and 32.43 g·m−2·a−1, respectively. (3) The spatial distribution of soil Rh was high in the south and low in the north, mainly influenced by soil properties and leaf area index. This spatial heterogeneity reflected different responses of soil Rh to environmental changes.   Conclusion  The gradient boosting machine model demonstrates good adaptability in the modeling and prediction of large-scale soil Rh. It can effectively capture the spatiotemporal variations of soil Rh and demonstrate strong predictive ability. [Ch, 4 fig. 3 tab. 33 ref.]

ZHANG Jinwen, WANG Wenlong, NI Rongyu, et al. Prediction of soil heterotrophic respiration in China’s terrestrial ecosystems based on gradient boosting machine[J]. Journal of Zhejiang A&F University, 2025, 42(4): 774−783 doi:  10.11833/j.issn.2095-0756.20240667
Citation: ZHANG Jinwen, WANG Wenlong, NI Rongyu, et al. Prediction of soil heterotrophic respiration in China’s terrestrial ecosystems based on gradient boosting machine[J]. Journal of Zhejiang A&F University, 2025, 42(4): 774−783 doi:  10.11833/j.issn.2095-0756.20240667
  • 土壤异养呼吸(Rh)是陆地生态系统碳循环的重要组成部分,直接影响土壤碳储量与大气温室气体浓度[1]。作为气候变化反馈机制的关键环节,土壤异养呼吸的准确估算对于评估碳源、碳汇及全球碳循环具有重要的科学意义[2]。然而,由于土壤微生物分解过程的复杂性及对环境变化的敏感性,土壤异养呼吸的估算面临较大挑战。

    传统的土壤异养呼吸估算方法主要依赖于线性或非线性回归模型,在引入更多变量时可能会引发多重共线性及自相关等问题,从而削弱模型的稳健性和预测精度[36]。近年来,机器学习模型凭借其强大的非线性拟合能力,在生态学领域展现出巨大潜力[68]。例如,TANG等[6]和HE等[7]采用随机森林(RF)模型对土壤异养呼吸进行估算,其准确性取得了显著提升。然而,这些研究在模型应用时未充分考虑环境因子的优化选择及模型结构的进一步优化,限制了模型性能的进一步提升[78]。相比之下,极限梯度提升树(XGBoost)和轻量级梯度提升机(LightGBM)作为2种经改进的梯度提升机模型,通过引入基于模型权重绝对值(L1)和平方(L2)惩罚项的正则化机制能有效防止过拟合,同时采用高效的并行计算框架,显著提高了计算效率,在处理大规模、多维度数据集时表现出更优的性能,从而在土壤异养呼吸估算中展现出更为突出和可靠的应用前景[913]

    除估算模型的选择外,选取高质量的解释变量也是精确预测土壤异养呼吸的基础[14]。研究表明:土壤温度、水分、有机质、pH等土壤性质,以及降水量、气温等气候因子是影响土壤异养呼吸的关键因素[67]。通过整合高分辨率的多源遥感数据[如协调世界土壤数据库(HWSD)土壤性质数据和CRU TS气候数据],可实现土壤异养呼吸的大尺度估算和动态估算[12]。然而,当前针对中国陆地生态系统的土壤异养呼吸估算数据仍较为匮乏,基于机器学习的土壤异养呼吸估算方法也有待进一步验证与优化。

    鉴于此,本研究基于全球土壤呼吸数据库(SRDB)和多源遥感数据,利用XGBoost和LightGBM 2种梯度提升机模型,对2000—2023年中国陆地生态系统的土壤异养呼吸进行估算[1, 67, 15]。本研究旨在对比2种模型的性能表现,并探讨中国陆地生态系统的土壤异养呼吸空间分布格局及其环境响应机制[16],在当前全球气候变化和生物多样性下降的背景下,对指导中国碳汇项目的规划、评估和实施具有重要的现实意义。

    • 本研究土壤异养呼吸数据集来源于BOND-LAMBERTY等[2]编制的全球土壤呼吸数据库,TANG等[6]利用中国知网相关文献数据在此基础上对全球土壤呼吸数据库进行了进一步的完善,该数据集已于2022年10月9日更新,获取网址为https://github.com/bpbond/srdb/。综合TANG等[6]和HE等[7]的全球土壤呼吸数据库数据筛选标准,本研究仅保留符合以下要求的数据:①测量时间至少为1 a。②同一地点的多年测量数据被视为独立样本。③提供了明确的地理坐标和测量年份。④数据未经过实验操作干扰。⑥基于碱吸收法的测量结果被排除在外。最终保留了中国区域的467个土壤异养呼吸观测数据,其中草地、城市、耕地、森林分别为61、33、227、146个,湿地和其他土地利用类型因观测数据缺失未纳入统计分析。

    • 基于HE等[7]的研究经验,本研究共选取了18个环境因子,涵盖气候、地形、植被、土壤生物特征及土壤物理化学性质等多个方面。年平均气温(MAT)和年平均降水量(MAP)的数据来源于英国东英格利亚大学气候研究中心的CRU TS v4.07数据(https://crudata.uea.ac.uk/cru/data/hrg)。该数据集凭借其精细的空间分辨率、长时间序列和全球广泛覆盖等特点,能够准确捕捉区域气候变化特征。基于此数据集定义的土壤干旱指数(DryMonth)[17],进一步提升了气候因子对土壤异养呼吸动态变化的响应能力。地形因子中的海拔(Elevation)数据来源于中国科学院计算机网络信息中心地理空间数据云平台(http://www.gscloud.cn)[18],其高精度全球地形数据为本研究提供了可靠支持。植被类型及叶面积指数数据均来源于ERA5 再分析产品(https://cds.climate.copernicus.eu)[19],该数据具有高时空分辨率和长期连续性,能够准确反映区域植被的动态变化特征。植被类型作为研究区主要植被群落结构组成的重要指标,能有效揭示生态系统功能及地上生物量的空间分布格局;年均低植被叶面积指数与年均高植被叶面积指数分别代表灌草层与乔木层植被的覆盖度及生产力,是衡量不同植被层级光合效率和碳固定潜力的关键生态参数,对土壤异养呼吸过程具有显著的调控作用。土壤物理化学性质数据来源于协调世界土壤数据库(HWSD v2.0,https://www.fao.org/home/en)[20],该数据库整合了多种土壤理化指标,如土壤有机碳、pH、总氮密度等,为土壤异养呼吸估算提供了较为全面的栅格数据。本研究选用上述数据集作为模型拟合变量,综合考虑了土壤异养呼吸与不同环境因子影响的关系,为提高模型的预测精度奠定了坚实基础。相关数据的具体描述详见表1

      项目 年平均
      气温/K
      年平均
      降水量/m
      植被
      类型
      含砂量/
      %
      粉土/
      %
      黏土/
      %
      土壤阳离子交
      换量/(cmol·kg−1)
      土壤pH 土壤有机碳/
      (g·kg−1)
      平均值 276.24 0.02 58.44 41.07 32.63 22.54 12.89 6.27 11.8
      最小值 249.67 0 10.00 2.90 5.00 2.10 1.10 0.78 1.1
      最大值 296.74 0.14 190.00 89.00 50.00 56.00 32.00 8.40 30.7
      中位数 276.51 0.01 50.00 38.00 36.70 22.00 12.00 6.50 11.3
      上四分位数 271.21 0 11.00 29.00 24.00 20.00 8.55 5.10 7.4
      下四分位数 284.73 0.04 70.00 44.00 41.16 25.00 17.00 7.30 14.6
      项目 土壤总氮
      密度/(g·kg−1)
      土壤碳
      氮比
      土壤含
      水量/%
      土壤潜在
      蒸发/m
      土壤真菌
      细菌比
      土壤线虫密度/
      (条·kg−1)
      海拔/m 年均低植被
      叶面积指数
      年均高植被
      叶面积指数
      平均值 14.1 11.48 0.53 −0.01 21.84 136.2 790.23 1.62 2.01
      最小值 2.2 9.00 0.15 −0.02 8.07 52.7 4.00 0.20 0
      最大值 38.9 18.00 0.89 0 38.24 362.5 3 780.00 3.43 4.91
      中位数 14.0 11.00 0.53 −0.01 20.84 122.8 437.00 1.48 2.00
      上四分位数 11.3 10.00 0.46 0 16.29 96.6 154.00 1.05 0.73
      下四分位数 15.4 13.00 0.59 −0.01 28.66 16 300.5 1 329.00 2.10 2.73
        说明:年平均气温、年平均降水量、土壤总氮密度、土壤碳氮比、土壤潜在蒸发、土壤真菌细菌比的原始分辨率为0.50°,植被类型的原始分辨率为0.05°,含砂量、粉土、黏土、土壤阳离子交换量、土壤pH、土壤有机碳的原始分辨率为250 m,土壤含水量的原始分辨率为0.25°,土壤线虫密度的原始分辨率为1 km,海拔的原始分辨率为30 m,年均低植被叶面积指数、年均高植被叶面积指数的原始分辨率为0.083°。

      Table 1.  Overview of environmental factors

    • 本研究基于全球土壤呼吸数据库筛选的467个观测点,并根据每个样点所属的年份,使用ArcGIS 10.8中的“多值提取至点”提取对应表1所有的解释变量数据,构建中国区域的土壤异养呼吸及环境因子数据库,用于建模。为了生成年尺度的土壤异养呼吸栅格数据,使用“创建渔网”生成了10 km×10 km的中国区域网格数据(约14万个网格单元),并使用“以表格显示分区统计”,将表1所有的变量栅格数据提取到所有的网格单元中,进而将全球土壤呼吸数据库数据建立的最优模型结合网格数据,估算土壤异养呼吸栅格数据。

    • 梯度提升模型是一种迭代的决策树算法,通过逐步训练多个弱学习器以提升模型的预测性能[21]。极限梯度提升树(XGBoost)和轻量级梯度提升机(LightGBM)是梯度提升机中2种具有独特优势的模型,凭借基于直方图的分裂算法和高效处理稀疏数据的能力,显著提升了计算效率和预测准确度[22]。因此,本研究选择XGBoost和LightGBM模型构建土壤异养呼吸的预测模型。

      XGBoost通过在预测过程中逐步添加新的回归树,每一轮迭代都针对前一轮的残差进行拟合,从而逐步减少预测值与真实值之间的误差,进而提高模型的预测精度[23]。此外,该模型引入了正则化项以控制模型复杂度,并通过增量式训练和精细调整特征分裂点来优化变量选择与权重参数,进一步提升模型性能[2425]

      LightGBM 基于直方图算法(histogram)寻找最佳分裂点,并通过单边梯度采样算法(GOSS)和互斥特征绑定算法(EFB)来降低训练学习过程中样本数量和特征数量[2627]。这些创新可使LightGBM具备训练快速和内存占用低的优点,能有效处理高维数据和大规模数据集。

      本研究采用R 4.4.1软件中的“xgboost”包和“lightgbm”包来实现XGBoost和LightGBM模型的构建,并利用xgb.cv函数、lgb.cv函数与rBayesianOptimization包进行交叉验证和贝叶斯优化,以调整模型参数。

    • 本研究采用决定系数(R2)、均方误差(MSE)、均方根误差(RMSE)、平均绝对误差(MAE)[2831]和赤池信息量准则(AIC)对模型的拟合结果进行评估。决定系数反映了模型对数据变异的解释能力,其值范围为0~1,值越接近1,表示模型的拟合效果越好;均方误差用于评估模型预测结果与实际结果之间的平均平方差,值越小,表明模型的预测误差越小;均方根误差是均方误差的平方根,进一步量化了模型预测结果与实际值之间的偏差程度;平均绝对误差用于衡量模型预测值与实际值之间的平均绝对差异,其数值越小,表示模型的预测精度越高;赤池信息量准则考虑了模型的复杂度和拟合优度,用于评估模型的相对质量,值越小,表示模型越优。XGBoost和LightGBM模型的预测精度不会受到样本数据集大小的显著影响[24, 26],但考虑到2种模型在提高效率的同时可能会出现过拟合和对噪声敏感等问题,为确保模型的稳健性和预测精度,使用80%数据用于训练集,20%用于测试集的划分方式,并通过5次随机划分生成不同训练样本集,以提高模型的泛化能力。此外,为识别对土壤异养呼吸影响最显著的环境因子,本研究基于训练好的LightGBM和XGBoost模型,分别通过lgb.importance和xgb.importance函数计算变量重要性,用以筛选关键影响因子[5]

      为全面评估 XGBoost 和 LightGBM 在预测中国陆地生态系统土壤异养呼吸方面的性能,本研究选取了TANG等[6]、HE等[7]和张梅等[30] 3项具有代表性的研究作为外部基准。这些研究分别采用随机森林和传统统计方法估算土壤异养呼吸,覆盖广泛的地理区域。其中,TANG等[6]和HE等[7]的数据以栅格图层形式在文章附件处下载,张梅等[30]的数据则以表格形式在文章中展示。通过对比本研究与上述研究的结果,不仅可验证所构建模型的有效性,还能揭示不同方法在表征土壤异养呼吸时空动态方面的差异。

    • 表2显示了5个样本数据的拟合与预测结果。从训练集来看, XGBoost和LightGBM模型的决定系数均接近0.9,表明出良好的拟合能力。两者的误差指标(均方误差为8 602.76~10 833.86 g·m−2,平均绝对误差为52.86~64.54 g·m−2,均方根误差为92.75~104.09 g·m−2)相近,但XGBoost模型的赤池信息量准则值略低,表明其对训练集的拟合能力更为紧凑。然而,在测试集上,LightGBM模型的指标多优于XGBoost模型,决定系数仍保持在0.8以上,平均绝对误差为80.74~108.18 g·m−2,均方误差为5 467.00~30 514.14 g·m−2,均方根误差为124.37~167.75 g·m−2,赤池信息量准则为1 138.18~1 176.23。

      模拟对象 模型 样本1 样本2
      均方
      误差/(g·m−2)
      均方根
      误差/(g·m−2)
      平均绝对
      误差/(g·m−2)
      决定
      系数
      赤池信息
      量准则
      均方
      误差/(g·m−2)
      均方根
      误差/(g·m−2)
      平均绝对
      误差/(g·m−2)
      决定
      系数
      赤池信息
      量准则
      训练集LightGBM10 833.86104.0964.540.904 483.0910 617.39103.0463.960.904 471.22
      XGBoost9 467.1197.3057.480.914 447.9910 707.57103.4865.290.904 467.09
      测试集LightGBM17 668.85132.9296.370.831 148.1215 467.00124.3796.310.881 139.91
      XGBoost17 070.74130.6694.230.841 149.8515 768.83125.5797.120.871 142.06
      模拟对象模型样本3样本4
      均方
      误差/(g·m−2)
      均方根
      误差/(g·m−2)
      平均绝对
      误差/(g·m−2)
      决定
      系数
      赤池信息
      量准则
      均方
      误差/(g·m−2)
      均方根
      误差/(g·m−2)
      平均绝对
      误差/(g·m−2)
      决定
      系数
      赤池信息
      量准则
      训练集LightGBM8 602.7692.7555.330.914 405.469 321.8796.5557.190.924 436.45
      XGBoost9 321.0996.5559.880.914 423.388 715.1493.3553.650.924 418.05
      测试集LightGBM28 140.85167.75108.180.821 170.2816 644.90129.0298.810.851 150.71
      XGBoost30 514.14174.68110.160.801 176.2317 520.18132.36100.950.851 156.04
      模拟对象模型样本5
      均方
      误差/(g·m−2)
      均方根
      误差/(g·m−2)
      平均绝对
      误差/(g·m−2)
      决定
      系数
      赤池信息
      量准则
      训练集LightGBM8 737.6493.4852.860.924 428.41
      XGBoost8 841.2994.0353.370.924 429.43
      测试集LightGBM15 611.71124.9580.740.861 139.56
      XGBoost15 741.19125.4681.210.861 138.18

      Table 2.  Fitting results of XGBoost and LightGBM models for five sample groups

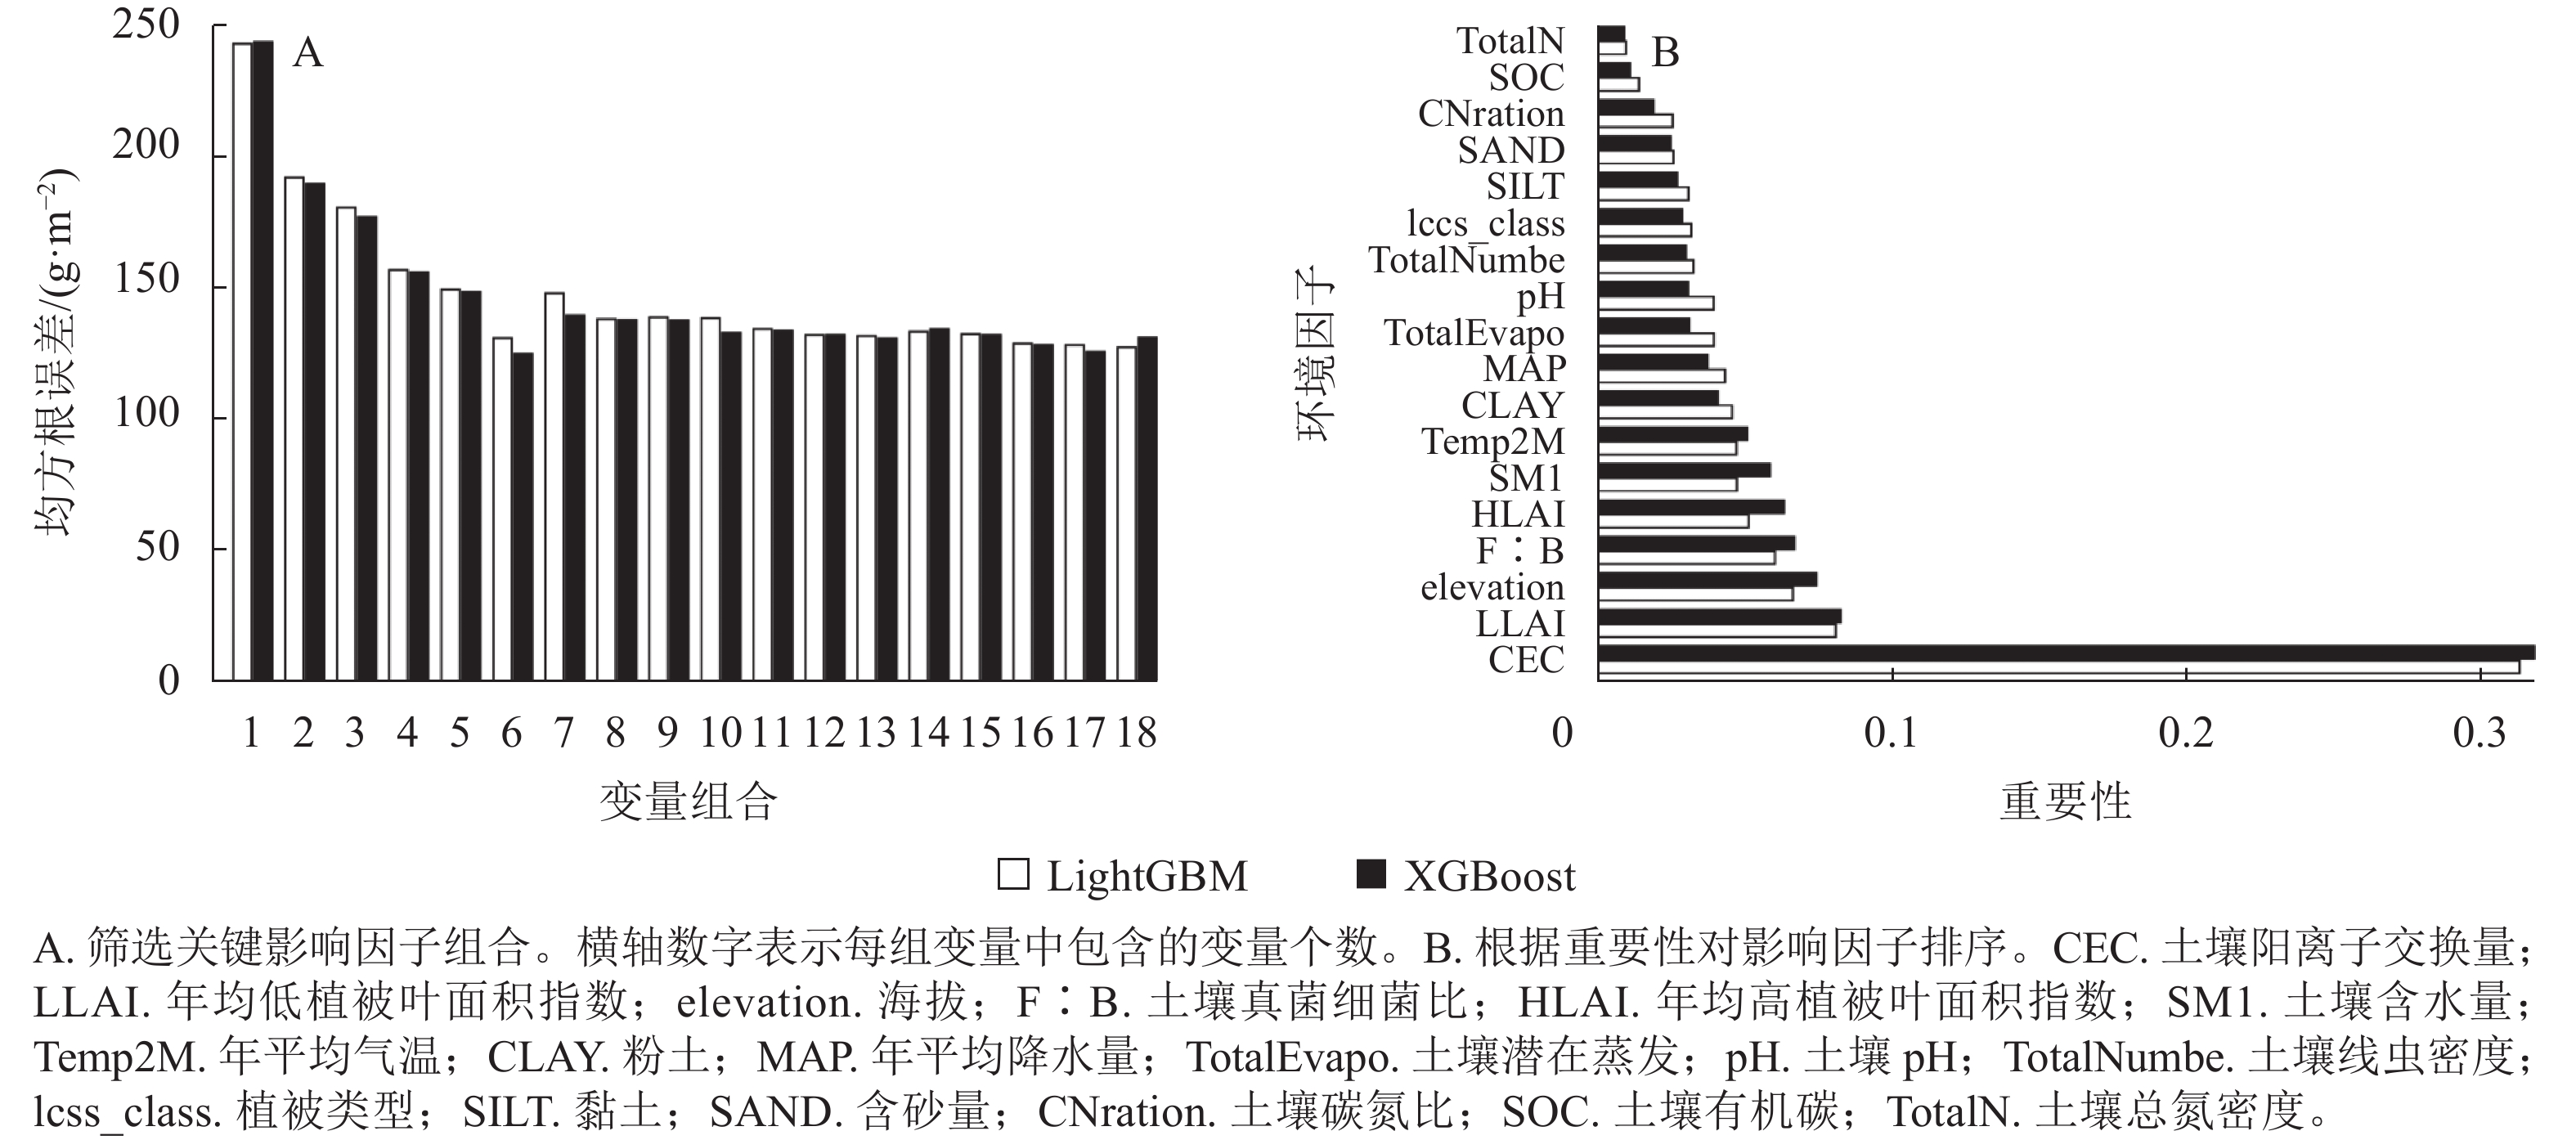
      为全面评估变量组合对模型性能的影响,本研究以18个环境因子为基础,按变量数量从1~18分组,自由组合各组变量并分别建模,选取每组中预测误差最小的模型进行性能比较[30]。结果表明:当变量数量为6时,模型均方根误差最低,预测性能最佳。基于此,进行结合变量重要性排序,最终筛选出阳离子交换量(CEC)、年均低植被叶面积指数(LLAI)、年均高植被叶面积指数(HLAI)、海拔(elevation)、土壤真菌细菌比(F∶B)和年平均降水量(MAP) 6个关键影响因子作为最优模型拟合的数据(图1),模型预测精度也得到了进一步提升,能更精准地反映土壤异养呼吸的变化趋势。

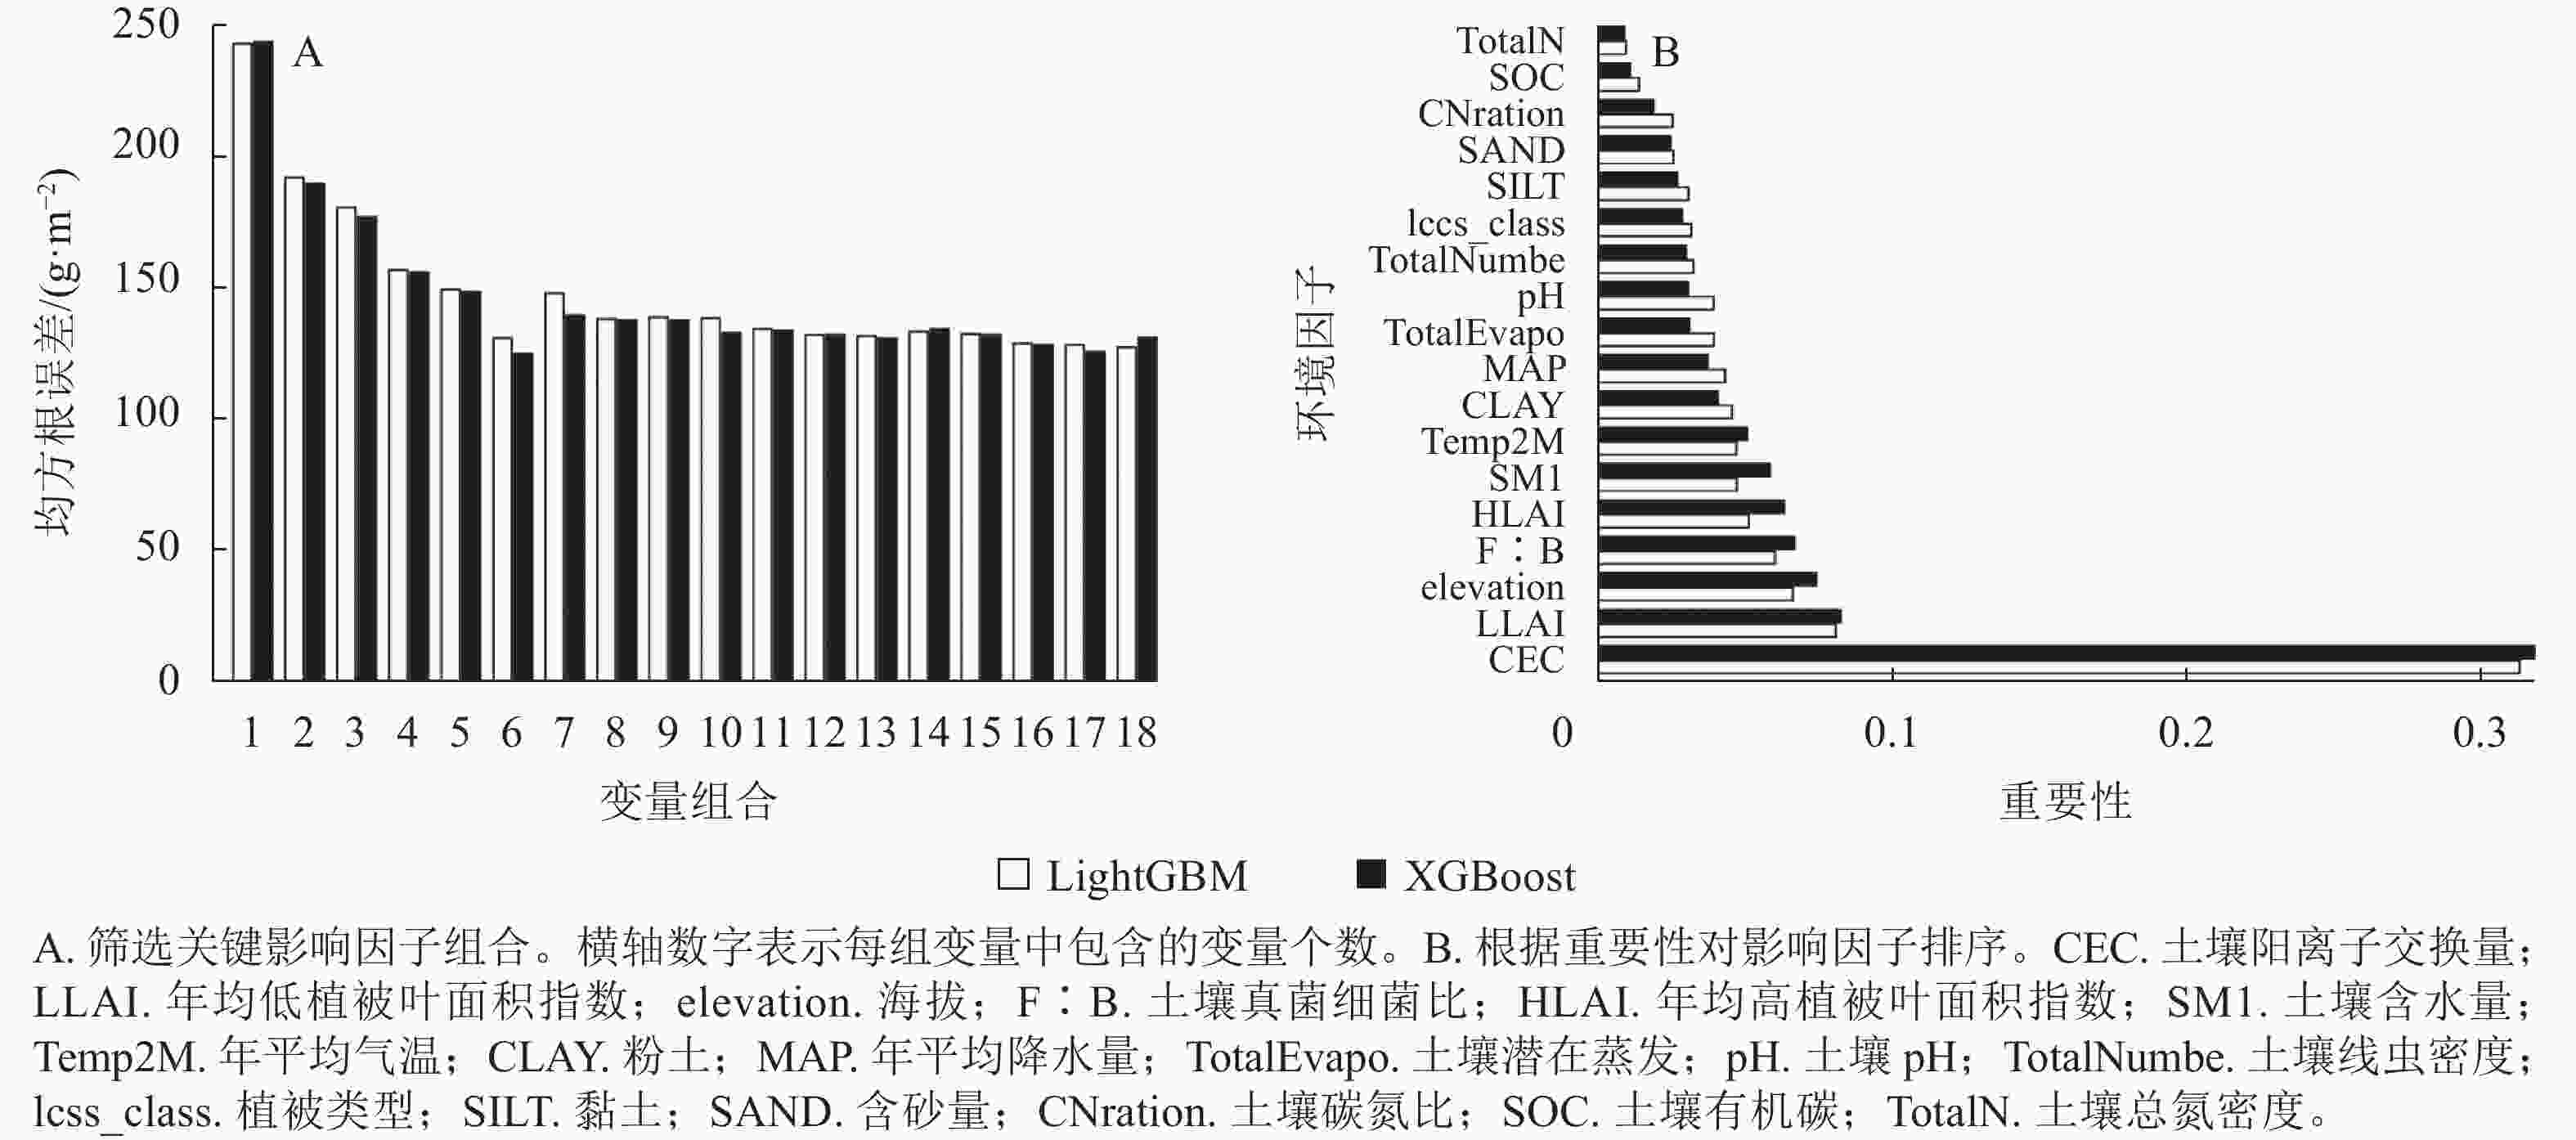
      Figure 1.  Flowchart for key influential factors

      基于筛选出的6个影响因子进行模型拟合,建立了最优模型(表3)。在训练集上,XGBoost和LightGBM模型的决定系数均为0.88,表现良好,但XGBoost模型略优于LightGBM模型,平均绝对误差为72.09 g·m−2,均方误差为13 093.28 g·m−2。相比之下,LightGBM模型在测试集中的表现更为出色,其决定系数达0.91,平均绝对误差为68.64 g·m−2,均方误差为8 388.33 g·m−2,均方根误差为91.59 g·m−2,赤池信息量准则为1 087.35。综合来看,在土壤异养呼吸估算中,LightGBM模型测试集的预测效果略优于XGBoost模型,而XGBoost模型在训练集中的泛化能力方面表现更佳。

      模拟对象模型均方误差均方根误差平均绝对误差决定系数赤池信息量准则
      训练集LightGBM13241.05115.0773.060.884568.84
      XGBoost13093.28114.4372.090.884564.34
      测试集LightGBM8388.3391.5968.640.911087.35
      XGBoost8768.1593.6470.100.911091.89

      Table 3.  Results from modeling with key influential factor combinations

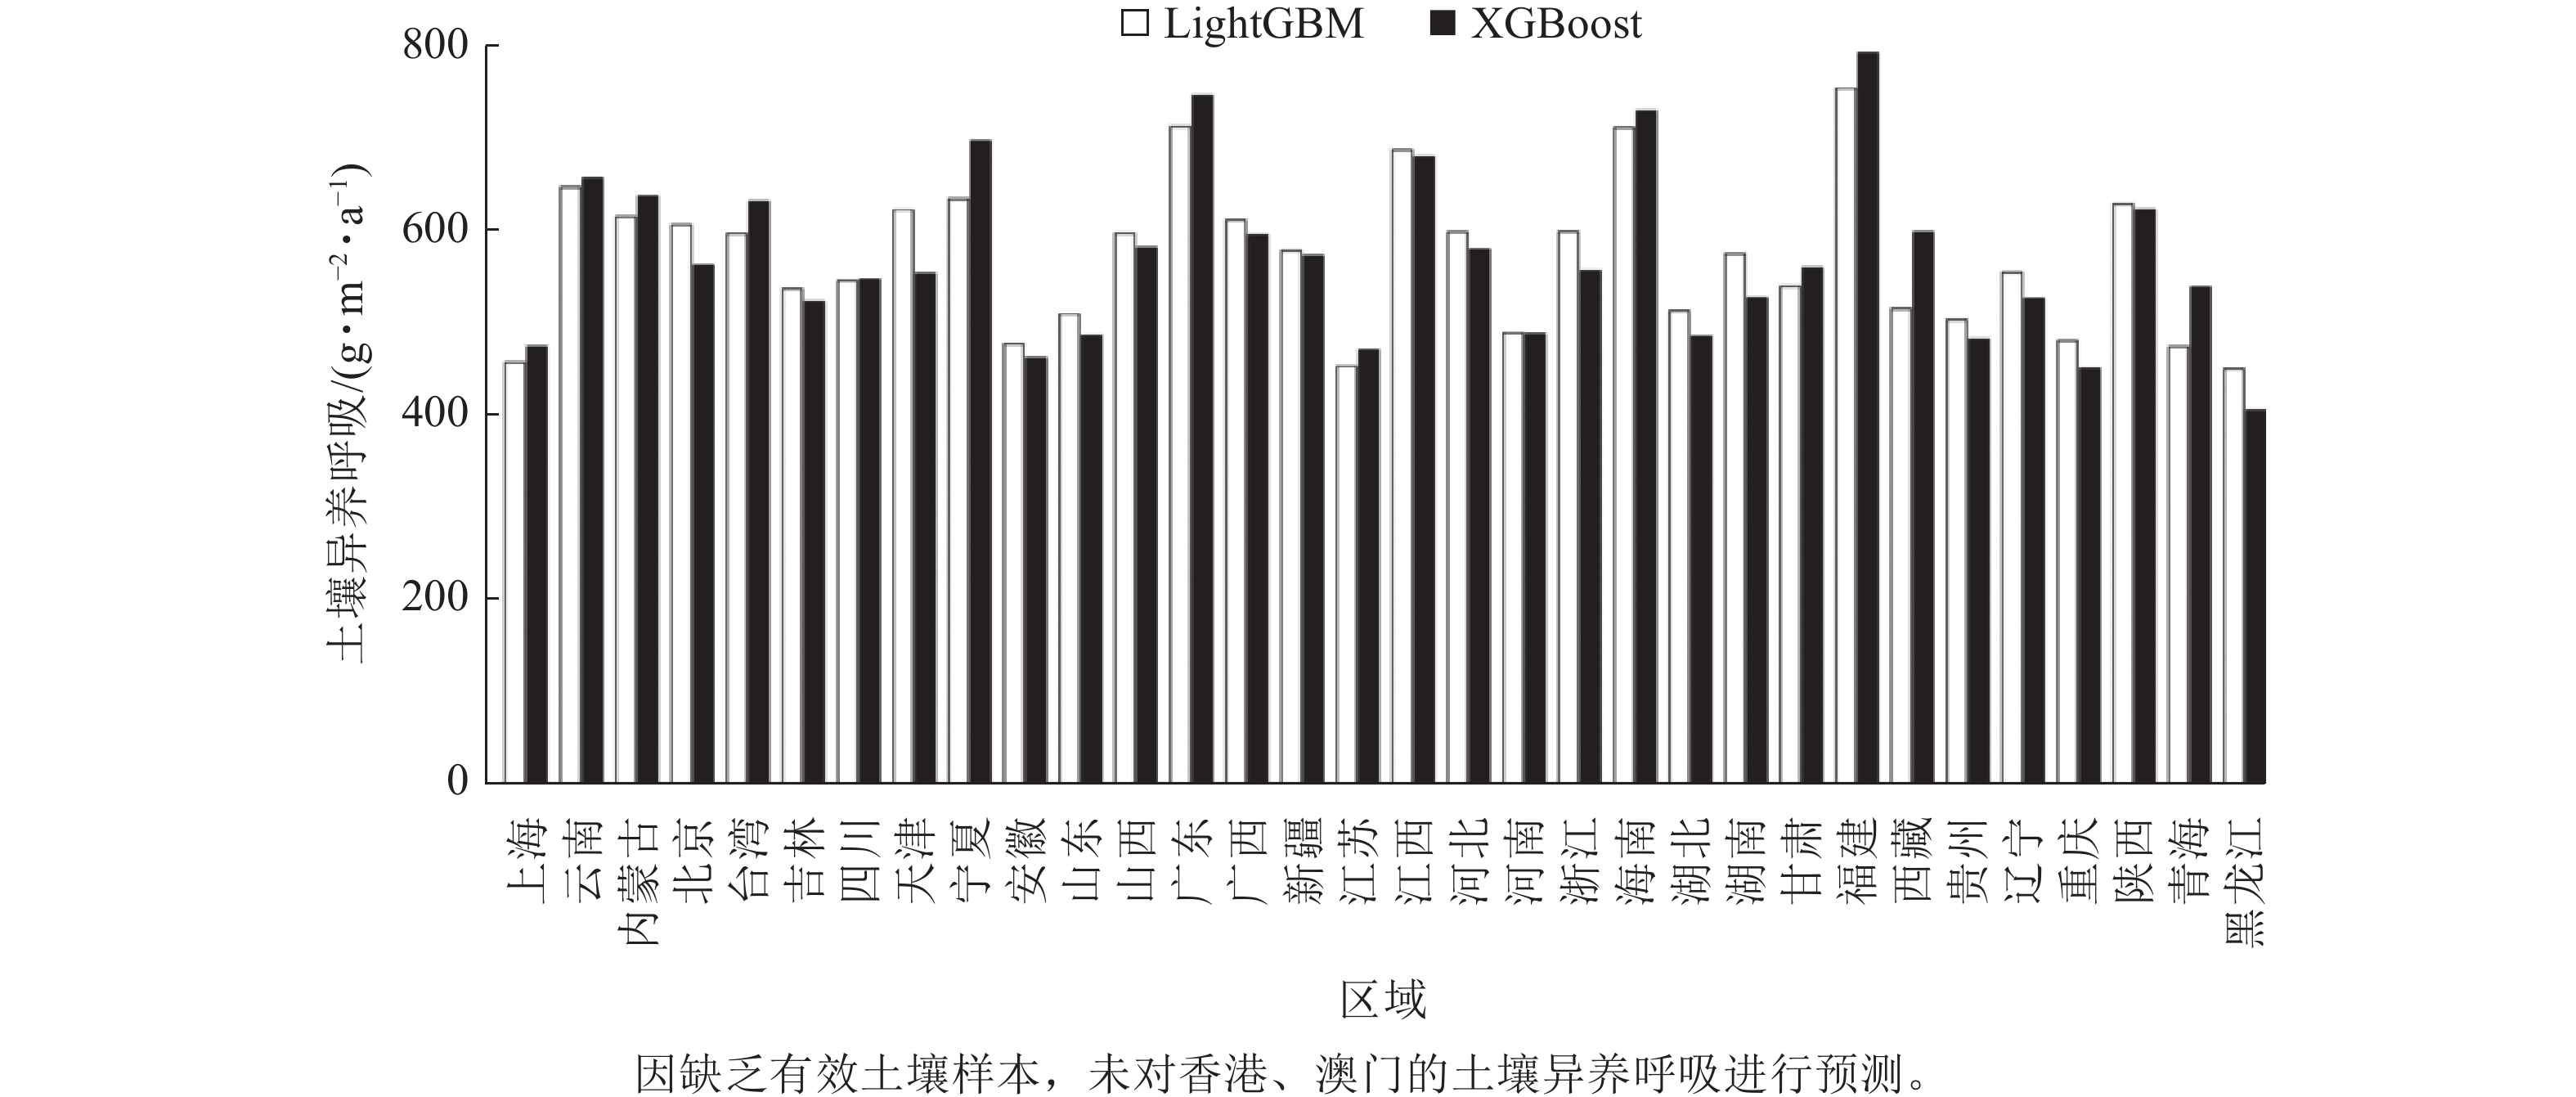
    • 土壤异养呼吸的预测结果显示(图2):中国不同区域土壤异养呼吸水平存在明显差异。其中,福建、海南、广东等表现出较高的土壤异养呼吸水平,反映出这些区域土壤有机质分解活跃,可能与温暖湿润的气候条件和丰富的植被覆盖有关。西藏、黑龙江等寒冷或高海拔地区,土壤异养呼吸水平相对较低,表明土壤微生物活动受限,碳释放速率较慢。此外,内蒙古、新疆、宁夏等干旱半干旱地区也显示出相对较高的土壤异养呼吸水平,可能与局部草原生态系统和土壤水分条件相关。

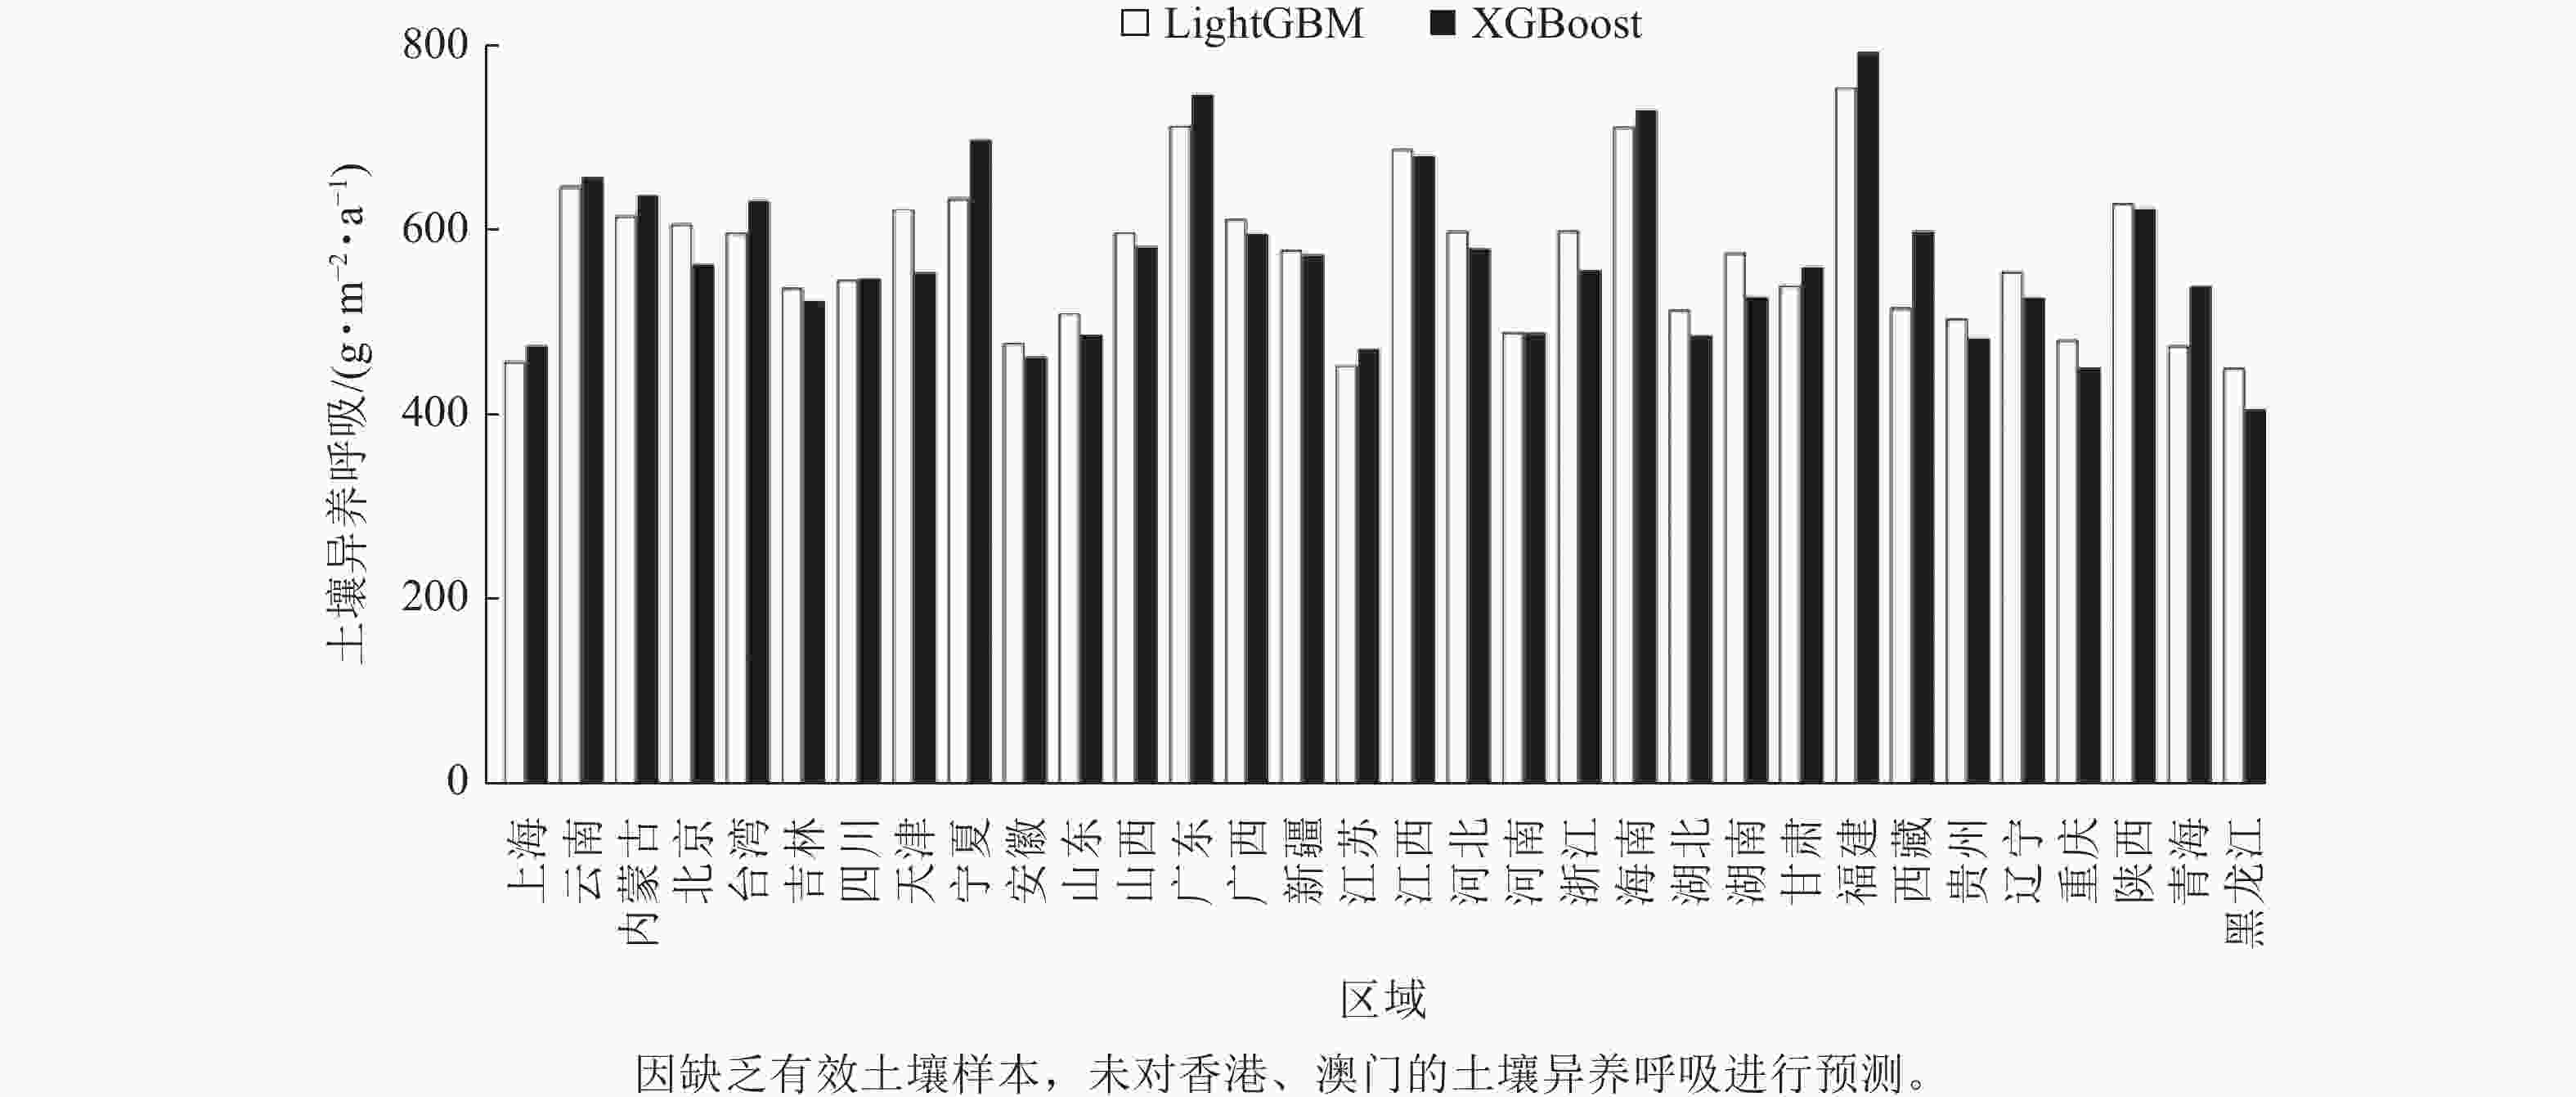
      Figure 2.  Spatial distribution of soil heterotrophic respiration

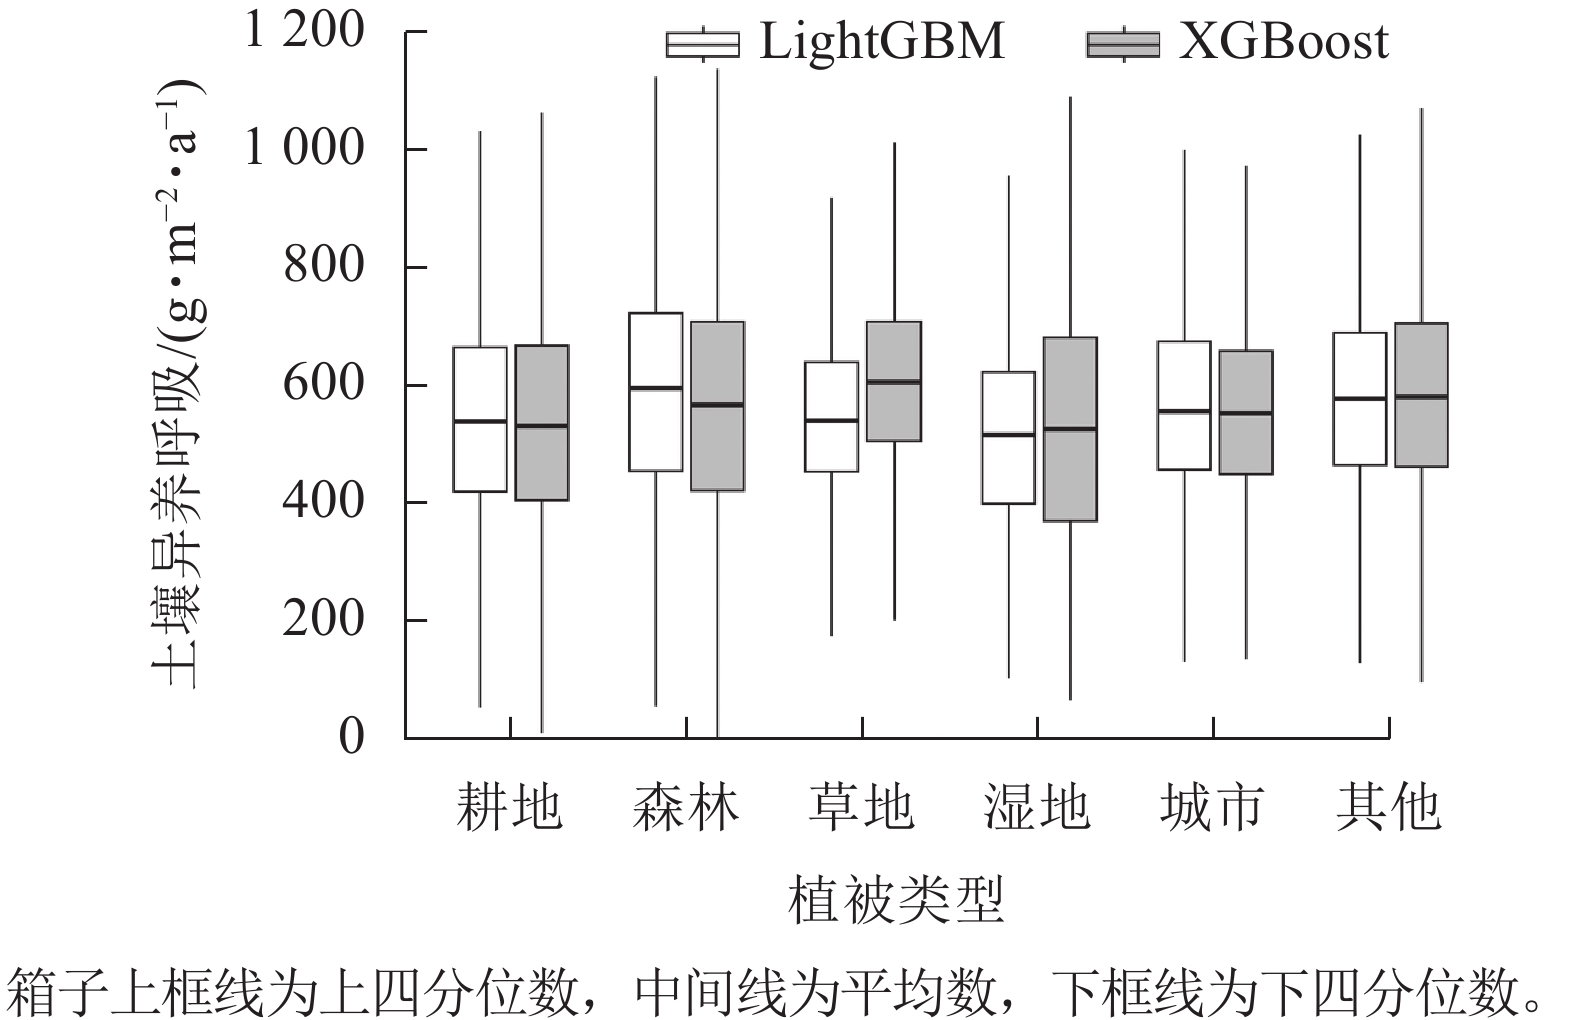
      为了探讨不同类型土壤异养呼吸的情况,本研究对2000—2023年2种模型预测的不同土地利用类型(耕地、森林、草地、湿地、城市及其他)的土壤异养呼吸结果做了进一步分析(图3)。结果表明:2种模型在不同植被类型下的平均预测值总体相近,但仍存在一定差异。其中,草地的平均预测值最高,XGBoost和LightGBM模型分别为607.39和548.78 g·m−2·a−1;湿地的平均预测值最低,XGBoost与LightGBM模型分别为528.47和514.18 g·m−2·a−1。此外,2种模型的最大预测值均出现在草地和森林,最小预测值则集中在湿地和城市地区。总体来看,XGBoost模型在草地区域的预测值略高于LightGBM模型,而在湿地和城市区域则相对较低。

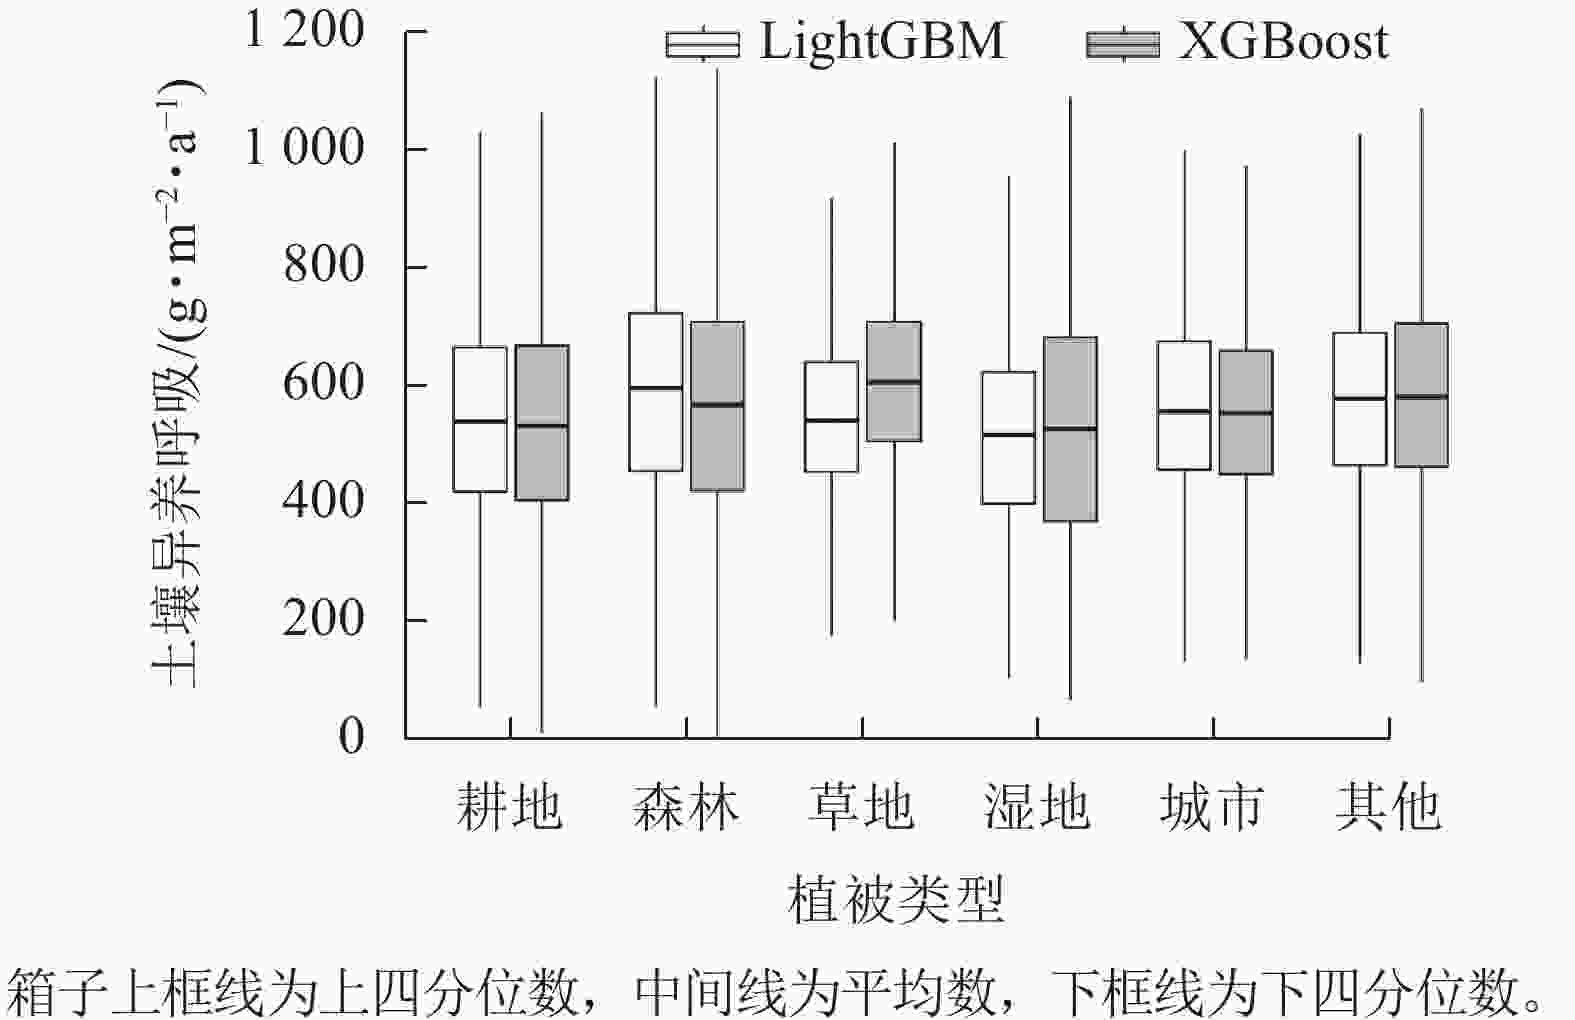
      Figure 3.  Statistics of soil heterotrophic respiration under different land use types

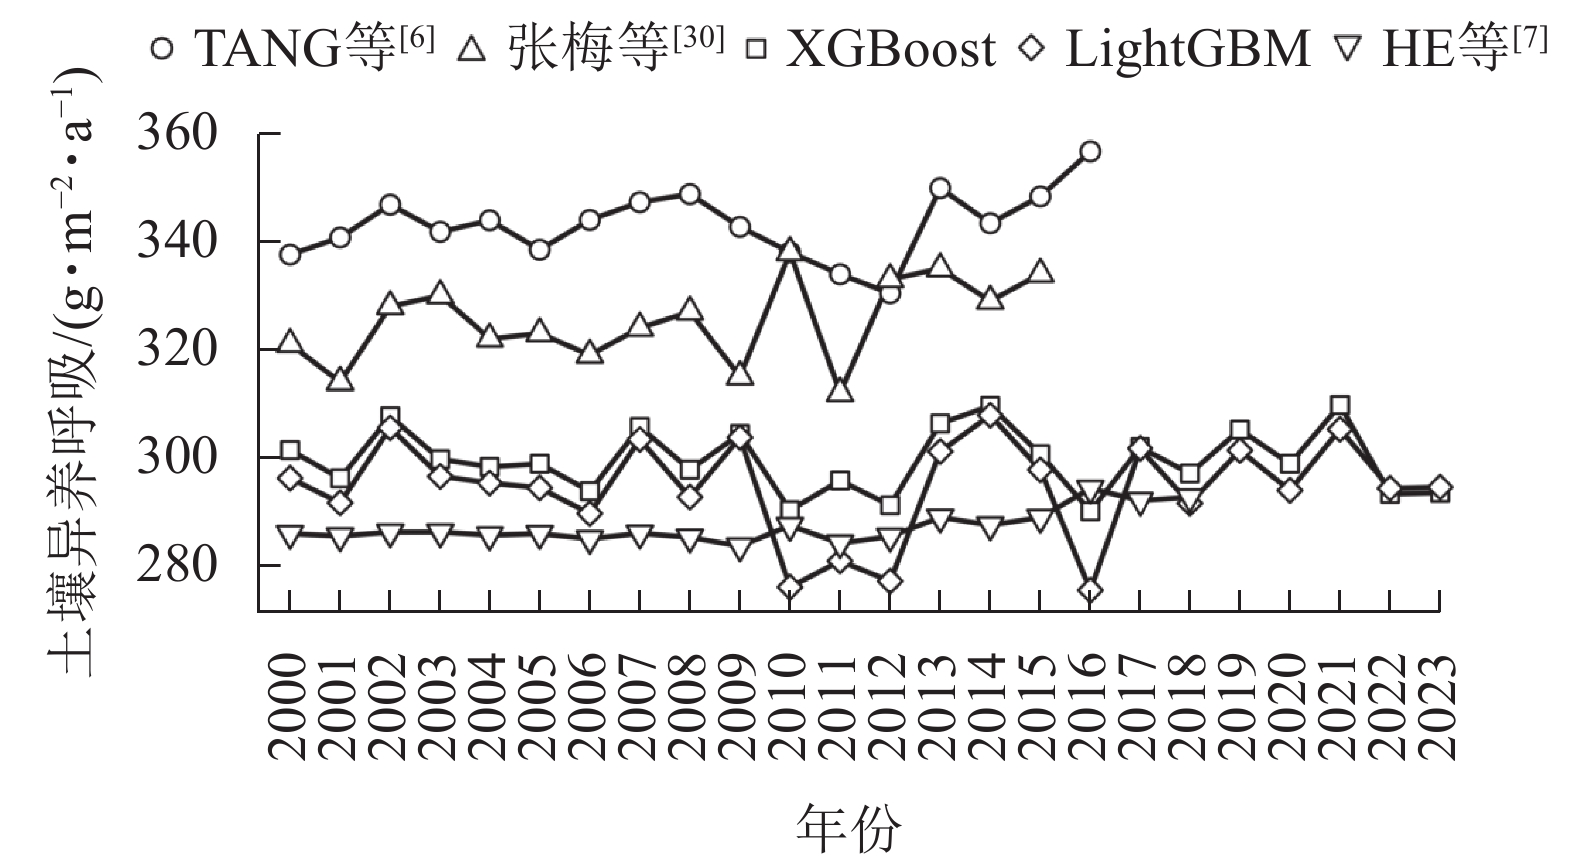
      本研究通过对比分析揭示了2000—2023年全国土壤异养呼吸的年际变化趋势,比较了XGBoost、LightGBM、随机森林(TANG等[6]和HE等[7])以及回归模型(张梅等[30])的估算结果(图4)。TANG等[6]的随机森林模型结果表明:土壤异养呼吸在2008和2016年分别达到峰值(348.80和356.71 g·m−2·a−1),显示出对环境变化的较强敏感性。相比之下,HE等[7]的随机森林模型结果相对平稳,年际变化幅度仅为10.68 g·m−2·a−1,表明其对误差的控制较好,但可能未能充分捕捉极端年份的波动。张梅等[30]基于回归模型的估算结果则显示:在2009—2012年,土壤异养呼吸呈现明显波动,峰值出现在2010年,可能与该时期的气候异常有关。本研究中,XGBoost和LightGBM模型均能够较好地捕捉土壤异养呼吸的年际变化趋势,尤其在2010—2012年和2016年表现出明显的波动,最低值分别为290.16和275.54 g·m−2·a−1,与TANG等[6]估算的土壤异养呼吸的变化趋势相一致。这表明XGBoost和LightGBM模型能够较好反映极端年份的变化,且在2000—2023年,XGBoost和LightGBM模型的土壤异养呼吸年均值分别为299.57和294.60 g·m−2·a−1,年际变化幅度分别为19.51和32.43 g·m−2·a−1,显示出两者在捕捉年际变化幅度上的差异。

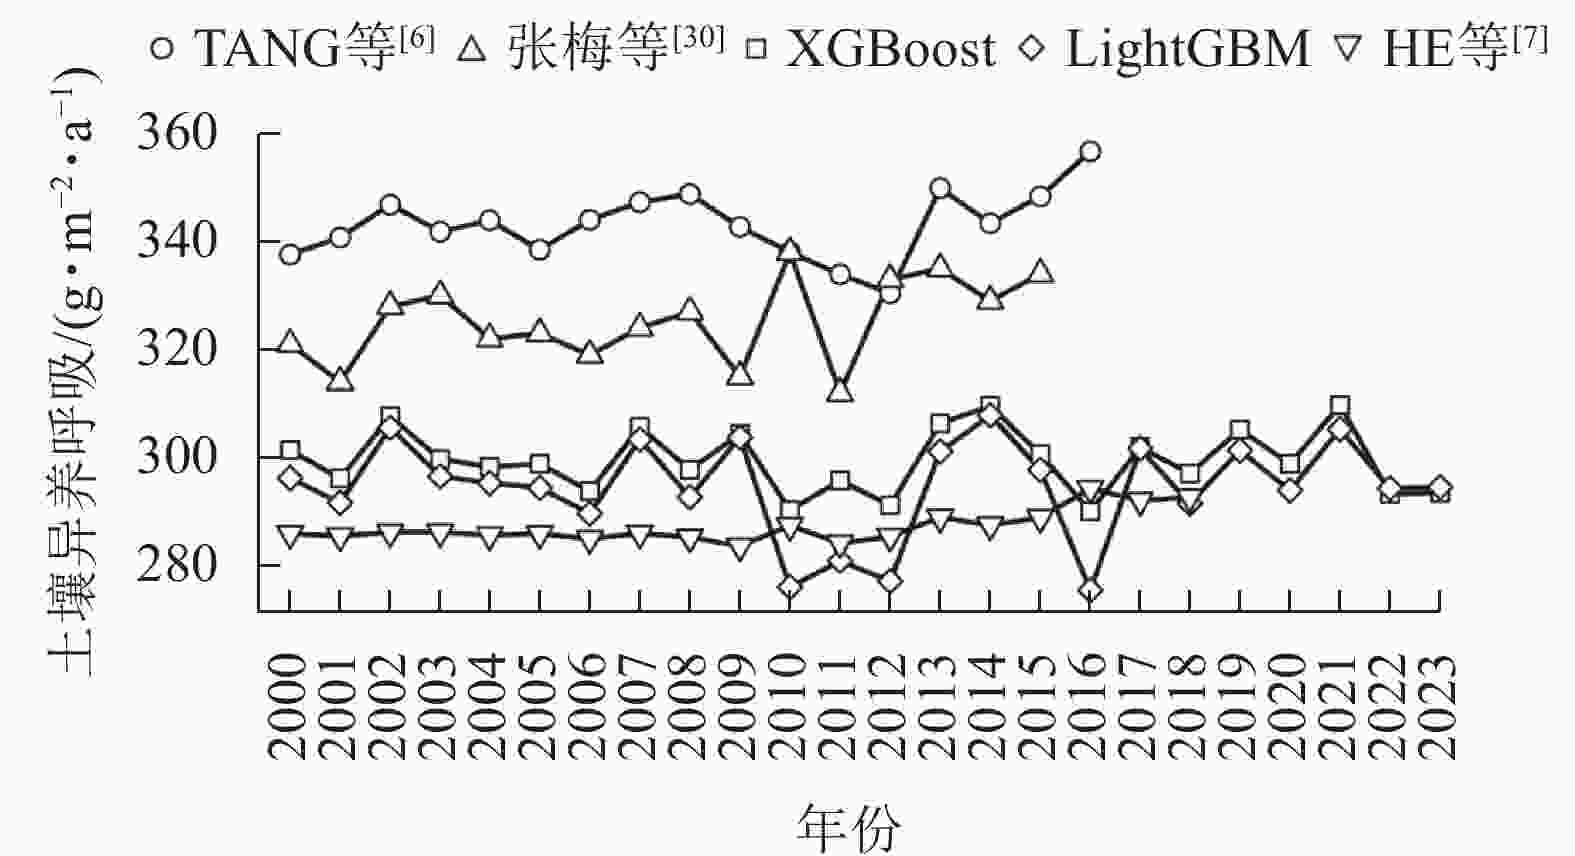
      Figure 4.  Comparison of annual average soil heterotrophic respiration values predicted by different models

    • 经过筛选,最终确定模型拟合的关键变量为土壤阳离子交换量、年均低植被叶面积指数、年均高植被叶面积指数、海拔、土壤真菌细菌比以及年平均降水量。尽管湿地及其他植被类型的土壤异养呼吸观测数据存在缺失,但考虑到模型未直接引入植被类型变量,同时本研究采用了10 km高分辨率网格进行模拟,这6个关键变量在一定程度上亦能反映湿地及其他生态系统的特性,从而提升土壤异养呼吸估算的精度。在这些变量中,土壤阳离子交换量的重要性最高,这可能是由于其在调控土壤养分动态及促进有机质分解过程中对微生物活性产生了决定性影响,从而显著影响了土壤异养呼吸。叶面积指数则紧随其后,可能通过增加有机碳输入及调节土壤温湿度与微生物活性等,间接驱动土壤异养呼吸的变化[7]。此外,海拔、土壤真菌细菌比以及年平均降水量虽然贡献度相对较低,但分别代表了气候条件、微生物群落结构与水分状态,对土壤异养呼吸的空间异质性和动态变化仍发挥着不可忽视的调节作用[3]

      相比于张梅等[30]采用的传统统计方法,XGBoost和LightGBM 2种梯度提升机模型更精准地刻画了非线性关系及高维变量间的复杂关系,显著提升了预测精度。相较于TANG等[6]和HE等[7]所使用的机器学习方法,本研究进一步结合贝叶斯优化与交叉验证,在模型评估中综合考量平均绝对误差、赤池信息量准则等多项指标,以确保评估结果的全面性与稳健性。此外,本研究通过优化模型的关键变量,并结合10 km高分辨率网格数据,提升了对区域异质性的解析能力,进一步增强了模型的泛化能力。2种模型通过梯度提升策略和正则化机制显著提升了预测精度,其中LightGBM模型凭借其独特的直方图算法在测试集上的表现相对更为优越,而XGBoost模型则在训练集上展现出更强的泛化能力。考虑到土壤异养呼吸数据的观测误差,高达90%的解释率可能部分来源于对训练数据噪声的过度学习,存在潜在的过拟合风险。尽管贝叶斯优化和交叉验证在一定程度上缓解了这一问题,但数据的不确定性依然难以完全消除。因此,本研究进一步对网格预测值进行了不确定性分析,结果显示:XGBoost模型在误差控制方面表现出更为优越的特性,这可能与其更强的抗噪能力和鲁棒性相关。

      基于XGBoost和LightGBM模型预测的中国陆地生态系统的土壤异养呼吸结果,进一步分析不同植被类型的土壤异养呼吸估算结果后发现:土壤异养呼吸的最大值主要出现在草地和森林区域。这2类植被在南方低纬度地区(如云南、广西和福建)分布广泛,与2种模型预测的土壤异养呼吸空间分布模式高度一致。进一步的空间分析表明:2000—2023年,中国土壤异养呼吸较高的区域集中在东南沿海的低纬度地区,而北方高纬度地区土壤异养呼吸较低,这一趋势与张梅等[30]的研究结果相吻合。土壤异养呼吸南北差异的形成主要受气候、土壤性质及植被类型的共同影响。在高纬度地区,寒冷气候抑制微生物活性,限制有机质分解,导致土壤异养呼吸较低[32]。在南方,较高的气温、充足的降水以及较高的植被覆盖共同促进了土壤有机碳的分解和土壤异养呼吸[33]

      目前,全球土壤呼吸数据库中关于中国区域的土壤异养呼吸观测数据不足,未能实现对研究区的全覆盖,这可能会削弱模型外推能力并增加过拟合风险;同时世界土壤数据库数据缺乏年尺度的土壤质地与理化性质的栅格信息,限制了对土壤异养呼吸复杂动态特征的精确刻画。此外,当环境因子数值超出观测点分布范围时,模型外推的不确定性将显著增加。针对上述问题,未来研究应在扩充观测数据空间覆盖的同时,系统引入更多具备时空动态特征的环境因子,并通过生态系统建模集成策略,优化模型在未知区域的准确性与适用性。

    • XGBoost和LightGBM模型在拟合精度方面均表现优异(训练集决定系数为0.88,测试集决定系数为0.91),且在误差指标上也取得了较好的结果,表明梯度提升机模型在土壤异养呼吸估算中展现了较高的稳定性。通过深入分析土壤异养呼吸的影响因素,本研究发现:土壤阳离子交换量、年均低植被叶面积指数、年均高植被叶面积指数、海拔、土壤真菌细菌比以及年平均降水量是决定土壤异养呼吸变化的主要因素。空间分布分析揭示:中国土壤异养呼吸量较高的区域集中在东南沿海的低纬度地区,北方高纬度地区的土壤异养呼吸相对较低。这一发现为土壤异养呼吸预测和相关领域的决策支持提供了坚实的基础。未来研究可以进一步探讨不同生态系统和气候条件下土壤异养呼吸的变化规律,优化模型的普适性与准确性,以更好地应对气候变化。

Reference (33)

Catalog

    /

    DownLoad:  Full-Size Img  PowerPoint
    Return
    Return