Volume 42 Issue 6
Nov.  2025
Turn off MathJax
Article Contents

WANG Yamin, CHEN Caihong, SHE Jiyun. Spatio-temporal evolution of landscape patterns and their driving factors in Xinhua County based on the POGD-MGWR model[J]. Journal of Zhejiang A&F University, 2025, 42(6): 1273−1284 doi:  10.11833/j.issn.2095-0756.20250119
Citation: WANG Yamin, CHEN Caihong, SHE Jiyun. Spatio-temporal evolution of landscape patterns and their driving factors in Xinhua County based on the POGD-MGWR model[J]. Journal of Zhejiang A&F University, 2025, 42(6): 1273−1284 doi:  10.11833/j.issn.2095-0756.20250119

Spatio-temporal evolution of landscape patterns and their driving factors in Xinhua County based on the POGD-MGWR model

DOI: 10.11833/j.issn.2095-0756.20250119
  • Received Date: 2025-01-19
  • Accepted Date: 2025-06-05
  • Rev Recd Date: 2025-05-30
  • Available Online: 2025-08-15
  • Publish Date: 2025-12-20
  •   Objective  Analyzing the spatiotemporal dynamics of landscape patterns and their driving factors is critically important for effective regional landscape utilization and ecological environment management.   Method  This study, based on land use data, quantitatively assessed the dynamic changes in landscape patterns of Xinhua County, Hunan Province, from 2000 to 2020 using a landscape type transition matrix and landscape index. Furthermore, the study employed a coupled model integrating the parameter-optimized geographical detector (POGD) and multiscale geographically weighted regression (MGWR) to analyze the impacts of natural and socio-economic factors on the landscape patterns.   Result  (1) From 2000 to 2020, cultivated land area in Xinhua County showed a continuous decline, whereas construction land expanded significantly. The transition intensity of landscape types was most pronounced during 2015–2020, indicating more frequent and complex conversions among landscape types. (2) At the landscape type level, the dominance index of forestland patches increased steadily, while that of cultivated land decreased. Fragmentation, edge complexity, and shape irregularity intensified for cultivated land, forestland, and construction land. At the overall landscape level, the pattern became more complex, with an increase in patch number, a decline in connectivity, and a gradual enhancement in landscape diversity. (3) Normalized difference vegetation index (NDVI), population size, and elevation were the main driving factors influencing the landscape pattern. The interactive effects between natural and anthropogenic factors were significantly stronger than the effects of single factors. The impacts of NDVI and slope on landscape pattern exhibit pronounced spatial heterogeneity, with NDVI exerting a negative impact on landscape pattern in most areas, while slope shows a coexistence of both positive and negative effects across space.   Conclusion  The overall landscape pattern of Xinhua County shows a trend of fragmentation, with increased heterogeneity and complex patch morphology. The changes in this landscape pattern are mainly driven by a combination of natural and social factors. [Ch, 7 fig. 5 tab. 32 ref.]
  • [1] XU Hao, LI Wei, LIU Wei, WANG Chengkang.  Spatio-temporal evolution of Nanjing’s urban green space pattern and its influencing factors . Journal of Zhejiang A&F University, 2023, 40(2): 407-416. doi: 10.11833/j.issn.2095-0756.20220332
    [2] CAI Mengqing, HUANG Lu, YAN Lijiao.  Temporal and spatial variation characteristics of annual water yield and its influencing factors in Hangzhou based on InVEST model . Journal of Zhejiang A&F University, 2022, 39(1): 127-135. doi: 10.11833/j.issn.2095-0756.20210170
    [3] LIU Yuqing, ZHANG Huabing, SUN Xiaoxiang, LI Yufeng.  Spatial-temporal variations of landscape pattern and hot spot analysis in the Lixiahe Plain of Jiangsu Province from 1980 to 2018 . Journal of Zhejiang A&F University, 2022, 39(1): 105-114. doi: 10.11833/j.issn.2095-0756.20210178
    [4] LI Yujie, LU Juan, CHEN Sijia, FU Hui.  On the spatial-temporal patterns and differentiation characteristics of thermal landscape in Haikou City . Journal of Zhejiang A&F University, 2021, 38(4): 712-722. doi: 10.11833/j.issn.2095-0756.20200648
    [5] CAO Jiashuo, DENG Zhengyu, HU Yuandong, WU Yan.  Spatial and temporal evolution and driving forces of the landscape pattern in Shennongjia Forestry District . Journal of Zhejiang A&F University, 2021, 38(1): 155-164. doi: 10.11833/j.issn.2095-0756.20200279
    [6] YU Fei, LI Zhiyong.  Forests landscape pattern changes and driving forces in Mount Tianmu . Journal of Zhejiang A&F University, 2020, 37(3): 439-446. doi: 10.11833/j.issn.2095-0756.20190306
    [7] SUN Min, CHEN Jian, LIN Xintao, YANG Shan.  Urban landscape patterns and PM2.5 pollution . Journal of Zhejiang A&F University, 2018, 35(1): 135-144. doi: 10.11833/j.issn.2095-0756.2018.01.018
    [8] GUO Yujing, WANG Yan, ZHENG Yi, LIU Yungen, WEN Guojing, ZHAN Pengfei.  Temporal and spatial evolution of landscapes in Jianhu Lake Basin of northwestern Yunnan Province . Journal of Zhejiang A&F University, 2018, 35(4): 695-704. doi: 10.11833/j.issn.2095-0756.2018.04.015
    [9] WEN Guojing, LIU Yungen, WANG Yan, HOU Lei, WANG Yanxia, GUO Yujing.  Temporal and spatial evolution of landscape patterns and ecological risk in the Puzhehei Lake basin . Journal of Zhejiang A&F University, 2017, 34(6): 1095-1103. doi: 10.11833/j.issn.2095-0756.2017.06.018
    [10] WU Luyi, YUE Yongjie, LIU Guohou, GAO Runhong, SU Zhicheng.  Climate changes affecting regional landscape patterns at Xanadu . Journal of Zhejiang A&F University, 2016, 33(2): 232-238. doi: 10.11833/j.issn.2095-0756.2016.02.007
    [11] GUO Hanru, ZHANG Maozhen, XU Lihua, YUAN Zhenhua, CHEN Tiange.  Geographically weighted regression based on estimation of regional forest carbon storage . Journal of Zhejiang A&F University, 2015, 32(4): 497-508. doi: 10.11833/j.issn.2095-0756.2015.04.002
    [12] GUO Hui-hui, JIANG Wen-wei, MEI Yan-xia.  Landscape pattern analysis of Yinzhou new city zone based on high spatial resolution aerial photos . Journal of Zhejiang A&F University, 2012, 29(3): 344-351. doi: 10.11833/j.issn.2095-0756.2012.03.005
    [13] ZHANG Chun-ying, ZHANG Chun-ling, LIN Xiao-xia, HU Shai-qiang, HE Chun-ling, GE Xin-chi.  Multi-scale effects of spatial correlation for vegetative landscape types in the Wuyishan Nature Reserve . Journal of Zhejiang A&F University, 2011, 28(6): 863-869. doi: 10.11833/j.issn.2095-0756.2011.06.005
    [14] CHEN Chun-lei, WU Gang.  Choice of optimal scale for multi-source remote sensing images . Journal of Zhejiang A&F University, 2011, 28(1): 164-172. doi: 10.11833/j.issn.2095-0756.2011.01.027
    [15] CHE Teng-teng, FENG Yi-ming, CAI Dao-xiong, ZHANG Wan-xing, ZHANG Xian-qiang, WU Chun-zheng.  Dynamics analysis on landscape patterns of Chinese tropical and subtropical plantation areas . Journal of Zhejiang A&F University, 2011, 28(5): 706-712. doi: 10.11833/j.issn.2095-0756.2011.05.004
    [16] GUO Zheng, JIANG Hong, CHEN Jian, CHENG Miao-miao, JIANG Zi-shan, YU Shu-quan, LI Tu-sheng.  Forest landscape analysis with remote sensing data for Yuhang,Zhejiang Province . Journal of Zhejiang A&F University, 2010, 27(1): 36-43. doi: 10.11833/j.issn.2095-0756.2010.01.006
    [17] ZHANG Chun-ying, LIN Cong-hua, HONG Wei, WU Chen-zhen, HE Chun-ling, CHEN Ying-jiao.  Scale effect of landscape pattern indices for the Wuyishan Nature Reserve . Journal of Zhejiang A&F University, 2009, 26(6): 877-883.
    [18] XIA Wei-weil, HAN Hai-rong, YI Li-ta, CHENG Xiao-qin.  Dynamics of forest landscape pattern in Pangquangou National Nature Reserve . Journal of Zhejiang A&F University, 2008, 25(6): 723-727.
    [19] ZHENG Rong.  Comprehensive evaluation and selection of geographical provenances of Dendrocalamus latiflorus in Fujian . Journal of Zhejiang A&F University, 2005, 22(5): 507-512.
    [20] Wei Xinliang, Liu Yongfu.  Summarization on Forest Landseape Geography in Zhejiang Provicne . Journal of Zhejiang A&F University, 1996, 13(3): 316-321.
  • [1]
    LI Kai, ZHANG Beiying. Spatial-temporal evolution and driving factors of land use landscape pattern in Yan’an City from 2000 to 2020 [J]. Ecological Science, 2023, 42(6): 74−83.
    [2]
    LIU Qiang, WEI Feihong, XIA Xue, et al. Landscape pattern evolution and driving forces of land use in Kuye River Basin from 1980 to 2020 [J]. Research of Soil and Water Conservation, 2023, 30(5): 335−341.
    [3]
    FENG Yongjiu, LIU Yang, TONG Xiaohua. Spatiotemporal variation of landscape patterns and their spatial determinants in Shanghai, China [J]. Ecological Indicators, 2018, 87: 22−32.
    [4]
    LI Mengyuan, LI Xiaobing, LIU Siyu, et al. Analysis of the spatiotemporal variation of landscape patterns and their driving factors in Inner Mongolia from 2000 to 2015[J/OL]. Land, 2022, 11(9): 1410[2025-01-10]. DOI: 10.3390/land11091410.
    [5]
    MA Guoqiang, LI Qiujie, YANG Shuyu, et al. Analysis of landscape pattern evolution and driving forces based on land-use changes: a case study of Yilong Lake watershed on Yunnan-Guizhou Plateau[J/OL]. Land, 2022, 11(8): 1276[2025-01-10]. DOI: 10.3390/land11081276.
    [6]
    HU Xiaojie, CHEN Zhuokang, MO Luojian, et al. Analysis on forest landscape pattern in Danxia Mountain National Nature Reserve based on remote sensing images [J]. Ecological Science, 2023, 42(2): 155−163.
    [7]
    XIONG Ying, MO Sihao, WU Haipeng, et al. Influence of human activities and climate change on wetland landscape pattern: a review[J/OL]. Science of the Total Environment, 2023, 879: 163112[2025-01-10]. DOI: 10.1016/j.scitotenv.2023.163112.
    [8]
    GUO Mingyan, HOU Yin, HUANG Chuheng, et al. Analysis on the change and driving factors of wetland landscape in Zhuhai City from 1988 to 2018 [J]. Tropical Geomorphology, 2020, 41(2): 1−7.
    [9]
    DENG Longyun, ZHANG Qin, CHENG Yu, et al. Underlying the influencing factors behind the heterogeneous change of urban landscape patterns since 1990: a multiple dimension analysis[J/OL]. Ecological Indicators, 2022, 140: 108967[2025-01-10]. DOI: 10.1016/j.ecolind.2022.108967.
    [10]
    WANG Haiyi, WANG Hongrong, CHEN Shuxin, et al. Dynamic change analysis of vegetation coverage and landscape pattern characteristics in Longquan Mountain urban forest park, Chengdu City [J]. Remote Sensing Technology and Application, 2023, 38(6): 1455−1466.
    [11]
    CHE Tong, LI Cheng, LUO Yunjian. Changes in landscape pattern of built-up land and its driving factors during urban sprawl [J]. Acta Ecologica Sinica, 2020, 40(10): 3283−3294.
    [12]
    LIN Jinda, DUO Linghua, ZOU Zili. Dynamic evolution and spatial autocorrelation analysis of landscape fragmentation under the background of urban expansion: a case study of Nanchang City [J]. Research of Soil and Water Conservation, 2022, 29(4): 362−369.
    [13]
    NIU Haipeng, ZHAO Xiaoming, XIAO Dongyang, et al. Evolution and influencing factors of landscape pattern in the Yellow River Basin (Henan section) due to land use changes[J/OL]. Water, 2022, 14(23): 3872[2025-01-10]. DOI: 10.3390/w14233872.
    [14]
    YANG Junhui, SHI Wenjiao, ZHOU Weiqi, et al. A review on the driving factors and their characteristics in urban landscape pattern changes [J]. Acta Ecologica Sinica, 2024, 44(22): 10486−10498.
    [15]
    SUN Lirong, ZHOU Dongmei, CEN Guozhang, et al. Landscape ecological risk assessment and driving factors of the Shule River Basin based on the geographic detector model [J]. Arid Land Geography, 2021, 44(5): 1384−1395.
    [16]
    WANG Chengwu, YAO Liangjie, WANG Zhoufeng, et al. Landscape ecological risk assessment and driving factors analysis in the Three River Source Region from 2000 to 2020 [J]. Arid Zone Research, 2024, 41(11): 1908−1920.
    [17]
    ZHOU Dongmei, CHEN Cunyou, WANG Mingjia, et al. Gradient and directional differentiation in landscape pattern characteristics of urban ecological space based on optimal spatial scale: a case study in Changsha City, China [J]. Journal of Ecology and Rural Environment, 2022, 38(5): 566−577.
    [18]
    HU Jinyu, ZHANG Jiaxin, LI Yunqin. Exploring the spatial and temporal driving mechanisms of landscape patterns on habitat quality in a city undergoing rapid urbanization based on GTWR and MGWR: the case of Nanjing, China[J/OL]. Ecological Indicators, 2022, 143: 109333[2025-01-10]. DOI: 10.1016/j.ecolind.2022.109333.
    [19]
    LI Keke, ZHOU Zhanhang, WANG Zhen. Analyzing socio-economic spatial factors driving soil erosion in China based on multi-scale geographically weighted regression model [J]. Journal of Huazhong Agricultural University, 2024, 43(6): 29−38.
    [20]
    CAO Jiashuo, DENG Zhengyu, HU Yuandong, et al. Spatial and temporal evolution and driving forces of the landscape pattern in Shennongjia forestry district [J]. Journal of Zhejiang A&F University, 2021, 38(1): 155−164.
    [21]
    WU Genghong, WANG Yiru, LIU Tiedong, et al. Evaluation of landscape pattern evolution and spatial configuration of urban park green space in Haikou City based on SEDMs model [J]. Journal of Zhejiang A&F University, 2023, 40(5): 1093−1101.
    [22]
    XU Hao, LI Wei, LIU Wei, et al. Spatio-temporal evolution of Nanjing’s urban green space pattern and its influencing factors [J]. Journal of Zhejiang A&F University, 2023, 40(2): 407−416.
    [23]
    LI Yu, ZHEN Weina, LUO Bibo, et al. Analyzing spatial–temporal characteristics and influencing mechanisms of landscape changes in the context of comprehensive urban expansion using remote sensing[J/OL]. Remote Sensing, 2024, 16(12): 2113[2025-01-10]. DOI: 10.3390/rs16122113.
    [24]
    SHI Ge, CHEN Chuang, CAO Qingci, et al. Spatiotemporal dynamics and prediction of habitat quality based on land use and cover change in Jiangsu, China[J/OL]. Remote Sensing, 2024, 16(22): 4158[2025-01-10]. DOI: 10.3390/rs16224158.
    [25]
    WANG Jinfeng, XU Chengdong. Geodetector: principle and prospective [J]. Acta Geographica Sinica, 2017, 72(1): 116−134.
    [26]
    RONG Yuejing, LI Kai, GUO Jiawei, et al. Multi-scale spatio-temporal analysis of soil conservation service based on MGWR model: a case of Beijing-Tianjin-Hebei, China[J/OL]. Ecological Indicators, 2022, 139: 108946[2025-01-10]. DOI: 10.1016/j.ecolind.2022.108946.
    [27]
    LI Xiaojian, MA Linbing. Characteristics and influencing factors of farmland conversion to non-agricultural uses in northeast Guangdong Province based on optimal parameter geographic detector [J]. Bulletin of Soil and Water Conservation, 2024, 44(5): 100−112.
    [28]
    ZHANG Ruojing, CHEN Yuehong, ZHANG Xiaoxiang, et al. Spatial-temporal pattern and driving factors of flash flood disasters in Jiangxi Province analyzed by optimal parameters-based geographical detector [J]. Geography and Geo-Information Science, 2021, 37(4): 72−80.
    [29]
    HE Mengzhen, ZHANG Letao, WEI Yiyuan, et al. Landscape pattern vulnerability and its driving forces in different geomorphological divisions in the middle Yellow River [J]. Environmental Science, 2024, 45(6): 3363−3374.
    [30]
    Maidina Ainiwaer, Alimujiang Kasimu. Characteristics of landscape pattern of land use in Korla City based on moving window method [J]. Journal of Northwest Forestry University, 2024, 39(2): 247−255.
    [31]
    MEI Ziyu, ZHANG Yaru, HUANG Xinyan, et al. Ecological risk assessment and its influencing factors of spatial heterogeneity based on ecosystem services in Qinghai Lake Basin [J]. Acta Ecologica Sinica, 2024, 44(12): 4973−4986.
    [32]
    HU Yichuan, AN Rui, YANG Jiaming, et al. Measurement and driving mechanism of land use conflict based on landscape pattern: a case study of Wuhan metropolitan area [J]. Research of Soil and Water Conservation, 2024, 31(6): 354−364.
  • 加载中
通讯作者: 陈斌, bchen63@163.com
  • 1. 

    沈阳化工大学材料科学与工程学院 沈阳 110142

  1. 本站搜索
  2. 百度学术搜索
  3. 万方数据库搜索
  4. CNKI搜索

Figures(7)  / Tables(5)

Article views(340) PDF downloads(24) Cited by()

Related
Proportional views

Spatio-temporal evolution of landscape patterns and their driving factors in Xinhua County based on the POGD-MGWR model

doi: 10.11833/j.issn.2095-0756.20250119

Abstract:   Objective  Analyzing the spatiotemporal dynamics of landscape patterns and their driving factors is critically important for effective regional landscape utilization and ecological environment management.   Method  This study, based on land use data, quantitatively assessed the dynamic changes in landscape patterns of Xinhua County, Hunan Province, from 2000 to 2020 using a landscape type transition matrix and landscape index. Furthermore, the study employed a coupled model integrating the parameter-optimized geographical detector (POGD) and multiscale geographically weighted regression (MGWR) to analyze the impacts of natural and socio-economic factors on the landscape patterns.   Result  (1) From 2000 to 2020, cultivated land area in Xinhua County showed a continuous decline, whereas construction land expanded significantly. The transition intensity of landscape types was most pronounced during 2015–2020, indicating more frequent and complex conversions among landscape types. (2) At the landscape type level, the dominance index of forestland patches increased steadily, while that of cultivated land decreased. Fragmentation, edge complexity, and shape irregularity intensified for cultivated land, forestland, and construction land. At the overall landscape level, the pattern became more complex, with an increase in patch number, a decline in connectivity, and a gradual enhancement in landscape diversity. (3) Normalized difference vegetation index (NDVI), population size, and elevation were the main driving factors influencing the landscape pattern. The interactive effects between natural and anthropogenic factors were significantly stronger than the effects of single factors. The impacts of NDVI and slope on landscape pattern exhibit pronounced spatial heterogeneity, with NDVI exerting a negative impact on landscape pattern in most areas, while slope shows a coexistence of both positive and negative effects across space.   Conclusion  The overall landscape pattern of Xinhua County shows a trend of fragmentation, with increased heterogeneity and complex patch morphology. The changes in this landscape pattern are mainly driven by a combination of natural and social factors. [Ch, 7 fig. 5 tab. 32 ref.]

WANG Yamin, CHEN Caihong, SHE Jiyun. Spatio-temporal evolution of landscape patterns and their driving factors in Xinhua County based on the POGD-MGWR model[J]. Journal of Zhejiang A&F University, 2025, 42(6): 1273−1284 doi:  10.11833/j.issn.2095-0756.20250119
Citation: WANG Yamin, CHEN Caihong, SHE Jiyun. Spatio-temporal evolution of landscape patterns and their driving factors in Xinhua County based on the POGD-MGWR model[J]. Journal of Zhejiang A&F University, 2025, 42(6): 1273−1284 doi:  10.11833/j.issn.2095-0756.20250119
  • 全球化和城市化加剧了人类活动对土地利用和景观格局的干扰,进而导致生态系统服务功能发生显著变化,给区域可持续发展带来了严峻的挑战。景观生态学作为研究生态系统时空格局的核心学科,在土地利用研究中至关重要。分析景观格局的时空演变及其驱动因素,有助于理解人类活动与生态系统的相互作用。

    景观格局是指景观中不同组分在空间上的分布和排列特征,反映了景观结构的复杂性与异质性,是理解生态系统功能与过程的重要基础[12]。近年来,随着地理信息系统(GIS)和遥感(RS)技术的广泛应用,景观格局的量化研究取得了显著进展[35]。研究者利用景观指数、斑块分析等方法,从空间和时间维度上刻画了景观格局的动态变化特征。这些研究聚焦于森林[6]、湿地[78]和城市化区域[910]等不同类型景观,揭示了土地利用变化对景观结构及其生态功能的深远影响。现有研究多聚焦局部尺度或单一时间段,对跨尺度、长时间序列的景观格局演变缺乏全面认识。驱动因素主要包括自然因素和人类活动:自然因素(如地形、气候、土壤)决定景观格局的基本分布,而人类活动(如城市扩张、农业开发、基础设施建设)是近年景观格局变化的主要驱动力[1112]。近年来,研究者通过构建统计模型、地理探测器和机器学习等方法,从多尺度分析自然和社会经济因子对景观格局的驱动作用[1314]。景观格局驱动因子研究是揭示人地关系与生态过程耦合机制的重要途径。传统地理探测器方法在识别驱动因子时,常因参数选择的主观性(如离散化方法与空间尺度依赖经验判断)导致结果稳定性不足[15],而地理加权回归(GWR)模型虽能捕捉空间异质性,却难以处理多尺度驱动力的非线性效应。针对上述问题,参数最优地理探测器(POGD)通过自动优化离散化参数与空间尺度,显著提升了驱动因子解释力的量化精度[1617];多尺度地理加权回归(MGWR)则通过引入变量特异性带宽,解决了传统地理加权回归模型单一尺度建模的局限性[1819]。两者耦合可兼顾因子识别与空间异质性解析,为驱动机制研究提供了多维视角。

    县域作为国家生态环境治理与城镇化优化的核心单元,其景观格局演变对生态安全格局构建具有示范价值。湖南省新化县地处湘中丘陵向雪峰山脉生态过渡带,属亚热带季风气候区,地形破碎度高且土地利用类型多样,是南方丘陵山地生态脆弱区典型代表,且面临城镇化快速扩张与退耕还林政策叠加的双重影响,景观破碎化与生态功能退化问题突出。研究县域景观格局时空演变可为同类型县域提供空间异质性驱动的普适性范式。

    综上分析,本研究以湖南省新化县为研究区,结合土地利用数据和GIS,分析景观格局时空演变的规律,并采用POGD-MGWR耦合模型,从自然因素和社会因素2个方面探究景观格局时空变化的主要驱动因子,并通过量化因子交互作用与空间尺度效应,揭示多层级驱动机制,旨在为县域生态保护与国土空间优化提供参考。

    • 新化县(27°31′~28°14′N,110°45′~111°41′E)位于湖南省娄底市,县域面积为3 616.16 km2。土地总面积为356 713.33 hm2,其中:耕地面积为48 453.33 hm2,林地面积为190 720.00 hm2,可垦面积为16 973.33 hm2,宜林面积为7 653.33 hm2,河流面积为23 753.33 hm2,茶果面积为4 033.33 hm2,其他面积为65 126.67 hm2。地貌属山丘盆地,西部、北部雪峰山主脉耸峙;东部低山或深丘连绵;南部为天龙山、桐凤山环绕;中部为资水及其支流河谷。整个新化县位于亚热带中部,典型的地带性土壤为红壤。

    • 土地利用数据(2000、2005、2010、2015、2020年)、国内生产总值(GDP)、人口数量及归一化植被指数(NDVI)来自中国科学院资源环境科学数据中心(https://www.resdc.cn/),气象数据(平均风速和日照)来自国家地球系统科学数据中心(https://www.geodata.cn/),年平均降水量和年平均气温数据来自国家青藏高原数据科学中心(https://data.tpdc.ac.cn/),高程数据基于数字高程模型(DEM)提取于地理空间数据云(https://www.gscloud.cn/),坡度数据提取于DEM。以上所有数据均统一为30 m×30 m的栅格数据,并将坐标系重新投影到WGS_1984_Albers上。

    • 为了研究新化县景观类型的面积变化和类型转移,本研究利用景观类型转移矩阵[20]对新化县各景观类型的净转化量进行计算分析,用于衡量新化县景观类型的动态变化过程。为直观展示各类景观类型在不同年份间的相互转化关系,本研究引入桑基图对土地利用转移过程进行可视化表达。

    • 景观格局指数能表征景观数量、形状、破碎度和多样性等属性[2122]。为研究新化县不同景观类型时空变化特征和规律,本研究选取10个景观格局指数,分别为斑块数量(NP)、边缘密度(ED)、景观形状指数(LSI)、斑块密度(PD)、最大斑块指数(LPI)、聚合度(AI)、香农多样性(SHDI)、蔓延度指数(CONTAG)、连通度指数(COHESION)、景观分割度(DIVISION)。利用Fragstats 4.2计算2000—2020年5期景观格局指数。各景观格局指数计算公式参考相关文献[2324]。

    • 地理探测器是一种用于分析空间差异及其驱动因素的统计模型[25]。最优参数地理探测器(POGD)通过优化空间尺度和离散化方法进一步提升了分析精度。在优化参数的基础上,通过单因子和交互探测评估单因素及其组合对景观格局变化的解释力(q),q越大解释力越强。交互作用探测用于分析不同影响因子共同作用时对因变量(Y)解释力的增强或减弱程度。判断方法和类型如表1所示。

      判据依据 类型
      q(X1X2)<min[q(X1), q(X2)] 非线性减弱
      min[q(X1), q(X2)]<q(X1X2)<Max[q(X1), q(X2)] 单因子非线性减弱
      q(X1X2)>max[q(X1), q(X2)] 双因子增强
      q(X1X2)= q(X1)+q(X2) 独立
      q(X1X2)>q(X1)+q(X2) 非线性增强
        说明:q表示单因素及其组合对景观格局变化的解释力。X1X2表示2种不同的驱动因子。

      Table 1.  Types of two-factor interaction result

    • 多尺度地理加权回归模型(MGWR)用于揭示空间非平稳性和多尺度因子的影响,通过局部回归与变量带宽优化,量化各驱动因子对空间变量的影响程度及其地理尺度差异。作为地理加权回归的扩展,MGWR允许根据空间数据异质性动态调整带宽,能够同时反映全球性、区域性和局部性的空间关系[26]。这一特性使其特别适合研究多因素交互作用下的景观格局变化问题。计算公式如下:

      其中:$ {y}_{i} $代表空间上$ i $点的因变量,$ p $为自变量总数,$ \left({\mu }_{i},{v}_{i}\right) $为第$ i $个研究单元的地理中心坐标,$ {x}_{i,k} $表示研究单元$ i $的自变量k的解释值,$ {\beta }_{{b},k}\left({\mu }_{i},{v}_{i}\right) $表示经过有效带宽校正后带宽为$ {b}_{w} $时解释变量k的回归参数,$ {\beta }_{0}\left({\mu }_{i},{v}_{i}\right) $表示研究单元$ i $处的截距,$ {\varepsilon }_{i} $表示随机误差项。

      根据新化县自身形成特点,结合相关理论分析,从自然环境条件和社会经济状况2个方面对新化县景观变化驱动因子进行筛选。选取景观多样性指数(Y)为因变量,高程(X1)、坡度(X2)、年平均降水量(X3)、年平均气温(X4)、日照时数(X5)、风速(X6)、归一化植被指数(X7)、土壤类型(X8)、人口数量(X9)、GDP (X10)为自变量,分析各因子对于景观格局演变的影响机制。

    • 图1所示:2000—2020年研究区主要景观类型为林地和耕地,整体占比分别超过65%和30%。草地、水体和建设用地面积较小,整体占比低于5%。从变化趋势来看,耕地面积持续减少,林地面积先增后减,建设用地持续增加,草地和水域变化微小。林地主要分布在西部、南部和北部地区,耕地主要分布在中东部和水体横跨县域,建设用地分布在东部地区。林地分布广泛,在新化县的西部、南部和北部形成集群。耕地主要分布在中部及东部地区,呈分散分布。建设用地在东部以南地区具有明显的聚集特征。

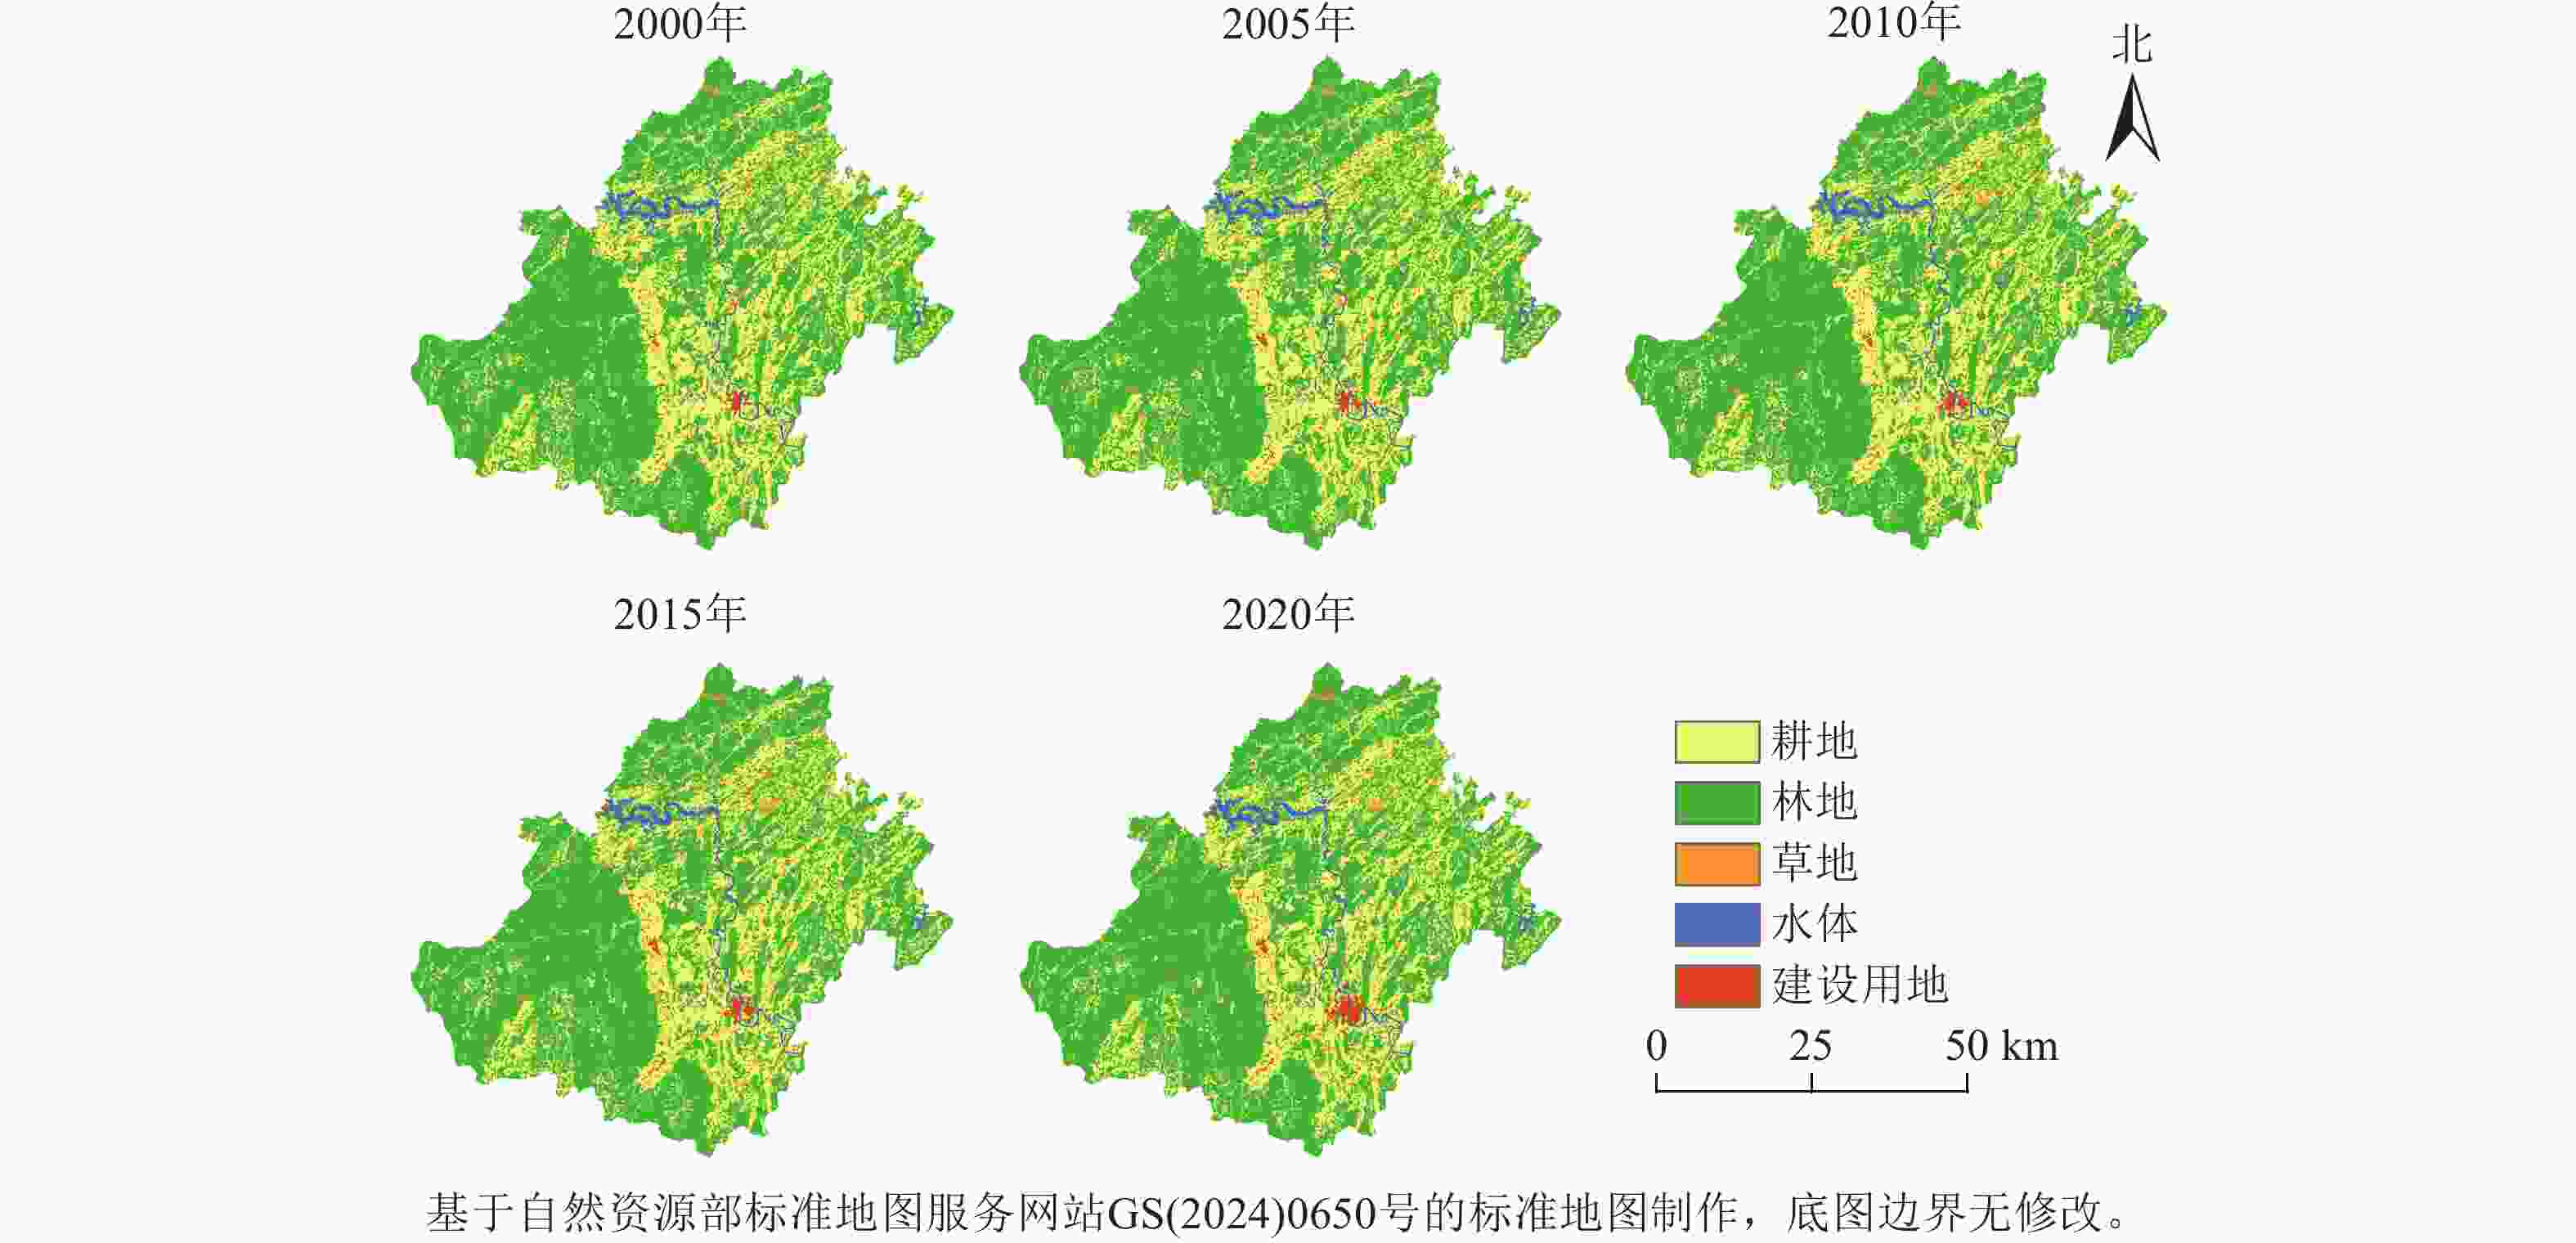
      Figure 1.  Spatial distribution map of landscape types in Xinhua County
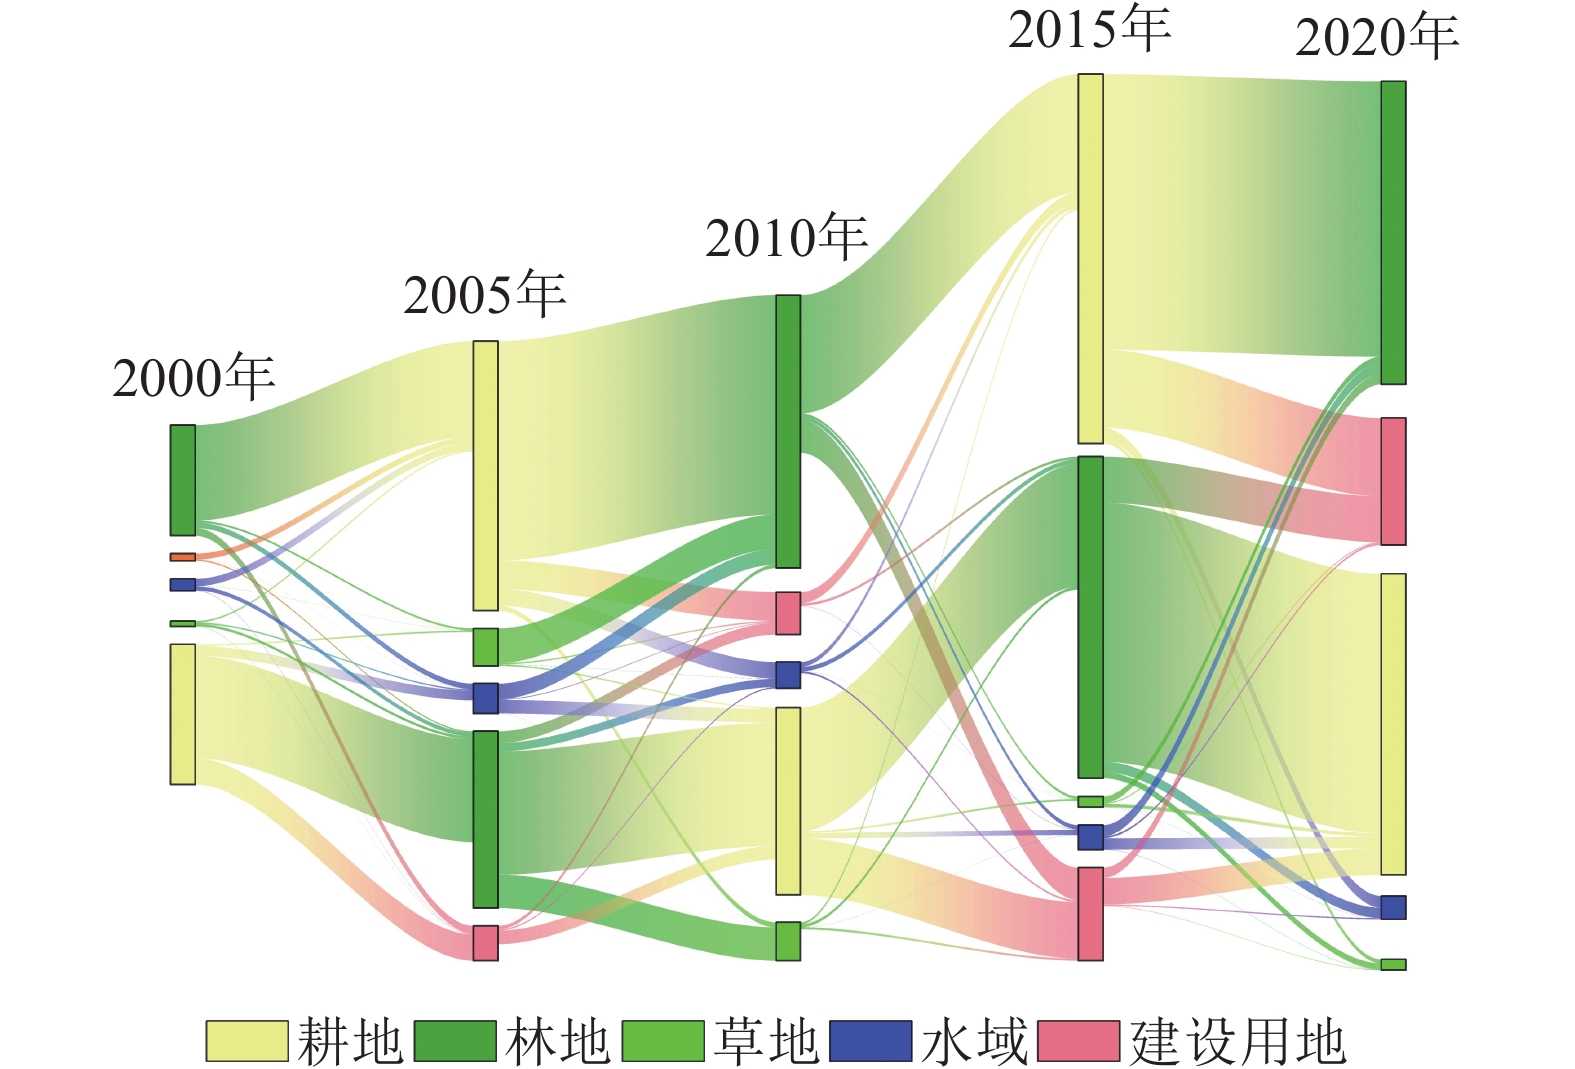
    • 图2可知:2000—2020年,新化县景观类型发生变化,耕地转化为林地、草地、水域和建设用地,主要贡献来自林地、水域和建设用地。林地扩张主要来自耕地。建设用地扩张主要来源于耕地和林地。研究期内2015—2020年景观类型转移强度高于其他阶段,且转化更加复杂。

      Figure 2.  Sankey diagram of landscape type transition matrix for Xinhua County from 2000 to 2020
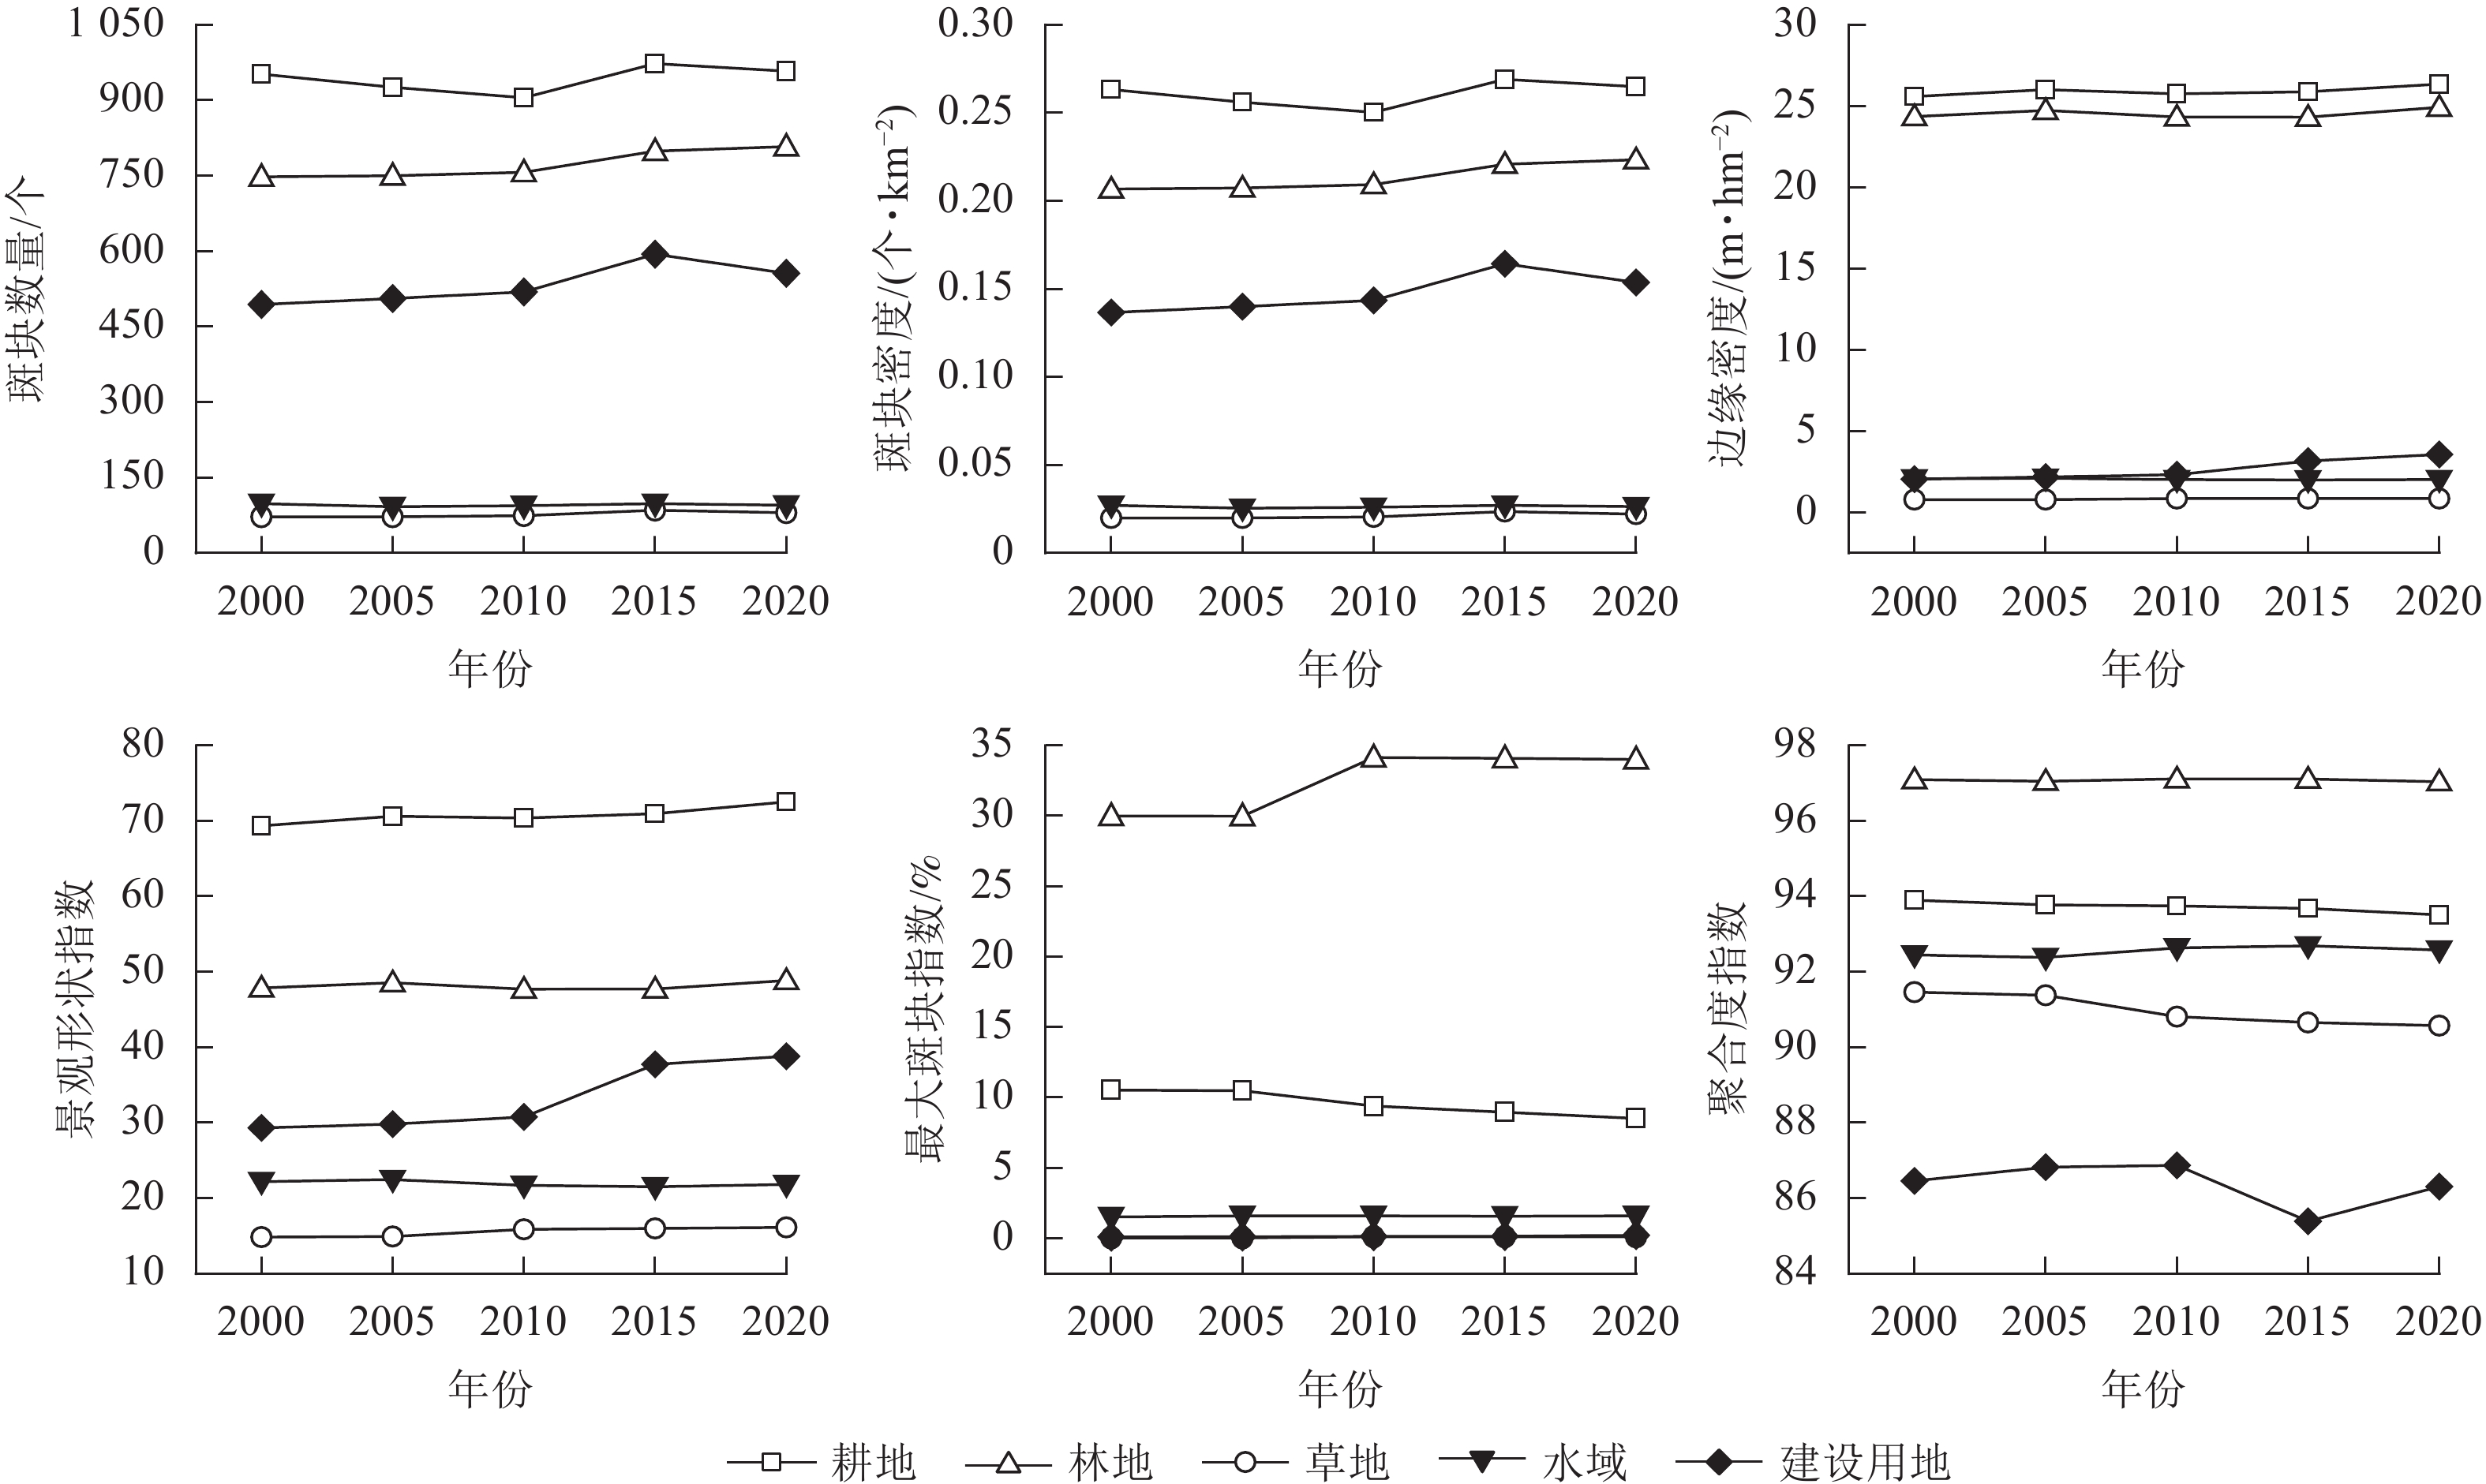
    • 图3可知:研究期间耕地的斑块数量和斑块密度先减后增,表明近年来耕地破碎化加剧。林地的斑块数量和斑块密度增加,说明其异质性和破碎化增强;耕地最大斑块指数减少、林地的增加,表明林地优势度上升。耕地和林地的边缘密度和形状指数整体上升,聚合度下降。建设用地的斑块数量和斑块密度整体先增后减,边缘密度、形状指数和最大斑块指数持续增加,聚合度呈先增后减趋势。草地和水域各景观指数变化不明显。

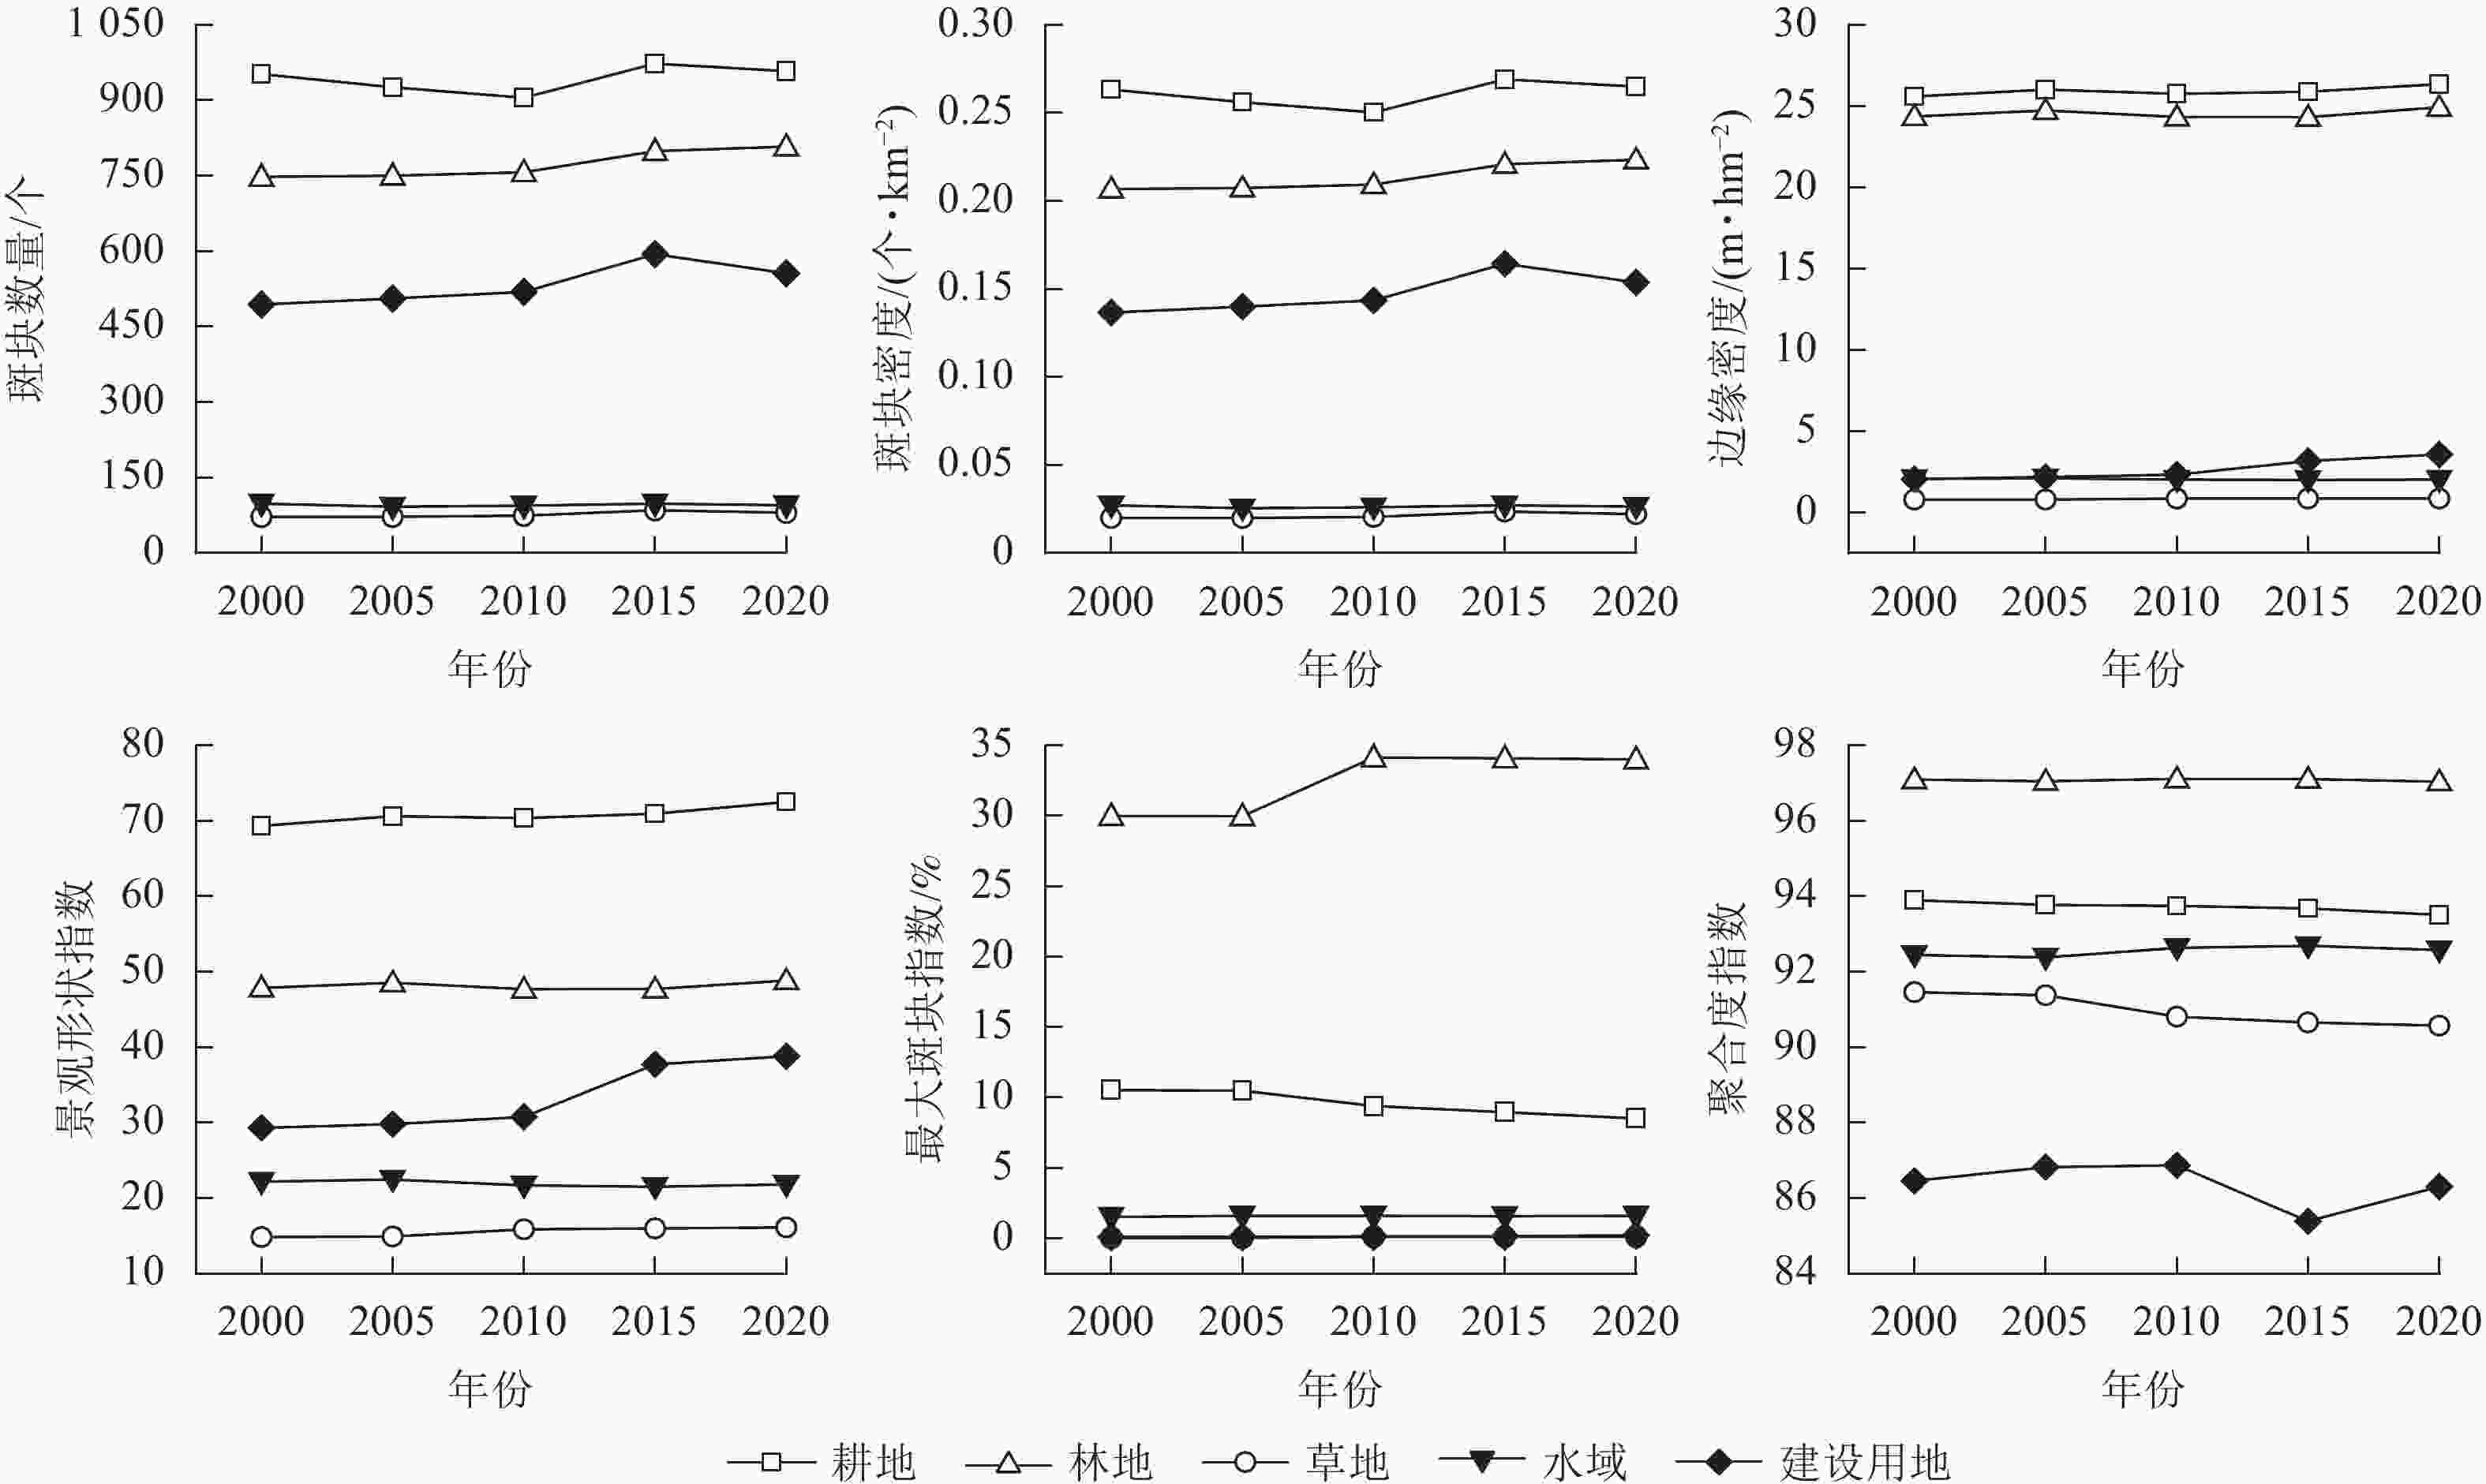
      Figure 3.  Changes in landscape pattern indices at the class level

    • 表2可知:2000—2015年,研究区的斑块数量和斑块密度增加,表明景观破碎化程度降低;但2015年后两者均下降,说明破碎化加剧。研究时段内,边缘密度和景观形状指数持续上升,反映景观边缘形状愈发复杂,斑块形态不规则化加剧。研究区蔓延度指数下降表明斑块分散化趋势增强;连通度指数先增后减,景观分割度先减后增,表明2010年后景观破碎度化导致景观连通性降低、分割度增加;香农多样性指数上升表明景观多样性增强,景观结构更复杂且异质性提升;聚合度整体下降,表明景观空间聚集性减弱,斑块分布更分散。

      年份 NP/个 PD/(个·km−2) ED/(m·hm−2) LSI CONTAG COHESON DIVISION SHDI AI
      2000 2 364 0.654 27.421 43.572 69.264 99.763 0.878 0.804 95.849
      2005 2 346 0.649 27.904 44.293 69.067 99.766 0.878 0.808 95.777
      2010 2 349 0.650 27.637 43.892 69.102 99.779 0.855 0.808 95.817
      2015 2 549 0.705 28.105 44.594 68.694 99.770 0.856 0.817 95.748
      2020 2 497 0.691 28.862 45.733 68.240 99.768 0.858 0.827 95.634
        说明:NP. 斑块数量;PD. 斑块密度;ED. 边缘密度;LSI. 景观形状指数;CONTAG. 蔓延度指数;COHESION. 连通度指数;DIVISION. 景观分割度;SHDI. 香农多样性;AI. 聚合度。

      Table 2.  Landscape-level index changes in Xinhua County from 2000 to 2020

      图4可知:景观多样性和破碎化的空间分布随时间变化不大。西部、北部和南部地区以山地为主,海拔较高,人为干扰少,林地为主,最大斑块指数和聚合度高,景观分割度和香农多样性指数低,景观完整度高、破碎度低。中部和东部地势平坦,人类活动频繁,城镇发展快,大面积耕地开垦,导致最大斑块指数和聚合度低,景观分割度和香农多样性指数高,景观破碎度较高。

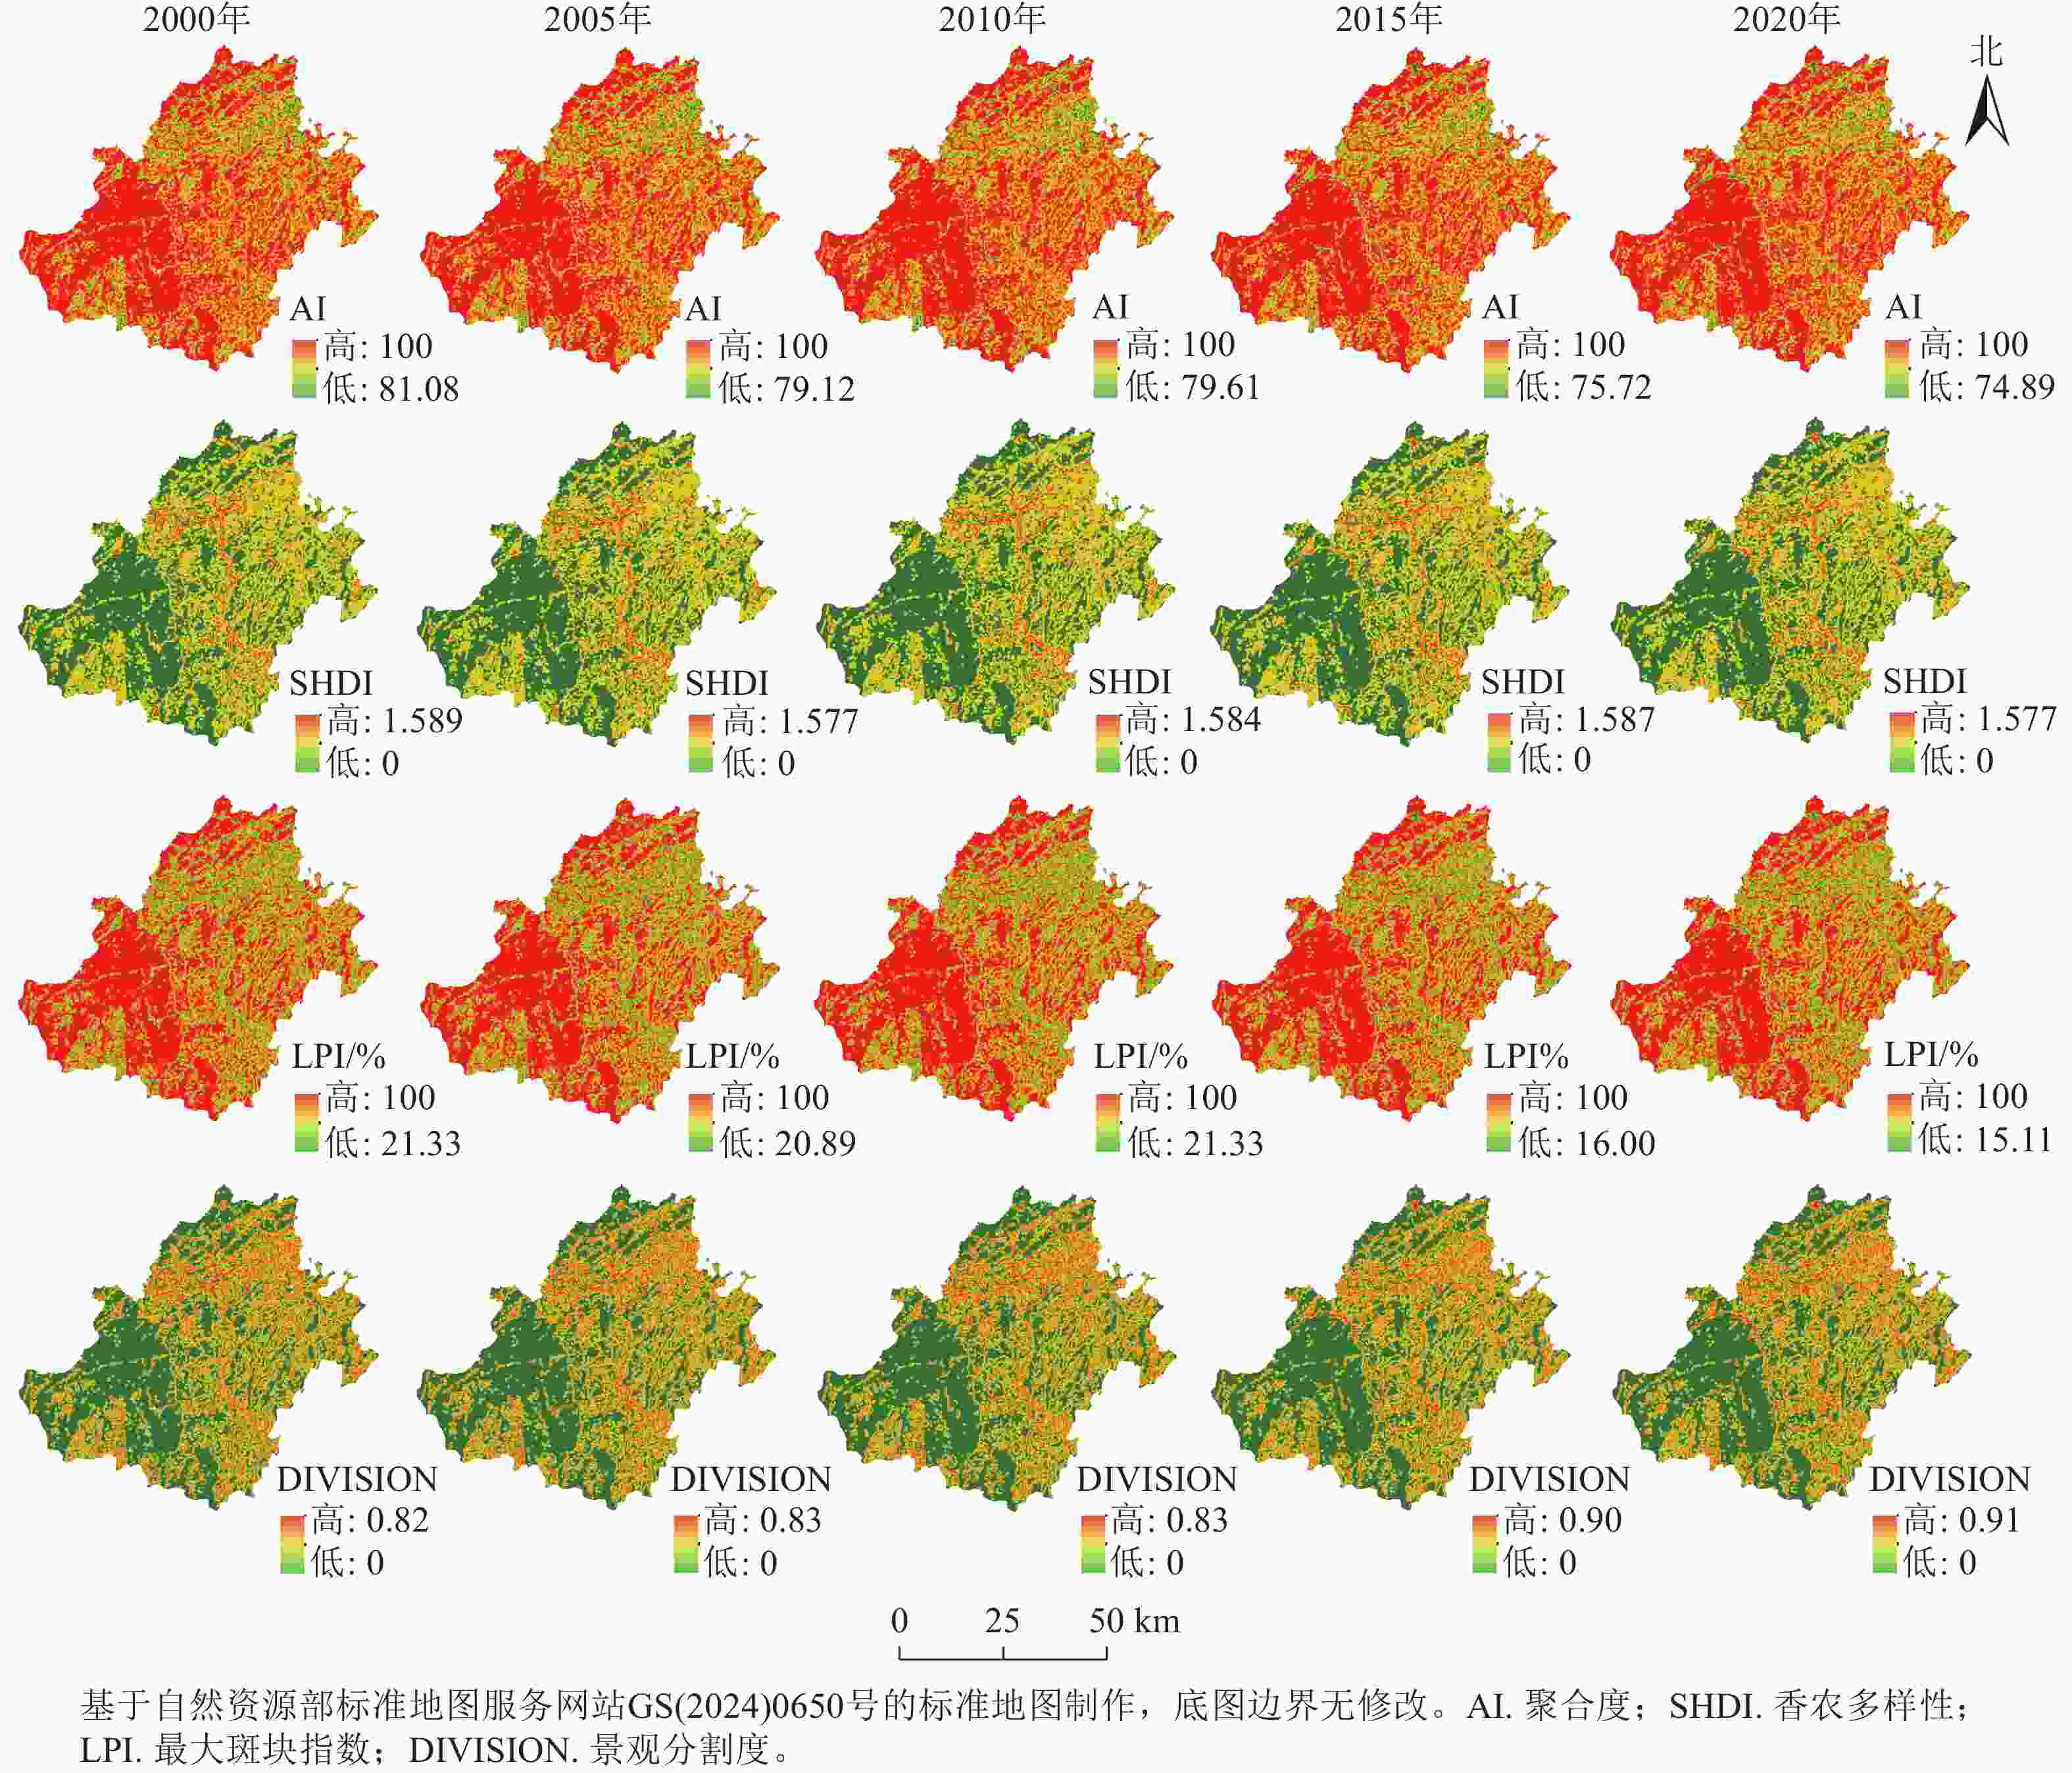
      Figure 4.  Spatial distribution map of landscape diversity and fragmentation in Xinhua County

    • 以2000、2005、2010、2015和2020年景观多样性指数为因变量,10个影响因素为自变量,综合考虑研究区大小、计算效率和探测结果的优化,确定渔网单元大小为2.5 km×2.5 km。数据分析前通过R语言清洗数据,去除异常值后导入GD包进行参数最优地理探测器分析。根据研究区特点和参考文献[2728]将自变量离散类别范围设为4~9类,并从5种离散化方法中选择最优q值。其中,土壤类型(X8)为非连续数据,无需离散化处理。以2020年的自变量离散类别优选过程为例(图5),不同离散方法和类别数量对q值影响较大,说明参数优选非常必要。例如,对于归一化植被指数(X7),分位数分类法的q值明显优于其他方法,并在9类时q达到最大值(0.188),因此,选择该方法和类别数可实现最大q值。其余因子的优选过程类似,通过遍历所有分类方法,确定最优q值,并最终选出各驱动因子的合理离散方法和类别数,如表3所示。

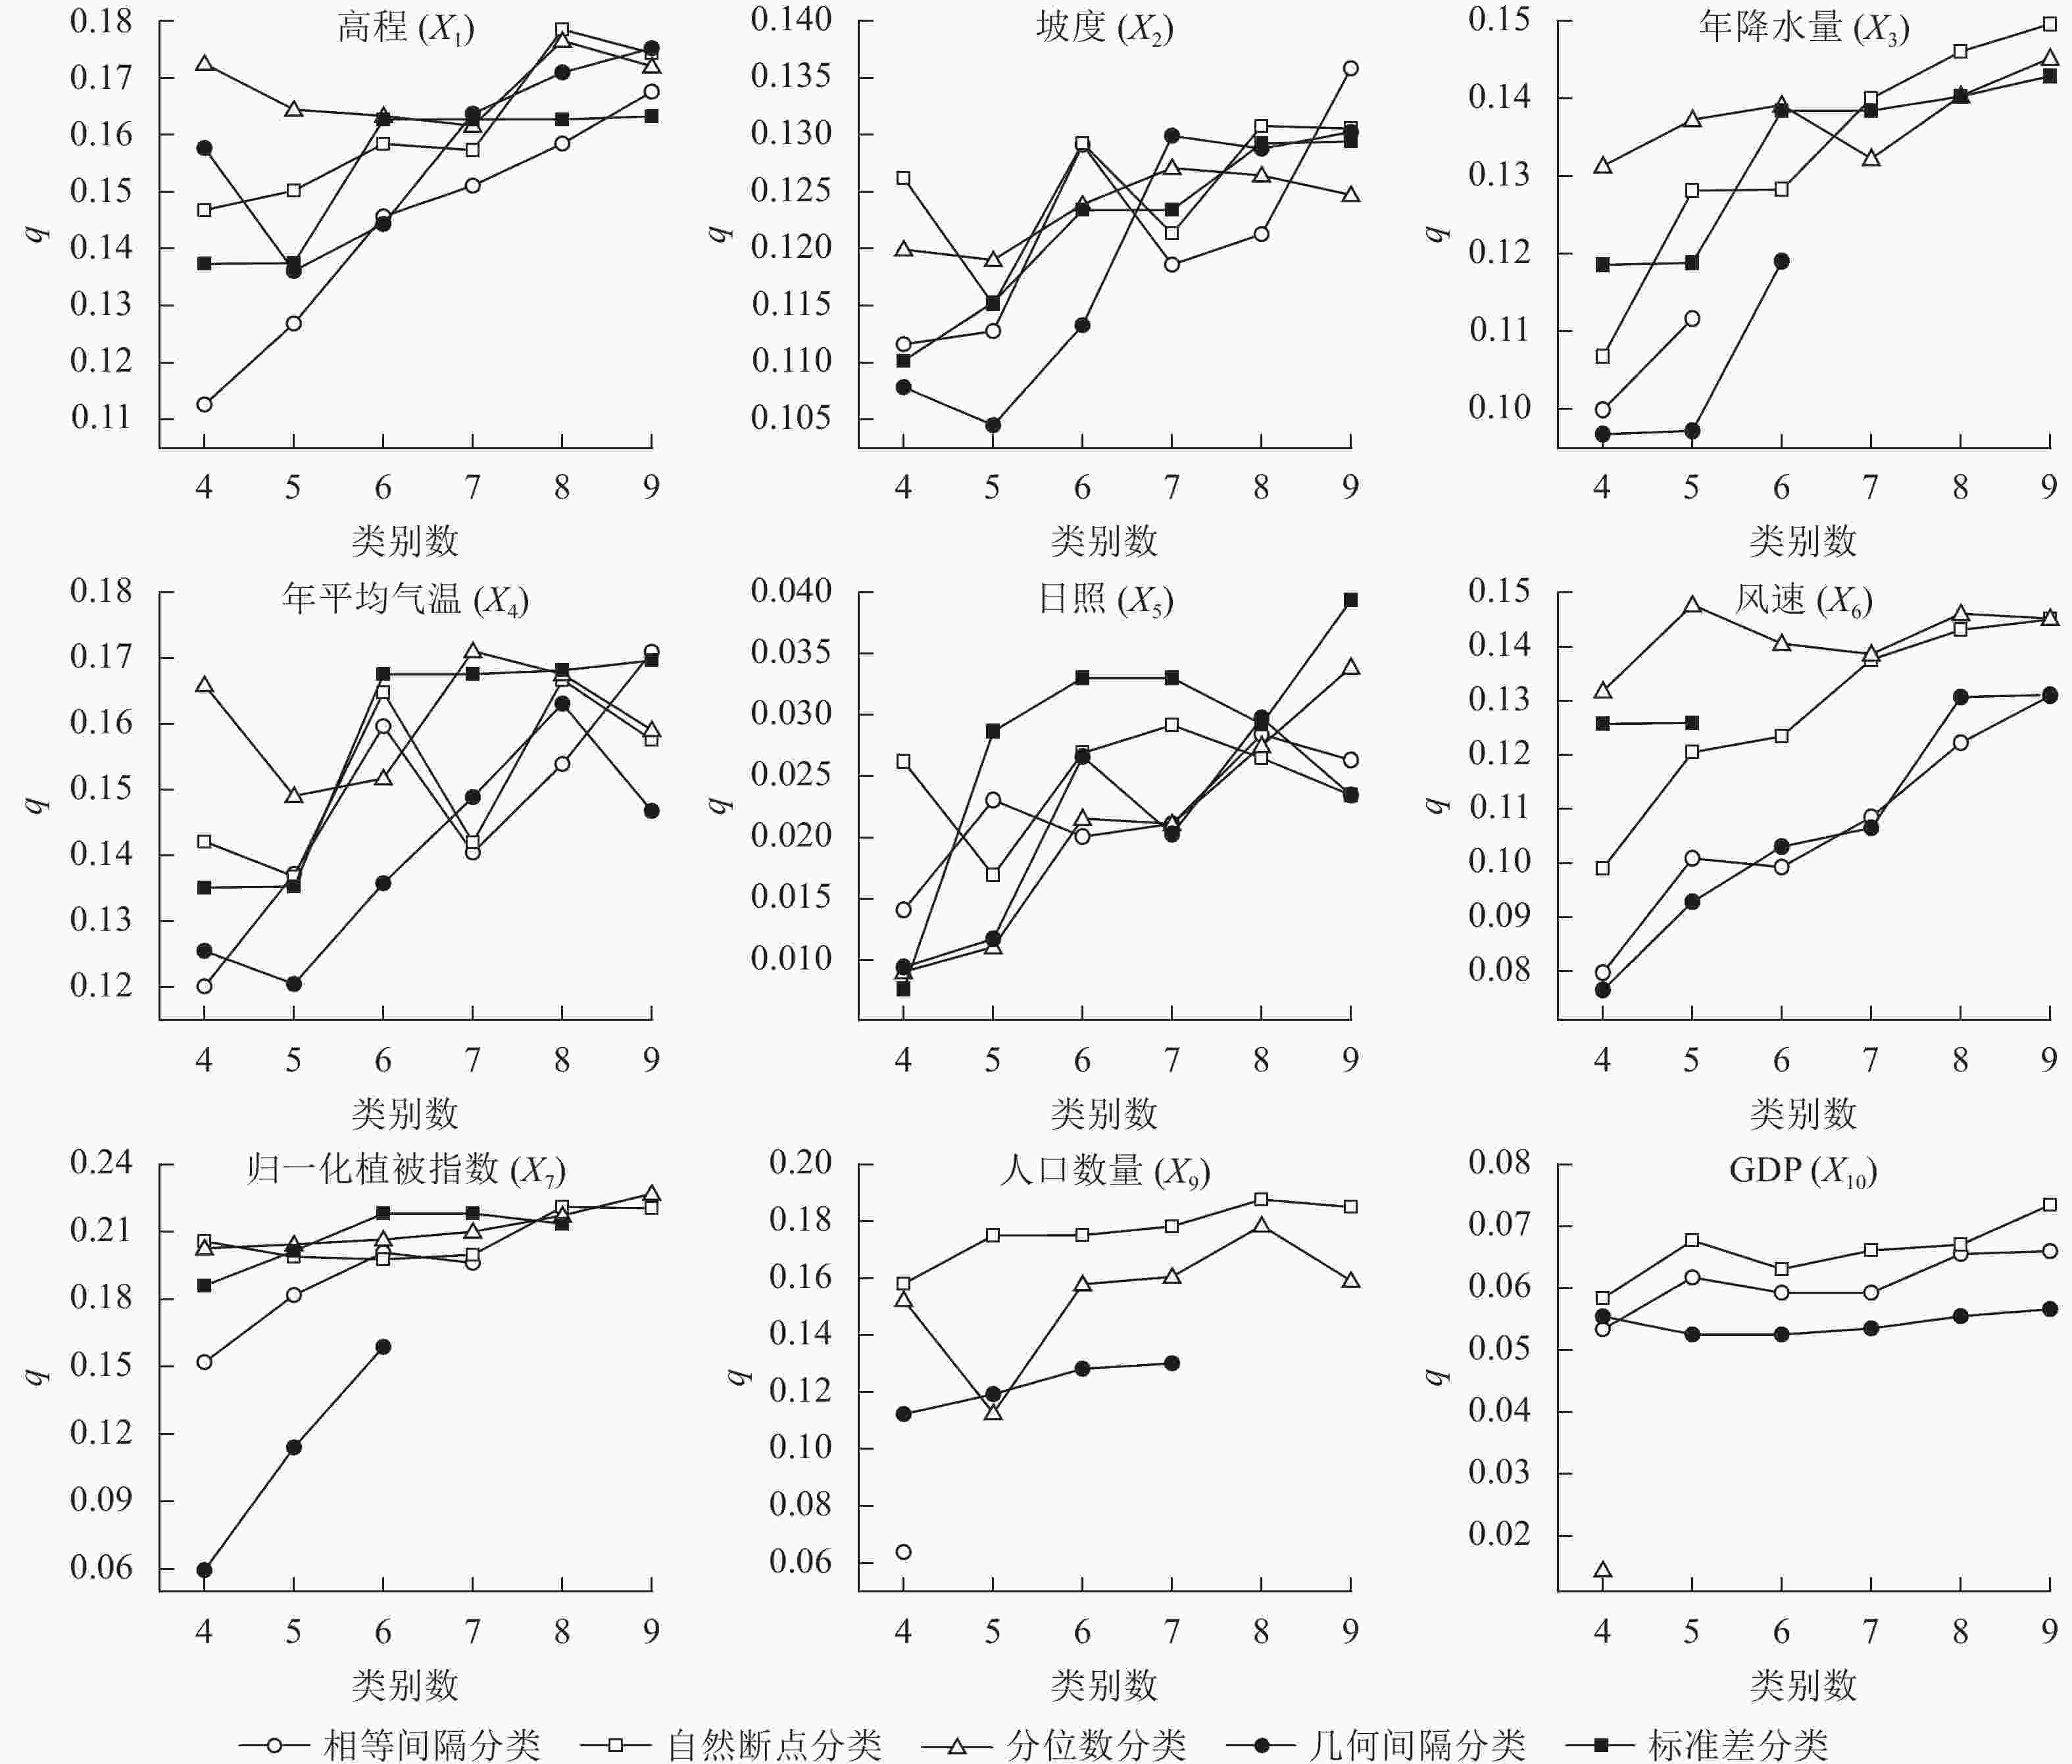
      Figure 5.  Statistical results of explanatory power (q) under different discretization methods and category numbers in 2020

      因子 合理离散法 合理类别数
      高程 (X1) 自然断点 8
      坡度 (X2) 相等间隔法 9
      年平均降水量 (X3) 自然断点 9
      年平均气温 (X4) 分位数法 7
      日照时数 (X5) 标准差法 9
      风速 (X6) 分位数法 5
      NDVI (X7) 分位数法 9
      人口数量 (X9) 分位数法 8
      GDP (X10) 分位数法 9

      Table 3.  Optimal discretization methods and classification criteria for each driving factor

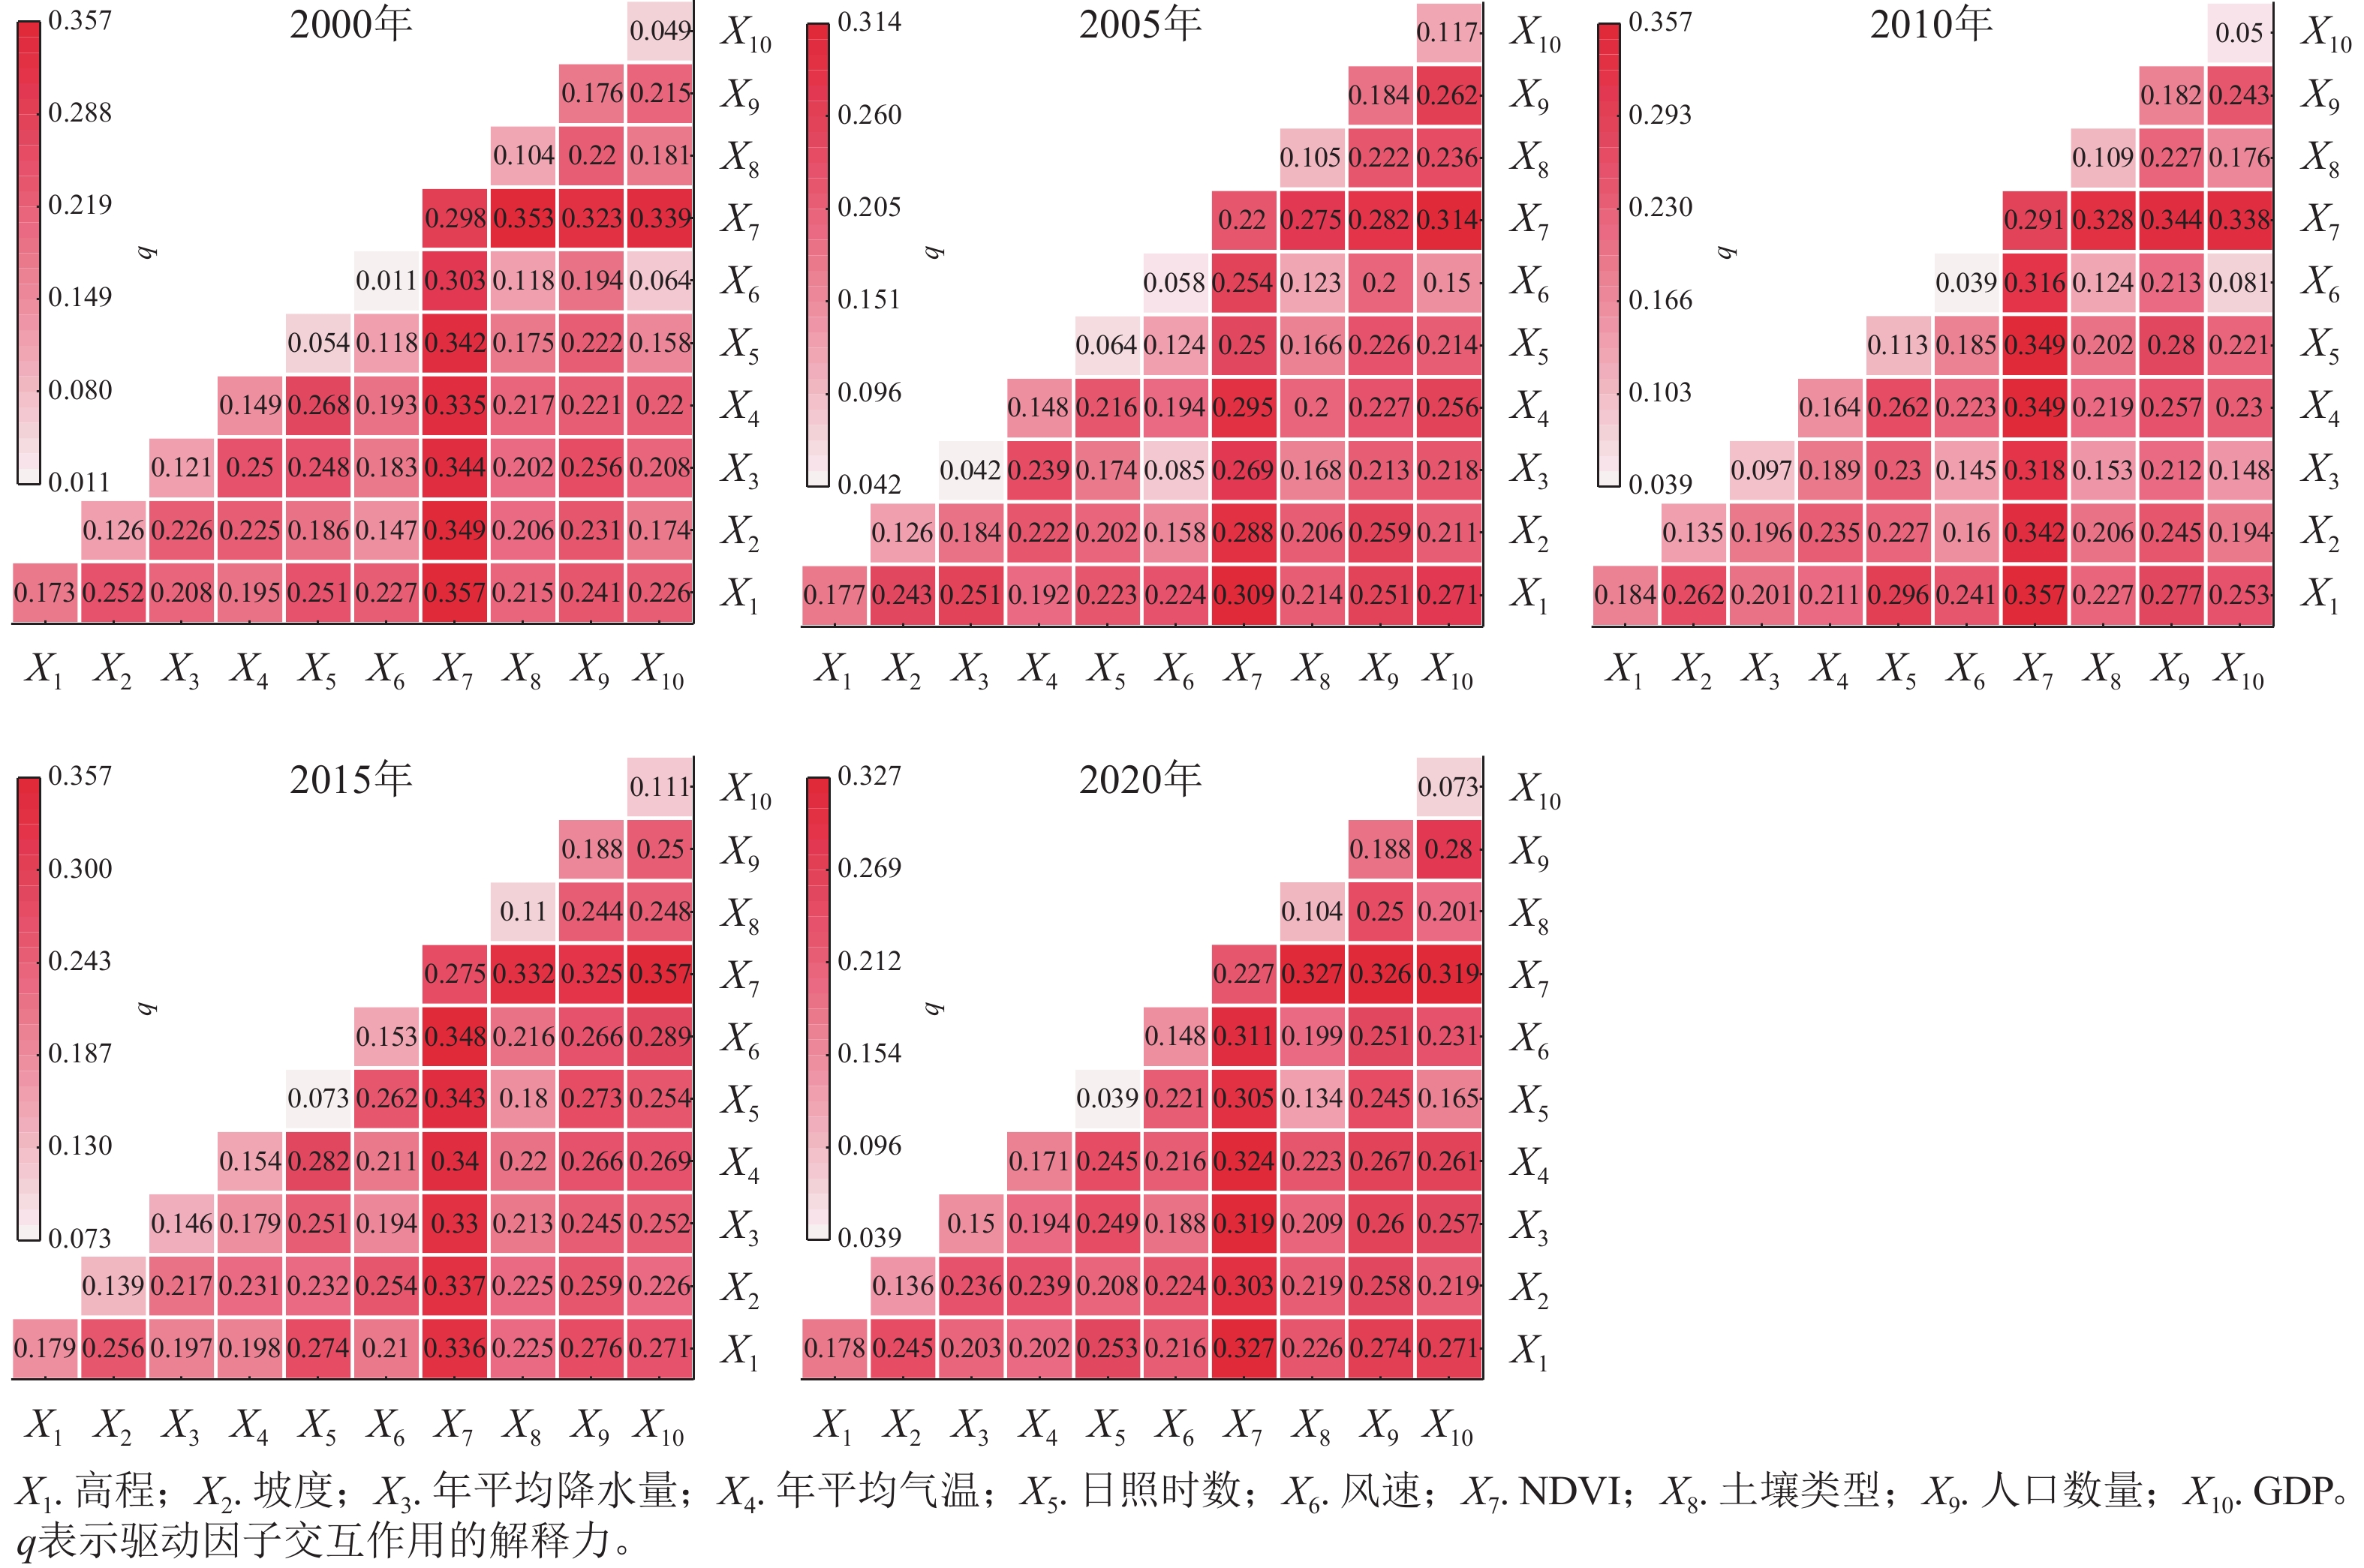
    • 在使用POGD模型分析驱动因子时,显著性检验是验证探测结果可靠性的重要步骤。由表4可知:10个驱动因子均通过显著性检验(P<0.05),但解释力度存在差异。其中,NDVI的解释力最大,对景观格局的解释力最强;高程、人口数量、年平均气温、坡度也具有较高的解释度。人口数量对景观多样性的影响超过地形和气候因素,且解释力从0.176 (2000年)增至0.188 (2020年),表明人类活动对景观格局的影响持续增强。与此同时,GDP的解释力逐步上升,反映出经济发展对景观变化的影响日益显著。

      年份 自然因子解释力(q) 社会经济因子解释力(q)
      X1 X2 X3 X4 X5 X6 X7 X8 X9 X10
      2000 0.173** 0.126** 0.121** 0.149** 0.054** 0.011* 0.298** 0.104** 0.176** 0.049**
      2005 0.177** 0.126** 0.042** 0.148** 0.064** 0.058** 0.220** 0.105** 0.184** 0.117**
      2010 0.184** 0.135** 0.097** 0.164** 0.113** 0.039** 0.291** 0.109** 0.182** 0.050**
      2015 0.179** 0.139** 0.146** 0.154** 0.073** 0.153** 0.275** 0.110** 0.188** 0.111**
      2020 0.178** 0.136** 0.150** 0.171** 0.039** 0.148** 0.227** 0.104** 0.188** 0.073**
        说明:X1. 高程;X2. 坡度;X3. 年平均降水量;X4. 年平均气温;X5. 日照时数;X6. 风速;X7. NDVI;X8. 土壤类型;X9. 人口数量;X10. GDP。*表示驱动因子具有显著解释力(P<0.05);**表示驱动因子具有极显著解释力(P<0.01)。

      Table 4.  Results of factor detection analysis

    • 图6可知:2000、2010和2020年,NDVI与高程的交互作用对景观格局变化影响最强,q分别为0.357、0.357和0.327;而在2005和2015年,NDVI与GDP的交互作用最强,q分别为0.314和0.357。NDVI在所有年份的交互探测中均为强影响因子。不同年份中,各驱动因子对景观格局变化表现出协同增强特征,即任意2个因子的交互作用均强于单一因子的影响,主要为双因子增强和非线性增强。其中,日照时数和GDP单独作用影响较小,但与其他因子交互后,多表现为非线性增强,明显提升了解释力度,说明研究格局变化受多因子共同驱动。

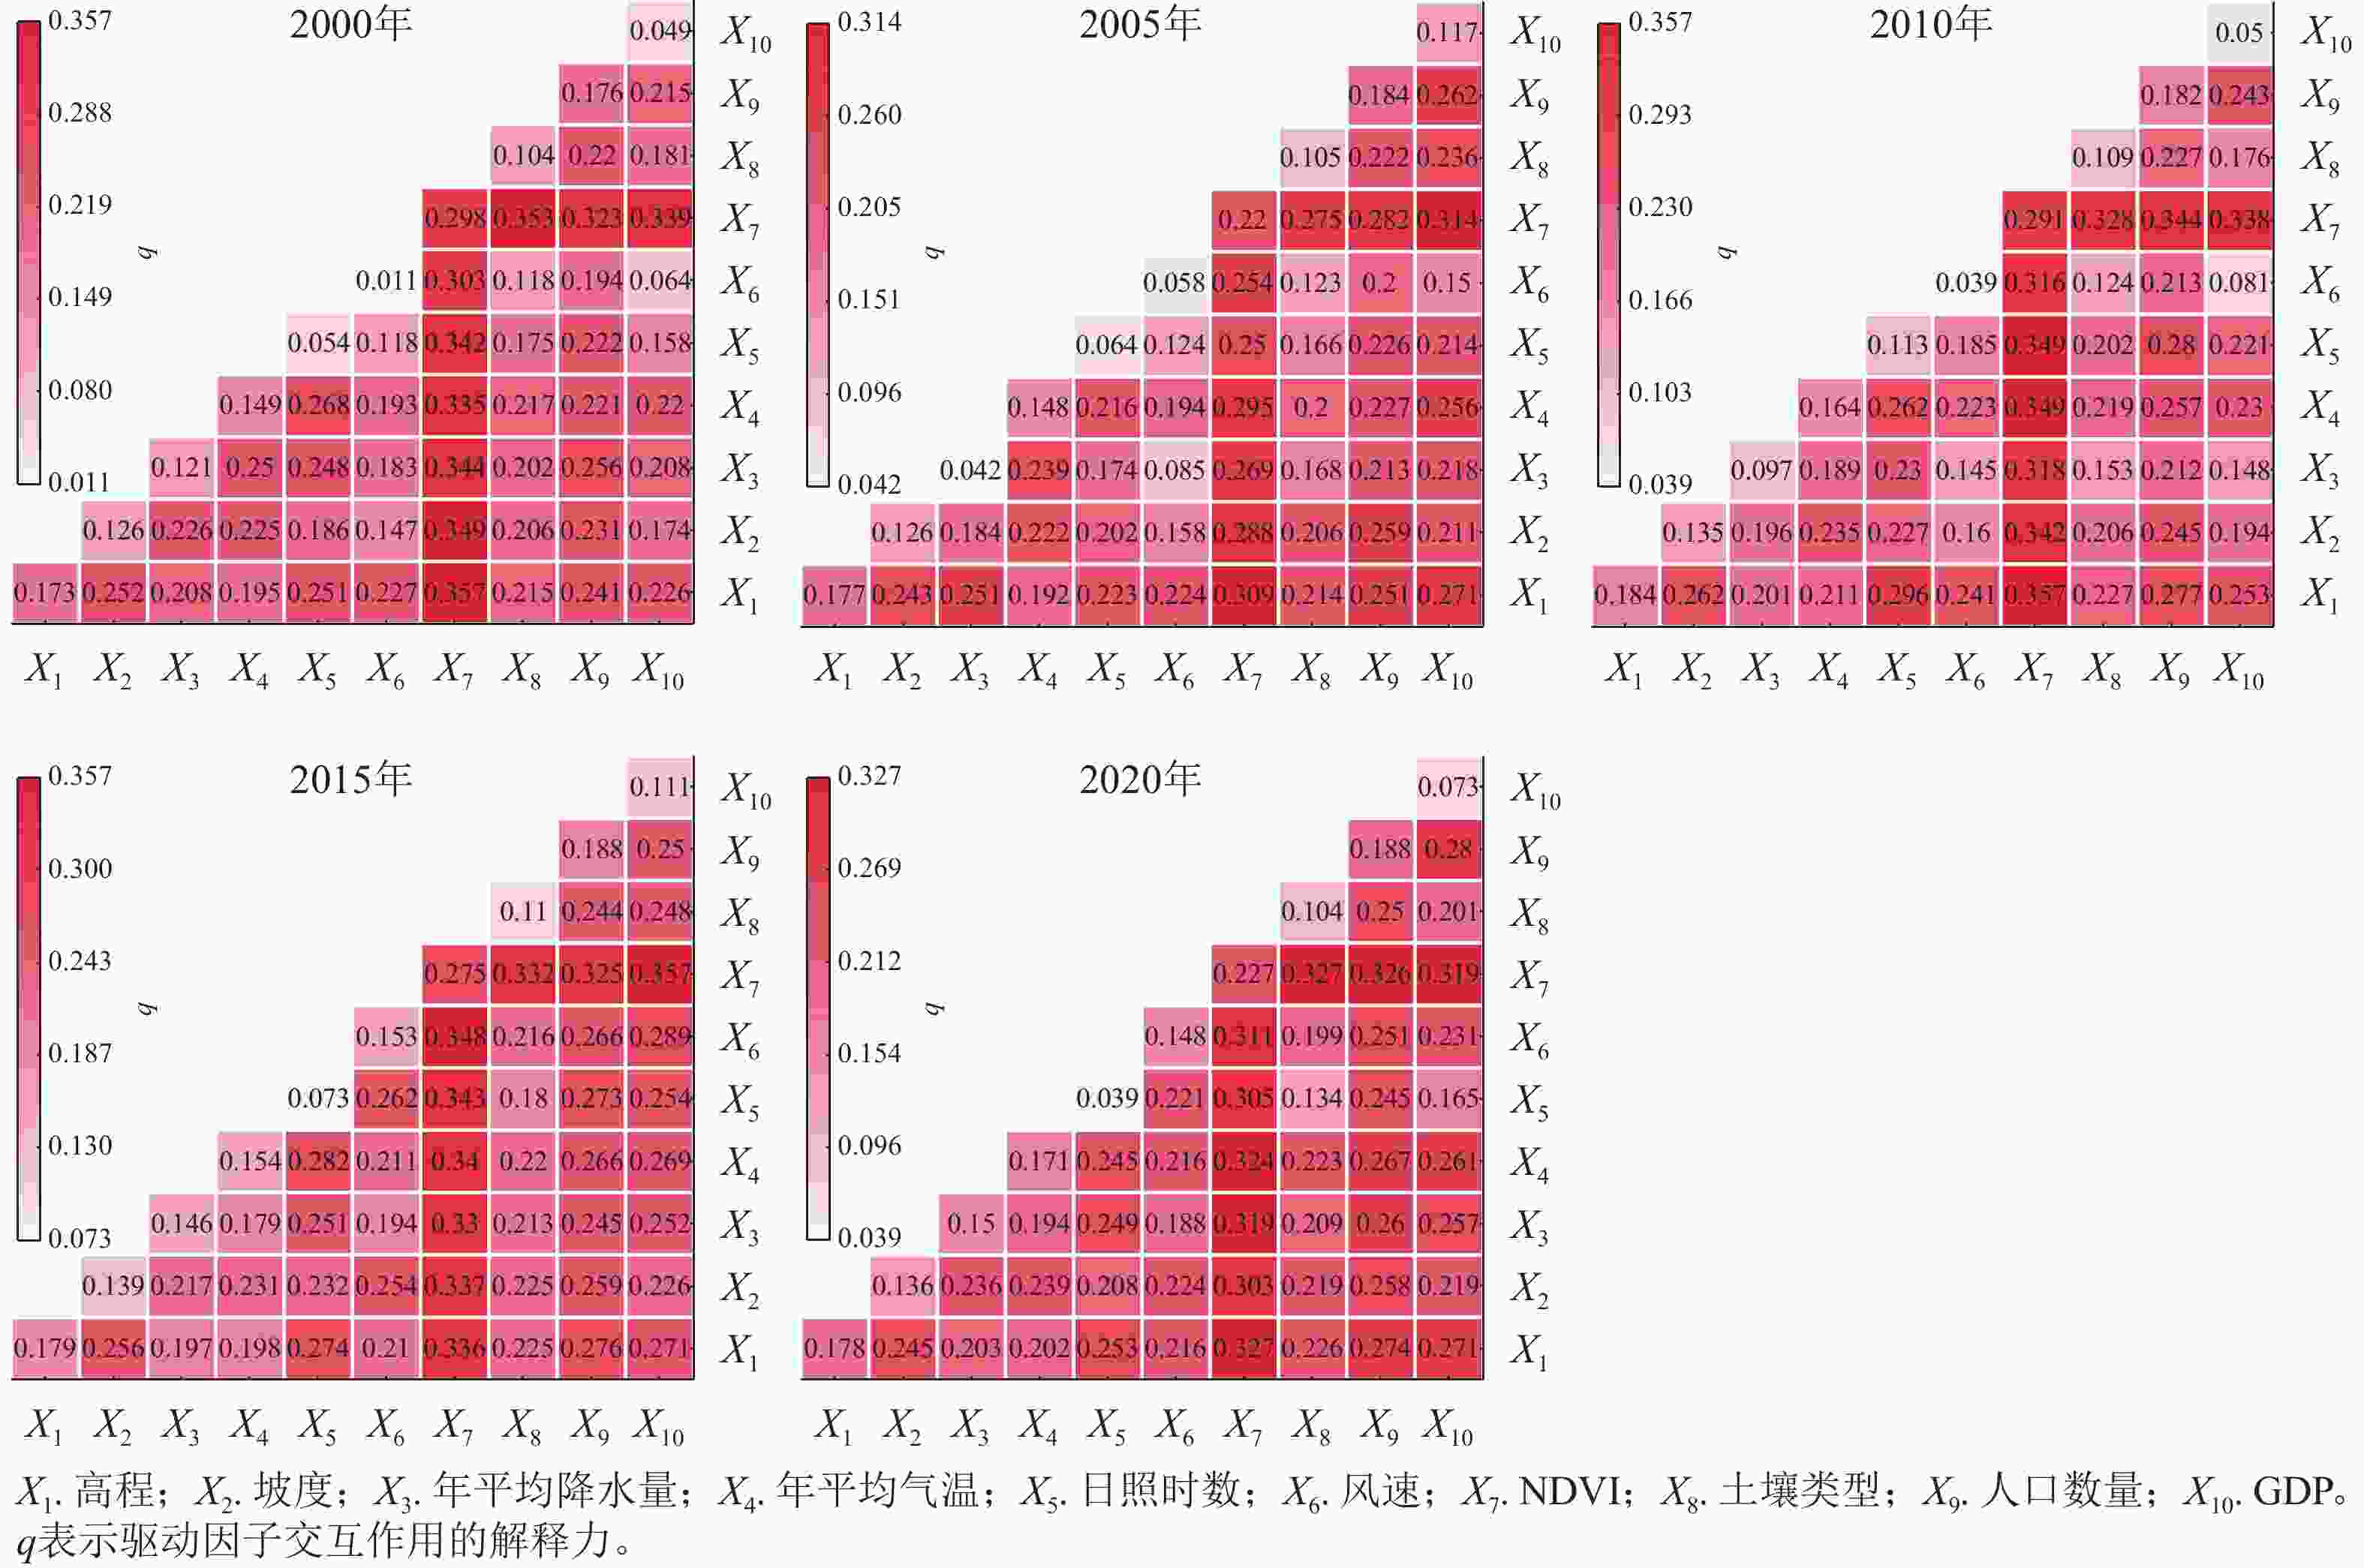
      Figure 6.  Influence of factor interactions

    • 根据地理探测器结果对10个驱动因子进行共线性检验,即方差膨胀因子(VIF)<7.5,剔除高程和年平均气温等VIF>7.5的变量,并通过普通线性回归(OLS)最终筛选出NDVI和坡度2个驱动因子作为解释变量。通过赤池信息准则(AICc)、决定系数(R2)和调整后R2对OLS、地理加权回归(GWR)和多尺度地理加权回归(MGWR)模型进行对比(表5)显示:MGWR模型的AICc最低,R2和调整后R2相对高,模型性能优于其他2种方法。

      年份 OLS GWR MGWR
      AICc R2 调整后的R2 AICc R2 调整后的R2 AICc R2 调整后的R2
      2000 8 714.863 0.399 0.399 6 692.658 0.746 0.705 6 589.975 0.738 0.704
      2005 8 858.513 0.375 0.375 7 175.527 0.713 0.666 7 165.950 0.691 0.652
      2010 8 893.702 0.370 0.369 6 780.446 0.741 0.699 6 756.838 0.727 0.690
      2015 8 984.884 0.354 0.354 6 930.914 0.731 0.687 6 862.574 0.720 0.682
      2020 9 058.487 0.341 0.341 7 096.210 0.719 0.673 7 010.933 0.710 0.670
        说明:OLS为普通线性回归模型;GWR为地理加权回归模型;MGWR为多尺度地理加权回归模型。AICc为赤池信息准则;R2为决定系数。

      Table 5.  Comparison of OLS Model, GWR Model, and MGWR Model
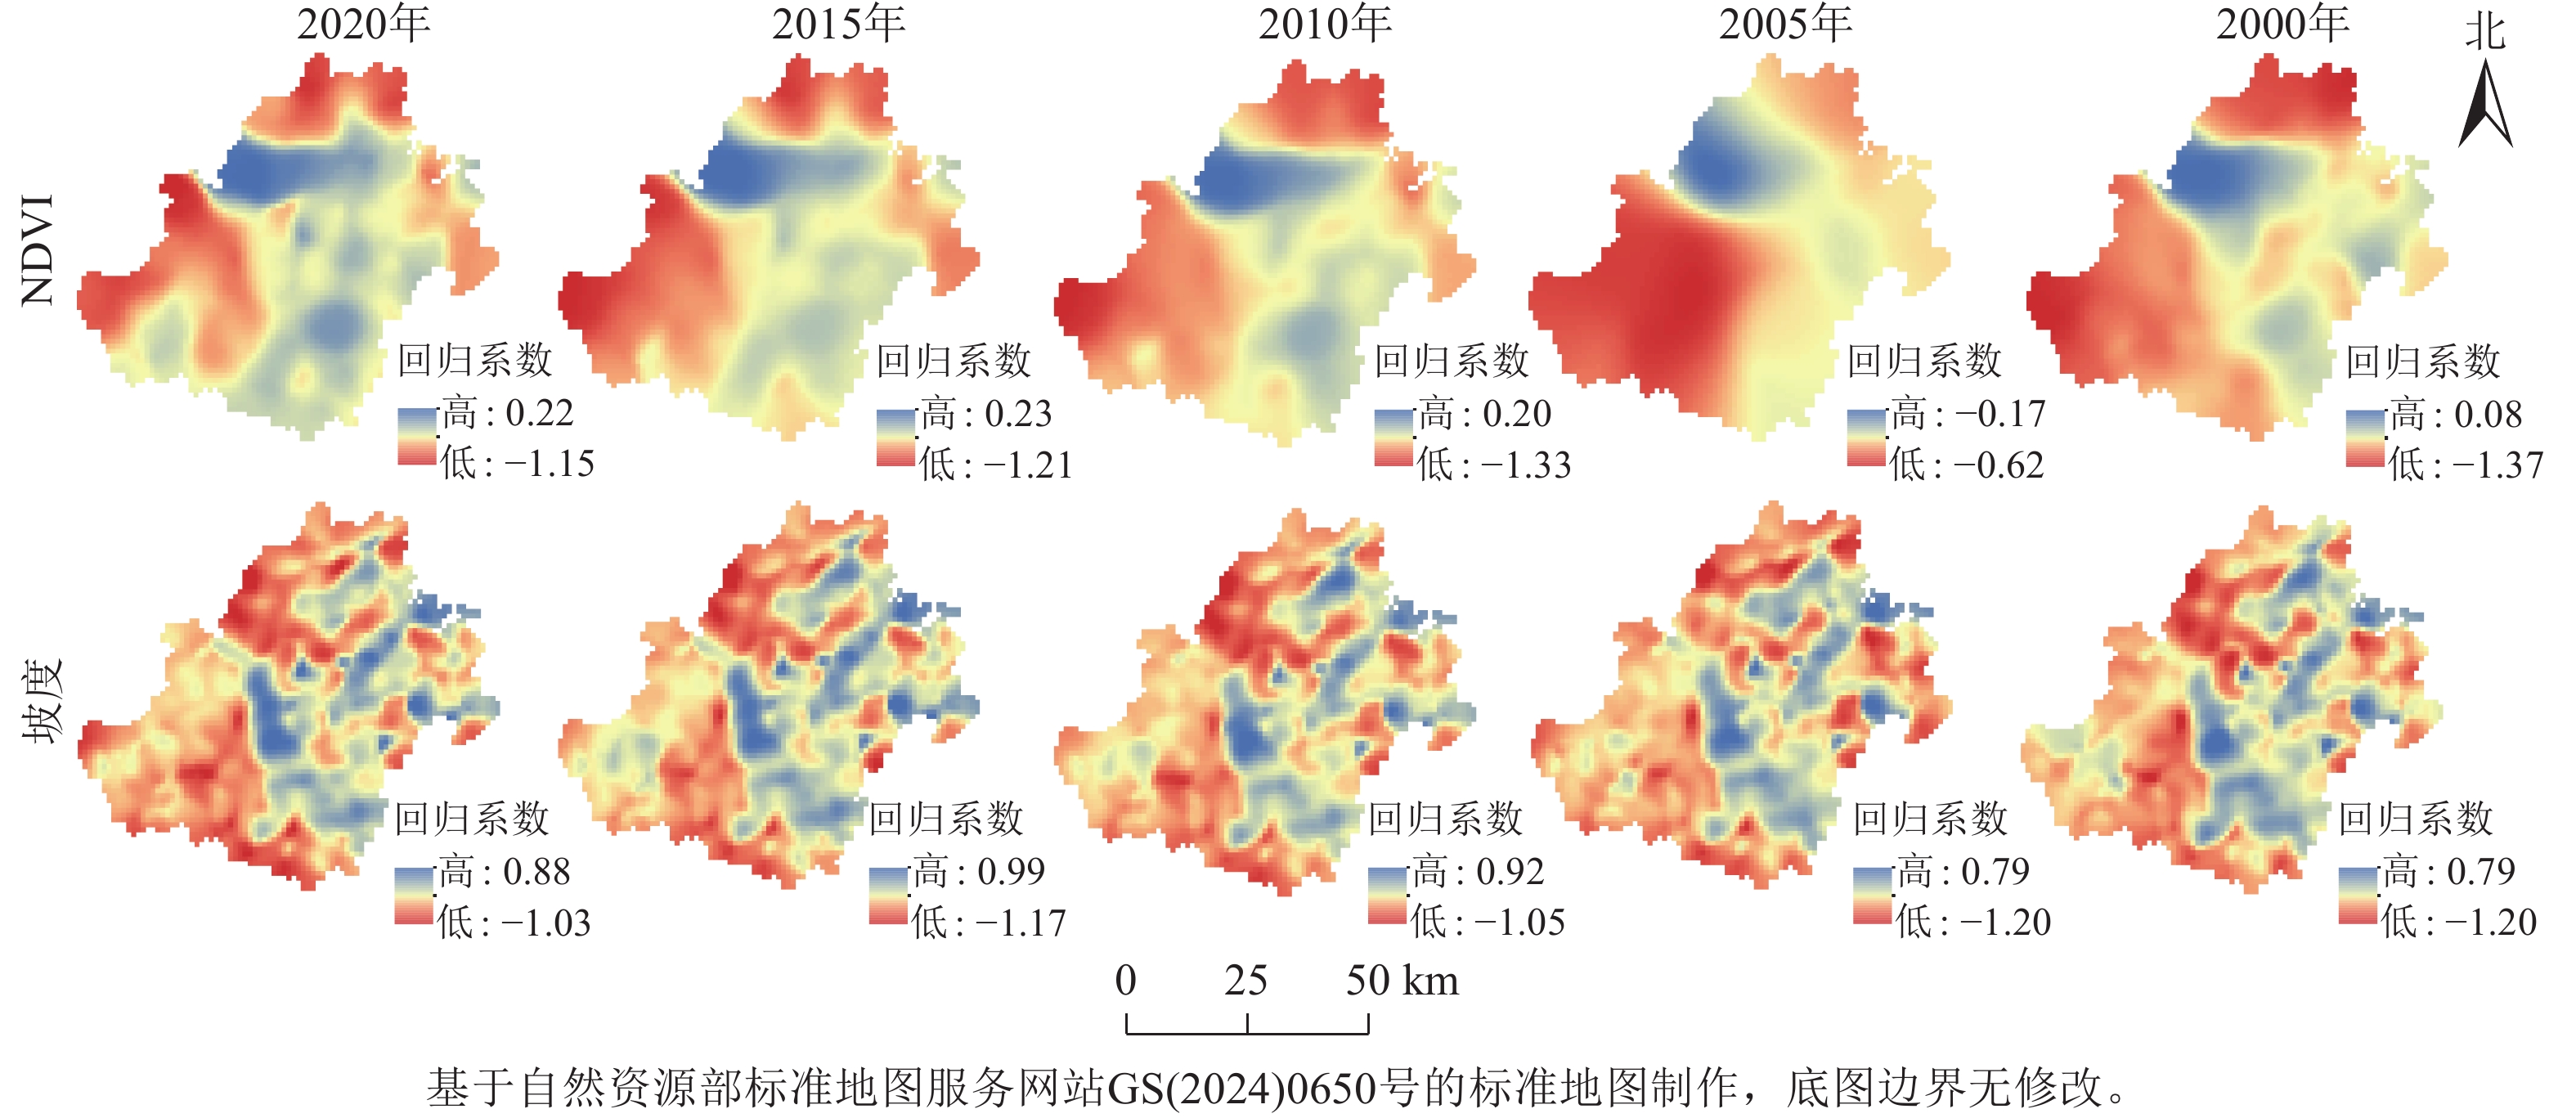
      图7可知:各年份驱动因素的作用方向和强度总体变化不大,但对新化县景观多样性和破碎度的影响存在显著空间异质性,区域间强度不同。MGWR模型回归结果显示:NDVI对景观多样性的影响大于坡度。其中NDVI对95%以上区域表现为负效应,高值区集中在北部、西部和南部地区,以稳定的林地景观为主,景观多样性低,破碎度小;正高值区在西部地区,景观交错分布,导致多样性高,破碎度大。坡度的影响以负效应为主(2020年占71.5%),高值区在西部及南部地区,因水流作用和建设用地密集,景观破碎度大;正高值区在地势平坦、耕地广布、景观多样性低、破碎度小的中部和东部。

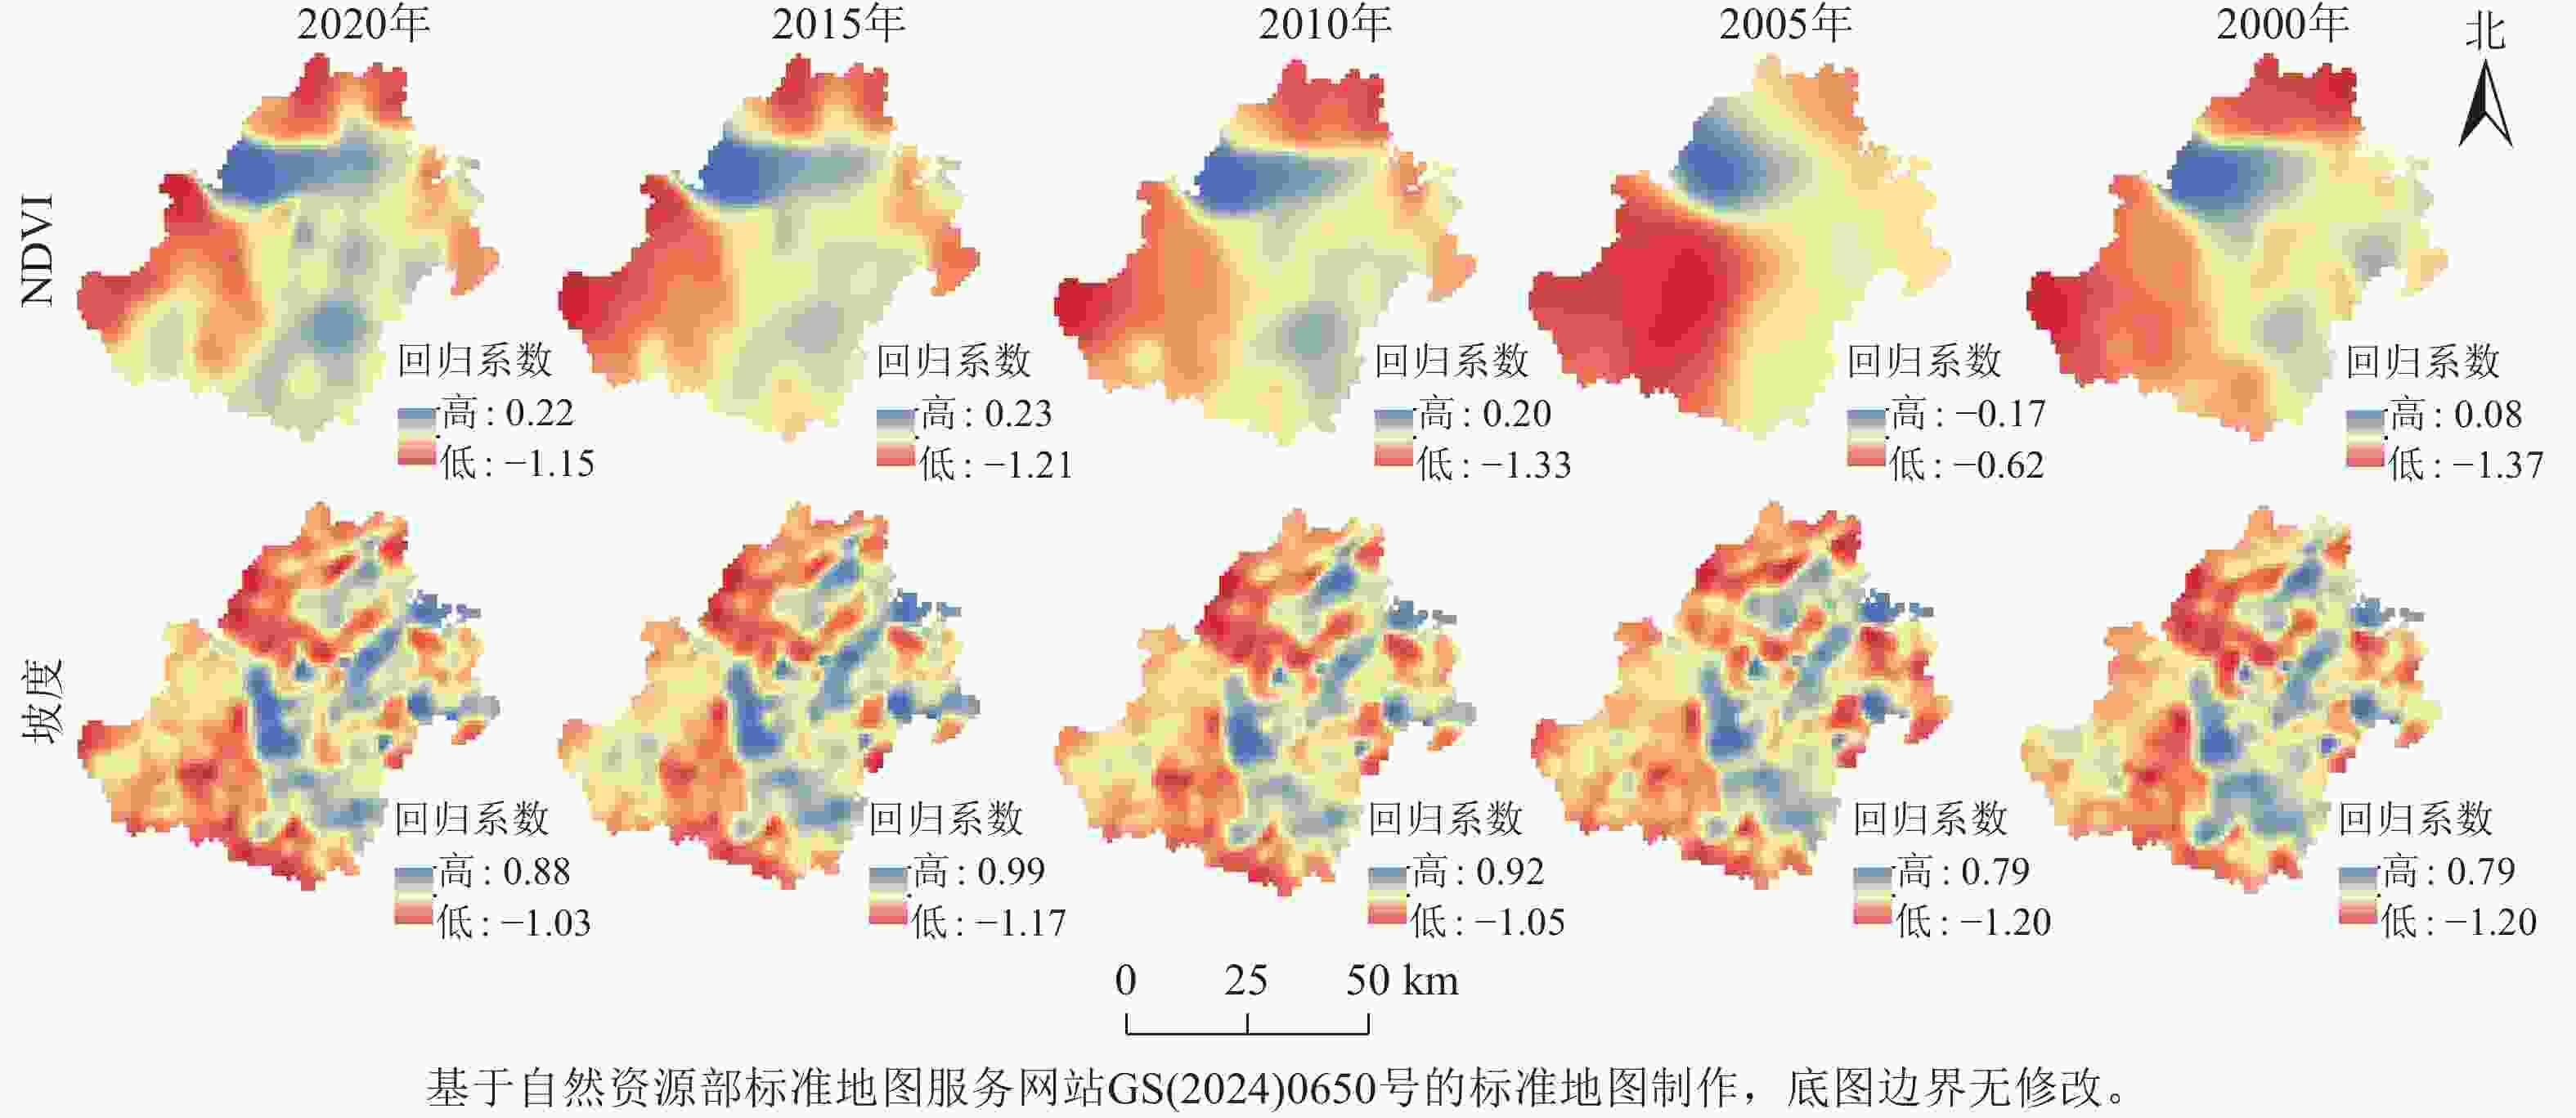
      Figure 7.  Spatial distribution of multiscale geographically weighted regression (MGWR) regression coefficients for each driving factor

    • 本研究表明:受退耕还林政策影响,2000—2020新化县耕地面积逐年下降,耕地流失严重,耕地大部分转化为林地;建设用地面积大幅上涨,增加部分主要来源于耕地和林地。城市化进程推动了人工地表对自然植被的持续替代,资源开发与交通建设加剧了生态干扰,导致景观破碎度与多样性上升,自然与人工景观的边界趋于模糊,交互影响不断增强。从驱动因素来看,研究区内的景观多样性受到自然条件和人类活动的双重驱动。在研究期内,NDVI、高程和人口数量对景观多样性的驱动力始终较为明显,这与何梦真等[29]的研究结果一致。买迪娜·艾尼瓦尔等[30]研究表明:NDVI是库尔勒市景观格局变化的主导因子,因其反映植被覆盖状况,可直接影响景观类型的分布与多样性。海拔对水热条件起到限制作用,而地形则可调节水热分布,进而形成小气候,两者共同作用对景观类型和多样性产生影响[31]。交互探测发现:自然因素和人为活动因素之间的交互作用显著强于单一因子的独立作用,表明各驱动因子在景观多样性的驱动机制中是相互影响的。MGWR分析进一步深化了上述研究结论,并揭示了NDVI和坡度对景观多样性的影响在不同空间区域的作用强度和作用方向不同,这与胡艺川等[32]的研究结果类似。景观变化对生态系统的结构以及功能具有重要影响。因此,可通过政策调控有效优化新化县景观结构,例如加强县域生态治理,优化林地和水域布局,防止林草退化;发展生态农业,提升耕地生物多样性;重点生态功能区如大熊山国家森林公园应强化生物多样性保护与生态修复,发挥生态屏障作用。在推动经济发展的同时,注重生态保护,实现开发与生境保护的协调统一。

      本研究结合POGD和MGWR模型,通过定量化、尺度化和区域化的方式,为揭示景观格局驱动因素及其作用机制提供了全面而精确的研究框架,为理解景观格局变化机制和区域生态管理提供了科学依据。然而,研究未充分考虑社会经济政策等非环境因素,数据时间跨度也限制了长期趋势分析。未来可结合更长时间序列数据,引入社会经济因子,进一步探索景观格局的动态演化及其驱动机制。

    • 2000—2023年,新化县景观类型结构发生显著变化,受城镇扩张与退耕还林政策影响,耕地面积持续减少,建设用地面积显著增长。景观格局分析表明:无论在类型层面还是景观层面,破碎化趋势均日益加剧,异质性提升,斑块形态趋于复杂。NDVI、人口数量与高程是主要驱动因子,其中因子间的交互作用(双因子增强与非线性增强)显著提高了对景观格局变化的解释力,且影响机制在空间上具有明显异质性,反映出景观格局演变由自然因子和社会因子共同驱动的复合响应过程。

Reference (32)

Catalog

    /

    DownLoad:  Full-Size Img  PowerPoint
    Return
    Return