Turn off MathJax
Article Contents

ZHOU Zhenyan, LIU Chang, SONG Xiechen. Distribution of forest carbon stocks in “Three Parallel Rivers” region based on GTWR-GBRT model[J]. Journal of Zhejiang A&F University, 2025, 42(X): 1−9 doi:  10.11833/j.issn.2095-0756.20250346
Citation: ZHOU Zhenyan, LIU Chang, SONG Xiechen. Distribution of forest carbon stocks in “Three Parallel Rivers” region based on GTWR-GBRT model[J]. Journal of Zhejiang A&F University, 2025, 42(X): 1−9 doi:  10.11833/j.issn.2095-0756.20250346

OnlineFirst articles are published online before they appear in a regular issue of the journal. Please find and download the full texts via CNKI.

Distribution of forest carbon stocks in “Three Parallel Rivers” region based on GTWR-GBRT model

DOI: 10.11833/j.issn.2095-0756.20250346
  • Received Date: 2025-06-20
  • Accepted Date: 2025-10-28
  • Rev Recd Date: 2025-10-27
  • Available Online: 2025-12-17
  •   Objective  Forest carbon storage plays a vital role in the global climate system and provides an important reference for achieving carbon peak and carbon neutrality goals. Model-based methods are effective for estimating forest carbon storage, while improving prediction accuracy remains a key challenge.   Method  Using national forest resource inventory data and Landsat 7 and 8 imagery, 5 modeling approaches including geographically and temporally weighted regression (GTWR), random forest (RF), gradient boosting regression tree (GBRT), GTWR-RF, and GTWR-GBRT were applied to estimate forest carbon storage in “Three Parallel Rivers” region from 2012 to 2021, and the optimal model was selected for final estimation.   Result  (1) GTWR model accounted for both spatial and temporal dimensions, while GBRT model showed clear limitations in explaining spatial heterogeneity. When used individually, all models exhibited limited explanatory power. In contrast, the two-stage hybrid model performed better than the single models, effectively addressing spatial heterogeneity and the nonlinear relationships between carbon storage and environmental variables. (2) GTWR-GBRT model achieved the best fitting performance, with the coefficient of determination (R2) of 0.98, the prediction accuracy of 0.90, and the relative root mean square error (rRMSE) of 5.91, outperforming the other 4 models, indicating that incorporating both spatiotemporal heterogeneity and nonlinearity were essential for accurate forest carbon estimation. (3) Forest carbon storage in the study area exhibited significant positive spatial autocorrelation. Estimates generated by GTWR-GBRT model revealed that forest carbon storage from 2012 to 2021 was unevenly distributed, mainly concentrated in high-altitude regions, showing a general pattern of higher values in the west and lower values in the east, along with some localized high-carbon areas.   Conclusion  Compared with various single models and other combined models, the GTWR-GBRT hybrid model demonstrates superior fitting and predictive performance, suggesting that integrating spatiotemporal and nonlinear characteristics within a two-stage hybrid framework can yield more accurate estimations of forest carbon storage. [Ch, 3 fig. 6 tab. 30 ref.]
  • [1] CAO Yaochang, WANG Xu, FENG Hanhua, Baoyinmanda, GUO Hao, ZHOU Guangyi, HE Gongxiu.  Community characteristics and carbon storage of natural forests in rocky desertification areas of northern Guangdong . Journal of Zhejiang A&F University, doi: 10.11833/j.issn.2095-0756.20250170
    [2] SUN Taoran, XU Lin, JIAO Jiejie.  Multi-objective management model and harvesting strategy for Phyllostachys edulis timber forests . Journal of Zhejiang A&F University, doi: 10.11833/j.issn.2095-0756.20250317
    [3] ZHENG Qian.  Literature analysis of Triticum aestivum bio-breeding based on bibliometrics and machine learning . Journal of Zhejiang A&F University, doi: 10.11833/j.issn.2095-0756.20240485
    [4] CHEN Qi, ZHANG Chao, TIAN Xiangyun, SHI Xiaorong, ZHANG Yuwei, WANG Yan.  Spatio-temporal evolution process of rocky desertification in Yunnan Province from 2000 to 2020 . Journal of Zhejiang A&F University, doi: 10.11833/j.issn.2095-0756.20210806
    [5] JIAO Xinyu, LONG Mei, LIU Zhixiong.  Spatiotemporal distribution and influencing factors of wild Cymbidium faberi from the perspective of historical geographic information system . Journal of Zhejiang A&F University, doi: 10.11833/j.issn.2095-0756.20220766
    [6] LIU Tingting, YANG Jinfan, ZHOU Ruliang, LIU Lin.  Prediction of spread risk of pine wilt disease based on geographic raster variables and machine learning models . Journal of Zhejiang A&F University, doi: 10.11833/j.issn.2095-0756.20220470
    [7] HE Weijun, YANG Jinchang, HAO Jian, DONG Mingliang, YU Niu, QIN Guoming, LI Rongsheng.  Spatial and temporal distribution characteristics and discoloration law of knots in the Mytilaria laosensis plantation . Journal of Zhejiang A&F University, doi: 10.11833/j.issn.2095-0756.20210517
    [8] LI Wanyuan, TIAN Jia, MA Qin, JIN Xuejuan, YANG Zekang, YANG Penghui.  Dynamic monitoring of loess terraces based on Google Earth Engine and machine learning . Journal of Zhejiang A&F University, doi: 10.11833/j.issn.2095-0756.20200673
    [9] DU Yufei, WU Baoguo, CHEN Yuling.  Eucalyptus suitability in Guangxi based on machine learning algorithms . Journal of Zhejiang A&F University, doi: 10.11833/j.issn.2095-0756.2020.01.016
    [10] XU Qihu, LIN Liping, XUE Chunquan, LUO Yong, LEI Yuancai.  Component specific carbon content and storage of Cinnamomum camphora in Guangdong Province . Journal of Zhejiang A&F University, doi: 10.11833/j.issn.2095-0756.2019.01.010
    [11] PENG Yang, BAI Yanfeng, JIANG Chunqian, XU Rui, LIU Xiuhong.  Carbon storage differences for farmland with two rehabilitation approaches . Journal of Zhejiang A&F University, doi: 10.11833/j.issn.2095-0756.2018.02.006
    [12] ZHANG Su, LIANG Peng, WU Shengchun, ZHANG Jin, CAO Zhihong.  Temporal and spatial distribution of heavy metal contamination in Gaohong, Lin'an, Zhejiang Province . Journal of Zhejiang A&F University, doi: 10.11833/j.issn.2095-0756.2017.03.014
    [13] YAN Dongfeng, GUO Dandan, WU Guicang, YANG Xitian.  Carbon and nitrogen distribution with forest tending in a natural secondary oak forest . Journal of Zhejiang A&F University, doi: 10.11833/j.issn.2095-0756.2017.02.003
    [14] GAO Cheng, ZHANG Chao, YU Shuquan.  Temporal and spatial variation for vertical column density of tropospheric NO2 over the Yangtze River Delta from 2005 to 2013 . Journal of Zhejiang A&F University, doi: 10.11833/j.issn.2095-0756.2015.05.006
    [15] WANG Guoxin, YANG Xiaona, SU Fei.  Spatial-temporal distribution of mountain-climate tourism resources in Lin’an, China . Journal of Zhejiang A&F University, doi: 10.11833/j.issn.2095-0756.2015.02.019
    [16] BAI Yanfeng, ZHANG Shougong, JIANG Chunqian.  International comparison of carbon flows of harvested wood products . Journal of Zhejiang A&F University, doi: 10.11833/j.issn.2095-0756.2014.01.011
    [17] LI Cuiqin, ZHOU Yufeng, GU Lei, SHI Yongjun, SHEN Zhenming, XU Xiaojun, LI Ruijun.  Carbon transfer of Phyllostachys edulis filar products . Journal of Zhejiang A&F University, doi: 10.11833/j.issn.2095-0756.2013.01.009
    [18] SUN Chong, LIU Qijing.  Carbon storage changes for major forest types in Beijing . Journal of Zhejiang A&F University, doi: 10.11833/j.issn.2095-0756.2013.01.010
    [19] CUI Rui-rui, DU Hua-qiang, ZHOU Guo-mo, XU Xiao-jun, DONG De-jin, Lü Yu-long.  Remote sensing-based dynamic monitoring of moso bamboo forest and its carbon stock change in Anji County . Journal of Zhejiang A&F University, doi: 10.11833/j.issn.2095-0756.2011.03.012
    [20] LI Zheng-cai, FU Mao-yi, XIE Jin-zhong, ZHOU Ben-zhi, XIAO Ti-quan, WU Ming.  Carbon sequestration of 5 ecological reestablishment vegetation types in Muchuan County of Sichuan . Journal of Zhejiang A&F University,
  • [1]
    LIU Tengyan, MAO Fangjie, LI Xuejian, et al. Spatiotemporal dynamic simulation on aboveground carbon storage of bamboo forest and its influence factors in Zhejiang Province, China[J]. Chinese Journal of Applied Ecology, 2019, 30(5): 1743−1753. DOI: 10.13287/j.1001-9332.201905.035.
    [2]
    NA Xueying. Changes in forest carbon stocks and carbon sequestration potential in China[J]. Contemporary Horticulture, 2024, 47(15): 59−63. DOI: 10.14051/j.cnki.xdyy.2024.15.047.
    [3]
    LI Shunlong, DU Yongmei, JIANG Minyuan. Preliminary study of forest carbon sinks in China[J]. Forestry Finance & Accounting, 2004(7): 5−6. DOI: 10.14153/j.cnki.lsck.2004.07.002.
    [4]
    HUANG Liyuan, CHEN Qin. A study about theoretical basis and status of China forest carbon sinks[C]//SONG Weiming, LIU Dongsheng, CHEN Jiancheng, et al. Low-Carbon Economy and Forestry Development: Proceedings of China Forestry Academic Forum China (No. 6). Beijing: China Forestry Publishing House, 2009: 154−164.
    [5]
    WEI Geran, LI Mingze, QUAN Ying, et al. Geographically weighted random forest approach to predict forest carbon storage by remote sensing in Heilongjiang[J]. Journal of Central South University of Forestry & Technology, 2024, 44(7): 64−76. DOI: 10.14067/j.cnki.1673-923x.2024.07.008.
    [6]
    LONG Yi, JIANG Fugen, SUN Hua, et al. Estimating vegetation carbon storage based on optimal bandwidth selected from geographically weighted regression model in Shenzhen City[J]. Acta Ecologica Sinica, 2022, 42(12): 4933−4945. DOI: 10.5846/stxb202102260545.
    [7]
    FENG Rui, HU Liting, HU Xiaoyi, et al. Knowledge gaps are making it harder to formulate national climate policies[J]. Proceedings of the National Academy of Sciences of the United States of America, 2023, 120(23): e2218563120. DOI: 10.1073/pnas.2218563120.
    [8]
    HUANG Bo, WU Bo, BARRY M. Geographically and temporally weighted regression for modeling spatio-temporal variation in house prices[J]. International Journal of Geographical Information Science, 2010, 24(3): 383−401. DOI: 10.1080/13658810802672469.
    [9]
    ZHANG Xiaoyong. A Study of Forest Carbon Stock Distribution Based on Spatio-temporal Geographically Weighted Regression[D]. Harbin: Northeast Forestry University, 2023. DOI: 10.27009/d.cnki.gdblu.2023.000483.
    [10]
    WANG Keyue, WANG Yifu, CHEN Xin, et al. Remote sensing estimation of forest carbon storage in Jiangxi Province based on ensemble learning algorithm and Optuna tuning[J]. Acta Ecologica Sinica, 2025, 45(2): 685−700. DOI: 10.20103/j.stxb.202403150536.
    [11]
    SHI Chuan, XU Hui, ZHANG Chengcheng. Remote sensing inversion and dynamic change analysis of carbon storage in coniferous forests in central Yunnan[J]. Modern Agriculture Research, 2025, 31(3): 83−85. DOI: 10.19704/j.cnki.xdnyyj.2025.03.017.
    [12]
    LIU Minghao, LUO Xiaolin, QI Liai, et al. Simulation of the spatiotemporal distribution of PM2.5 concentration based on GTWR-XGBoost two-stage model: a case study of Chengdu Chongqing economic circle[J]. Atmosphere, 2023, 14(1): 115. DOI: 10.3390/atmos14010115.
    [13]
    ZHANG Qiman. Research on the Ecological Connectivity and Spatial Differentiation inThree Parallel Riversof Yunnan Protected Areas[D]. Kunming: Yunnan University, 2015.
    [14]
    YANG Bowen, LIU Fenglian, CHEN Hongmin. Spatial-temporal evolution and driving factors of forest vegetation in the three parallel rivers region[J]. Forest Engineering, 2025, 41(1): 108−125. DOI: 10.7525/j.issn.1006-8023.2025.01.009.
    [15]
    GU Chunxi, OU Guanglong, LIU Chang, et al. Dynamic prediction of carbon storage in Pinus kesiya var. Langbianensis forest[J]. Journal of Southwest Forestry University (Natural Science), 2024, 44(6): 150−157. DOI: 10.11929/j.swfu.202309043.
    [16]
    FANG Jingyun, CHEN Anping, PENG Changhui, et al. Changes in forest biomass carbon storage in China between 1949 and 1998[J]. Science, 2001, 292(5525): 2320−2322. DOI: 10.1126/science.1058629.
    [17]
    FANG Jingyun, LIU Guohua, XU Songling. Biomass and net production of forest vegetation in China[J]. Acta Ecologica Sinica, 1996, 16(5): 497−508.
    [18]
    TU Hongtao, ZHOU Hongbin, MA Guoqiang, et al. Characteristics of forest carbon storage in Yunnan based on the ninth forest inventory data[J]. Journal of Northwest Forestry University, 2023, 38(3): 185−193. DOI: 10.3969/j.issn.1001-7461.2023.03.25.
    [19]
    GUO Hanru, ZHANG Maozhen, XU Lihua, et al. Geographically weighted regression based on estimation of regional forest carbon storage[J]. Journal of Zhejiang A&F University, 2015, 32(4): 497−508. DOI: 10.11833/j.issn.2095-0756.2015.04.002.
    [20]
    WANG Yan, LIU Jiping, ZHAO Yangyang, et al. Spatial and temporal distribution and influencing factors of PM2.5 in 3 km Beijing-Tianjin-Hebei region based on GTWR model[J]. Bulletin of Surveying and Mapping, 2024(6): 82−89. DOI: 10.13474/j.cnki.11-2246.2024.0615.
    [21]
    WANG Yuhong, DU Ning, WANG Li, et al. Estimation of PM2.5 concentration in Sichuan Province based on improved linear mixed effect model and geo-intelligent random forest[J]. Environmental Science, 2021, 42(12): 5602−5615. DOI: 10.13227/j.hjkx.202102048.
    [22]
    XU Chuanqing, YANG Yang, YANG Zhen, et al. Analysis of factors influencing the incidence of tuberculosis in Changping District based on GTWR modeling[J]. Mathematics in Practice and Theory, 2025, 55(4): 173−185. DOI: 10.20266/j.math.24-0948.
    [23]
    GU Li, YANG Huiyuan, ZENG Youding, et al. Spatio-temporal evolution and prediction of carbon storage in China’s terrestrial ecosystems based on land use change[J]. Journal of Northwest Forestry University, 2025, 40(3): 141−152. DOI: 10.3969/j.issn.1001-7461.2025.03.17.
    [24]
    YANG Bing, WU Sensen, YAN Zhen. Effects of climate change on corn yields: spatiotemporal evidence from geographically and temporally weighted regression model[J]. ISPRS International Journal of Geo-Information, 2022, 11(8): 433. DOI: 10.3390/ijgi11080433.
    [25]
    WU Zaikun, ZHOU Wenwu, SHU Qingtai, et al. Estimation of aboveground biomass of Dendrocalamus giganteus based on ICESat-2/ATLAS data[J]. Journal of Central South University of Forestry & Technology, 2025, 45(1): 48−57. DOI: 10.14067/j.cnki.1673-923x.2025.01.006.
    [26]
    TANG Haofan, XU Yanhong, AI Jianlin. Carbon storage and carbon density of forest vegetation and their spatial distribution pattern in Yunnan Province[J]. Forest Resources Management, 2019(5): 37−43. DOI: 10.13466/j.cnki.lyzygl.2019.05.008.
    [27]
    CHENG Fengyun, OU Guanglong, WANG Meng, et al. Remote sensing estimation of forest carbon stock based on machine learning algorithms[J]. Forests, 2024, 15(4): 681. DOI: 10.3390/f15040681.
    [28]
    LIANG Xuan, LI Chunbo. Analysis of current situation and potential of forest carbon sink in Yunnan Province[J]. Chinese Agricultural Science Bulletin, 2023, 39(30): 47−53. DOI: 10.11924/j.issn.1000-6850.casb2022-0909.
    [29]
    FAN Huapeng, LIU Chang, CHENG Fengyun. The estimation of forest carbon storage in northwest Yunnan based on different machine learning classification algorithms[J/OL]. Journal of Southwest Forestry University, 2025-04-25[2025-06-10]. https://link.cnki.net/urlid/53.1218.S.20250425.0101.002.
    [30]
    MU Xiyun, LIU Qingwang, PANG Yong, et al. Forest aboveground carbon storage using RF algorithmic model and airborne LiDAR data[J]. Journal of Northeast Forestry University, 2016, 44(11): 52−56. DOI: 10.13759/j.cnki.dlxb.2016.11.011.
  • 加载中
通讯作者: 陈斌, bchen63@163.com
  • 1. 

    沈阳化工大学材料科学与工程学院 沈阳 110142

  1. 本站搜索
  2. 百度学术搜索
  3. 万方数据库搜索
  4. CNKI搜索

Figures(3)  / Tables(6)

Article views(21) PDF downloads(1) Cited by()

Related
Proportional views

Distribution of forest carbon stocks in “Three Parallel Rivers” region based on GTWR-GBRT model

doi: 10.11833/j.issn.2095-0756.20250346

Abstract:   Objective  Forest carbon storage plays a vital role in the global climate system and provides an important reference for achieving carbon peak and carbon neutrality goals. Model-based methods are effective for estimating forest carbon storage, while improving prediction accuracy remains a key challenge.   Method  Using national forest resource inventory data and Landsat 7 and 8 imagery, 5 modeling approaches including geographically and temporally weighted regression (GTWR), random forest (RF), gradient boosting regression tree (GBRT), GTWR-RF, and GTWR-GBRT were applied to estimate forest carbon storage in “Three Parallel Rivers” region from 2012 to 2021, and the optimal model was selected for final estimation.   Result  (1) GTWR model accounted for both spatial and temporal dimensions, while GBRT model showed clear limitations in explaining spatial heterogeneity. When used individually, all models exhibited limited explanatory power. In contrast, the two-stage hybrid model performed better than the single models, effectively addressing spatial heterogeneity and the nonlinear relationships between carbon storage and environmental variables. (2) GTWR-GBRT model achieved the best fitting performance, with the coefficient of determination (R2) of 0.98, the prediction accuracy of 0.90, and the relative root mean square error (rRMSE) of 5.91, outperforming the other 4 models, indicating that incorporating both spatiotemporal heterogeneity and nonlinearity were essential for accurate forest carbon estimation. (3) Forest carbon storage in the study area exhibited significant positive spatial autocorrelation. Estimates generated by GTWR-GBRT model revealed that forest carbon storage from 2012 to 2021 was unevenly distributed, mainly concentrated in high-altitude regions, showing a general pattern of higher values in the west and lower values in the east, along with some localized high-carbon areas.   Conclusion  Compared with various single models and other combined models, the GTWR-GBRT hybrid model demonstrates superior fitting and predictive performance, suggesting that integrating spatiotemporal and nonlinear characteristics within a two-stage hybrid framework can yield more accurate estimations of forest carbon storage. [Ch, 3 fig. 6 tab. 30 ref.]

ZHOU Zhenyan, LIU Chang, SONG Xiechen. Distribution of forest carbon stocks in “Three Parallel Rivers” region based on GTWR-GBRT model[J]. Journal of Zhejiang A&F University, 2025, 42(X): 1−9 doi:  10.11833/j.issn.2095-0756.20250346
Citation: ZHOU Zhenyan, LIU Chang, SONG Xiechen. Distribution of forest carbon stocks in “Three Parallel Rivers” region based on GTWR-GBRT model[J]. Journal of Zhejiang A&F University, 2025, 42(X): 1−9 doi:  10.11833/j.issn.2095-0756.20250346
  • 森林生态系统作为陆地生态系统中最大的碳储存库,通过吸收并储存二氧化碳来维持全球碳循环平衡与增加碳汇,对应对气候变化至关重要[12]。因此,森林碳汇问题受到越来越多的关注[34],准确估测森林碳储量及其空间分异特征,对于实现“双碳”战略目标具有重要意义。森林碳储量一般通过实地调查数据计算,这种方法虽然具有较高的可信度,但需要消耗大量的人力和物力资源。此外,实地调查可能会对森林生态系统造成一定程度的干扰和破坏,从而影响其原有的生态平衡[5]。为了解决这些问题,遥感技术结合地面样地的反演方法能够获取区域范围内植被碳储量的空间连续分布,这一创新方式有效弥补了传统人工抽样调查估测的局限性,提供了更全面的碳储量信息,有助于更好地理解和管理森林生态系统[6]。目前,森林生态系统碳储量估算的研究大多采用样地调查法、遥感反演法或模型预测法[7]。然而,森林碳储量的空间分布具有显著的时空异质性,同时受地形、植被指数等多种因素的非线性影响,现有的方法在同时捕捉时空依赖性和复杂非线性关系方面仍存在不足。

    鉴于地理空间相关性,许多研究使用了地理加权回归(GWR)模型及其扩展来分析碳储量与各因子之间的关系。黄波等[8]通过在地理加权回归模型中引入时间效应,提出了时空地理加权回归(GTWR)模型,该方法的有效性优于传统GWR方法,突出了时间显式空间建模的重要性。森林碳储量估测受到时空异质性的影响,有研究通过比较GWR及其多种扩展模型在森林碳储量估测中的表现,发现GTWR模型的预测精度最高[9]

    而随着数据量和预测变量的增加,机器学习方法因其强大的非线性特征捕捉能力,也被用于森林碳储量的估测。王可月等[10]基于遥感影像,以植被指数、纹理等为反演因子,采用4种机器学习算法对江西省森林碳储量进行估测,发现堆叠集成算法的估测结果最优。史川等[11]利用Landsat卫星影像提取特征,通过对比多元线性回归、随机森林(RF)、K-近邻及梯度提升回归树(GBRT)模型,确定GBRT为最优估测模型,以此来分析滇中地区针叶林碳储量。以上模型考虑到了数据的非线性问题,但忽略了时空异质性问题,对时空依赖性的显式建模不足。目前,使用GTWR模型与非线性模型的结合主要应用于PM2.5的估测中,如LI等[12]采用时空地理加权回归及极端梯度提升(GTWR-XGBoost)模型估测成渝经济圈PM2.5浓度,该模型可刻画时空异质性、揭示复杂非线性关系,且提升了时空分布模拟的可解释性。森林的固碳过程和植被结构具有复杂的时空异质性,表现出显著的非线性特征,而传统模型虽能捕捉时空异质性,但在处理复杂的非线性关系时存在明显局限。为此,本研究引入GTWR模型以捕捉碳储量的时空变化规律,并协同GBRT模型来增强对复杂非线性关系的拟合能力。

    在此基础上,本研究以“三江并流”区域作为研究区,结合该区域2012、2017、2021年的云南省森林一类清查数据以及遥感数据,构建了GTWR、RF、GBRT及其组合模型(GTWR-RF、GTWR-GBRT),通过对比评估以探究时空与非线性格局在碳储量估算中的效用,为区域森林管理提供依据。

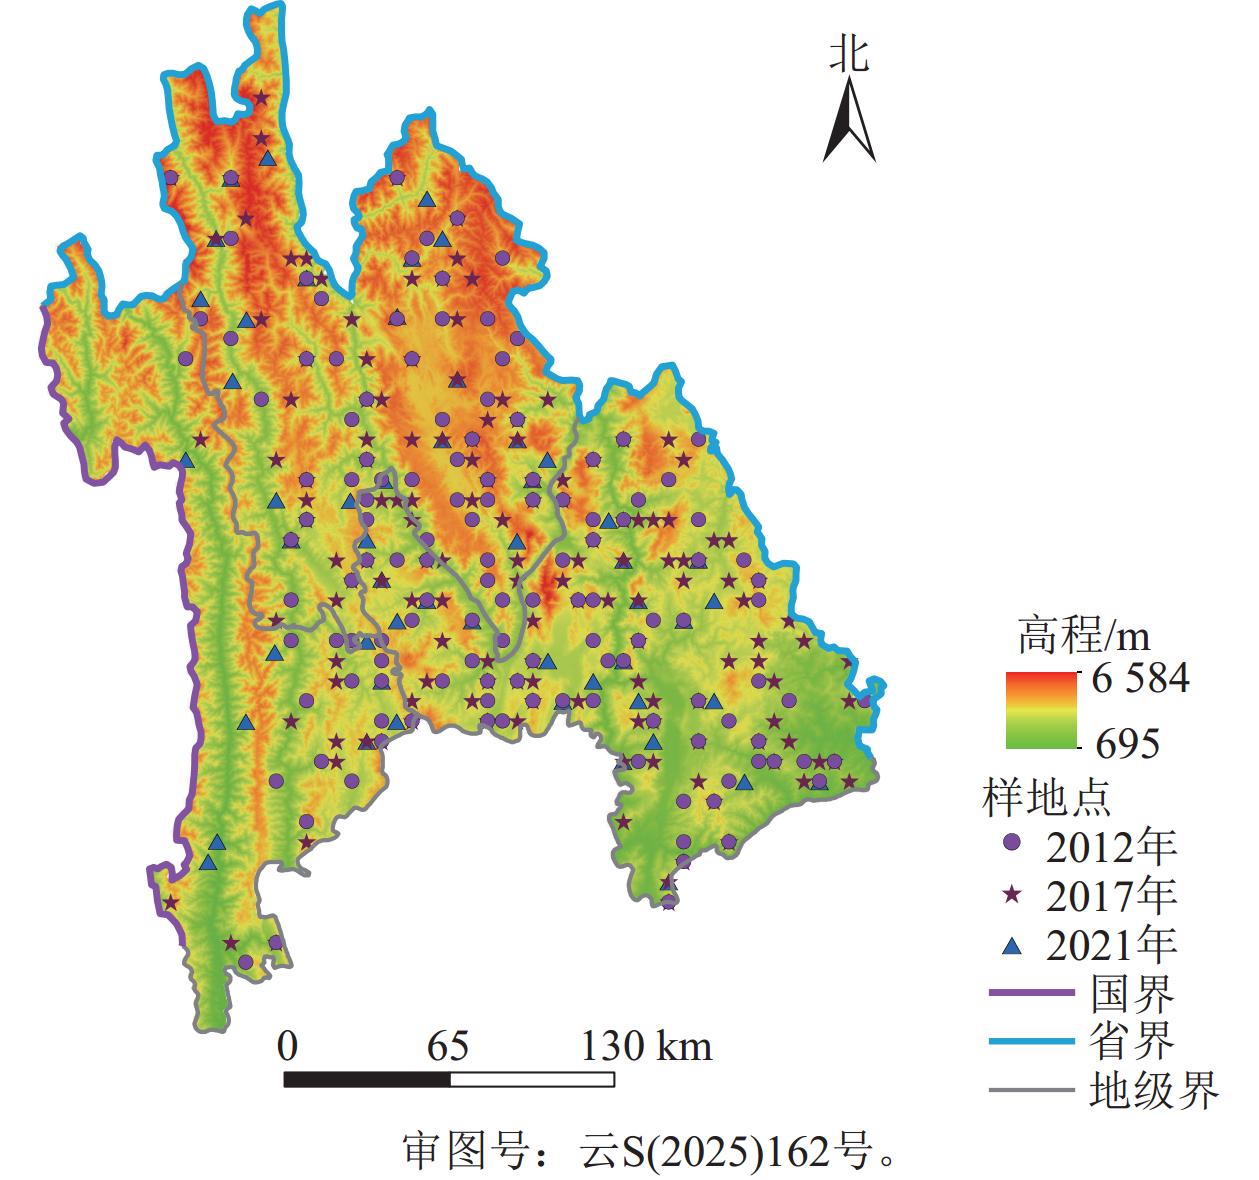
    • “三江并流”保护区位于滇西北高原横断山脉纵谷地区(25°30′~29°00′N,98°00′~100°30′E),是指怒江、澜沧江、金沙江3条大江在滇西地区平行并流的最近区域,包括云南省怒江市、迪庆州、丽江市的3个市州及8个市县(图1);拥有丰富多样的地貌类型,是多种地质演化的代表区域;拥有众多孑遗物种和珍稀濒危物种,是中国重要的水能资源、矿产资源、旅游资源和生物资源的集聚地[13]。因多样的自然地貌和气候条件(涵盖南亚热带至寒带多种气候类型)而形成丰富植被类型,主要包括常绿阔叶林、硬叶常绿阔叶林、针阔混交林以及暖温性、温性针叶林等,体现了显著的生态多样性[14]

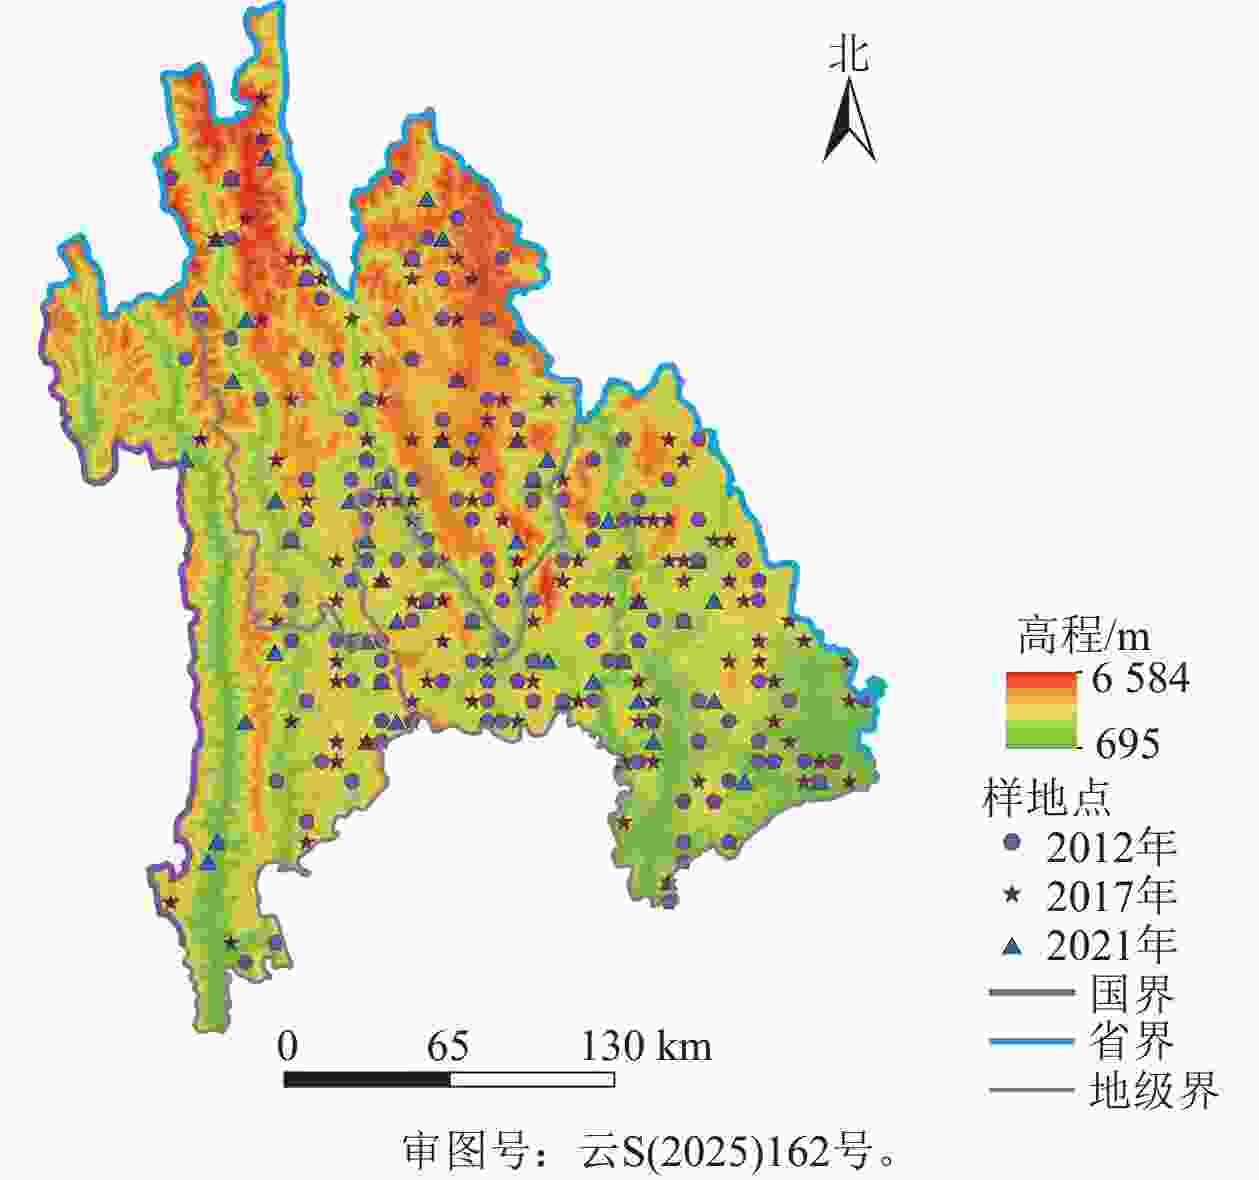
      Figure 1.  Schematic map of the study area

    • 实测数据为2012、2017、2021年的云南省森林一类清查数据。本研究样地为方形样地,边长为25.82 m。数据包括样地号、优势树种、树龄、经纬度坐标、郁闭度等信息。林木蓄积量通过样木胸径和树高的实测数据,利用二元立木材积公式计算获得。

    • 在美国地质调查局(USGS,https://earthexplorer.usgs.gov)网站获取研究区Landsat卫星遥感影像,分辨率为30 m,其中2012年数据来自Landsat 7,2017与2021年数据来自Landsat 8。考虑到云覆盖产生的影像质量问题,选取每年6—12月云量低于5%所有可用的卫星影像数据,每年取8景(序列号均为130/42、131/41、131/42、132/40、132/41、132/42、133/40、133/41),共为24景影像,且经查验无坏带,进行大气校正、辐射定标[15]。在地理空间数据云平台(https://www.gscloud.cn/)下载研究区30 m的DEM高程数据。

    • 基于蓄积量-生物量转换模型[1617],估算样点的生物量并计算碳储量,公式如下:

      式(1)和(2)中:B为单位面积生物量(t),V为单位面积蓄积量(m3), ab为参数;C为碳储量(t·hm−2);F为含碳系数。各优势树种的参数ab及含碳系数F均参考文献[18],研究区森林碳储量见表1

      年份 样本数 均值/(t·hm−2) 标准差/(t·hm−2)
      2012 131 13.20 10.23
      2017 147 12.80 9.46
      2021 52 14.15 9.73

      Table 1.  Carbon stocks of sample plots

    • 利用光谱、地形及纹理特征等信息对森林碳储量进行建模,可以提高估测精度[19]。基于遥感影像提取研究区的地形和遥感因子,分别提取6个单波段因子及对应的48个纹理特征(3 × 3窗口)、4个植被指数因子,以及坡度、坡向、海拔共61个特征因子(表2),这些因子涵盖了遥感影像中的主要信息类型。

      特征类型特征因子
      单波段b1、b2、b3、b4、b5、b6
      植被指数归一化植被指数(NDVI)、比值植被指数(RVI)、差值植被指数(DVI)、调整土壤亮度植被指数(SAVI)
      地形因子坡度(slope)、坡向(aspect)、海拔(elevation)
      纹理特征均值(mean)、方差(variance)、同质性(homogeneity)、对比度(contrast)、差异性(dissimilarity)、熵(entropy)、
      相关性(correlation)、角二阶矩(second moment)

      Table 2.  Characteristic variable

    • 由于变量间的线性关系会掩盖其统计显著性,增大参数估计误差,导致模型预测性能降低,因此需要检验变量间是否存在共线性问题,而方差膨胀因子(VIF)是诊断多重共线性的关键指标[20]。为探究研究区地形因子和遥感因子与碳储量之间的关系,利用SPSS软件绘制碳储量与各变量的散点图,剔除异常值后与变量进行逐步回归分析和共线性检验,一般认为VIF<10代表不存在多重共线性[21],本研究中VIF<2,最终确定6个因子作为GTWR模型的输入变量(表3)。

      变量tP容差VIF
      elevation18.720.000.901.11
      b6mean−5.630.000.581.71
      DVI−2.200.020.751.32
      b4ent−3.580.000.891.12
      b3sec−3.370.000.631.56
      b6cont−2.730.000.921.07
        说明:t为统计量,elevation为海拔,DVI为差值植被指数,b6mean为第6波段均值纹理,b4ent为第4波段熵纹理,b3sec为第3波段角二阶矩纹理,b6cont为第6波段对比度纹理。

      Table 3.  Multicollinearity test

      在第2阶段对碳储量以变量相关性较大的因子进行RF的特征参数重要性评价,GTWR依赖共线性筛选的变量保证参数可解释性,GBRT引入重要性变量增强预测能力。而机器学习中,变量过多会对模型性能、训练效率及泛化能力产生多方面的负面影响。因此本研究选取重要性贡献度大于80%的变量,即第6波段差异性纹理(b6diss)、第4波段方差纹理(b4var)、第6波段(b6)、第6波段均值纹理(b4mean),以及第1阶段逐步回归变量和GTWR模型估算的碳储量(GTWR_tcl)作为机器学习的输入变量。

    • 空间自相关性检验用于评估研究区内变量的空间关联性,其系数能够量化变量在空间分布上的相互依赖程度[22]。通常采用全局莫兰指数(I)来判别[23],公式如下:

      式中:wij为空间权重,xi、xj分别为第i个样点和第j个样点的数据观察值,$ \bar{x} $为数据平均值。一般,I取值为[−1,1],越接近1表示空间自相关越强,越接近−1表示差异性越强,0表示在空间随机分布。

      表4可得:2012—2021年莫兰指数均大于0,P均小于0.01,表明森林碳储量在空间上存在显著聚集。

      年份 I Z得分 P
      2012 0.25 4.77 0.000
      2017 0.35 9.09 0.000
      2021 0.28 3.64 0.000

      Table 4.  Moran index of carbon stocks in “Three Parallel Rivers” region from 2012 to 2021

    • 以云南森林调查的样地数据为主要数据源,结合地形、遥感因子,并与碳储量建立单一GTWR、RF、GBRT及组合模型GTWR-RF、GTWR-GBRT。GTWR模型在考虑影响因子时空异质性的情况下,具有反演碳储量分布的优势。GBRT模型能够整合驱动因子间复杂的非线性关系,而不考虑变量之间的多重共线性问题,具有较高的预测性能。GTWR模型难以描述复杂的非线性关系,GBRT模型缺乏对异质性的考虑,组合模型可以有效避免单一模型的缺陷。用80%的样地数据进行模型构建,20%的样地数据进行精度验证。组合模型主要分为2个阶段,第1阶段通过多元线性回归选出适合GTWR模型的变量,得到具有时空特征的GTWR_tcl;第2阶段将第1阶段剔除的变量进行特征重要性分析,选择排前4的变量及第1阶段的变量纳入非线性模型中,构建研究区的最佳拟合模型并进行反演,以提高对森林碳储量的估测精度。

    • 为评价模型的可靠性与估计性能,采用10折交叉验证法,通过比较模型预测值与实际测量值来评估其预测精度。评价指标包括决定系数(R2)、相对均方根误差(rRMSE)及预测精度(A),R2越高表明模型拟合越好,而rRMSE越低,A越高,则表明预测精度越高。公式如下:

      式中:$ y_{i} $为实测值,$ {\hat{y}}_{i} $为模型预测值,i为第i个样点,n为总样点数。

    • 表5可知:GTWR模型的性能(R2=0.73)相对有限,这是由于GTWR为统计回归模型,虽能体现碳储量的时空相关性,但难以充分捕捉数据的复杂非线性特征。RF模型性能(R2=0.92)优于GTWR,能更稳定地捕捉碳储量与其影响因子间的复杂非线性关系,从而获得更稳健的预测结果。GBRT模型性能(R2=0.95)高于RF,关键在于它能通过加法模型与前向分步算法,进一步优化拟合。GTWR-RF模型(R2=0.95)的拟合效果优于单一模型,而GTWR-GBRT模型表现则更为突出,其R2达0.98,预测精度较GTWR-RF提升0.06,且rRMSE最低。这表明GTWR-GBRT模型在拟合与预测中均具有优势,尤其适用于兼具时空依赖性和非线性特征的复杂数据集。

      模型 拟合效果 预测效果
      R² rRMSE A
      GTWR 0.73 38.86 0.73
      RF 0.92 16.94 0.80
      GBRT 0.95 12.97 0.82
      GTWR-RF 0.95 14.28 0.84
      GTWR-GBRT 0.98 5.91 0.90

      Table 5.  Comparison of model fitting effects

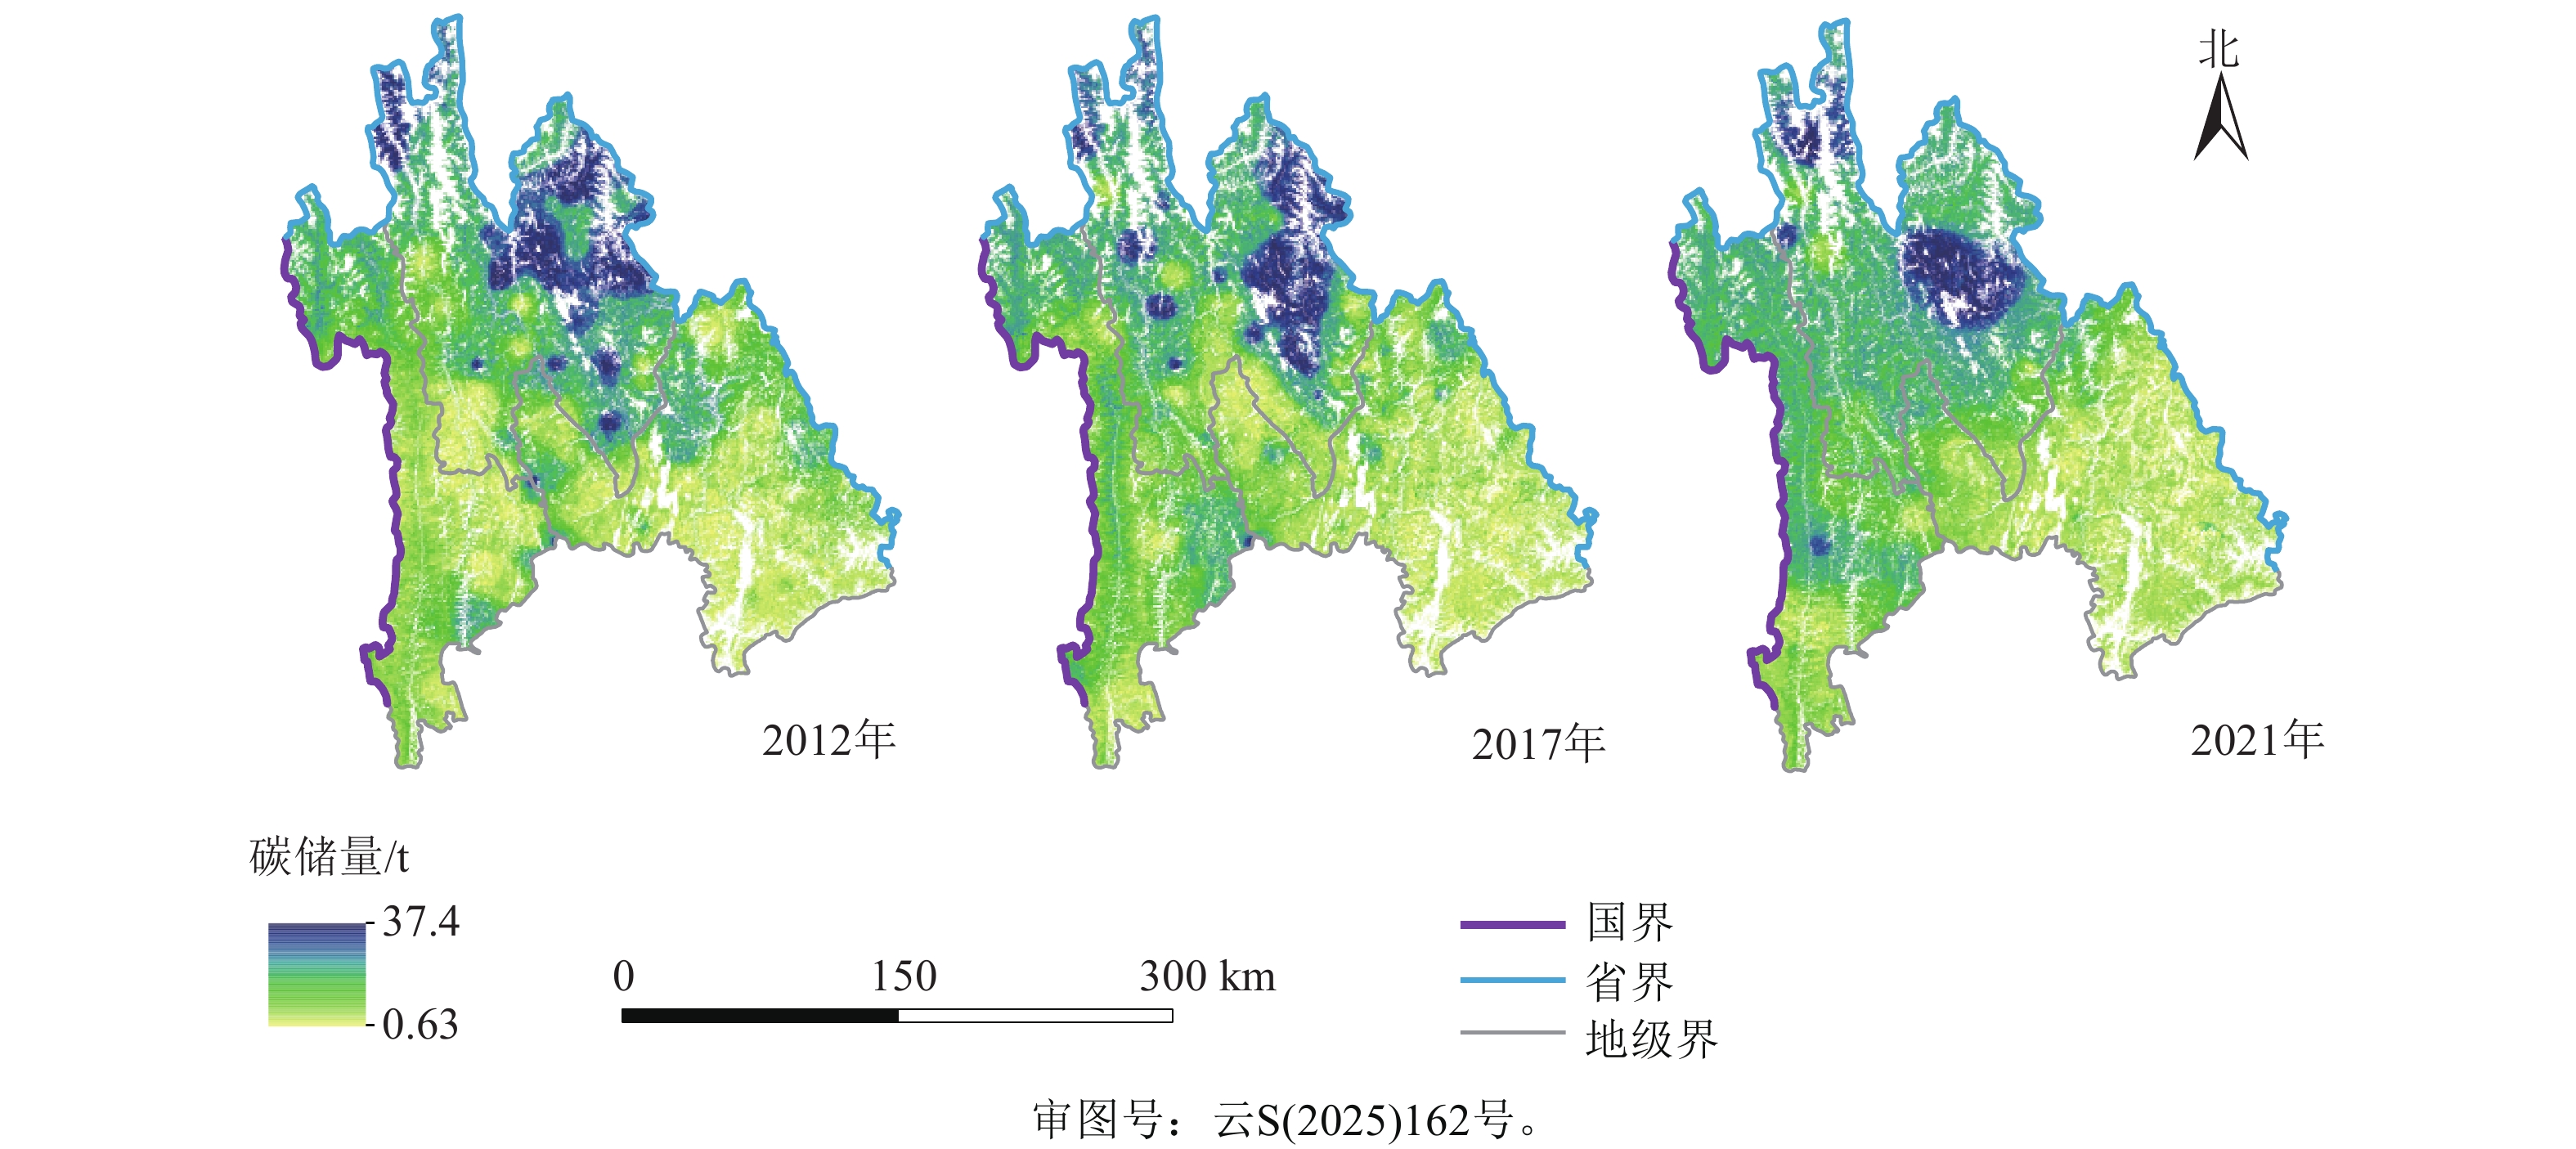
    • 根据GTWR-GBRT模型得到的估测结果,绘制2012—2021年“三江并流”区域的碳储量分布图(图2)。2012—2021年,研究区森林碳储量的高值区范围及整体空间格局呈现动态演变特征。从空间分布来看,碳储量整体呈现“西高东低,局部偏高”的格局,高值区主要分布在迪庆州,这与其地处横断山区、地形复杂、人类活动干扰少、原始森林保存完好密切相关;北部高碳储量区的连片性虽随年份有变化,但核心范围始终稳定,生态系统的基础稳定性形成了高效碳汇结构。与之形成对比的是,丽江碳储量总体偏低,其可能原因在于该地区旅游业发达,人类活动干扰对森林生态系统产生了潜在的影响;南部区域碳储量整体偏低且空间异质性较小,同样受到地形限制和人类活动(如开发、产业活动等)的双重影响。从时间演变看,空间格局变化明显。2012年高碳储量区范围相对广,说明当时区域生态系统碳汇能力较强;2017年,高碳储量区面积有所缩减,低碳储量区范围扩张,说明生态系统碳储存受干扰,可能是干旱、森林火灾或人类活动加剧,破坏植被、降低碳固定;2021年,高碳储量区有一定的恢复,主要得益于生态修复工程和天然林保护。

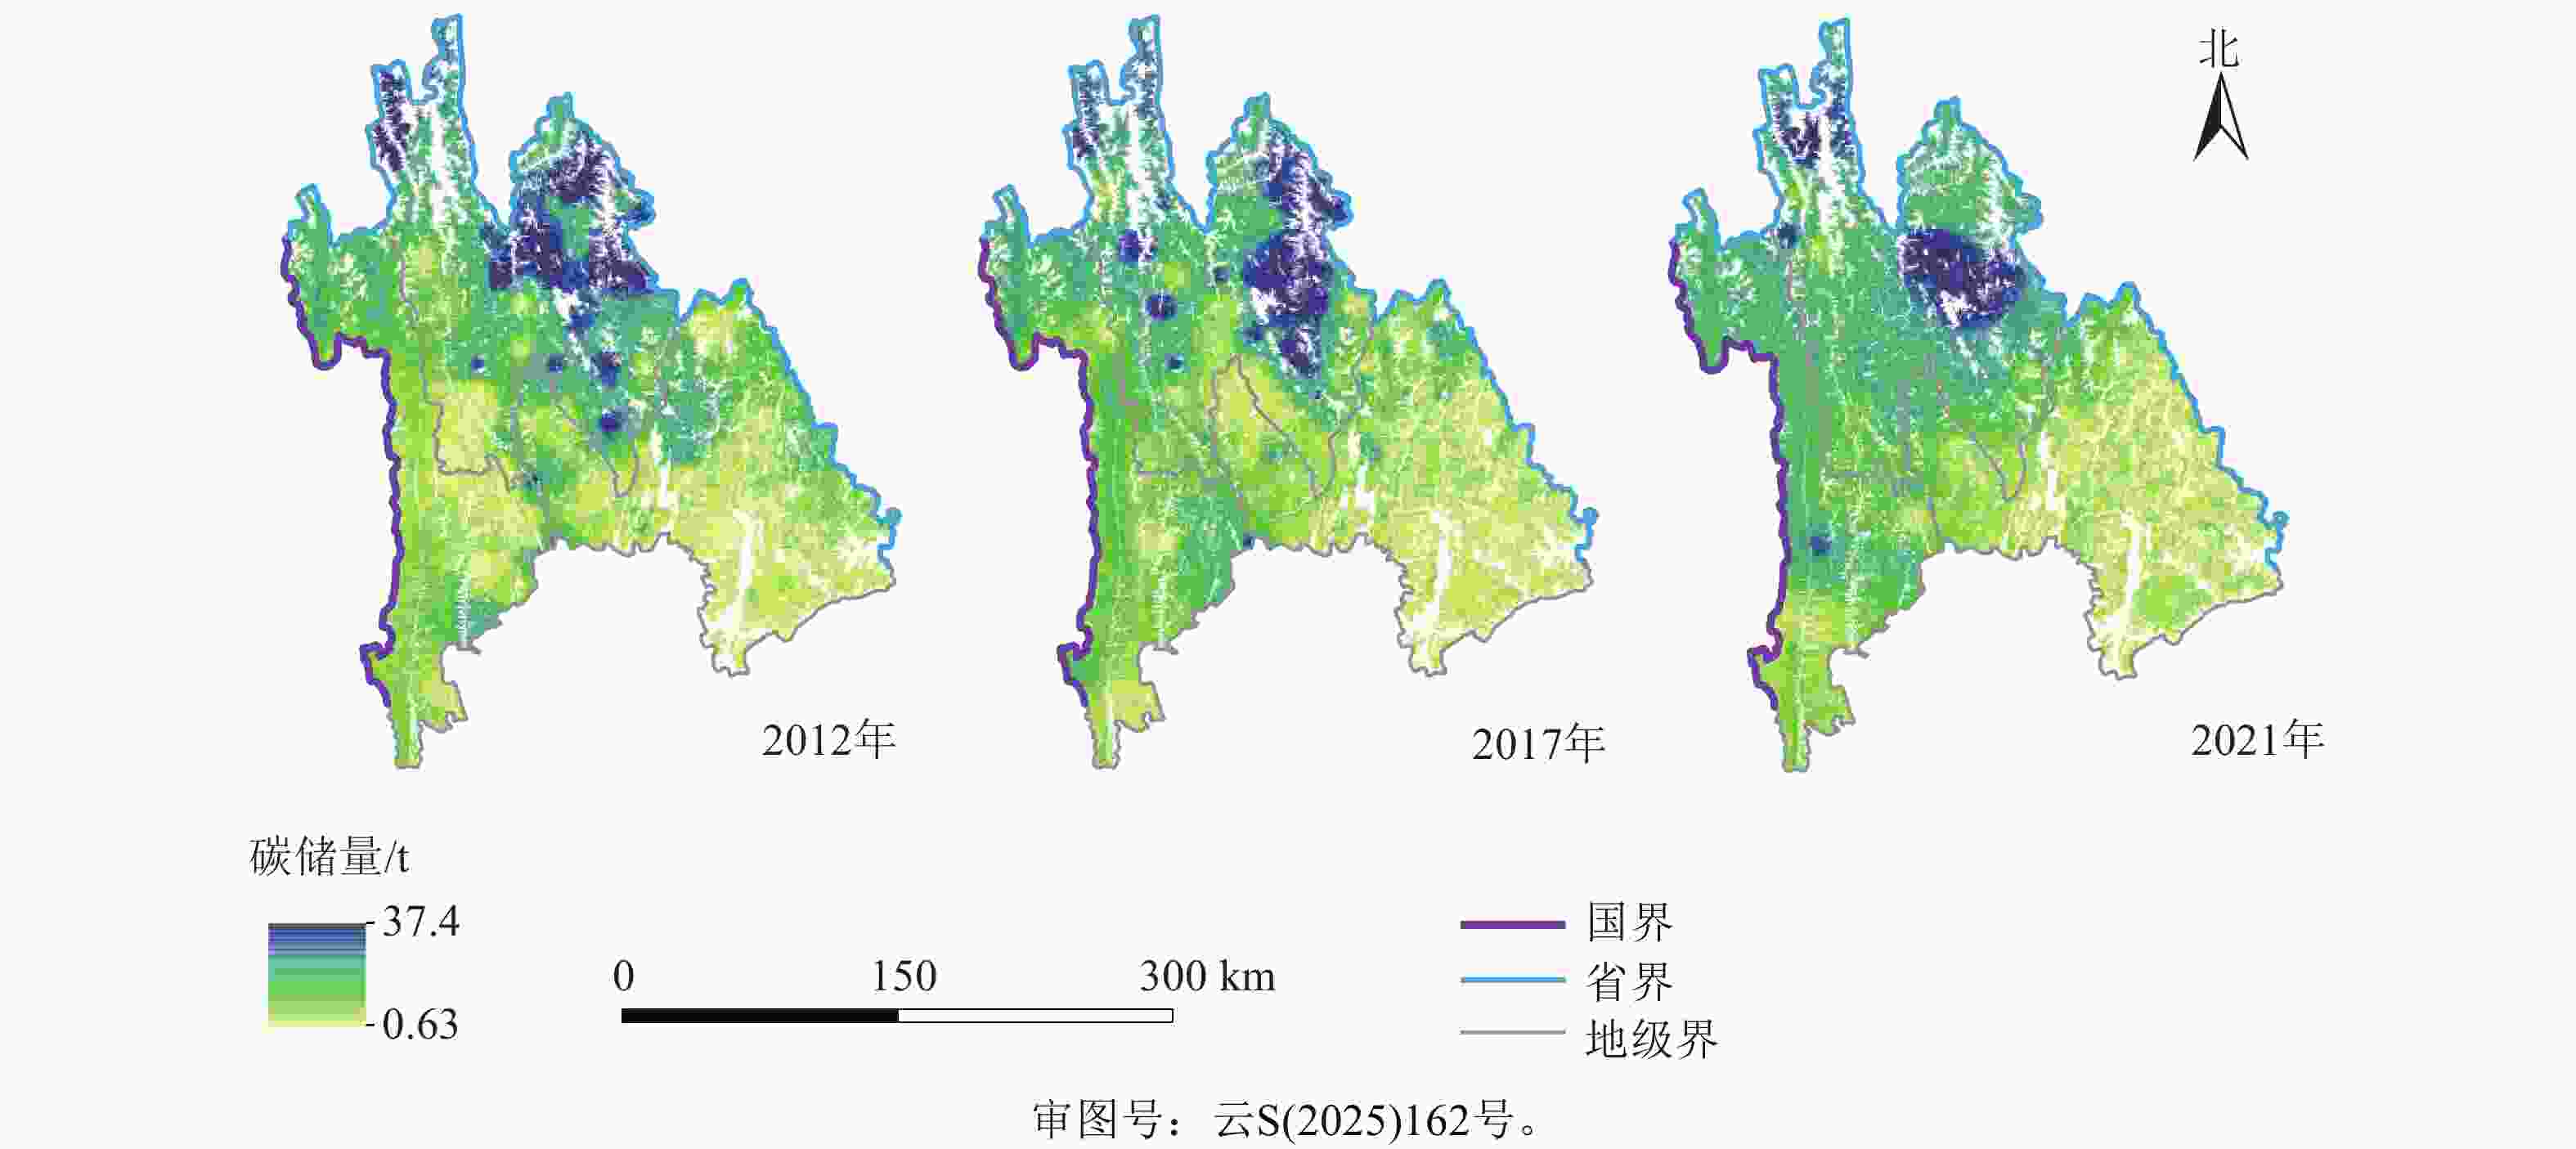
      Figure 2.  Spatial distribution map of predicted carbon stocks based on the GTWR-GBRT model

      表6可知:研究区碳储量呈现明显的海拔梯度分布特征,不同海拔梯度的碳储量占比在2012—2021年保持相对稳定,没有出现剧烈波动,表明其空间分布格局具有较高的稳定性。海拔梯度的变化会通过温度、光照和水分等环境因子的协同作用,直接或间接地影响森林碳储量。总体碳储量主要分布在海拔2 500 m以上,海拔高于3 500 m的碳储量占比最大,为33%。一般而言,高海拔地区因植被减少和生长缓慢,碳储量通常较低,而“三江并流”区域位于中国南部热带地区,雨量充沛,气温适宜,有利于林木生长,生态系统稳定,碳汇能力强。此外,这些地区的人为干扰相对较少,一定程度上降低了人类活动对林木生长的影响,碳储存潜力大,因此碳储量相对较高。

      海拔/m 碳储量占比/%
      2012年 2017年 2021年
      [695, 2 000) 6 7 7
      [2 000, 2500) 12 12 13
      [2500, 3000) 21 21 21
      [3000, 3500) 28 27 27
      [3500, 6584] 33 33 32

      Table 6.  Proportion of carbon stocks at different altitudes from 2012 to 2021
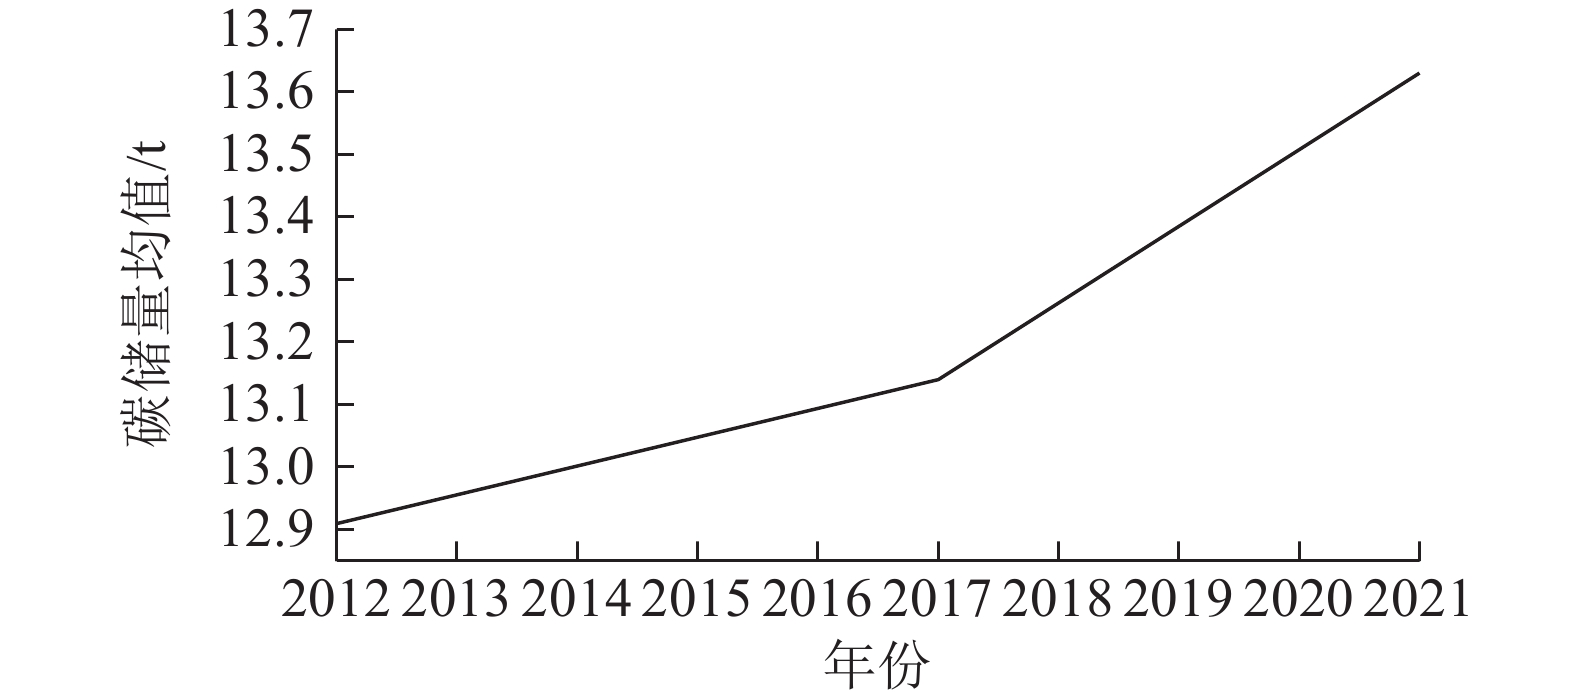
      根据模型预测碳储量均值变化(图3),2012年碳储量均值为12.91 t·hm−2,2017年为13.14 t·hm−2,2021年为13.63 t·hm−2,说明该区域碳储量呈现增长趋势。这得益于生态保护相关政策的持续推进,区域内可能有序开展植树造林、退化林修复、退耕还林等生态工程,过度砍伐、开垦等破坏植被的行为得到遏制,恢复随时间推移,树木持续生长发育,生物量不断累积,碳储存能力逐步增强,使得“三江并流”区域碳储量随年份呈现增长态势。

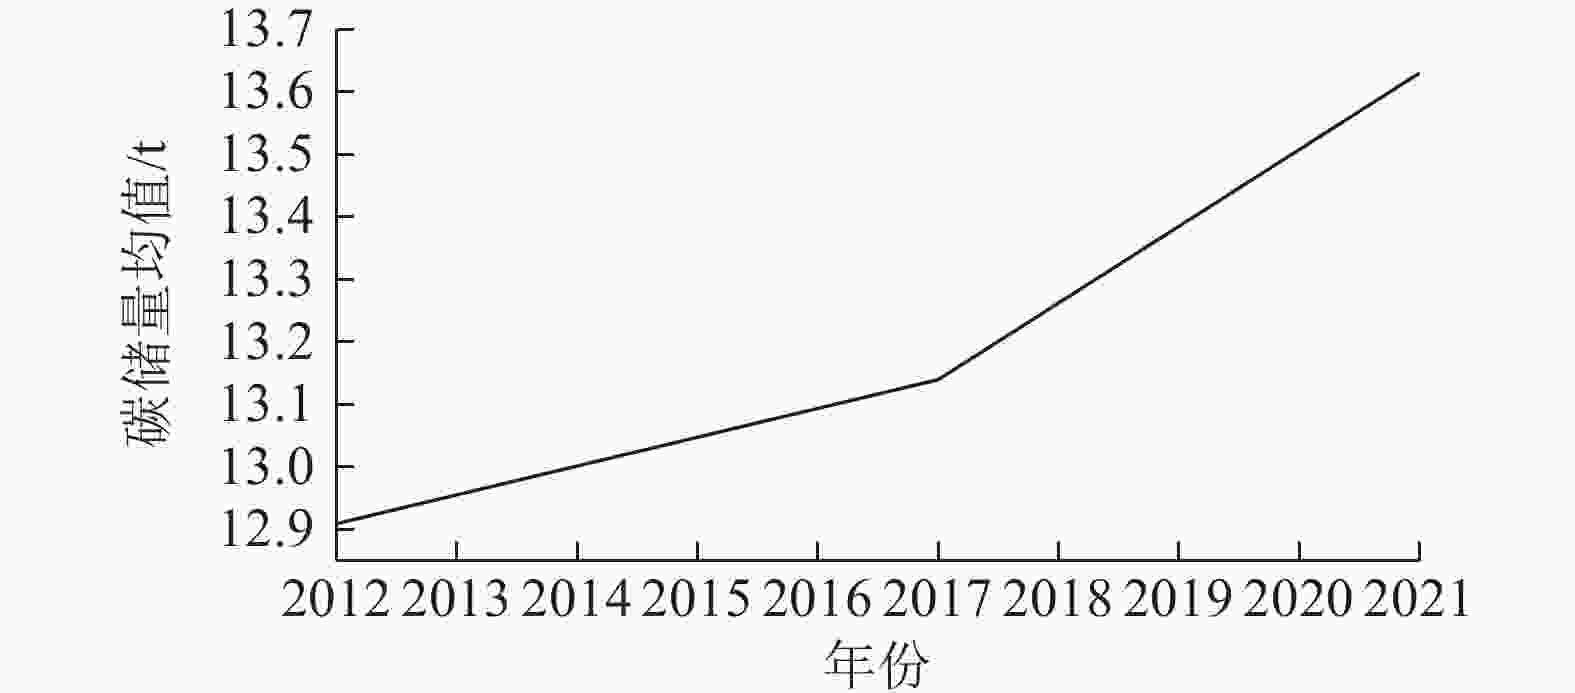
      Figure 3.  Trend of changes in mean carbon stocks estimation from 2012 to 2021

    • 传统GWR仅能刻画参数在空间维度的异质性。为同时捕捉时空动态,GTWR引入时间维度,使空间权重不仅依赖地理距离,还考虑时间序列上的关联性,进一步允许参数随时间变化,反映了时空异质性。然而,GTWR本质上仍是线性模型,对于复杂的非线性关系刻画能力有限[24]。为此,本研究引入GBRT,该算法通过集成多棵回归树,凭借高精度、灵活性和鲁棒性,成为机器学习中的核心算法之一[25],能更好拟合碳储量与变量之间的非线性关系。基于此,构建了GTWR-GBRT组合模型,其核心优势在于兼具时空动态建模的地理可解释性,与非线性关系的高精度拟合能力。本研究对比了GTWR、RF、GBRT及组合模型GTWR-RF、GTWR-GBRT,结果显示GTWR-GBRT组合模型的效果最佳,说明时空异质性模型结合非线性模型估测森林碳储量具有优势。

      研究区80%的碳储量普遍分布在海拔2 500 m以上,其中海拔3 500 m以上的碳储量占比最高,高达33%。西部的碳储量最高,而研究区属于云南西北部,由于该地区海拔高,人口稀疏且人为干扰小,植被保存较好,森林碳储量普遍高于东部地区,这表明地质环境条件和人类活动干扰是造成云南省碳储量差异的重要因素[26]。本研究结果与CHENG等[27]和梁瑄等[28]的估算结果一致:碳储量主要集中在滇西部的普洱市、迪庆州、西双版纳州和怒江州等地。此外,丽江市碳储量较低,这与范华鹏等[29]采用RF模型的预测结果相符。整体来看,在2012—2021年期间,2017年森林碳储量的高值分布较多,说明天然林资源保护,退耕还林、还草措施和重点防护林建设对森林碳储量的增加有一定的效果。总体而言,模型预测的碳储量均值说明该区域碳储量呈现增长趋势。结合空间分布来看,西部地区的碳储量最高,应优先在碳储量丰富的地区进行保护,以实现最佳的固碳效益,东部地区碳储量相对较少,可通过实施可持续森林管理做法来增加东部的碳储存。后续可加强低海拔地区植被恢复,同时重点保护高海拔地区脆弱生态系统(应对气候变化、减少人为干扰),巩固区域碳汇能力。

      在森林碳储量估算的过程中,传统光学遥感影像受饱和效应的影响,常存在低值被高估而高值被低估的情况,从而影响估算精度和反演结果。本研究利用Landsat卫星数据获取了遥感因子,虽然有长时间的遥感影像,但其分辨率为30 m,对森林碳储量的精准估测有一定的影响。穆喜云等[30]利用机载LiDAR遥感数据,使用RF构建预测模型及经典的统计方法-多元线性回归,对内蒙古大兴安岭生态站的森林碳储量进行估测,获得了比较理想的结果。此外,在模型构建方面,GTWR需要选择合适的带宽来保证时空加权估计的准确性,GBRT需调整树的数量、深度等参数。若联合调参不当可能导致过拟合或陷入局部最优。后续研究可以在优化模型参数的基础上,结合高分辨率数据,以获得最佳预测性能。

    • 为克服单一模型在捕捉时空异质性与非线性关系上的局限,本研究构建了两阶段GTWR-GBRT混合模型,融合GTWR的时空动态能力与GBRT的非线性拟合优势。该模型估算精度优于GTWR、GBRT、RF及GTWR-RF,说明同时考虑时空异质性与非线性特征是提升森林碳储量估算可靠性的关键。基于该模型估算结果,2012—2021年“三江并流”区域森林碳储量的空间格局呈“西高东低、局部集聚”,高海拔区域碳储量普遍较高,显示出明显的时空异质性。

Reference (30)

Catalog

    /

    DownLoad:  Full-Size Img  PowerPoint
    Return
    Return