Turn off MathJax
Article Contents

WANG Guiwei, ZHANG Yijing, ZHU Can, et al. Supply-demand driven evolution and optimization of socio-ecological security pattern in Hangzhou metropolitan circle[J]. Journal of Zhejiang A&F University, 2026, 43(X): 1−11 doi:  10.11833/j.issn.2095-0756.20260186
Citation: WANG Guiwei, ZHANG Yijing, ZHU Can, et al. Supply-demand driven evolution and optimization of socio-ecological security pattern in Hangzhou metropolitan circle[J]. Journal of Zhejiang A&F University, 2026, 43(X): 1−11 doi:  10.11833/j.issn.2095-0756.20260186

OnlineFirst articles are published online before they appear in a regular issue of the journal. Please find and download the full texts via CNKI.

Supply-demand driven evolution and optimization of socio-ecological security pattern in Hangzhou metropolitan circle

DOI: 10.11833/j.issn.2095-0756.20260186
  • Received Date: 2026-03-06
  • Accepted Date: 2026-07-31
  • Rev Recd Date: 2026-07-31
  • Available Online: 2026-09-16
  •   Objective  Integrating ecosystem service supply and demand into ecological security patterns has opened up a new approach for revealing the dynamic connections between ecological processes and societal activities.   Method  Taking Hangzhou metropolitan circle as a case study, this study used multi-source data (land use, ecological remote sensing, basic geographic data) and models (InVEST, ArcGIS, Linkage Mapper) to quantify five ecosystem services (carbon sequestration, water conservation, food production, habitat quality, landscape recreation) from 2004 to 2024. then extracted ecological corridors, ecological pinch points, and ecological barrier points from an ecological resistance surface, and supply-demand corridors from a movement resistance surface to construct a social-ecological security pattern, which was optimized by setting supply-demand nodes and extracting optimized corridors.   Result  (1) The matching of supply and demand of comprehensive ecosystem services formed a spatial pattern of “surplus in the west and deficit in the east.” Economic growth (absolute mean value of coefficient: 0.91) was the core driving force for the aggravation of supply and demand imbalance. (2) From 2004 to 2024, the ecological sources were greatly reduced by 2026.11 km2, and the demand sources were slightly reduced by 177.80 km2. (3) The ecological corridors in the western region were “long and concentrated” cobweb-like distribution, and the supply-demand corridors formed a “short and sparse” decentralized pattern. The number of pinch points increased by 20, and the number of barrier points increased by 13. (4) In 2024, 8 supply-demand nodes and 14 optimized corridors were identified. Based on the supply-demand relationship of ecosystem services and spatiotemporal characteristics of social-ecological security pattern in Hangzhou metropolitan circle in 2024, an optimized layout scheme of “three belts, three clusters and four zones” was formed.   Conclusion  This study reveals the spatial mismatch pattern of the social-ecological security pattern of the imbalance between supply and demand of ecosystem services in Hangzhou metropolitan circle. Future efforts should protect the western ecological source areas, restore the broken corridors in the central region, and regulate the demand hotspots in the eastern region, driving the social-ecological system from spatial alignment toward functional synergy. [Ch, 5 fig. 3 tab. 35 ref.]
  • [1] QIN Huiyan, HU Yueting, HUANG Yingli.  Coupling coordination relationship between ecosystem services and local people’s well-being in Northeast Tiger and Leopard National Park from the perspective of residents’ perception . Journal of Zhejiang A&F University, doi: 10.11833/j.issn.2095-0756.20250202
    [2] YU Wenjing, LI Jian, HAN Liuwei, LI Jiaxin.  Optimization of the ecological network in Hangzhou based on coupling of ecosystem service supply-demand matching and topological structure . Journal of Zhejiang A&F University, doi: 10.11833/j.issn.2095-0756.20260140
    [3] DONG Yuanliang, SUN Yingying, PAN Chengcheng, JIN Xiulong.  Research on rural landscape zoning in Chuzhou City based on landscape characteristics and ecosystem services . Journal of Zhejiang A&F University, doi: 10.11833/j.issn.2095-0756.20250167
    [4] LI Ling, WANG Zhen, WANG Keqin, LI Yiran, LI Xuanping, MA Yanbo, YANG Jin, FENG Xiaowen.  Ecosystem service assessment and multi-scenario simulation in southwest alpine canyon region . Journal of Zhejiang A&F University, doi: 10.11833/j.issn.2095-0756.20240590
    [5] LI Ting, LI Chaokui, CONG Zheng, FENG Yuanyuan, MAO Yan.  Construction and optimization of ecological network pattern in Daye mining area based on remote sensing ecological index . Journal of Zhejiang A&F University, doi: 10.11833/j.issn.2095-0756.20240484
    [6] MENG Xueyuan, CHEN Gang, ZHENG Zhiyuan.  Spatiotemporal response of ecosystem service value to land use changes in national key ecological functional areas . Journal of Zhejiang A&F University, doi: 10.11833/j.issn.2095-0756.20230506
    [7] ZHU Chenghao, WANG Jianwu, XIE Binglou, WU Xiaonan, LUO Yibo.  City-county synchronized assessing and accuracy control of forest ecosystem services . Journal of Zhejiang A&F University, doi: 10.11833/j.issn.2095-0756.20210328
    [8] YANG Kaiye, GONG Hede, LI Jing, LIU Yuntong, SHA Liqing, SONG Qinghai, JIN Yanqiang, YANG Daxin, LI Peiguang, WEN Guojing, CHEN Aiguo, PANG Zhiqiang, ZHANG Yiping.  Dynamic characteristics of soil respiration of Savanna ecosystem in dry hot valley of Yuanjiang . Journal of Zhejiang A&F University, doi: 10.11833/j.issn.2095-0756.20190647
    [9] LIU Yuqing, ZHANG Huabing, ZHANG Yunfeng.  Spatio-temporal variation of ecosystem services value in Yancheng coastal zone . Journal of Zhejiang A&F University, doi: 10.11833/j.issn.2095-0756.2019.04.018
    [10] LI Nan, LI Longwei, ZHANG Yinlong, LU Dengsheng, WU Ming.  Changes of ecosystem services value of Hangzhou Bay Coastal Wetland . Journal of Zhejiang A&F University, doi: 10.11833/j.issn.2095-0756.2019.01.015
    [11] GAO Changjun, WEI Long, JIA Peng, TIAN Huiling, LI Shuguang.  Coastal wetland ecosystem evaluation in Guangdong Province by eliminating the double counting . Journal of Zhejiang A&F University, doi: 10.11833/j.issn.2095-0756.2017.01.021
    [12] WEI Yunlong, CAI Jianguo.  Evaluation and sustainable development on ecological service value for urban green space system in Hangzhou City . Journal of Zhejiang A&F University, doi: 10.11833/j.issn.2095-0756.2017.04.016
    [13] DUAN Yanbo, LEI Yakai, MA Ge, WU Baojun, TIAN Guohang.  Spatio-temporal dynamics of ecosystem service value in Zhengzhou . Journal of Zhejiang A&F University, doi: 10.11833/j.issn.2095-0756.2017.03.017
    [14] YANG Jie, XIANG Tingting, JIANG Peikun, WU Jiasen, KE Hejia.  Phytolith-occluded organic carbon accumulation and distribution in a Dendrocalamopsis oldhami bamboo stand ecosystem . Journal of Zhejiang A&F University, doi: 10.11833/j.issn.2095-0756.2016.02.006
    [15] CAI Xia, WANG Zu-hua, CHEN Li-juan.  Zoning with spatial division of forest ecosystem services in Chun’an County,Zhejiang Province . Journal of Zhejiang A&F University, doi: 10.11833/j.issn.2095-0756.2011.05.007
    [16] 杨廉雁, 张树斌, 郑征.  Research progress on the hollow-bearing trees in forest ecosystems . Journal of Zhejiang A&F University, doi: 10.11833/j.issn.2095-0756.2010.06.021
    [17] WANG Zu-hua, CAI Liang-liang, GUAN Qing-wei, CAI Xia.  Evaluation of forest ecosystem services in Chun’an County . Journal of Zhejiang A&F University, doi: 10.11833/j.issn.2095-0756.2010.05.019
    [18] WANG Bin, YANG Xiao-sheng, ZHANG Biao, LIU Mou-cheng.  Dynamics of ecosystem services in China during 1973 - 2003 . Journal of Zhejiang A&F University,
    [19] BAI Jiang-li, PENG Dao-li, YU Xiao-hong.  Research progress of the restoration and reconstruction of degraded ecosystems . Journal of Zhejiang A&F University,
    [20] CHEN Jin-lin, WU Chun-lin, JIANG Zhi-lin, XU Xin-jian.  Litter decomposition and phosphorus release in an oak forest ecosystem . Journal of Zhejiang A&F University,
  • [1]
    GRÊT-REGAMEY A, HUBER S H, HUBER R. Actors’ diversity and the resilience of social-ecological systems to global change[J]. Nature Sustainability, 2019, 2(4): 290−297. DOI: 10.1038/s41893-019-0236-z.
    [2]
    DONG Yuanliang, SUN Yingying, PAN Chengcheng, et al. Research on rural landscape zoning in Chuzhou City based on landscape characteristics and ecosystem services[J]. Journal of Zhejiang A&F University, 2025, 42(6): 1285−1295. DOI: 10.11833/j.issn.2095-0756.20250167.
    [3]
    LIU Wenjun, MA Xiangyi, SUN Qian, et al. Quantification and flow simulation of ecosystem service supply and demand in the Yellow River Delta high-efficiency eco-economic zone[J]. Land, 2024, 13(11): 1784. DOI: 10.3390/land13111784.
    [4]
    LI Ling, WANG Zhen, WANG Keqin, et al. Ecosystem service assessment and multi-scenario simulation in southwest Alpine canyon region[J]. Journal of Zhejiang A&F University, 2025, 42(4): 813−824. DOI: 10.11833/j.issn.2095-0756.20240590.
    [5]
    LIU Qian, ZHOU Yinghong, CHEN Yumeng, et al. Spatiotemporal dynamics of habitat quality supply and demand and service-oriented ecological network construction in Southwest China[J]. Acta Ecologica Sinica, 2026, 46(1): 358−375. DOI: 10.20103/j.stxb.202505301353.
    [6]
    LI Long, HUANG Xianjin, WU Dafang, et al. Construction of ecological security pattern adapting to future land use change in Pearl River Delta, China[J]. Applied Geography, 2023, 154: 102946. DOI: 10.1016/j.apgeog.2023.102946.
    [7]
    SONG Guiguan, ZHANG Xiaoping. Construction of ecological security pattern for Gansu section of Yellow River Basin based on “source-resistance-corridor” paradigm[J]. Research of Soil and Water Conservation, 2026, 33(1): 273−283. DOI: 10.13869/j.cnki.rswc.2026.01.016.
    [8]
    ZHUANG Baoyi, SUN Chuanzhun, ZHI Jiedi, et al. Regional ecological network construction for ecological well-being: a case study of the Guangdong-Hong Kong-Macao Greater Bay Area[J]. Acta Ecologica Sinica, 2025, 45(24): 12453−12469. DOI: 10.20103/j.stxb.202505151187.
    [9]
    WU Shiyu, ZHAO Chong, YANG Lin, et al. Spatial and temporal evolution analysis of ecological security pattern in Hubei Province based on ecosystem service supply and demand analysis[J]. Ecological Indicators, 2024, 162: 112051. DOI: 10.1016/j.ecolind.2024.112051.
    [10]
    FAN Qiang, SUI Shuqi, ZHANG Jinning. Construction and optimization of ecological security pattern in Chifeng based on “supply-demand balance-sensitivity-connectivity”[J]. Environmental Science, 2025, 46(4): 2450−2462. DOI: 10.13227/j.hjkx.202403214.
    [11]
    GAO Xing, GUO Zhongyuan, ZHANG Mengmeng, et al. Ecological source identification and ecological security pattern construction from the perspective of ecosystem service supply and demand: a case study of Baiyangdian Basin in China[J]. Environment, Development and Sustainability, 2025, 27(9): 22947−22970. DOI: 10.1007/s10668-024-05302-0.
    [12]
    LIU Huayan, ZHU Jianhua, ZENG Lixiong, et al. Identification of urban ecological security pattern based on ecosystem services supply–demand[J]. Ecosystem Health and Sustainability, 2024, 10: 146. DOI: 10.34133/ehs.0146.
    [13]
    HAN Yuexia, DONG Bin, ZHU Ruoqing, et al. Construction of ecological security pattern in Anhui Province from the perspective of ecosystem service supply and demand[J]. Journal of Soil and Water Conservation, 2025, 39(5): 322−334. DOI: 10.13870/j.cnki.stbcxb.2025.05.038.
    [14]
    CAI Yuchi, LI Hong, LI Wancong. Optimization of a “social-ecological” system pattern from the perspective of ecosystem service supply and demand: a case study of Jilin Province[J]. Land, 2024, 13(10): 1716. DOI: 10.3390/land13101716.
    [15]
    LIANG Kunyu, JIN Xiaobin, ZHANG Xiaolin, et al. Construction of ecological security patterns coupling supply and demand of ecosystem services: a case study of Southern Jiangsu Province[J]. Acta Ecologica Sinica, 2024, 44(9): 3880−3896. DOI: 10.20103/j.stxb.202307271608.
    [16]
    LI Daqiang, ZHANG Feiyun, ZHOU Hongtao, et al. Construction of ecological security pattern of urban agglomeration in the northern slope of Tianshan, Xinjiang based on the supply and demand of ecosystem services[J]. China Environmental Science, 2025, 45(8): 4706−4714. DOI: 10.3969/j.issn.1000-6923.2025.08.055.
    [17]
    ZHANG Yunlong, ZHAO Zhengyuan, FU Bojie, et al. Identifying ecological security patterns based on the supply, demand and sensitivity of ecosystem service: a case study in the Yellow River Basin, China[J]. Journal of Environmental Management, 2022, 315: 115158. DOI: 10.1016/j.jenvman.2022.115158.
    [18]
    ZENG Xinglan, CHEN Tiantian. Construction and optimization of ecological security network in Guizhou Province of China based on ecosystem service supply and demand[J]. Mountain Research, 2023, 41(4): 493−507. DOI: 10.16089/j.cnki.1008-2786.000765.
    [19]
    KE Qinhua, ZHOU Qiaowei, ZHUANG Baoyi, et al. Construction of ecological security pattern in Guangdong-Hong Kong-Macao Greater Bay Area based on the balance of ecosystem services supply and demand[J]. Acta Ecologica Sinica, 2024, 44(5): 1765−1779. DOI: 10.20103/j.stxb.202305221071.
    [20]
    YAN Fapeng, SHANGGUAN Wei, ZHANG Jing, et al. Depth-to-bedrock map of China at a spatial resolution of 100 meters[J]. Scientific Data, 2020, 7: 2. DOI: 10.1038/s41597-019-0345-6.
    [21]
    Millennium Ecosystem Assessment. Ecosystems and Human Well-being: Current State and Trends[M]. Washington, D. C. : Island Press, 2005.
    [22]
    CHEN Yian, HU Baoqun, TANG Jianglong, et al. Analysis of evolution and influencing factors of ecological security patterns in Nanchang City under the trade-off between ecosystem service supply and demand[J]. Environmental Science, 2025, 46(11): 7316−7328. DOI: 10.13227/j.hjkx.202410013.
    [23]
    ZHANG Yimin, ZHANG Shuyi, ZHU Hongkai, et al. Construction and optimization of the ecological security pattern in metropolitan areas based on the supply and demand of ecosystem services at multiple scales[J]. Acta Ecologica Sinica, 2024, 44(21): 9596−9609. DOI: 10.20103/j.stxb.202310182269.
    [24]
    QIU Da’e, ZHANG Junyi, YANG Xiaoxue. Construction of ecological security pattern in Sichuan Basin based on the supply and demand of ecological services at different demand levels[J]. China Environmental Science, 2025, 45(6): 3343−3358. DOI: 10.3969/j.issn.1000-6923.2025.06.040.
    [25]
    JIANG Hong, PENG Jian, XU Dongmei, et al. Constructing ecological security patterns with differentiated management intensity based on multifunctional landscape identification and multi-criteria decision-making[J]. Global Ecology and Conservation, 2024, 50: e02862. DOI: 10.1016/j.gecco.2024.e02862.
    [26]
    JIANG Hong, PENG Jian, DONG Jianquan, et al. Linking ecological background and demand to identify ecological security patterns across the Guangdong-Hong Kong-Macao Greater Bay Area in China[J]. Landscape Ecology, 2021, 36(7): 2135−2150. DOI: 10.1007/s10980-021-01234-6.
    [27]
    AVON C, BERGÈS L. Prioritization of habitat patches for landscape connectivity conservation differs between least-cost and resistance distances[J]. Landscape Ecology, 2016, 31(7): 1551−1565. DOI: 10.1007/s10980-015-0336-8.
    [28]
    HAN Lei, HU Zijie, KANG Hongliang, et al. Construction of socio-ecological security pattern based on the supply and demand of ecosystem services: a case study of the Loess hilly and gully region[J]. Acta Ecologica Sinica, 2026, 46(8): 3969−3984. DOI: 10.20103/j.stxb.202504080813.
    [29]
    PENG Jian, TIAN Lu, LIU Yanxu, et al. Ecosystem services response to urbanization in metropolitan areas: thresholds identification[J]. Science of the Total Environment, 2017, 607-608: 706−714. DOI: 10.1016/j.scitotenv.2017.06.218.
    [30]
    MCRAE B H, HALL S A, BEIER P, et al. Where to restore ecological connectivity? detecting barriers and quantifying restoration benefits[J]. PLoS One, 2012, 7(12): e52604. DOI: 10.1371/journal.pone.0052604.
    [31]
    WANG Xiaobao, ZHAO Xiaoqing, RAN Yuju, et al. Sustainable management of plateau mountainous urban agglomerations based on the ecosystem services supply-demand balance: application of scale and threshold effects[J]. Journal of Cleaner Production, 2026, 556: 148141. DOI: 10.1016/j.jclepro.2026.148141.
    [32]
    JIA Qiqi, JIAO Limin, LIAN Xihong, et al. Linking supply-demand balance of ecosystem services to identify ecological security patterns in urban agglomerations[J]. Sustainable Cities and Society, 2023, 92: 104497. DOI: 10.1016/j.scs.2023.104497.
    [33]
    WANG Xinmei, QIU Xiaoling, WANG Zeni, et al. Construction of a social ecological security pattern based on the supply and demand of ecosystem services[J]. Journal for Nature Conservation, 2025, 86: 126962. DOI: 10.1016/j.jnc.2025.126962.
    [34]
    YE Fanni, FANG Xinzhuo, GONG Bikai. Ecological security patterns in the Shaanxi-Gansu-Ningxia region from the perspective of matching the supply and demand of ecosystem services[J]. Arid Zone Research, 2026, 43(1): 188−199. DOI: 10.13866/j.azr.2026.01.17.
    [35]
    HUANG Xiaoyi. Ecological Security Pattern of the Yangtze River Delta Based on Ecosystem Service Supply and Demand [D]. Shanghai: Shanghai Normal University, 2024. DOI:10.27312/d.cnki.gshsu.2024.001338.
  • 加载中
通讯作者: 陈斌, bchen63@163.com
  • 1. 

    沈阳化工大学材料科学与工程学院 沈阳 110142

  1. 本站搜索
  2. 百度学术搜索
  3. 万方数据库搜索
  4. CNKI搜索

Figures(5)  / Tables(3)

Article views(97) PDF downloads(12) Cited by()

Related
Proportional views

Supply-demand driven evolution and optimization of socio-ecological security pattern in Hangzhou metropolitan circle

doi: 10.11833/j.issn.2095-0756.20260186

Abstract:   Objective  Integrating ecosystem service supply and demand into ecological security patterns has opened up a new approach for revealing the dynamic connections between ecological processes and societal activities.   Method  Taking Hangzhou metropolitan circle as a case study, this study used multi-source data (land use, ecological remote sensing, basic geographic data) and models (InVEST, ArcGIS, Linkage Mapper) to quantify five ecosystem services (carbon sequestration, water conservation, food production, habitat quality, landscape recreation) from 2004 to 2024. then extracted ecological corridors, ecological pinch points, and ecological barrier points from an ecological resistance surface, and supply-demand corridors from a movement resistance surface to construct a social-ecological security pattern, which was optimized by setting supply-demand nodes and extracting optimized corridors.   Result  (1) The matching of supply and demand of comprehensive ecosystem services formed a spatial pattern of “surplus in the west and deficit in the east.” Economic growth (absolute mean value of coefficient: 0.91) was the core driving force for the aggravation of supply and demand imbalance. (2) From 2004 to 2024, the ecological sources were greatly reduced by 2026.11 km2, and the demand sources were slightly reduced by 177.80 km2. (3) The ecological corridors in the western region were “long and concentrated” cobweb-like distribution, and the supply-demand corridors formed a “short and sparse” decentralized pattern. The number of pinch points increased by 20, and the number of barrier points increased by 13. (4) In 2024, 8 supply-demand nodes and 14 optimized corridors were identified. Based on the supply-demand relationship of ecosystem services and spatiotemporal characteristics of social-ecological security pattern in Hangzhou metropolitan circle in 2024, an optimized layout scheme of “three belts, three clusters and four zones” was formed.   Conclusion  This study reveals the spatial mismatch pattern of the social-ecological security pattern of the imbalance between supply and demand of ecosystem services in Hangzhou metropolitan circle. Future efforts should protect the western ecological source areas, restore the broken corridors in the central region, and regulate the demand hotspots in the eastern region, driving the social-ecological system from spatial alignment toward functional synergy. [Ch, 5 fig. 3 tab. 35 ref.]

WANG Guiwei, ZHANG Yijing, ZHU Can, et al. Supply-demand driven evolution and optimization of socio-ecological security pattern in Hangzhou metropolitan circle[J]. Journal of Zhejiang A&F University, 2026, 43(X): 1−11 doi:  10.11833/j.issn.2095-0756.20260186
Citation: WANG Guiwei, ZHANG Yijing, ZHU Can, et al. Supply-demand driven evolution and optimization of socio-ecological security pattern in Hangzhou metropolitan circle[J]. Journal of Zhejiang A&F University, 2026, 43(X): 1−11 doi:  10.11833/j.issn.2095-0756.20260186
  • 生态系统服务作为连接人类社会与自然生态系统的关键纽带,保障其供应能力来平衡人类需求,对维护区域生态安全与可持续发展至关重要[1–2]。随着城市化进程加快,引发了生境破坏、生态系统服务功能退化及生态系统服务供需空间错配等一系列生态问题[3−5]。生态安全格局通过识别、修复及重构关键生态要素,优化生态系统服务供给,成为保障区域生态安全的重要手段[6]。传统生态安全格局研究形成了“源地-阻力面-廊道”的经典范式,聚焦于维持自然生态系统结构和功能的完整性[7]。当前随着人类福祉提升逐步成为全球可持续发展议程中的核心议题[8],生态安全格局研究开始向探索自然生态基底与人类经济活动耦合协同,构建以生态系统服务供需理论为核心的生态安全格局方向发展。研究主要分为3个方面:一是以生态系统服务供需评估为基础,选取供需耦合条件好的斑块或结合生态敏感性、景观连通性及生态风险等指数,筛选高质量生态斑块作为生态源地,以此为起始点构建生态安全格局[9−11]。这类研究虽将人类需求作为重要的考虑因素,但未刻画供给与需求区域之间有效路径,无法反映两者之间的流动联系;二是考虑生态系统服务从供给向需求的流动特征,结合供给、需求及供需比指数选取生态源地和需求源地。提取连接生态源地的生态廊道和连接生态源地与需求源地的供需廊道[12–13],为缓解供需空间错配提供了新思路。这类研究通常采用同一套阻力面来构建不同类型的廊道,但未充分考虑人类获取生态系统服务的可达性,难以区分自然生态过程和社会经济过程的阻抗作用;三是通过构建生态阻力面来提取生态廊道,构建表征人类获取生态系统服务可达性的移动阻力面来提取供需廊道[14–15]。这类研究普遍采用人口密度、国内生产总值(gross domestic product, GDP)及土地利用强度等指标构建统一的评估体系,间接反映人类需求,难以区分不同类型生态系统服务需求和空间位置。研究尺度上多聚焦于区域尺度[16]、自然地理单元尺度[17]及行政尺度[18]。都市圈尺度下以生态系统服务供需理论为核心的生态安全格局研究多基于静态或单期数据,以识别供需耦合条件好的生态源地来构建生态安全格局[19],缺乏聚焦人类生态需求的需求源地和供需廊道的系统性识别。本研究以杭州都市圈为研究对象,基于2004—2024年土地利用数据、生态遥感数据及基础地理数据等多源数据,量化碳固存、水源涵养、粮食生产、生境质量及景观游憩5类生态系统服务的供需动态,精准刻画不同类型生态系统服务供给和需求的空间位置。通过构建差异化的生态阻力面和移动阻力面来提取生态廊道与供需廊道并行的双网络结构,识别关键供需节点并优化网络结构,最终形成“社会-生态”协同的复合社会-生态安全格局,以期为城市化水平不均衡都市圈的“社会-生态系统”协同治理提供科学依据。

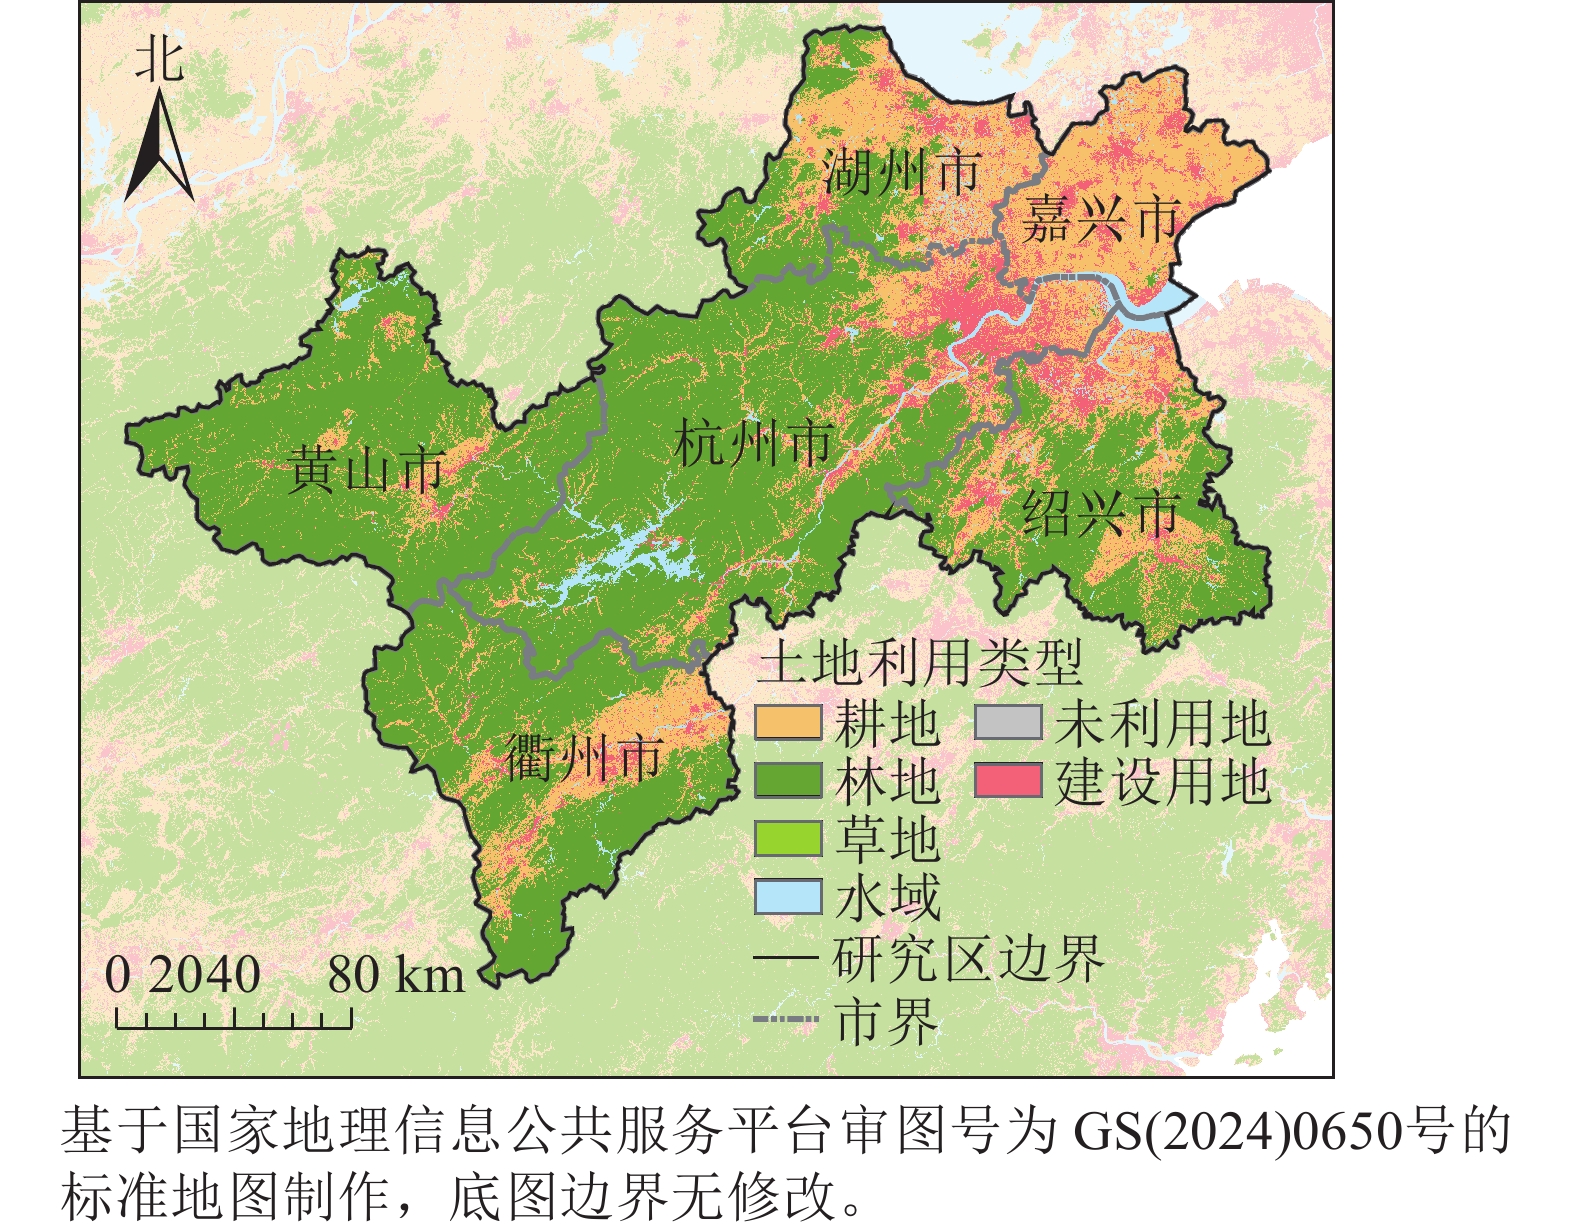
    • 杭州都市圈地跨浙皖两省,是长三角打造的以杭州为中心,联结湖州、嘉兴、绍兴、衢州、黄山五市的“金南翼”(图1)。规划总面积为53 239.00 km2,其中,耕地13 723.88 km2、林地33 493.33 km2、水域1 799.99 km2。整体地势西南高、东北低,地貌涵盖西部天目山-千里岗山地的中山丘陵、中部杭嘉湖-宁绍平原水网及东部杭州湾沿岸滨海湿地。截至2024年末,杭州都市圈常住人口为2 545.56万,比上年末增加18.49万,城镇人口为2 115.20万,占常住人口的83.09%,地区生产总值达4.54万亿元,是中国东部人口最稠密、经济活动最活跃的区域之一。
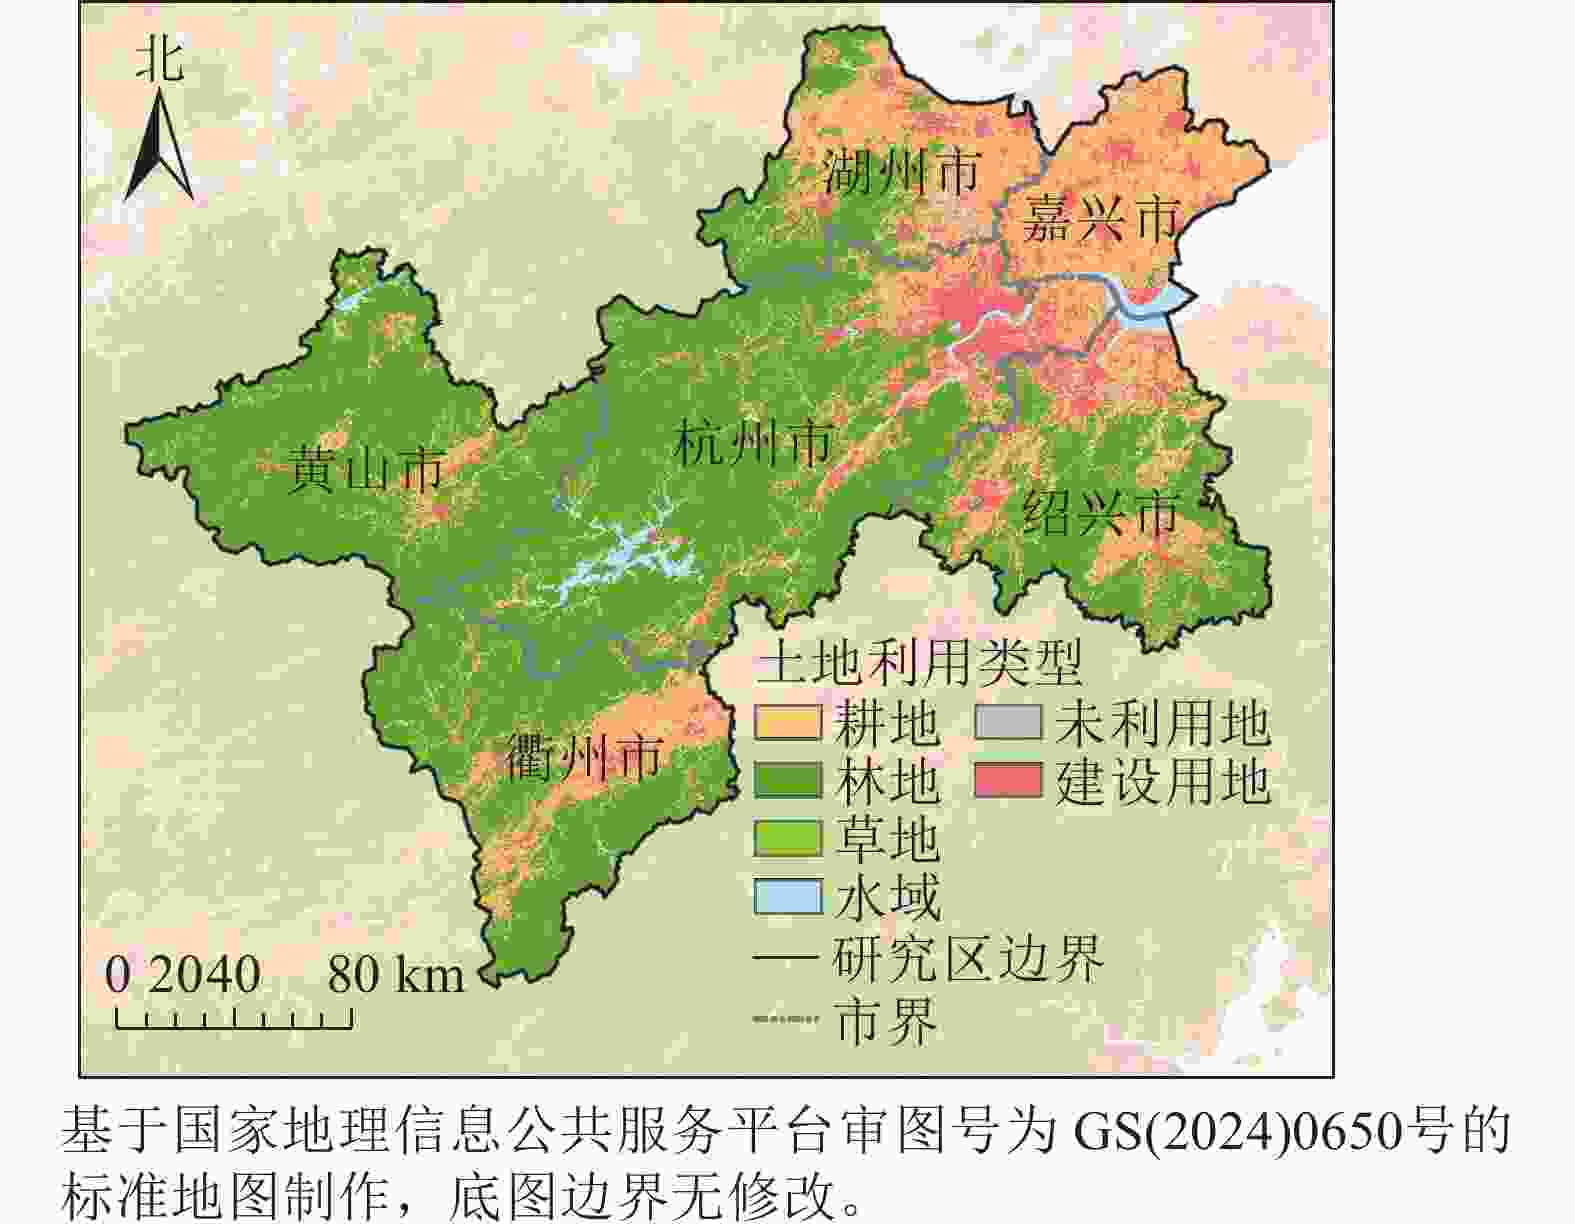
      Figure 1.  General situation of the study area

      鉴于钱塘江水系发源于黄山北源新安江和衢州南源兰江,流经杭州、湖州、嘉兴、绍兴等市域入海,将六市串联为“源头保护-中游利用-下游修复”的完整功能链条,为量化生态安全格局供给与需求源地间流动过程提供天然场地。考虑到该区域西部山区森林覆盖率高,是碳固存、水源涵养及生境质量等服务的主要供给区;中东部平原城镇人口和产业高度集聚,对粮食生产、休闲游憩等服务需求持续攀升,是探究生态系统服务供需错配的典型代表。依据“整体保护、系统修复”理念,该区域跨省域的空间尺度实现了从局部治理向区域协同的范式转型。综上,杭州都市圈为探究生态系统服务供需错配、构建面向整体保护和系统修复的复合社会-生态安全格局,提供了代表性案例。

    • 本研究整合自然地理、气象数据、遥感影像及社会经济数据等多源数据,定量评估生态系统服务供需格局,构建社会-生态安全格局。数据来源如表1所示,所有数据集均以土地利用数据为基准进行空间分辨率和坐标系统一。

      数据类型 数据来源 数据精度
      土地利用类型 中国土地覆盖数据集 30 m
      数字高程模型 地理空间数据云ASTER GDEM 90 m
      归一化植被指数 美国国家航空航天局(NASA)地球观测数据 1 km
      降水量 国家冰川冻土沙漠科学数据中心 1 km
      潜在蒸散量 国家冰川冻土沙漠科学数据中心 1 km
      土壤数据 世界土壤数据库土壤数据集 1 km
      根限制层深度 [20] 100 m
      夜间灯光数据 Harvard Dataverse 1 km
      国内生产总值(GDP)空间分布 国家青藏高原科学数据中心 1 km
      人口空间分布 LandScan 1 km
      城镇化率 欧盟委员会联合研究中心GHSL-SMOD 1 km
      社会-经济数据 中国统计年鉴、浙江省统计年鉴、安徽省统计年鉴

      Table 1.  Data sources

    • 联合国千年生态系统评估(millennium ecosystem assessment,MEA)将生态系统服务分为供给、调节、支持、文化四大服务体系[21]。杭州都市圈东部的杭嘉湖平原是长三角重要的商品粮基地,钱塘江水系贯穿全域,因此,选择粮食生产、水源涵养服务作为评估供需关系的关键供给服务指标;鉴于杭州都市圈局部城镇化水平高、热岛效应明显,选取碳固存服务作为关键调节服务指标;杭州都市圈西部山区有多个国家级自然保护区,选取生境质量服务反映生态系统完整性和生物多样性维持能力,是支持服务的重要代表;杭州都市圈拥有西湖、千岛湖、黄山等著名风景名胜区,为提升居民福祉选取景观游憩服务体现文化服务价值。

      粮食生产服务供给通过归一化植被指数(normalized difference vegetation index,NDVI)对粮食产量进行空间化处理获得[22];碳固存、水源涵养及生境质量供给依托InVEST模型进行测算,景观游憩供给基于单位面积的生态空间面积占比计算得到[23]。水源涵养需求通过不同类型用水量,根据人口、社会经济数据及土地利用类型进行空间化处理获取。粮食生产、碳固存、生境质量、景观游憩需求根据相关指标按照人口密度分配到栅格获得[24]。各项生态系统服务供需评估方法见表2。

      生态系统服务 计算方法 变量解释
      粮食
      生产
      供给 $ {S}_{\text{FD}}=\dfrac{{I}_{\text{NDVI}i}}{{I}_{\text{NDVIsum}}}\times {G}_{\text{sum}} $ SFD为粮食生产服务供给量;INDVIi为栅格i的归一化植被指数(NDVI),INDVIsum为研究区耕地像元内NDVI总值,Gsum为粮食总产量
      需求 $ D_{\text{FD}}=P_{\mathrm{pop}}\times D_{\text{perfood}} $ DFD为粮食生产服务需求量;Ppop为人口密度,Dperfood为人均粮食消耗量
      水源
      涵养
      供给 $ {S}_{\text{WC}}={P}_{i}-{A}_{\text{ET}i} $ SWC为水源涵养服务供给量;Pi为栅格i的年平均降水量,AETi为栅格i的年实际蒸发量
      需求 $ D_{\text{WC}}=C_i\times D_{\text{agr}}+G_i\times D_{\text{ind}}+P_{\text{pop}}\times D_{\text{dom}} $ DWC为水源涵养服务需求量;Ci和Dagr分别为耕地面积和每亩耕地的农业用水量,Gi和Dind分别为国内生产总值和每万元国内生产总值的工业用水量,Ppop和Ddom分别人口密度和居民人均生活用水量
      碳固存 供给 $ {S}_{\text{CS}}={C}_{\text{above}}+{C}_{\text{below}}+{C}_{\text{soil}}+{C}_{\text{dead}} $ SCS为碳固存服务供给量;Cabove为地上生物碳密度,Cbelow为地下生物碳密度,Csoil为土壤碳密度,Cdead为死亡有机物中碳密度
      需求 $ D_{\text{CS}}=P\mathrm{_{\mathrm{pop}}}\times P_{\text{c}} $ DCS为碳固存服务需求量;Ppop为人口密度,Pc为年人均碳排放量
      生境
      质量
      供给 $ {S}_{\text{HQ}}={H}_{j}\left[1-\left(\dfrac{D_{ij}^{{\textit{z}}}}{D_{ij}^{{\textit{z}}}-{K}^{{\textit{z}}}}\right)\right] $ SHQ为生境质量服务供给量;Hj为土地利用类型j的栖息地适宜性,Dij为土地利用类型j中像元i的栖息地威胁等级,主要由威胁因素的影响范围、权重及衰减类型决定,k为半饱和常数,z为模型默认参数
      需求 $ D_{\text{HQ}}=\ln\left(P_{\mathrm{pop}i}\right)+\ln\left(G_i\right)+\ln\left(L_i\right) $ DHQ为生境质量服务需求量;Ppopi、Gi及Li分别为栅格i的人口数量、国内生产总值及夜间灯光遥感强度
      景观
      游憩
      供给 $ {S}_{\text{LR}}=\dfrac{{A}_{\text{es}}}{A} $ SLR为景观游憩服务供给量;Aes和A分别为网格内生态用地面积和网格总面积
      需求 $ D_{\text{LR}}=P_{\text{pop}}\times A_{\text{green}} $ DLR为景观游憩服务需求量;Ppop为人口密度,Agreen为人均绿地面积

      Table 2.  Methods for evaluating supply and demand of ecosystem services

    • 生态系统服务供需比可用于揭示生态系统服务供需失衡程度。综合生态系统服务供需比则可反映多项生态系统服务的整体供需状态[12]。因此,选取5项生态系统服务供需比指标,采用熵权法确定其权重,计算综合生态系统服务供需比指数来反映综合供需匹配状况。公式如下:

      式(1)中,ES和ED为生态系统服务供给和需求;ESmax和EDmax为生态系统服务供给和需求的最大值。ESDR>0表示生态盈余;ESDR<0表示生态赤字;ESDR=0表示供需平衡,但平衡难以真正实现,故将ESDR值在[−0.001,0.001]范围内定义为平衡状态。

      式(2)中,ωi和ESDRi分别为各生态系统服务供需比的权重和数值,n为5种生态系统服务类型。

    • 为定量揭示各驱动因素对供需格局演变的驱动作用和贡献度,以综合生态系统服务供需比变化量为因变量,选取人口密度变化量、GDP变化量、建设用地扩张速度、城市化率变化量及NDVI变化量为自变量,均经Z-score标准化处理后进行地理加权回归分析。提取局部回归系数,以有效点(条件数<30)的系数绝对值均值反映贡献度,并统计正负系数比例判别驱动方向。

    • 生态源地是能够提供高生态系统服务价值和生态本底条件最佳的斑块[25]。需求源地指内部生态系统功能较弱、对外部生态系统服务需求较高的斑块。本研究将综合生态系统服务供给、需求及综合生态系统服务供需比基于分位数分为5个等级[26],选取综合供给和综合生态系统服务供需比前20%的交集为初始生态源地,综合需求前20%和综合生态系统服务供需比后20%的交集为初始需求源地。进一步排除面积小于18 km2的生态源地和15 km2的需求源地,确定最终源地。

    • 生态阻力面是物种在不同景观间迁移或生态流流动过程中所需克服的通行难度[27]。选取土地利用类型、高程、NDVI及坡度作为阻力因子构建初始生态阻力面,并引入生态系统服务需求作为人类活动强度的表征指标,对生态阻力面进行修正。计算公式如下:

      式(3)中,Rx为栅格x修正后的生态阻力面;EDx为栅格x的生态系统服务需求值,EDy为栅格x对应的用地类型y的平均生态系统服务需求值,R为初始生态阻力面。

      移动阻力面是在供需失衡背景下,人们获取高质量生态产品和环境时所面临的空间难度[28]。鉴于研究目标侧重于模拟生态服务从生态源地向需求源地流动的空间路径和传输阻力,选择成本距离法计算生态空间可达性以构建移动阻力面,通过量化服务流的流动趋势对移动阻力面进行修正。计算公式如下:

      式(4)中,RC为修正后的移动阻力面,ESx为生态系统服务供给的倒数值,ESy为栅格x对应的用地类型y的平均生态系统服务供给的倒数值,Ax为空间可达性阻力值。

    • 基于电路理论,本研究使用Linkage Mapper工具箱提取廊道。生态廊道以生态阻力面为介质连接生态源地,增强景观连通性和生态系统稳定性[29]。供需廊道是指生态服务从供给区向需求区的潜在传输路径,以移动阻力面为介质仅提取生态源地与需求源地之间的连接,使人类能够更容易地获取生态系统惠益[15]。以移动阻力面为介质导出的生态源地-生态源地连接(不涉及供需服务传输)和需求源地-需求源地连接(不具备服务传输功能)均不纳入供需廊道网络。

    • 生态节点包括生态夹点和生态障碍点[30]。生态夹点指廊道内电流密度较高的区域,是维持景观连通性的脆弱环节和关键节点。生态障碍点指廊道内显著阻碍或抑制生态流的位置,修复障碍点可以增强整体连通性,分别由Linkage Mapper软件中的Pinchpoint Mapper和Barrier Mapper工具识别。供需节点是位于生态供需盲区内具有高潜在供给能力的斑块[28]。通过增加生态系统服务供给能力较强但面积小于5 km2的斑块作为供需节点构建优化廊道,提高供给与需求源地间的连通性,优化社会-生态安全网络。

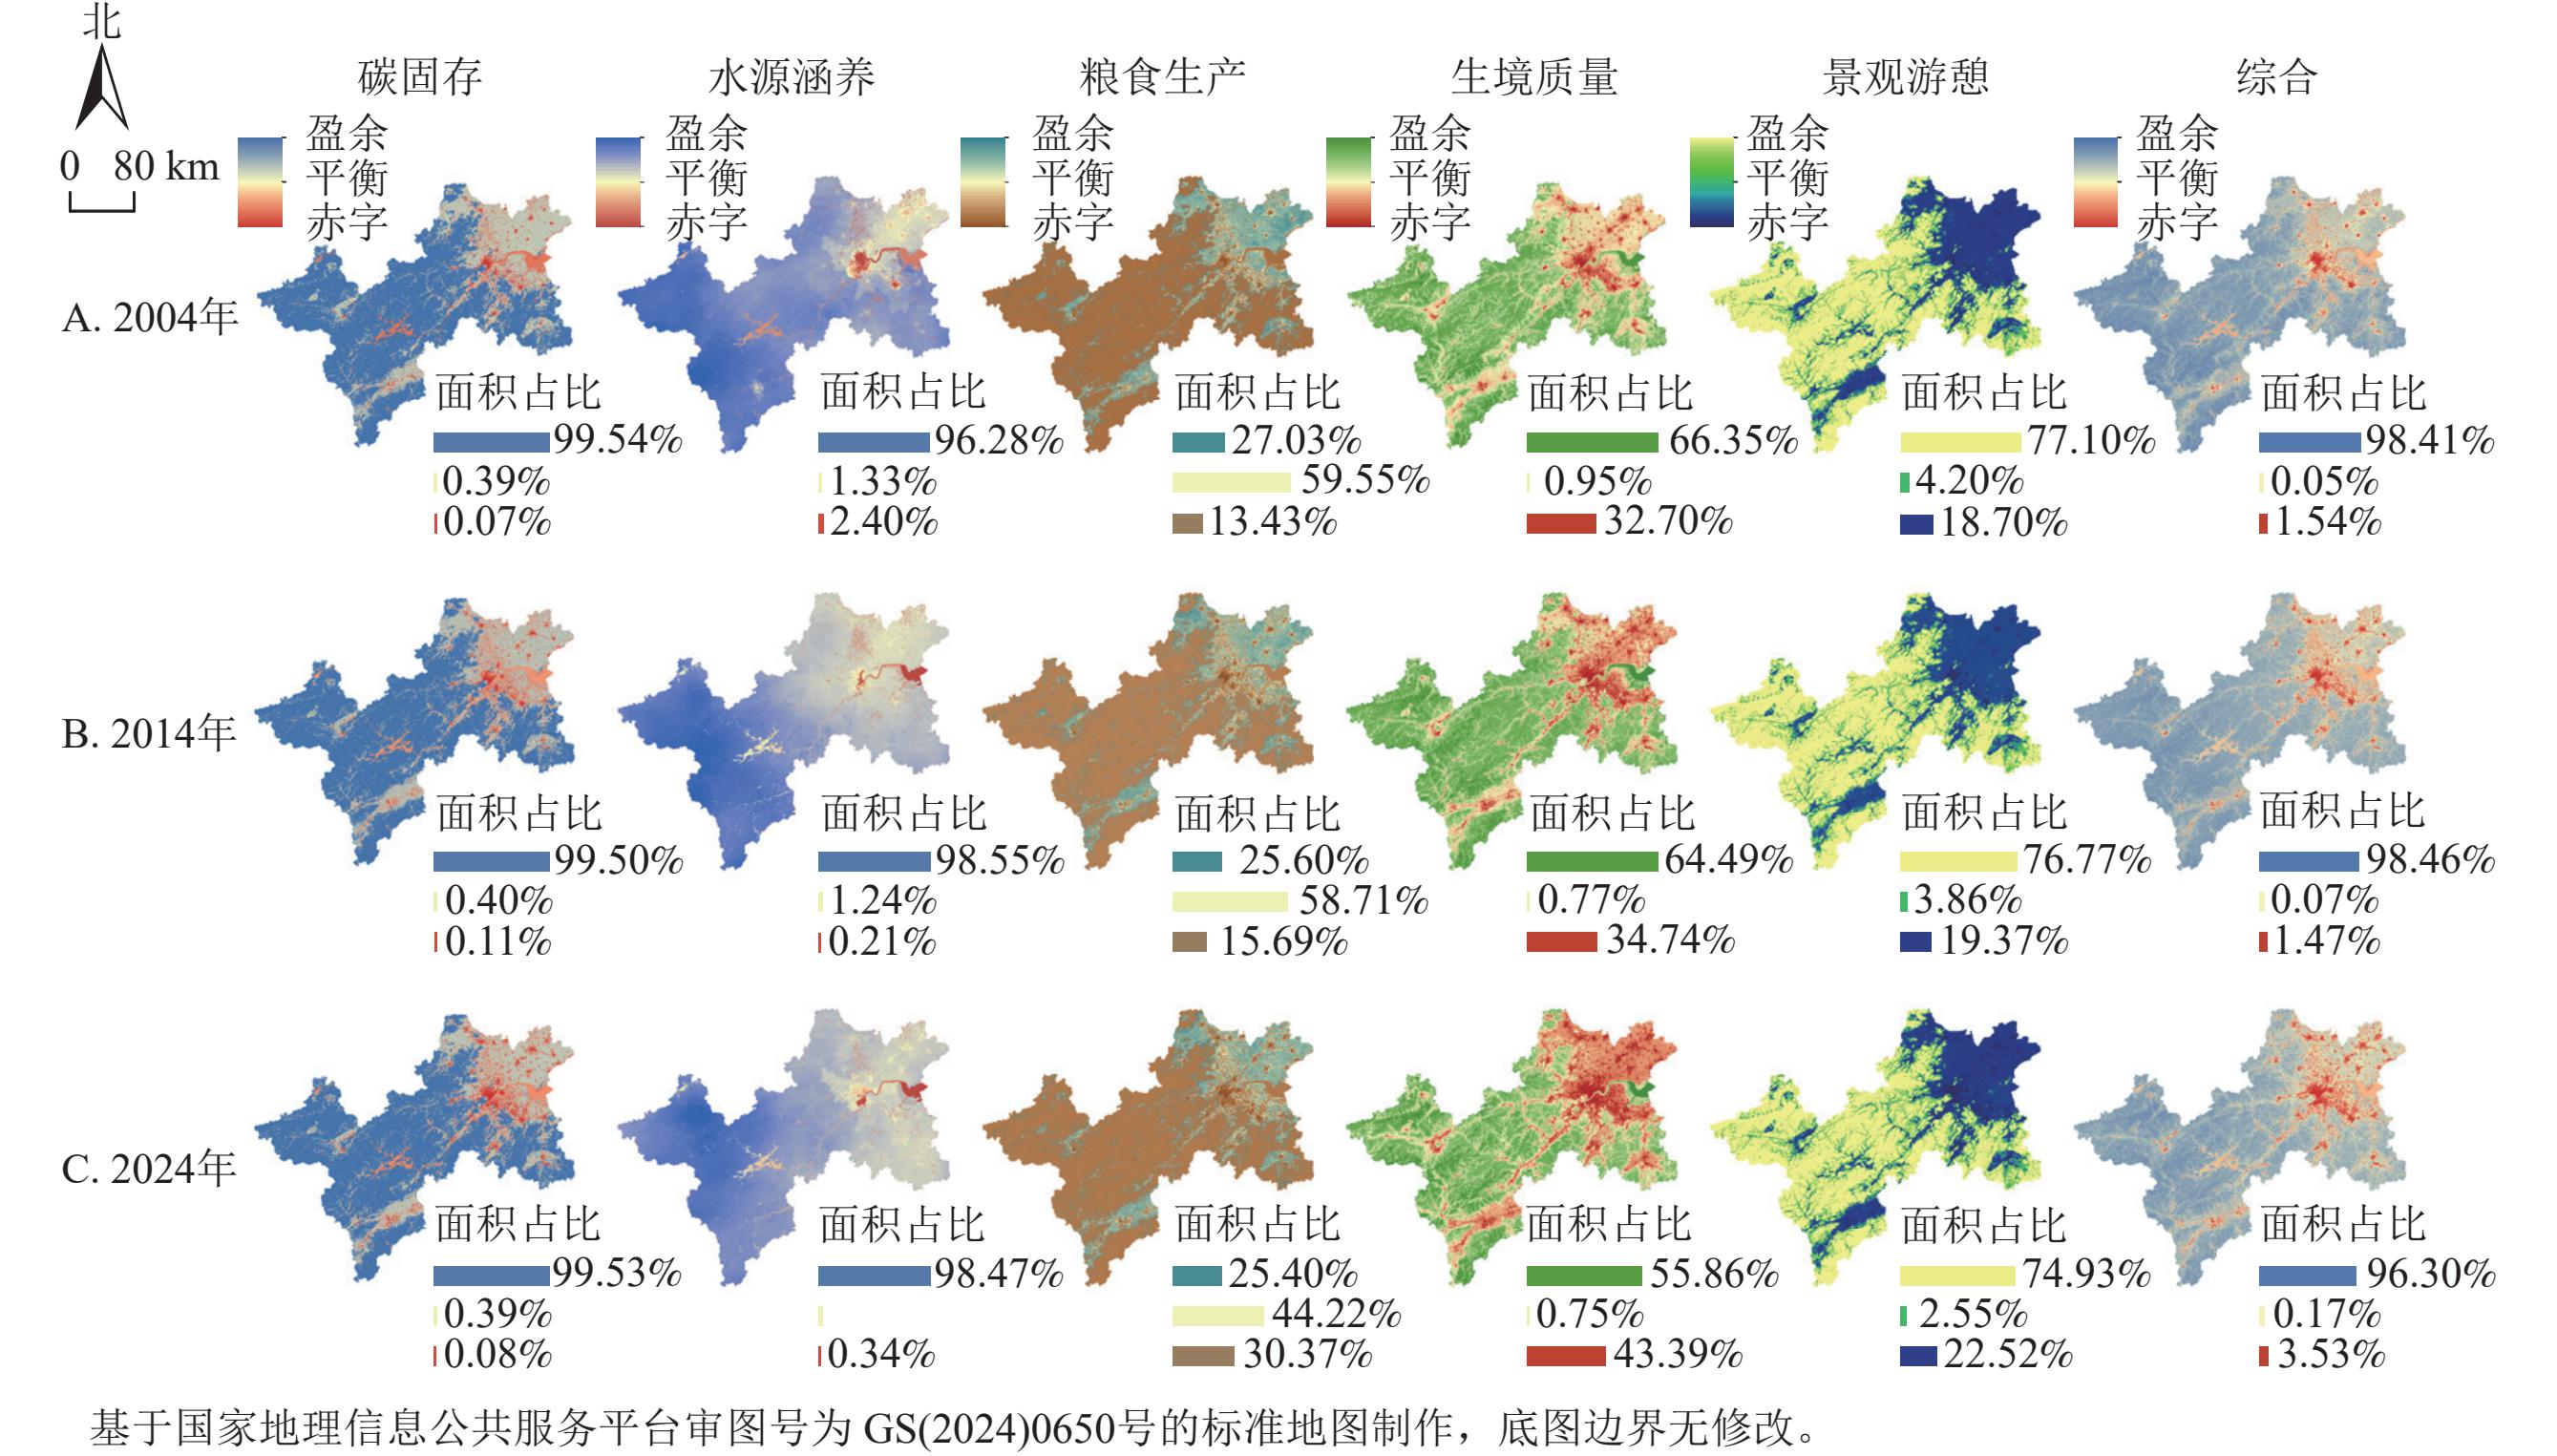
    • 图2显示:碳固存和水源涵养服务盈余最为显著,盈余区面积占比常年超96%。景观游憩服务供需最为稳定,盈余区面积占比从2004年77.10%小幅下降到2024年的74.93%。生境质量和粮食生产服务赤字规模持续扩大,赤字区面积占比在2004—2024年分别扩大了10.69%和13.94%。综合5项生态系统服务供需状况,综合供需比形成“西盈东赤”的空间格局。整体仍以盈余为主,但赤字区占比从1.54%升至3.53%,平衡区略有增加,说明区域尺度上生态系统服务供需空间错配加剧,局部赤字风险上升。
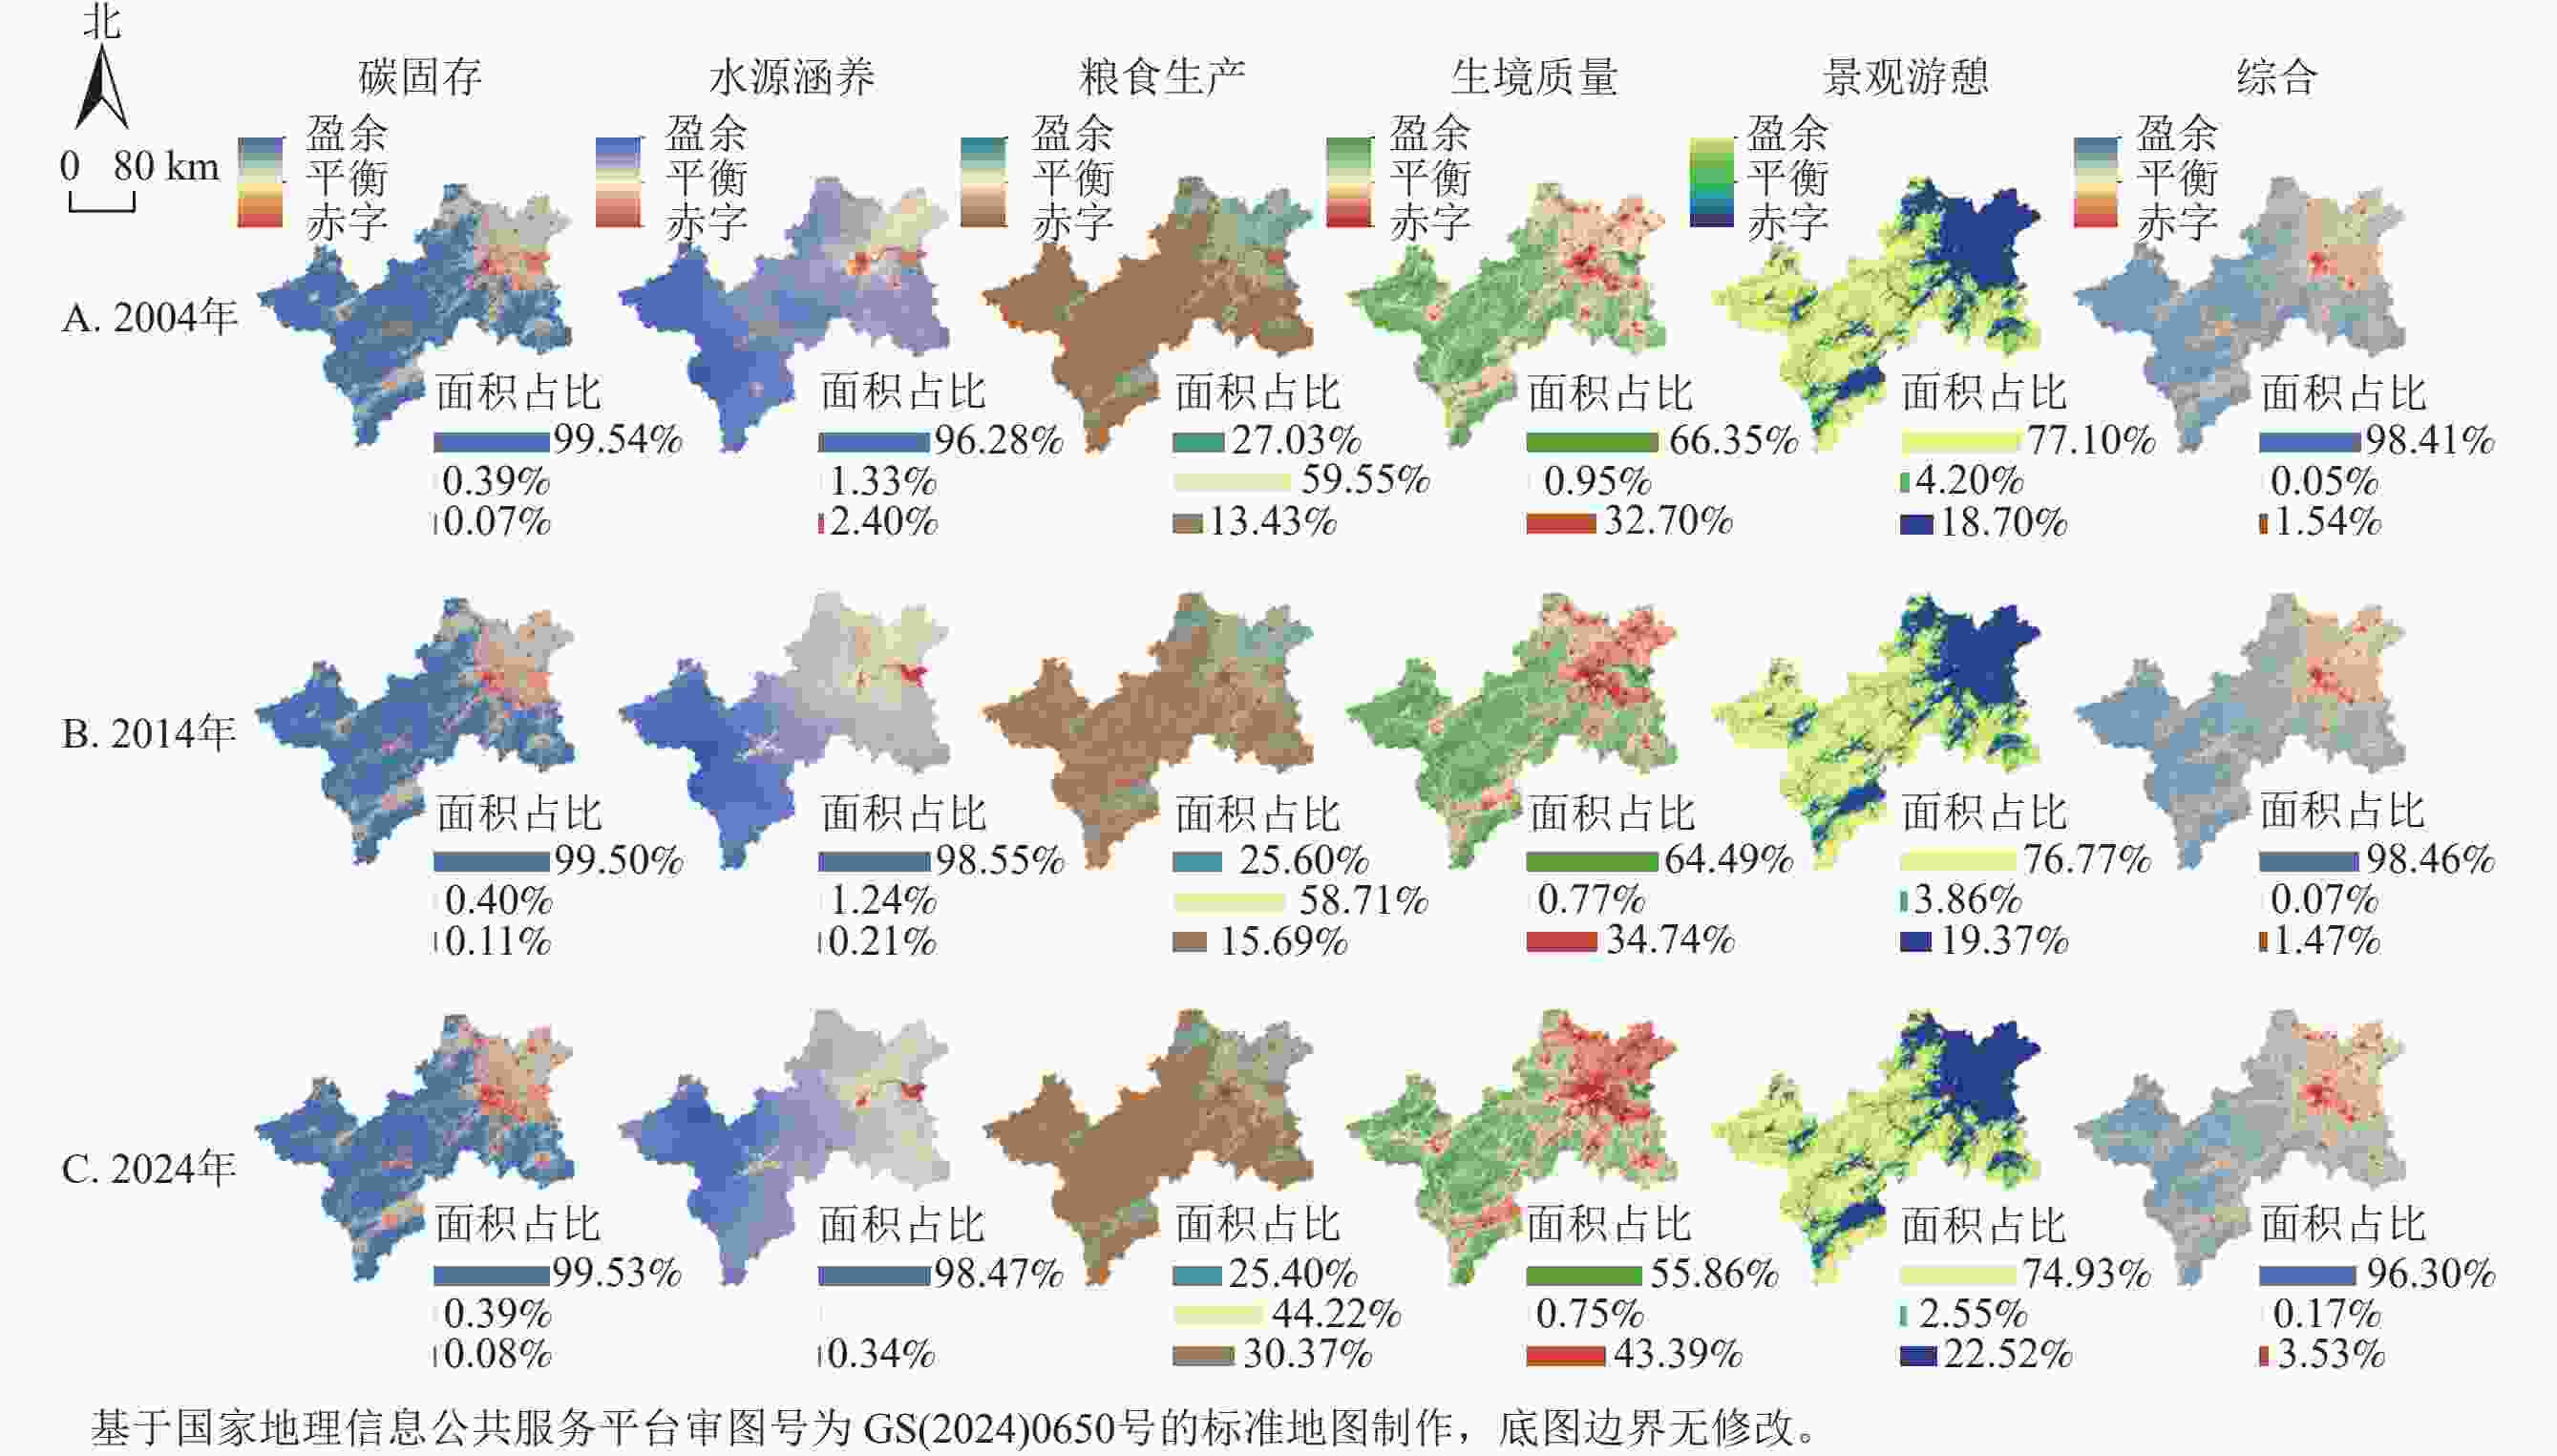
      Figure 2.  Spatial pattern of ecosystem services supply and demand

    • 从整体区域平均绝对系数来看(表3),各因素对供需失衡格局演变的贡献度由高到低依次为:GDP变化量、人口密度变化量、建设用地扩张速度、NDVI变化量、城镇化率变化量。人口密度变化量的负系数比例高达89.97%,表明人口集聚普遍导致生态系统服务供需失衡,NDVI变化量的正系数比例最高(60.15%),说明植被改善在大部分区域起到缓解供需矛盾的正向作用。经济增长、人口集聚及建设用地扩张是供需失衡加剧的核心驱动力,而植被改善提供了微弱但积极的调节作用。

      自变量 系数绝
      对均值
      正系数
      比例/%
      负系数
      比例/%
      GDP变化量 0.97 34.45 65.55
      人口密度变化量 0.56 10.03 89.97
      建设用地扩张速度 0.17 23.56 76.44
      NDVI变化量 0.09 60.15 39.85
      城镇化率变化量 0.04 44.46 55.54

      Table 3.  Absolute mean values and the ratio of positive to negative coefficients for each driver

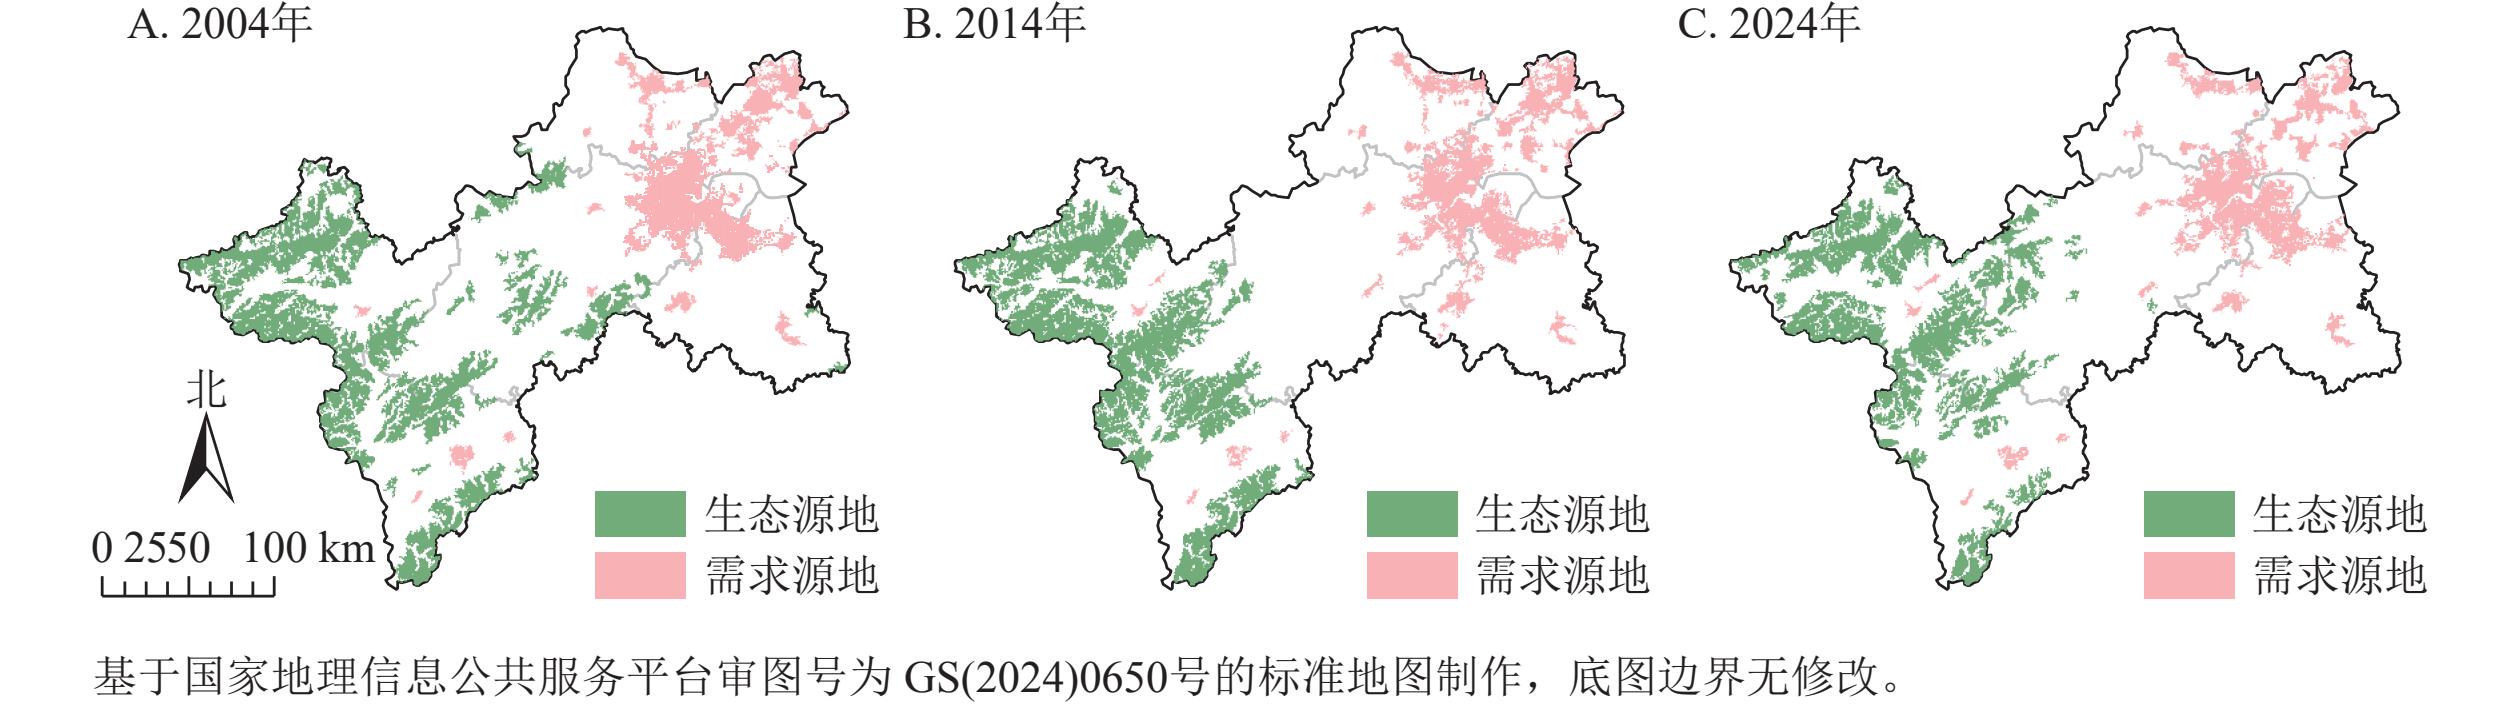
    • 图3显示:经筛选后2004年共识别生态源地37块(9 739.23 km2),2014年杭州中部源地消失,数量锐减至18块(8 890.15 km2),这与当时生态保护范围不足密切相关。《杭州市生态环境功能区规划》(2008年)划定的禁止准入区面积仅占全市国土面积的15.10%,导致西部源地未得到充分保护。2014年生态环境部出台了《国家生态保护红线-生态功能基线划定技术指南(试行)》,划定保护范围扩大,刚性约束力显著增强。2016年国家全面启动山水林田湖草沙一体化保护和修复工程,2024年生态源地得以恢复增至44块(7 713.12 km2),但20 a间源地总面积减少2 026.11 km2,并向西部山区持续收缩,斑块趋于破碎化。需求源地从2004年识别出19块(4 859.75 km2)到2014年23块(4 913.53 km2),持续增加至2024年25块(4 681.95 km2),总面积累计减少177.80 km2。土地利用结构发生转型,主导地类由2004年耕地(59.42%)转为2024年建设用地(58.77%)。空间上始终锁定东部城镇平原区和西部中心城区。为检验上述变化趋势的稳健性,采用分位数法将综合供给和供需比分为4类(新增)、5类(主结果)、6类(新增)等3个梯度提取初始源地进行对比分析。3种阈值下生态源地均呈现数量持续下降、面积总体减少、空间分布集中的趋势。3种阈值下需求源地数量均呈增加趋势,面积稳定或增加,表明源地的识别对阈值选择不敏感。
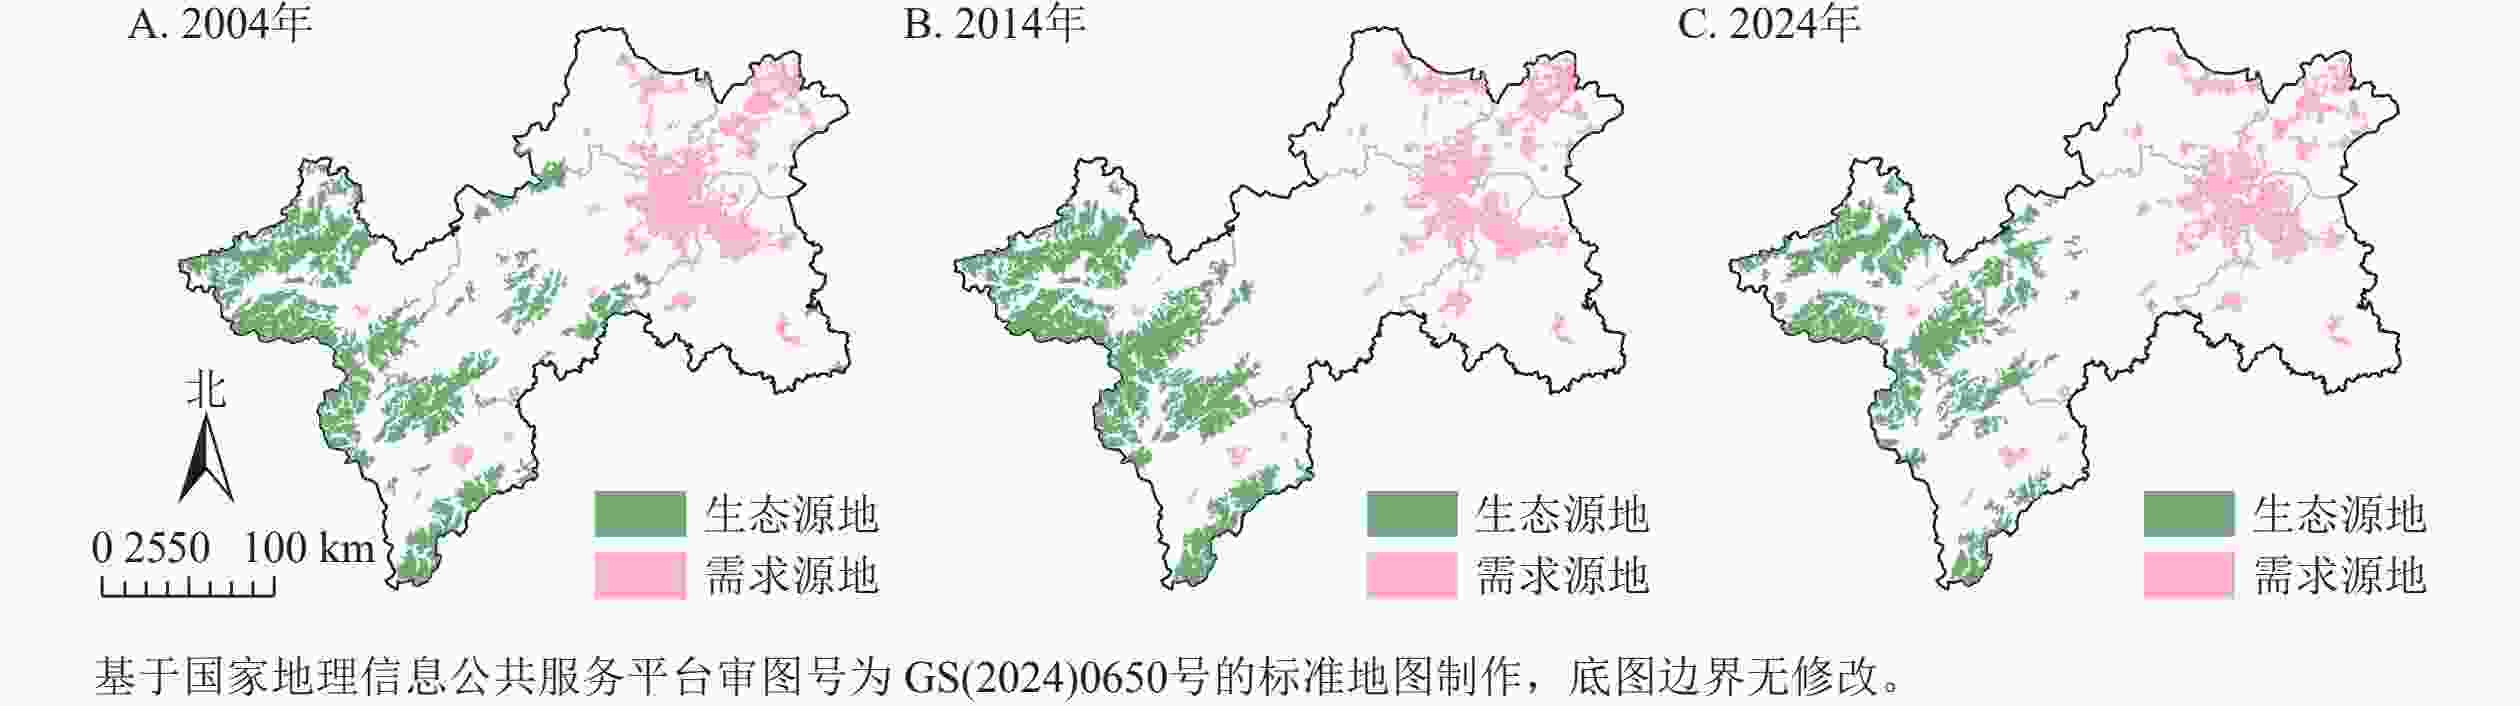
      Figure 3.  Spatial pattern of ecological sources and demand sources

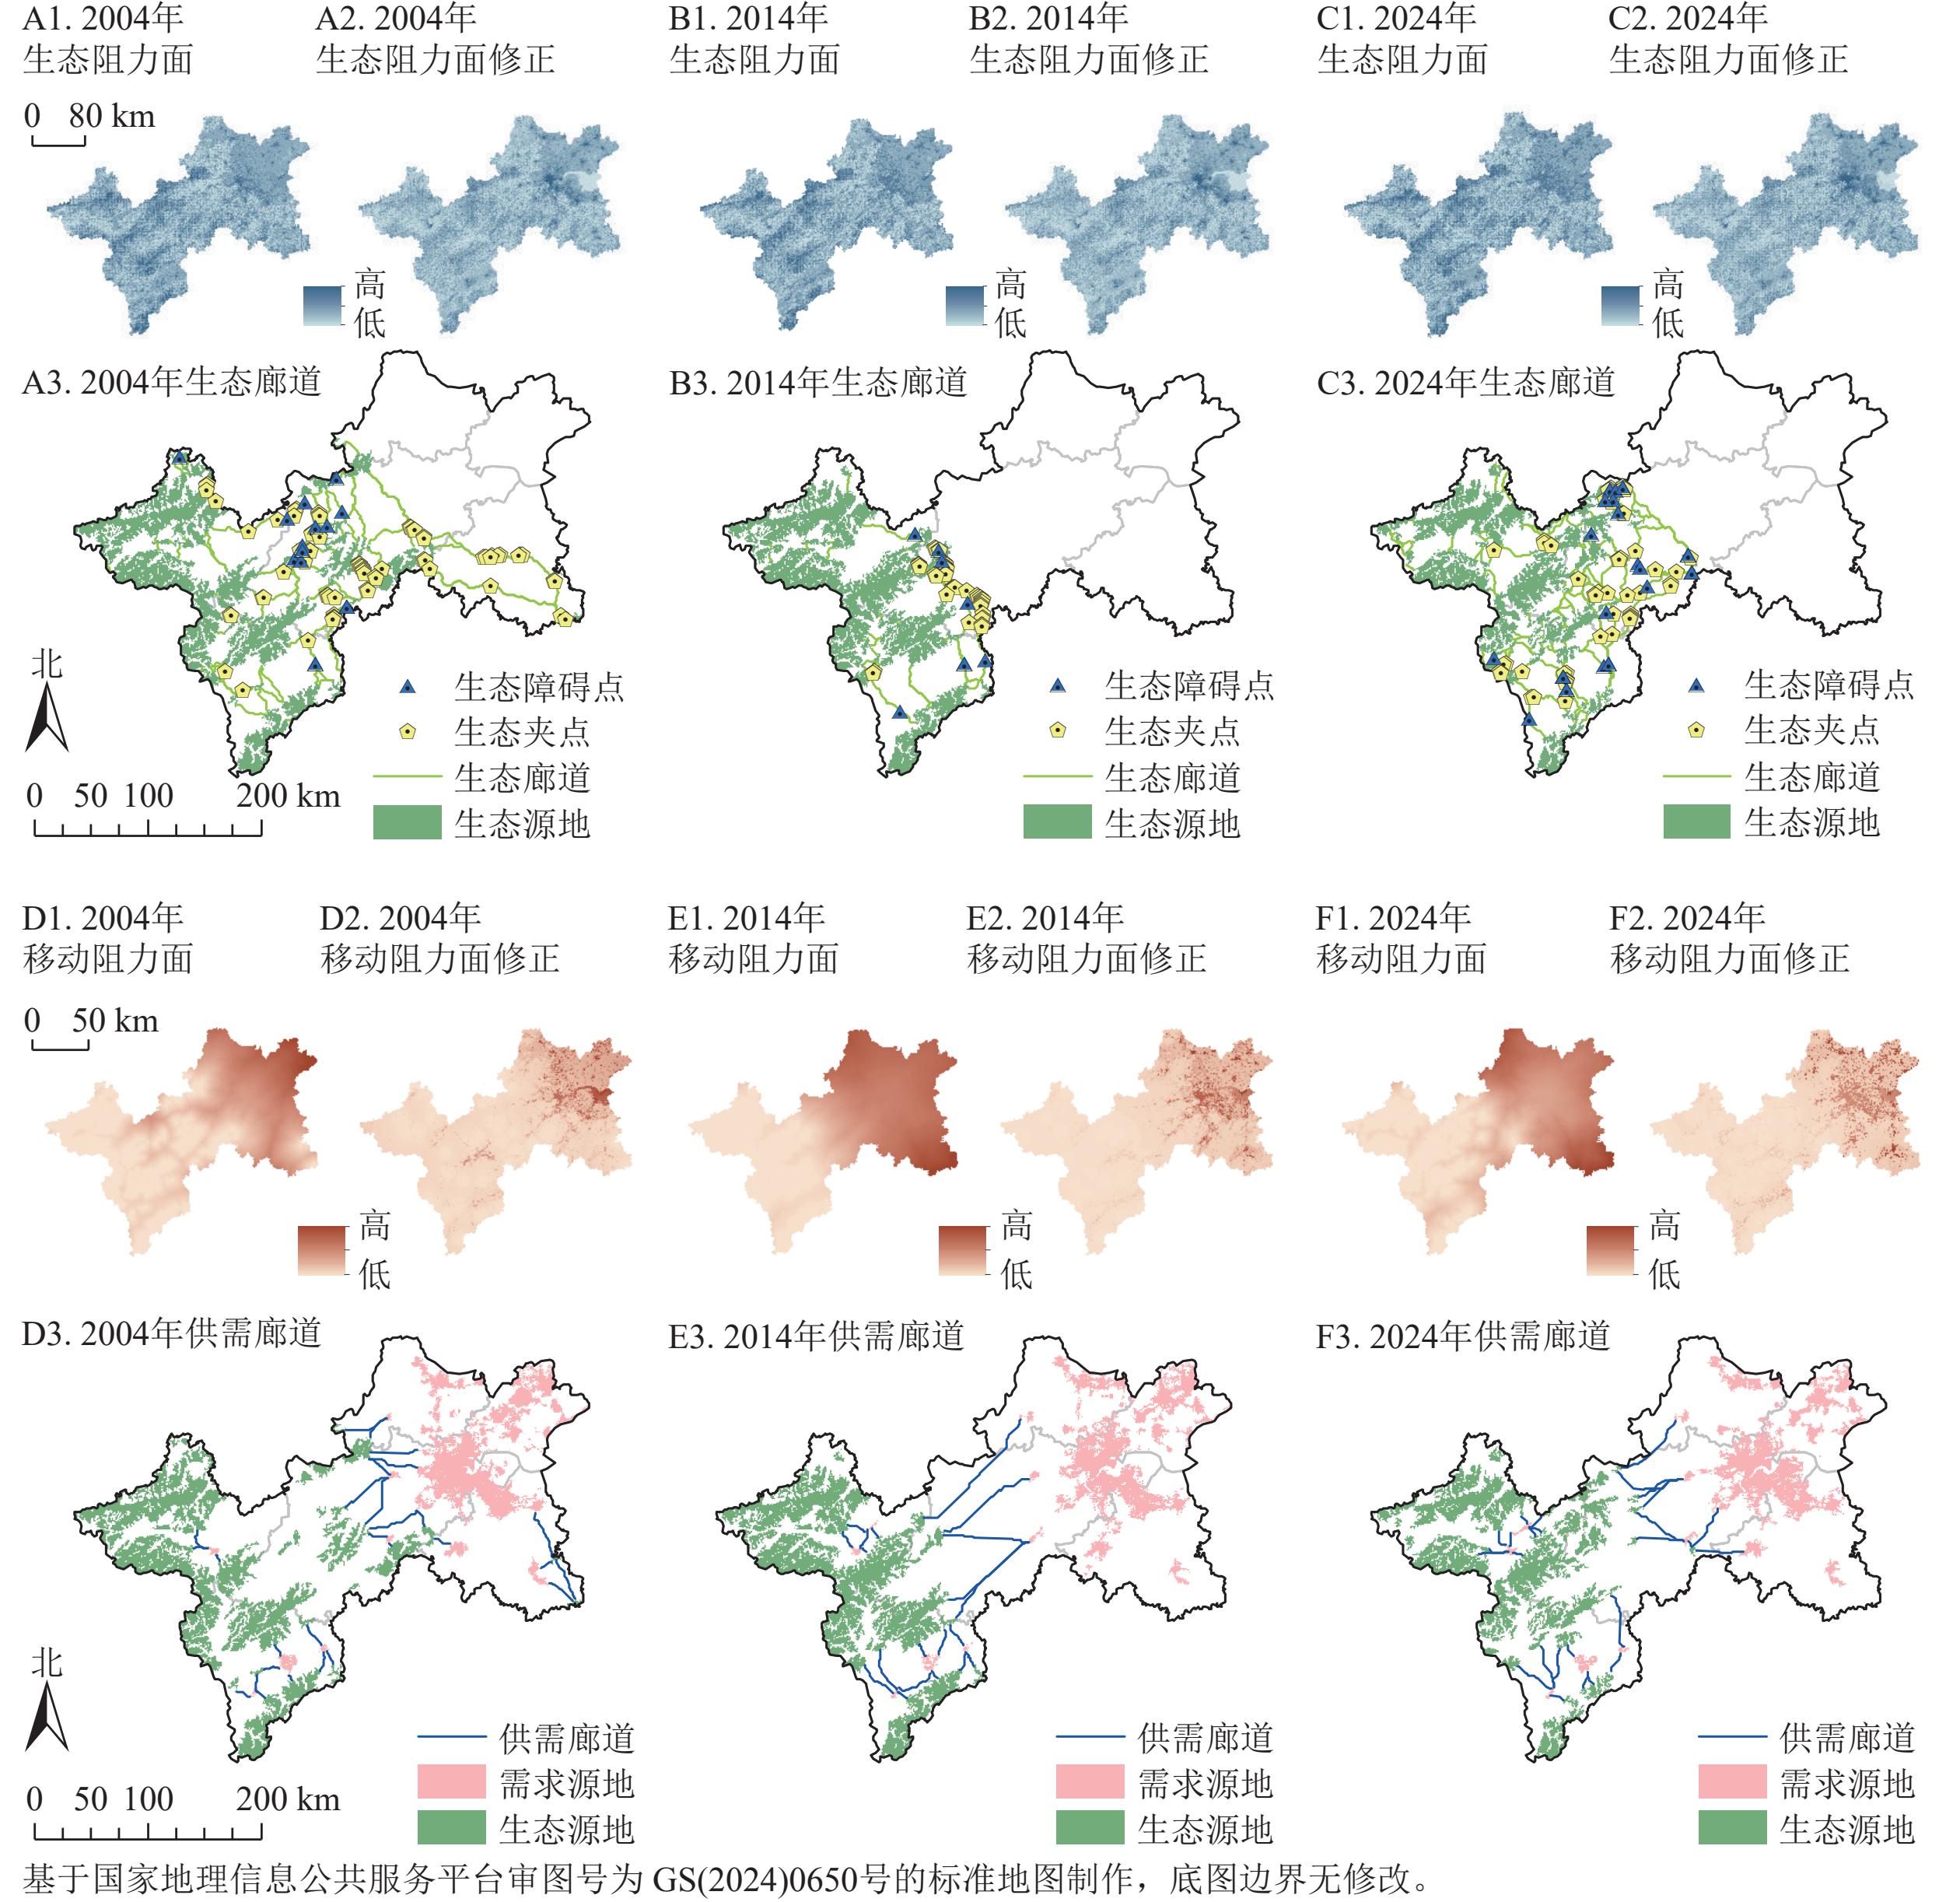
    • 2004年共识别生态廊道84条(2 287.95 km),生态夹点71个,生态障碍点16个(图4)。2014年廊道数量锐减至37条(698.91 km),生态夹点和生态障碍点同时受到影响,数量分别减少至37个和8个。2024年廊道数量激增至118条(2 254.65 km),生态夹点和生态障碍点分别恢复至51个和29个。空间上聚集于西部地区,形成“长而集中”的蛛网状格局。经筛选剔除后,2004年、2014年及2024年共提取的有效供需廊道数量分别为28条、20条及27条,总长度分别为577.50、677.41及673.44 km。主要分布于中部和西部中心城区周边,呈现“短而稀疏”的分散格局。东部城镇集聚区生态源地基本消失,导致东部需求源地实际传输的生态系统服务面临源头枯竭风险,与生态廊道在西部山区的强化形成对照,供给端与需求端空间解耦加剧。以2024年数据为例,将最大连接最近邻数(6、8)和截断成本加权距离阈值(100 000、400 000)分别调整后重新提取廊道,结果均与主结果(最近邻数4,截断成本加权距离阈值200 000)一致,表明廊道网络对上述参数不敏感,结论具有稳健性。再次以最近邻数降为2重新提取廊道但网络过于稀疏,故本研究采用最近邻数4作为主结果。
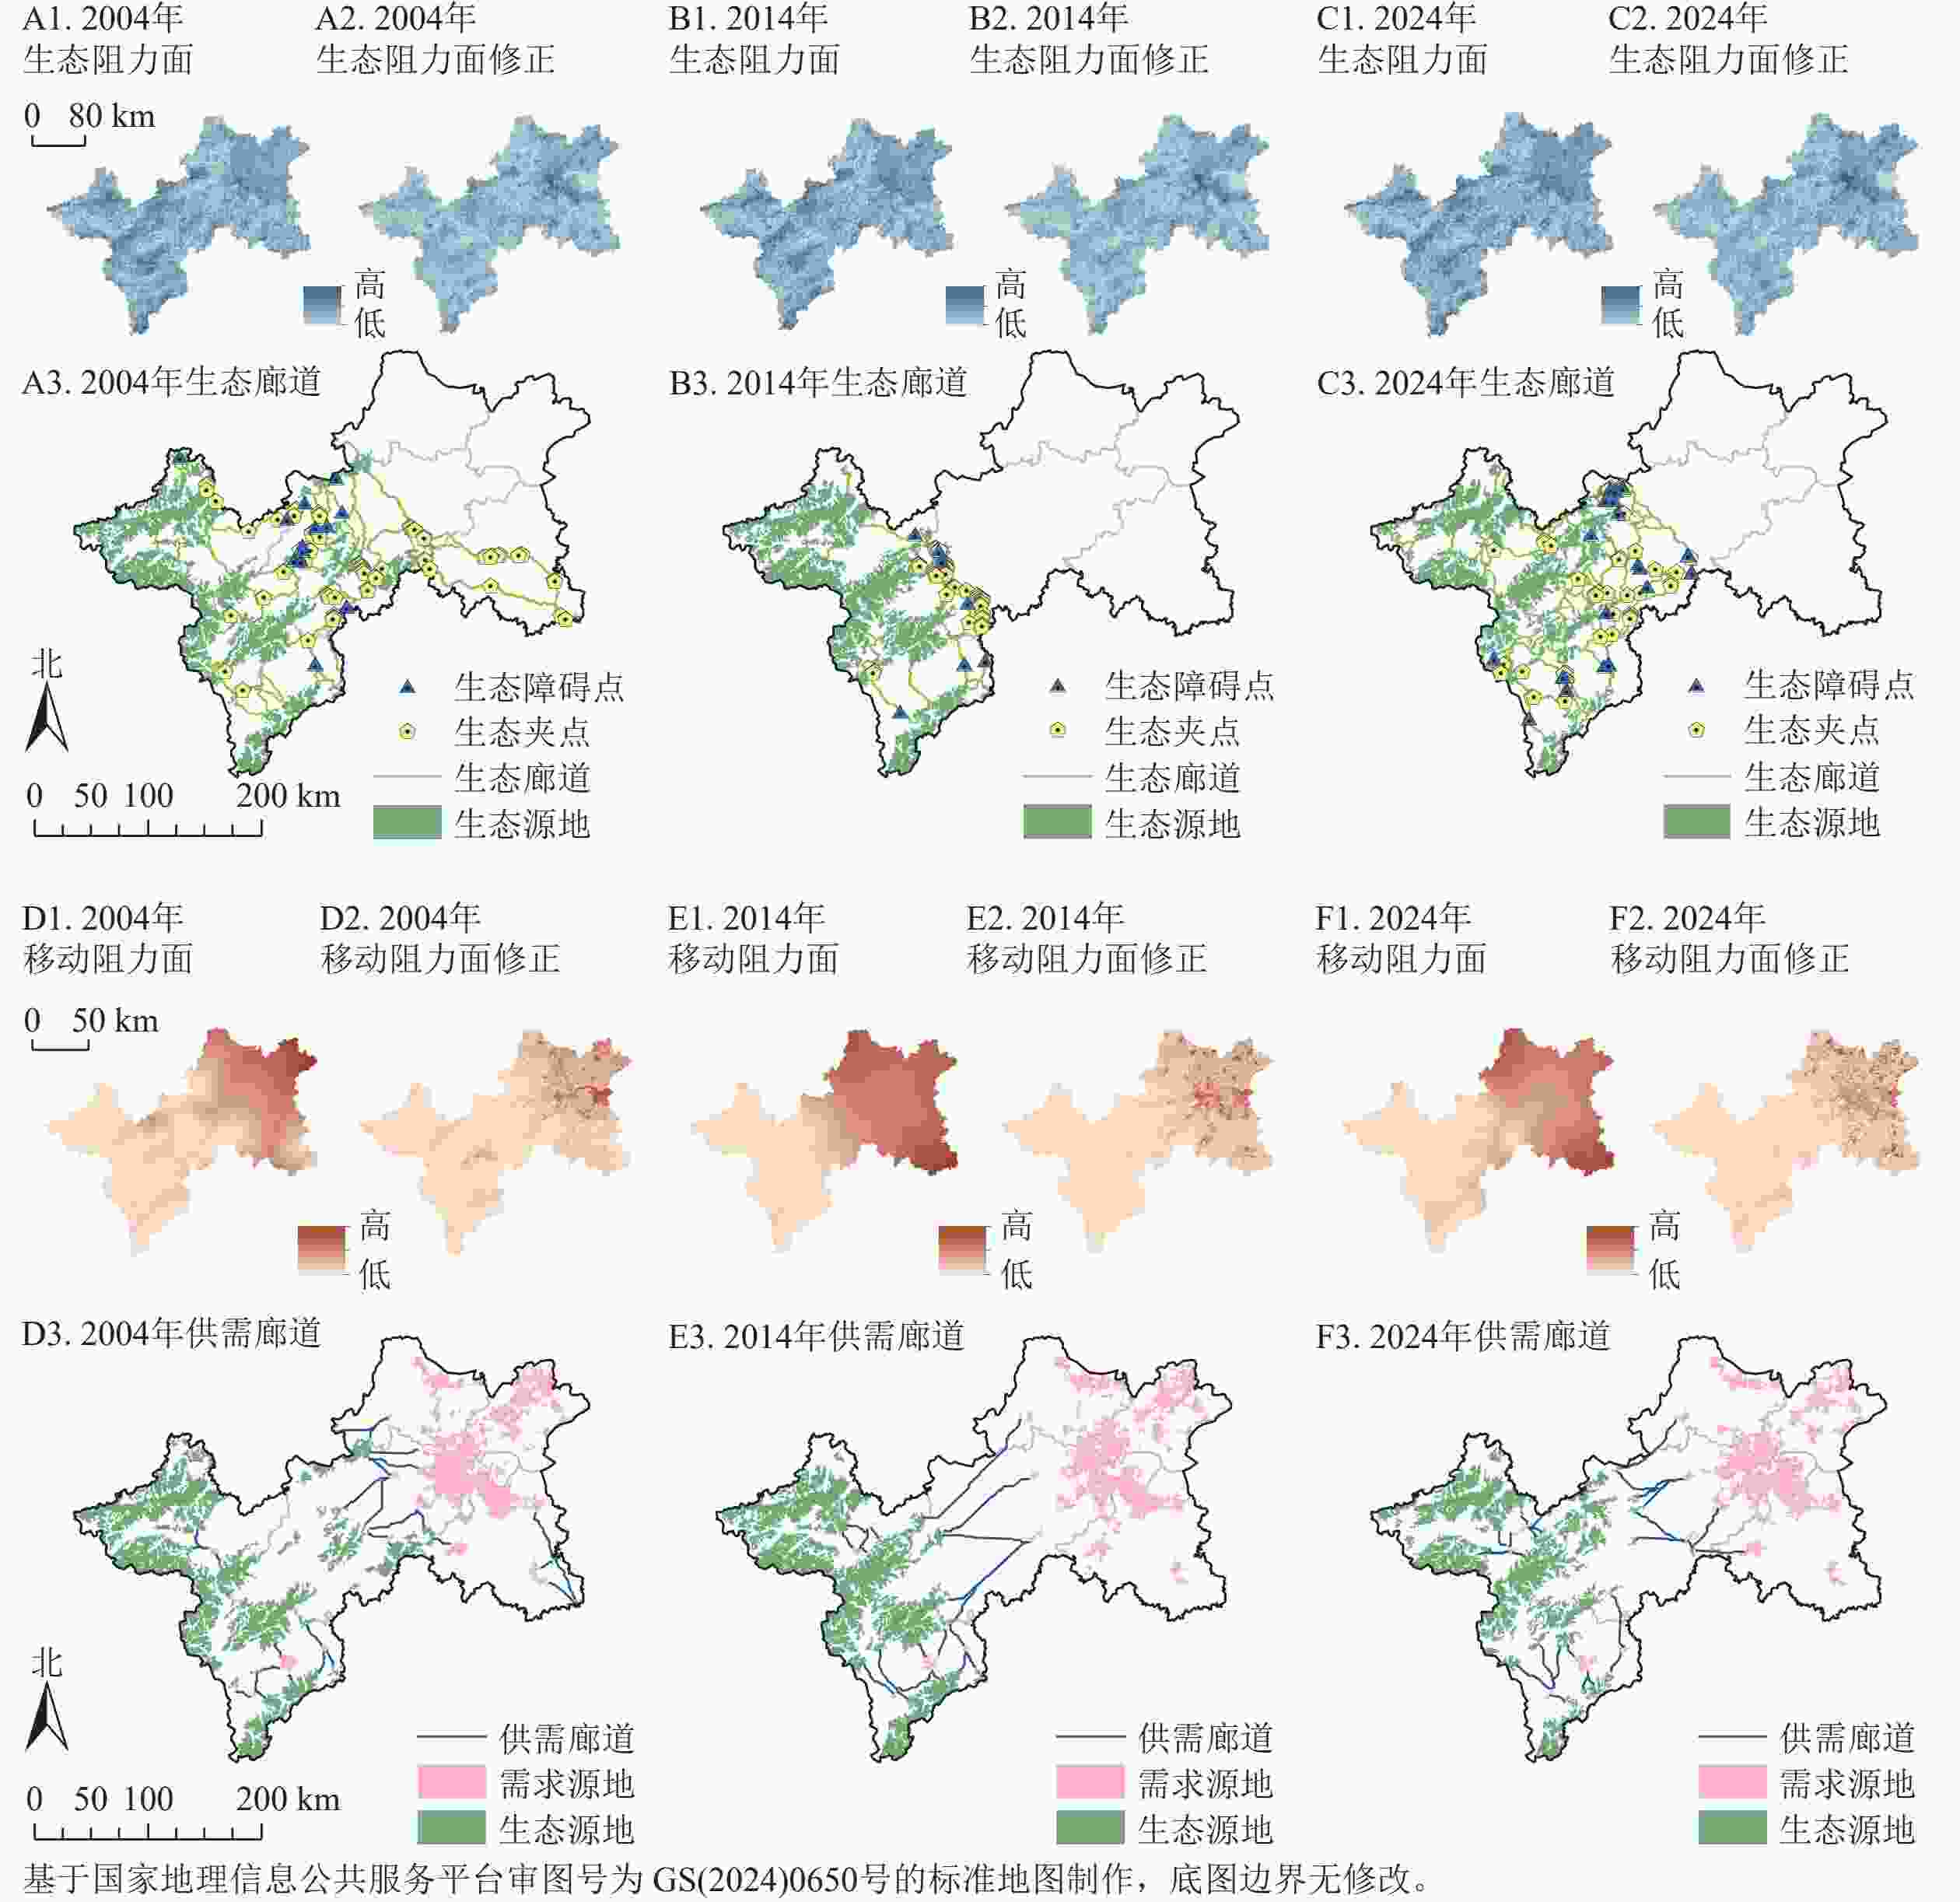
      Figure 4.  Spatial pattern of ecological corridors and supply-demand corridors

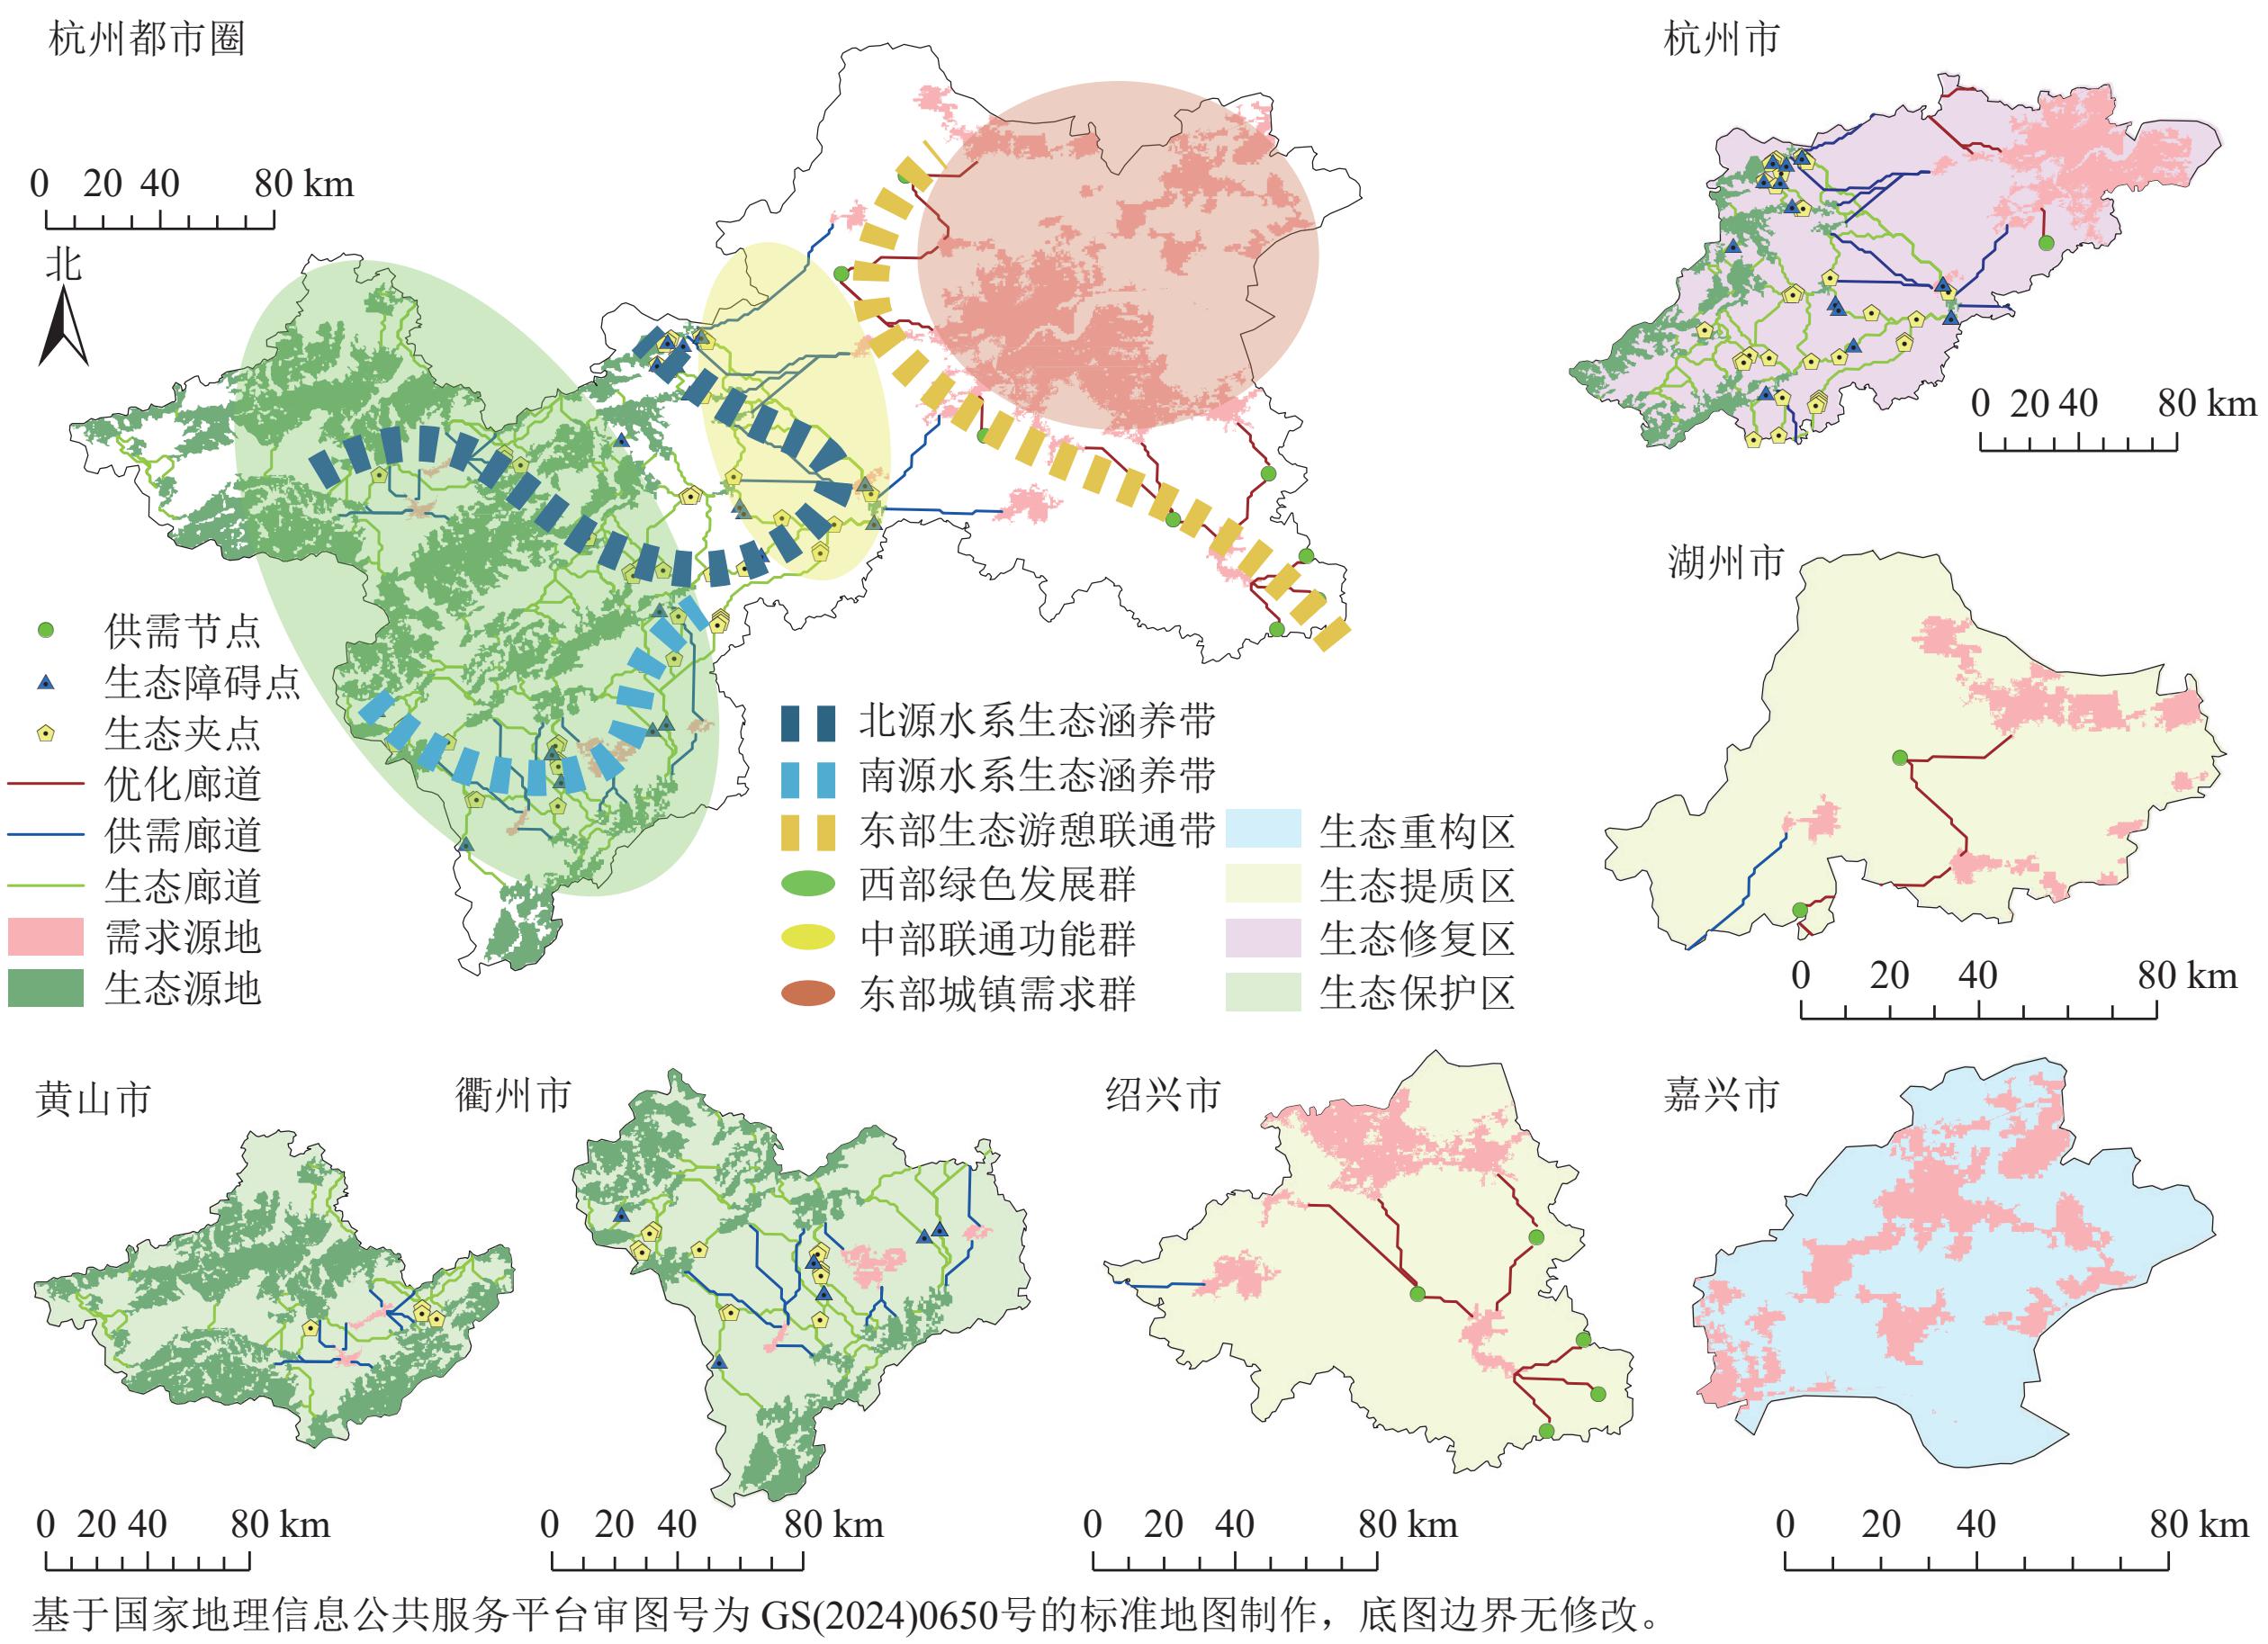
    • 通过分析2004—2024年社会-生态安全格局各组成部分的演变特征,发现东部地区生态源地严重匮乏,面临生态服务枯竭压力。本研究基于2024年杭州都市圈社会-生态安全格局在东部地区设置供需节点8处,以连接供需节点与孤立需求源地的廊道作为优化廊道,新增优化廊道14条,总长329.99 km。通过构建“供需节点-优化廊道”的补充网络,东部需求源地获得与供给端的间接连接,提升生态服务传输的空间可达性。基于优化后的社会-生态安全格局生态要素,构建“三带三群四区”的社会-生态安全格局优化布局方案(图5)。
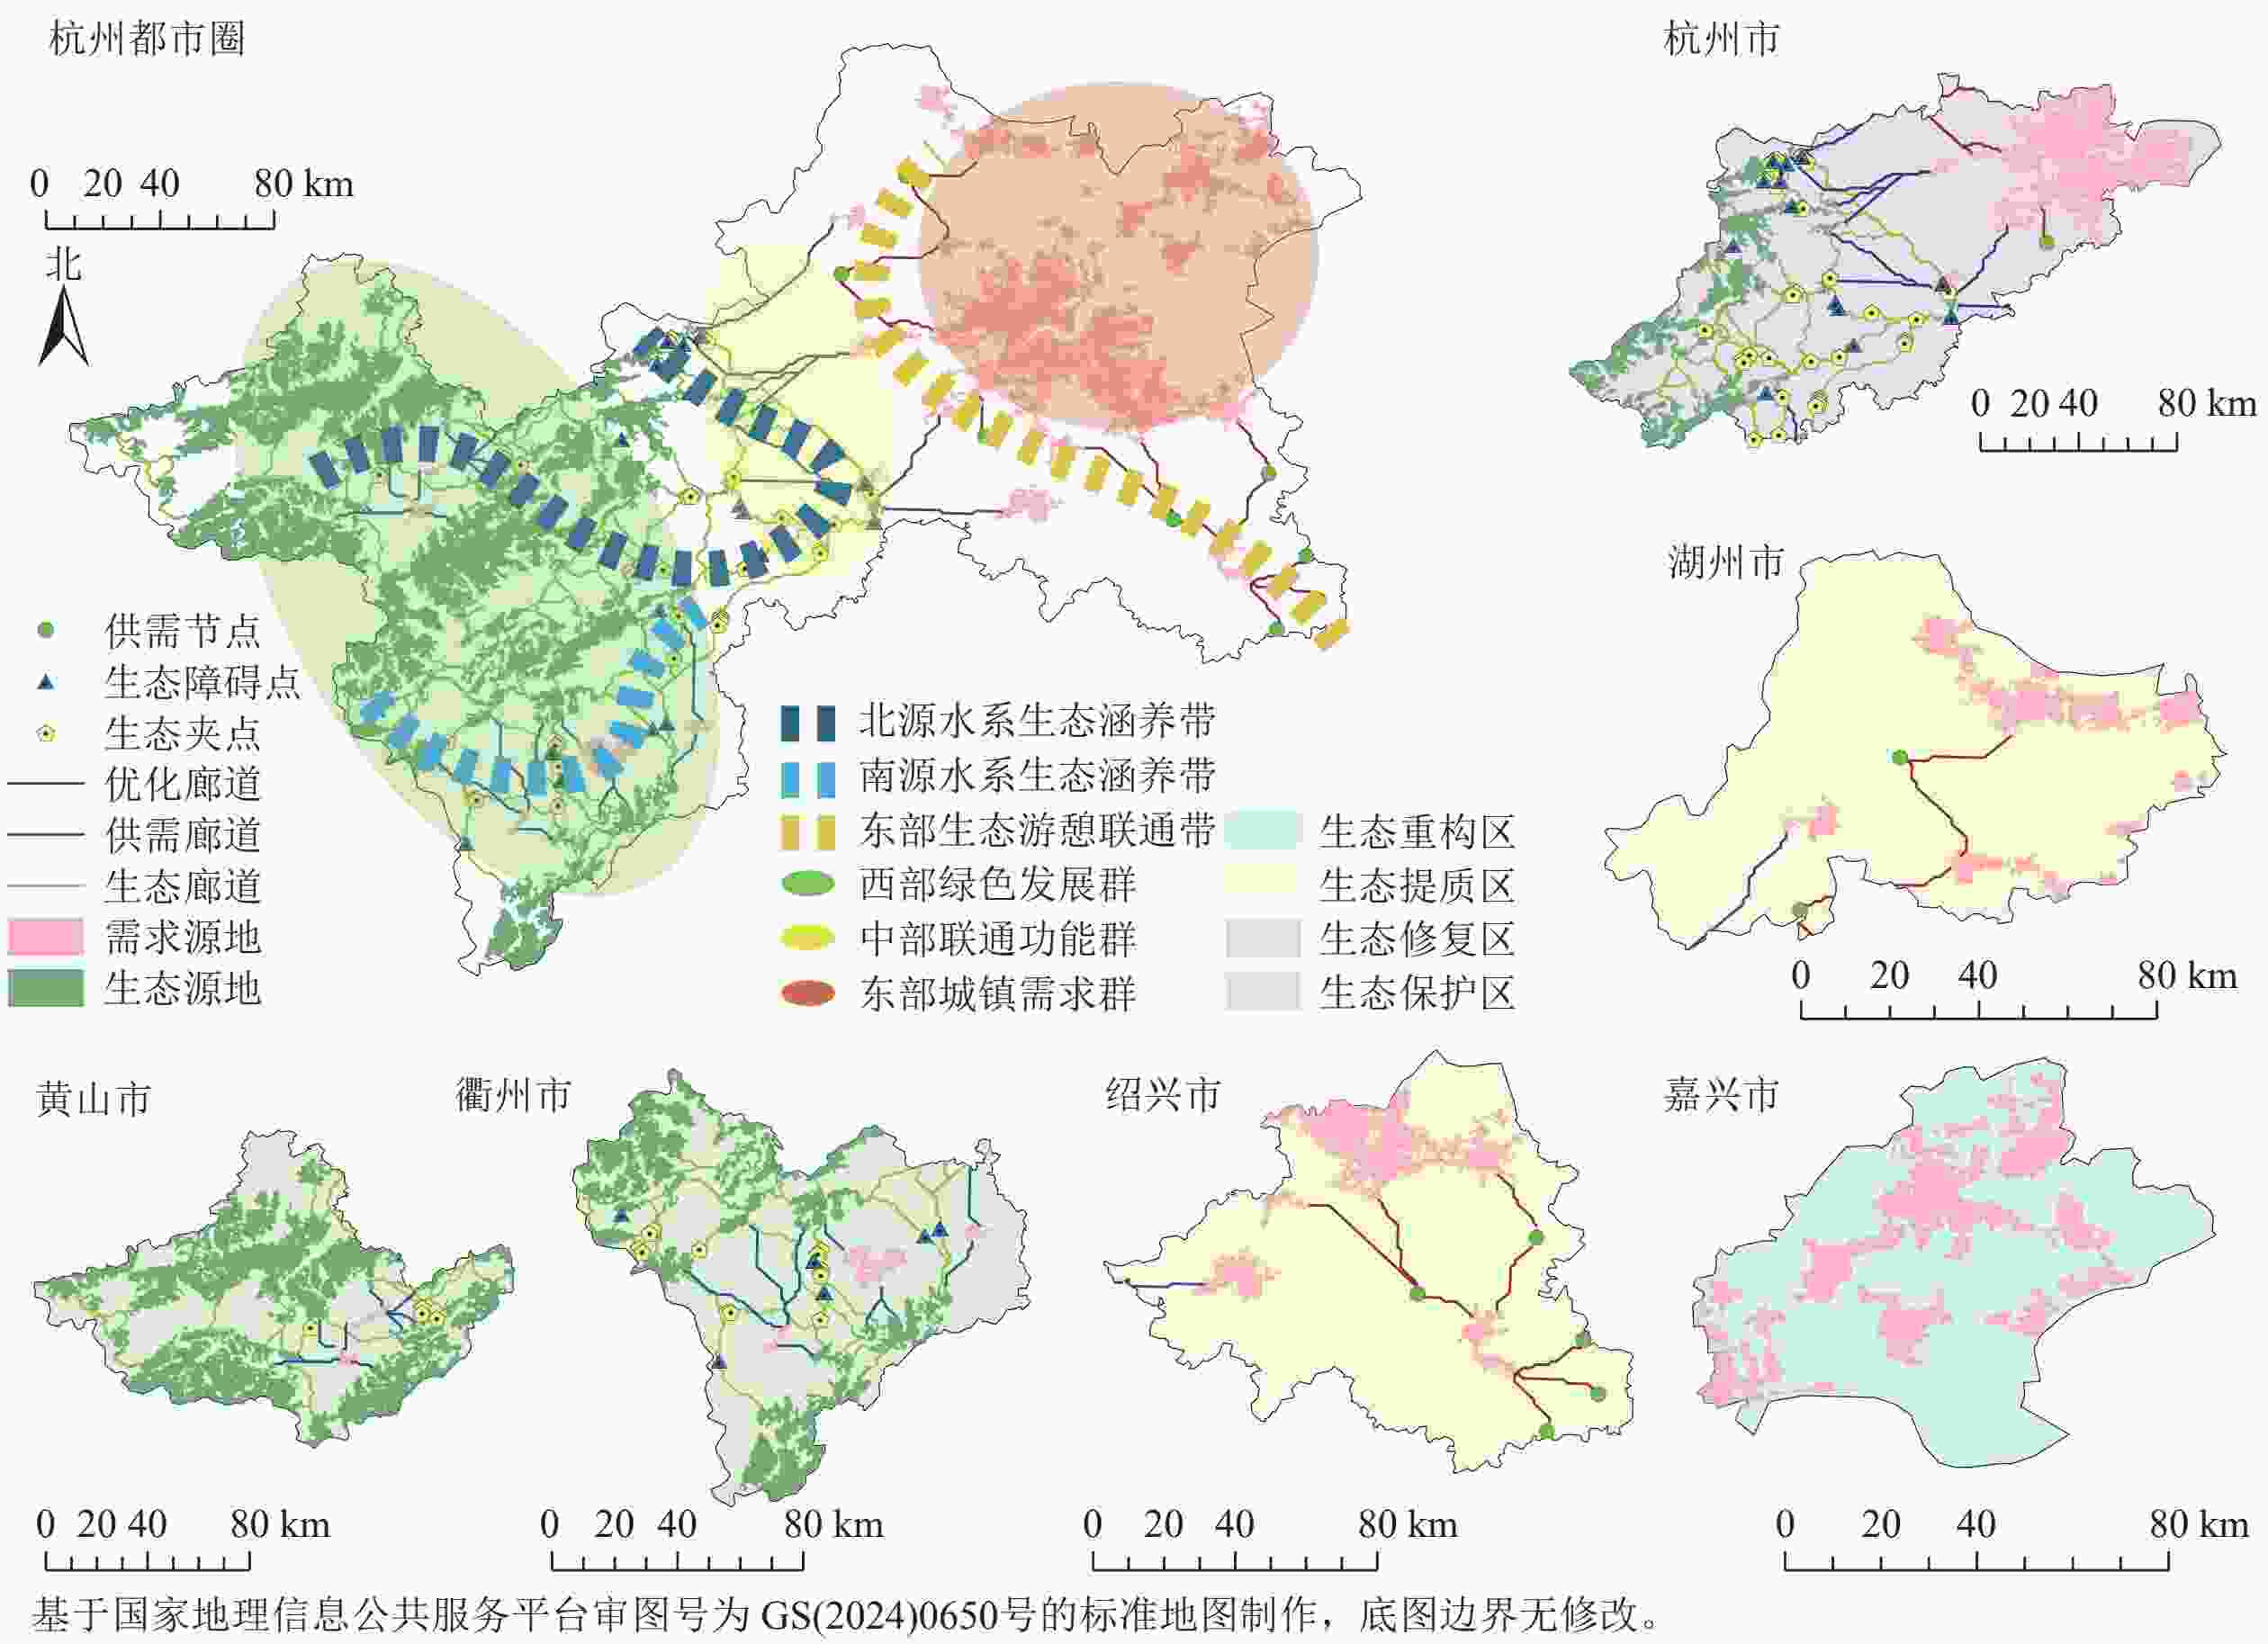
      Figure 5.  Spatial pattern of social-ecological security pattern

    • 北源水系生态涵养带沿钱塘江北源水系(新安江-千岛湖-分水江)分布,其内部大量生态夹点和生态障碍点集聚,是跨省生态流传输的关键瓶颈区;南源水系生态涵养带沿钱塘江南源水系(衢江)分布,同样密集分布生态夹点和障碍点,是保障南源生态服务稳定向下游输送的重要通道;东部生态游憩联通带依托供需节点和优化廊道分布,构建生态游憩网络,缓解东部生态源头枯竭风险。

    • 西部绿色发展群生态源地面积大、连续性好,是生态源地集群,也是全域生态服务供给的核心源头和重点开展跨省(浙皖)生态修复和协同发展的区域。东部城镇需求群是需求源地的集群区,区内需求源地高度集聚、生境空间极少,是高度城市化的经济发展核心区。中部联通功能群依托生态廊道与供需廊道密集交织,是连接西部供给与东部需求的关键传输枢纽,保障东西向生态流高效传输,缓解供需不平衡压力。

    • 生态重构区(嘉兴)仅含需求源地,生态本底薄弱,是都市圈内供需失衡最典型的赤字区,需进行生态重构,提升存量空间生态功能,缓解供需矛盾。生态提升区(绍兴、湖州)具备需求源地、供需节点及优化廊道,生态基础一般,依托供需节点和优化廊道,完善区域生态网络,提升游憩连通性质量。生态修复区(杭州)要素最为齐全且生态源地和需求源地面积比例相当,具有良好的生态环境和经济社会基础,需进行生态修复,锚固区域现状生态廊道和供需廊道,充分发挥生态和经济优势。生态保护区(黄山、衢州)中生态源地占主导,具有优异的生态系统服务供给能力,是全域主要的生态供给空间,应严格保护现状生态格局,从源头强化生态系统结构和功能。

    • 2004—2024年杭州都市圈生态系统服务高供给区域位于西部林地占主导的山区,高需求区则锁定于东部平原城镇群。由于自然资源禀赋和发展水平的异质性,越发达的城市区域生态系统服务供需总体失衡程度越高,这种环境不公平现象在现有文献中已有充分论证[31–32]。将生态系统服务供需平衡纳入生态安全格局构建不仅对于可持续发展至关重要,也是提升人类福祉的关键举措[33–34]。长三角地区以生态系统服务供需理论为核心的生态安全格局研究表明,生态源地分布在杭州、黄山及衢州等地西部和中部,需求源地主要位于人口密集的东部城区[35],这与本研究结论一致。为形成有效提升生态福祉的社会-生态安全格局,本研究对供给端和需求端进行长时序动态追踪,构建了从供给演变、廊道传输到需求响应的分析链条,采取近源补充和节点互联的结构优化策略,在一定程度上缓解东部需求源地因本地供给缺失而面临的生态服务枯竭压力。都市圈尺度下的格局研究常面临跨行政区协同治理的共性挑战,跨行政边界尺度下的生态安全格局的建设是解决大范围生态安全问题的关键[32]。为此,本研究形成“三带三群四区”的优化布局方案。“三带”中北源水系生态涵养带(新安江-千岛湖-分水江)沿线分布有大量生态夹点和障碍点,是跨省生态流传输的关键瓶颈区。2023年,浙皖两省签署《新安江-千岛湖生态环境共同保护合作区建设方案(2023—2027年)》(以下简称《方案》),北源水系生态涵养带正是《方案》实施生态补偿的核心区域。“三群”中西部绿色发展群覆盖安徽黄山、浙江衢州及杭州西部等地,区内生态源地面积大、连通性好,以源地间生态廊道为骨架,将其划分为一个功能协同单元,能够促进打通跨省生态流传输通道。“四区”中生态保护区(黄山、衢州)是钱塘江的北源及南源,生态修复区(杭州)作为下游主要受益区,可通过北源水系生态涵养带和南源水系生态涵养带接收上游生态服务,实现上游保护、下游受益的协同效应。

    • 本研究以杭州都市圈为研究对象,基于2004—2024年多源数据,量化5类生态系统服务供需动态,构建社会-生态安全格局。结论表明:杭州都市圈综合生态系统服务供需匹配形成“西盈东缺”的空间格局,经济增长是供需失衡加剧的核心驱动力;生态源地面积大幅缩减,需求源地面积小幅缩减,但源地数量增加、破碎化加剧;生态廊道呈“长而集中”的蛛网状分布,供需廊道呈“短而稀疏”的分散网络;2024年,基于识别的供需节点和优化廊道形成“三带三群四区”的社会-生态安全格局优化布局方案。将来,生态安全格局需动态响应供需演变,在保护西部山区强化生态屏障功能的同时,通过廊道网络优化缓解东部平原的供需失衡压力。

Reference (35)

Catalog

    /

    DownLoad:  Full-Size Img  PowerPoint
    Return
    Return