-
年伐量的计算是森林经理的一项重要工作,也是森林经营方案编制的重要内容[1]。科学合理的森林年伐量对于优化森林结构、提高森林质量,最终实现森林可持续经营具有重要意义。年伐量计算的传统方法包括面积轮伐法、成熟度法、第1林龄公式、平均生长量法等[2],只有立地均匀且林分组成接近法正林时,计算结果才比较客观可靠[3]。而现实中,森林在长期经营过程中,受到人为干预和自然更新等多方面因素,龄组结构往往是不均匀的,此时利用传统方法计算年伐量,结果往往差异较大,需要借助主观分析,选择较为合适的结果。公式法受制于森林复杂的龄组结构,易忽视林分的生长和演化,计算结果不够客观,主观性较强。FSOS采用模拟退火算法安排森林经营作业,通过参数协调控制多项资源,充分考虑森林复杂的环境和林分生长,实现森林多目标长期可持续经营。该模型能使森林生态系统各功能在最自然的状态下实现最佳目标,近期和长远利益相结合,充分发挥森林的生态、经济和社会效益,并且已应用于加拿大不列颠哥伦比亚省和中国长白山地区,取得良好成效[4]。在计算采伐量时,该模型能充分考虑森林的龄组结构、树种组成和林分生长演化规律,通过模拟退火算法寻找最优解,计算结果不受主观影响,准确可靠。本研究以浙江省杭州市建德市林业总场为研究对象,基于森林模拟优化模型(forest simulation and optimization system,FSOS),进行用材林主伐方案的合理年伐量测算研究,以期利用计算机模型解决传统方法的弊端。
-
建德市林业总场位于浙江省杭州市建德市,成立于2014年9月,根据林场职能、经营模式、发展方向基本一致的特点,将建德林场、新安江林场、寿昌林场3家国有林场合并而成。气候特征属于亚热带季风气候,温暖湿润,雨量丰沛,四季分明[5],土壤类型以红壤为主。建德市林业总场育有稳定健康的森林生态系统,现已成为全省森林面积第二,资源优势、生态优势凸显的国有林场,被评为全国首批森林经营实施示范林场、浙江省现代国有林场。
根据2018年森林资源二类调查结果显示:建德市林业总场经营面积为14 346.00 hm2,土地总面积13 169.67 hm2,水域面积1 176.33 hm2,其中林地面积12 862.33 hm2,占土地总面积的97.67%。全场活立木总蓄积量为1 269 634 m3,其中乔木林蓄积1 269 030 m3,占99.95%。森林覆盖率为94.71%,林木绿化率95.07%。主要树种包括杉木Cunninghamia lanceolata、马尾松Pinus massoniana、湿地松Pinus eliottii、火炬松Pinus taeda、柏木Cupressus funebris等针叶树种和青冈栎Cyclobalanopsis glauca、苦槠Castanopsis sclerophylla、石栎Lithocarpus glaber、麻栎Quercus acutissima、枫香Liquidambar formosana、木荷Schima superba、浙江樟Cinnamomum chekiangense、浙江楠Phoebe chekiangensis等阔叶树种。松木林分主要树种为马尾松、湿地松、火炬松;杉木林分主要树种为杉木、柳杉Cryptomeria fortunei、池杉Taxodium ascendens;柏木林分主要树种为柏木、圆柏Sabina chinensis、侧柏Platycladus orientalis;硬阔类林分主要树种为苦槠、青冈栎、麻栎、樟树Cinnamomun camphora、浙江樟、豹皮樟Litsea coreana、紫楠Phoebe sheareri、浙江楠、木荷、枫香等;软阔类林分主要树种为檫木Sassafras tsumu、白花泡桐Paulownia fortunei、杨树Populus spp.等。
全场用材林面积为3 346.16 hm2、蓄积334 407.5 m3,用材林面积、蓄积按龄组统计如图1所示。现有用材林龄组结构分布很不均匀,面积、蓄积主要集中在中龄林、近熟林和成熟林,其中成熟林蓄积105 662.60 m3,占用材林蓄积总量的31.6%;近熟林蓄积91 118.59 m3,占用材林蓄积总量的27.26%,近期可采伐蓄积较大。
-
数据来源于建德市林业总场2018年的森林资源二类调查数据,共3 389个小班数据,涉及57个调查因子,包括小班号、小班面积、树种组成、平均年龄、平均树高、平均胸径、蓄积量、每公顷株数、森林类别、起源、保护等级、龄组、土地类型、坡度、坡向等。
-
林分的生长过程与所处的立地条件密切相关,立地级的划分对于预测树种生长、材种出材量、森林采伐量等森林经营管理活动意义重大[6]。根据树种的树高和年龄数据,基于理查德(Richards)方程[7]结合SPSS软件进行非线性回归分析,拟合树种的树高生长曲线,由3倍残差绝对值的标准差确定上下限,根据上下限确定的范围,将所有小班划分为3级立地级。Richards方程:
$y={a(1-{\rm {e}}^{-bt})}^{c}$ 。其中:y为树木调查因子树高;t为林木年龄;a、b、c为待定参数;e为自然对数。 -
按照面积控制法中的面积轮伐法、成熟度法、第1林龄公式、第2林龄公式分别计算用材林主要树种的年伐面积和蓄积。面积轮伐法:
$S=F/u$ ,${{E}}={{S}}\times {{m}}$ ;成熟度法:S=(S成+S过)/a,E=(S成+S过)/a;第1林龄公式:S=(S近+S成+S过)/(2a),$E={{S}}\times m$ ;第2林龄公式:S=(S中+S近+S成+S过)/(3a),$E=S\times m$ 。其中:S为年伐蓄积;F为经营单位总面积;u为轮伐期;E为年伐蓄积;a为一个龄级期的年数;m为成过熟林平均单位面积蓄积量。 -
FSOS模型是综合了多目标管理驱动、人工智能算法、大数据挖掘、地理信息等技术,基于浏览器操作的智慧森林云计算管理决策平台[8]。该模型可以对森林生态系统进行优化模拟,为生态系统中短期以及长期战略规划提供支持和科学决策,并能将管理措施落实到具体小班,实现森林生态系统的定时、定位、定量管理[9]。
FSOS模型的相邻小班分析和小班分组工具能对导入的二类小班数据进行整理和分组,以便进行后续的研究。FSOS模型的基本参数包括林分动态和景观水平的“非木材资源”指标。林分动态参数包括蓄积量最大年平均生长量(MAI)、蓄积量达到最大年平均生长量时的林龄(TMax)和控制蓄积量生长曲线的常数(MValue),基于二类数据整理分析输入各树种的MAI和TMax,MValue值取3,基于Richards方程,以这3个参数作为初始值进行非线性回归分析,生成树种的生长曲线。由树种的生长曲线按林分的树种组成比例合成林分生长曲线。景观水平的“非木材资源”指标包括水源涵养、森林碳储量、野生动物生境、生物多样性等,通过年龄结构和斑块分布参数进行控制,设置不同龄级比例、采伐斑块大小和相邻关系来引导森林结构优化;设置目标权重和偏离目标的惩罚系数,在兼顾多目标实现的同时,优先实现权重大的目标。
-
林分及其生长曲线基于二类调查数据中的小班属性,通过FSOS模型中的林分模块拟合生成。树木生长曲线是定量衡量林分动态的基本参数,在FSOS模型中,不同树种的生长属性是模型的基础输入参数[9]。FSOS模型根据小班的树种组成、蓄积量、胸径、树高等属性值拟合树种的蓄积、树高和胸径生长曲线。将优势树种和立地级作为拟合参数,基于小班属性值生成各个树种在不同立地级下的散点图,使用Richards方程拟合对应的树种生长曲线并给出相应的决定系数R2,用以评价拟合效果。根据树种生长情况相似的特点,将数据较少或数据质量较差的树种进行合并,重新拟合生长曲线以提高树种生长曲线拟合效果。FSOS模型根据以下规则创建林分:同一林分必须具有相同的树种、比例和立地级;当优势树种比例大于70%时,将林分改为纯林;当林分具有相同的树种和比例,且这些树种的总比例大于80%时,合并林分;当相同树种比例差值小于20%时,合并林分。使用相应的树种生长曲线根据每个林分的树种组成及比例拟合成林分的生长曲线,用以预测林分未来生长和演化规律[10]。
-
FSOS模型采用了模拟退火算法技术,这是一种局部搜索算法,它能概率性地跳出局部最优解,实现全局最优[11]。其原理是模拟固体从高温退火冷却,通过控制冷却过程,使物质颗粒有序地排列在理想位置从而实现理想性能[9]。面对森林经营过程中复杂的森林结构、林分生长、市场和政策等诸多不稳定因素,并且需要综合考虑生态、经济、社会等多方面效益,使用传统经营方案编制方法往往很难实现。模拟退火算法可以兼顾多目标,根据各目标需求程度,进行模拟优化分析。目标函数包括木材生产量、年龄结构、斑块分布、碳储量等,模型通过目标函数控制实现各目标,通过总目标函数控制各目标的权重和偏离目标时的惩罚系数,选出能最大程度实现各目标的最佳经营方案[12–13]。总目标控制森林各目标要求达到理想状态的同时,实现森林经营的经济效益最大化。FSOS模型对模拟退火算法进行优化调整后可进行并行计算,同时结合云计算技术大幅提高算法的运行速度,能很好地解决森林宏观调整及优化经营问题。
-
根据《中国可持续发展林业战略研究总论》[14]中提出的森林资源幼龄林、中龄林、近熟林、成熟林、过熟林面积比例2∶1∶1∶2∶1,设置理想状态,即成熟林、过熟林面积占比达42.86%为比较理想的龄组分布状态[15]。优先控制成熟林、过熟林面积,提高林分价值,营造良好的森林结构和景观格局。在方案模块创建用材林主伐方案,以5 a为1个规划单位,共设10个作业周期,研究未来50 a林场经营和森林采伐。选择一般用材林为经营采伐对象,运行方案经数万次的优化和迭代,生成最优方案。
-
如表1所示:面积轮伐法的计算结果最大,年伐面积为94.06 hm2,年伐蓄积13 812 m3;第2林龄公式的结果最小,年伐面积82.73 hm2,年伐蓄积12 069 m3。不同公式的计算结果存在明显差异,需要进一步分析判断,选择合适结果。
表 1 用材林年主伐量公式测算表
Table 1. Result of annual main cutting amount of timber forests calculating by formula
林分 面积轮伐法 成熟度法 第1林龄公式 第2林龄公式 确定采用的年伐量 面积/hm2 蓄积/m3 面积/hm2 蓄积/m3 面积/hm2 蓄积/m3 面积/hm2 蓄积/m3 面积/hm2 蓄积/m3 松木林 49.00 6 897 30.07 4 236 37.80 5 321 44.20 6 222 44.20 6 222 杉木林 41.20 6 492 58.73 9 258 41.60 6 551 33.73 5 317 41.60 6 551 柏木林 0.26 0 0 0 0.60 0 0.47 0 0 0 硬阔类 2.00 280 0.13 19 2.00 273 3.00 412 2.00 273 软阔类 1.60 143 2.33 204 2.00 177 1.33 120 2.00 177 合计 94.06 13 81 91.33 13 717 83.90 12 321 82.73 12 069 89.80 13 223 根据年伐量模拟1个轮伐期内各树种用材林的采伐过程,评价各计算结果。其中,松木林的轮伐期为50 a,以10 a为1个分期,共5个分期。从森林永续利用的角度看,成熟度法在第2分期全部采伐完,面积轮伐法在第3分期全部采伐完,第1、第2林龄公式在第4分期全部采伐完。成熟度法和第1林龄公式分别会从第1分期和第2分期起采伐未成熟林分,面积轮伐法、第2林龄公式从第3分期起会采伐未成熟林分。综合比较,第2林龄公式计算结果相对较好,因此松木林年伐量采用第2林龄公式计算结果。
杉木林的轮伐期为30 a,以5 a为1个分期,共6个分期。从森林永续利用的角度看,成熟度法在第5分期全部采伐完,面积轮伐法、第1、第2林龄公式在第6分期全部采伐完。成熟度法从第2分期起会采伐未成熟林分,面积轮伐法、第1、第2林龄公式均不会采伐未成熟林分。从成熟林及时采伐的角度看,第2林龄公式到第6分期仍未伐完,出现大量过熟林的积压,所以第2林龄公式不适合。考虑在轮伐期内得到最大采伐量确定杉木用材林选用第1林龄公式计算采伐量。
由于柏木林总体的面积和蓄积占比相对较小,柏木林的计算结果中年伐面积很小,且柏木林都为未成熟林分,所以年伐蓄积计算结果为0。建德市林业总场的阔叶树林均为天然林,根据《浙江省林木采伐管理办法(浙江省政府令第175号)》规定,不允许采伐天然阔叶林,此处仅作理论计算,不作分析。
综合分析,最终确定松木林年伐面积为44.2 hm2,年伐蓄积6 222 m3;杉木林年伐面积41.6 hm2,年伐蓄积6 551 m3。
-
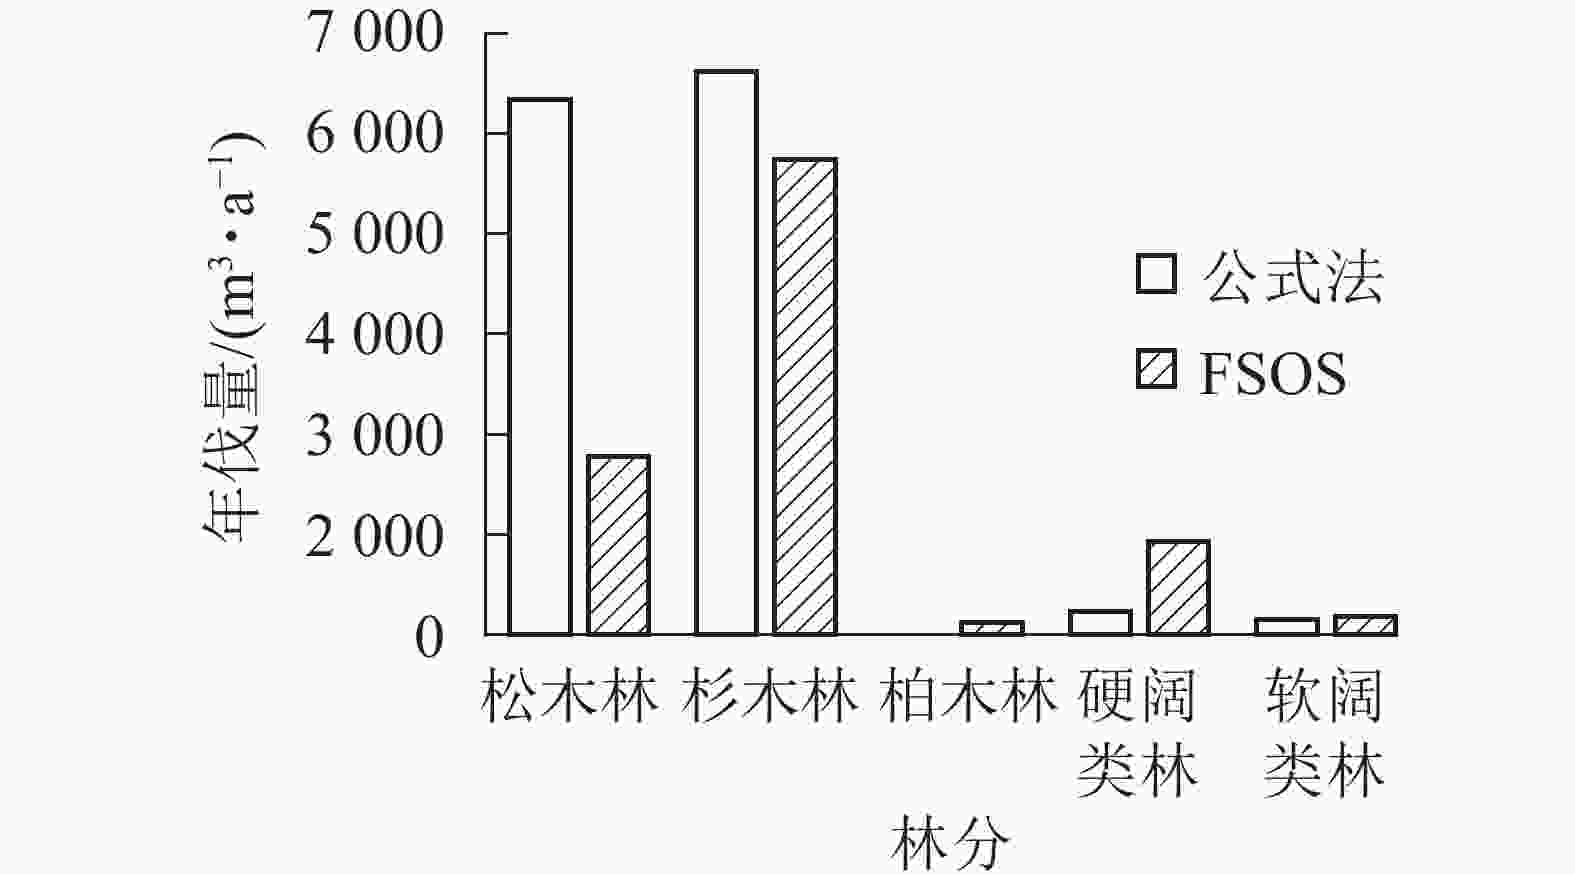
如表2所示:由于基础数据庞大以及数据质量的参差不齐,除柏木林外,决定系数R2均超过0.8,部分林分曲线拟合精度能达0.9。拟合生长曲线可用以预测林分的生长和演变,揭示森林的未来发展。基于森林当前的生长蓄积和林分生长曲线,模型进行后续运行,计算不同林分的合理年伐量,并最终生成用材林主伐经营方案。用材林主伐方案结果显示:全场用材林年伐量为9 073.51 m3,年伐面积76.35 hm2。其中松木林年伐量2 077.48 m3,杉木林5 528.49 m3,柏木林152.78 m3,硬阔类林1 081.60 m3,软阔类林212.91 m3(图2)。平均采伐年龄40 a,平均采伐木材量109.27 m3。2种方法对比,FSOS计算的年伐量明显小于公式法计算结果。不同林分类型结果对比如图2所示,差异主要体现在松木年伐量的计算结果。松木林早期多为纯林,经过多年经营,目前均以针阔混交林的形式存在,公式法难以将松木准确地从混交林中区分出来,导致计算结果偏大。
表 2 主要林分蓄积生长曲线
Table 2. Cumulative growth curve of the main forests
林分 立地级 蓄积生长曲线(Richards方程) R2 林分 立地级 蓄积生长曲线(Richards方程) R2 1 $\scriptstyle y=303.252{(1-{\rm {e}}^{-0.016t})}^{0.804}$ 0.809 1 $\scriptstyle y=172.360{(1-{\rm{e}}^{-0.019t})}^{1.406}$ 0.842 松木林 2 $\scriptstyle y=237.033{(1-{\rm{e}}^{-0.019t})}^{0.979}$ 0.844 软阔类林 2 $\scriptstyle y=144.532{(1-{\rm{e}}^{-0.011t})}^{1.478}$ 0.839 3 $\scriptstyle y=212.702{(1-{\rm{e}}^{-0.020t})}^{1.342}$ 0.941 3 $\scriptstyle y=109.580{(1-{\rm{e}}^{-0.005t})}^{1.070}$ 0.864 1 $\scriptstyle y=199.455{(1-{\rm{e}}^{-0.080t})}^{0.987}$ 0.887 1 $\scriptstyle y=157.360{(1-{\rm{e}}^{-0.164t})}^{3.979}$ 0.934 杉木林 2 $\scriptstyle y=156.676{(1-{\rm{e}}^{-0.197t})}^{8.672}$ 0.952 阔叶混交林 2 $\scriptstyle y=140.502{(1-{\rm{e}}^{-0.244t})}^{16.936}$ 0.886 3 $\scriptstyle y=134.420{(1-{\rm{e}}^{-0.175t})}^{11.818}$ 0.979 3 $\scriptstyle y=125.470{(1-{\rm{e}}^{-0.025t})}^{1.345}$ 0.831 1 $\scriptstyle y=322.000{(1-{\rm {e}}^{-0.019t})}^{1.019}$ 0.741 1 $\scriptstyle y=163.532{(1-{\rm{e}}^{-0.105t})}^{2.320}$ 0.825 柏木林 2 $\scriptstyle y=200.425{(1-{\rm{e}}^{-0.088t})}^{3.080}$ 0.925 针叶混交林 2 $\scriptstyle y=123.737{(1-{\rm{e}}^{-0.195t})}^{9.137}$ 0.894 3 $\scriptstyle y=157.050{(1-{\rm{e}}^{-0.074t})}^{7.397}$ 0.725 3 $\scriptstyle y=94.968{(1-{\rm{e}}^{-0.249t})}^{21.717}$ 0.813 1 $\scriptstyle y=189.580{(1-{\rm{e}}^{-0.020t})}^{0.925}$ 0.907 1 $\scriptstyle y=222.164{(1-{\rm{e}}^{-0.015t})}^{0.461}$ 0.838 硬阔类林 2 $\scriptstyle y=137.292{(1-{\rm{e}}^{-0.017t})}^{1.123}$ 0.889 针阔混交林 2 $\scriptstyle y=131.136{(1-{\rm{e}}^{-0.148t})}^{5.113}$ 0.911 3 $\scriptstyle y=111.853{(1-{\rm {e}}^{-0.067t})}^{3.455}$ 0.830 3 $\scriptstyle y=127.590{(1-{\rm{e}}^{-0.040t})}^{1.324}$ 0.821 -
如表3所示:从前10 a来看,共采伐小班297个,年平均采伐面积为118.51 hm2·a−1,年平均采伐蓄积14 207.09 m3·a−1,平均采伐木材量118.86 m3·hm−2,平均采伐年龄37.5 a。其中,年采伐量松木林为3 921.68 m3·a−1,杉木林9 288.80 m3·a−1,柏木林98.01 m3·a−1,硬阔类林202.99 m3·a−1,软阔类林176.12 m3·a−1。前10 a的年伐面积和蓄积数值相对较大,因为当前森林龄组结构中,成熟林面积占总面积的22.49%,近熟林面积占25.20%,近期的可采伐面积和蓄积量较大。由于规划开始时林分主要集中在中龄林、近熟林和成熟林,经过3个周期的经营,中龄林和近熟林都逐渐转变为成熟林,并且在前3个周期进行了大量采伐,年伐量从第4期开始持续4期处于较低水平。年伐量的变化与林分结构和龄组演变密切相关,中龄林和近熟林不断成熟,成熟林和过熟林的采伐以及采伐后又形成新的幼龄林,年伐量也随之呈现周期性的波动。
表 3 周期采伐报告
Table 3. Periodic harvesting report
周期 采伐小班数目 平均采伐林龄/a 年平均采伐面积/(hm2·a−1) 年平均采伐蓄积/(m3·a−1) 平均采伐木材量/(m3·hm−2) 1 95 38 70.21 8 169.60 116.35 2 202 37 166.80 20 244.57 121.37 3 100 34 92.35 11 067.15 119.84 4 68 43 27.54 3 538.72 128.52 5 69 41 50.58 6 009.78 118.82 6 63 47 53.58 7 009.39 130.83 7 92 43 58.39 6 728.66 115.24 8 172 41 117.61 13 230.70 112.50 9 104 35 97.20 11 112.82 114.33 10 70 43 29.28 3 623.68 123.75 -
如图3所示:按成熟情况分组,可采伐林地成熟林面积经过早期的采伐,在第3期达到最低值,之后由于年伐量的减小,并且伴随着未成熟林分的生长成熟,成熟林面积得到补充。到了规划后期,成熟林和未成熟林面积趋于稳定,成熟林面积占总面积的40.94%,林分的龄组分布趋于理想状态,龄组结构变动也趋于稳定。
-
如图4所示:规划期起始于2018年,初始状态下,过熟林面积占比很小,仅占4.85%;林分主要集中在中龄林、近熟林和成熟林,成熟林和过熟林占比偏小,龄组结构与理想状态差别较大。到规划期末,成熟林和过熟林面积占比接近理想状态,变化趋于稳定,林分价值提高,有利于可持续经营。模型设置了优先控制成熟林和过熟林面积,所以在经营过程中,成熟林和过熟林面积变化趋势平滑,朝着理想状态不断逼近;而未成熟林分面积占比波动显著,并且呈现出一定的周期性波动,尤其以幼龄林占比变化最为明显。
-
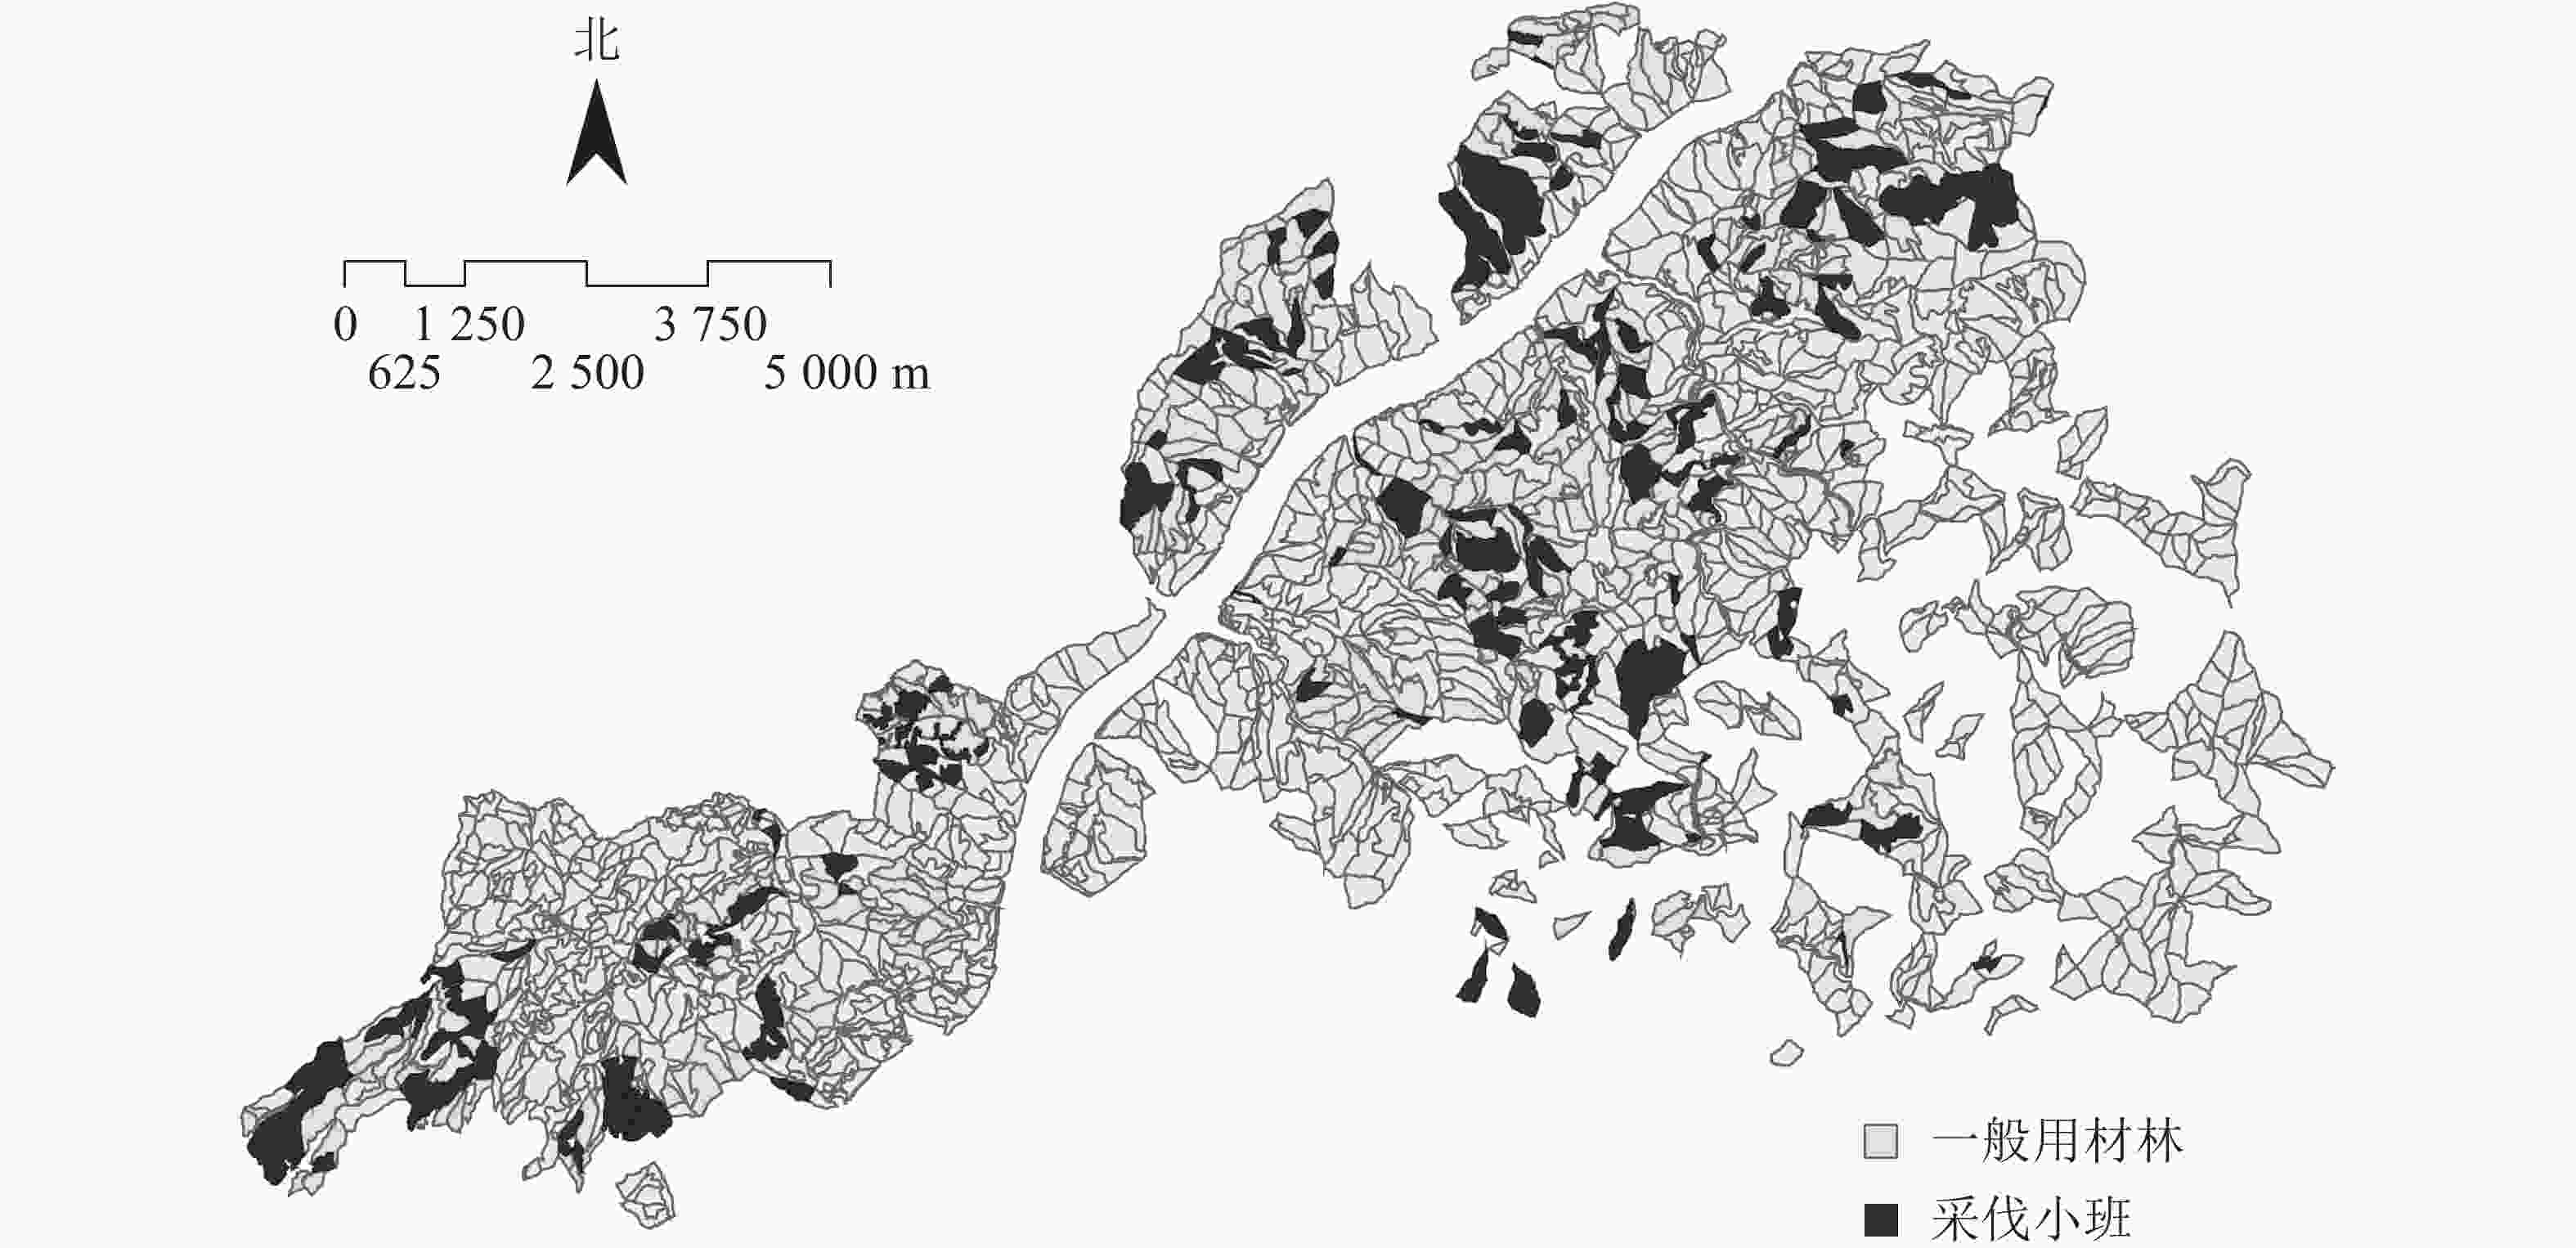
FSOS模型具有地图功能,能将小班与地形图结合,将每个周期的采伐分布精准定位到具体的小班地块,并将其展示在地图上,保证应用的精准性,可直接指导营林作业,便于森林经营管理。图5是2018–2028年建德市林业总场用材林采伐小班的分布情况,清楚地展示了未来需要进行采伐作业的小班地块;利用模拟退火算法迭代优化后的采伐斑块,其分布既便于集中安排作业,节省成本,又避免集中采伐面积过大影响景观。
-
公式法计算得到的年伐量是一个定额,基本能满足在1个轮伐期末成熟林和过熟林及时采伐的要求。但是在到达轮伐期之前,可能出现采伐量过大,采伐了未成熟林分的情况;在达到轮伐期之后,计算的年伐量难以继续指导森林经营。且公式法适用条件苛刻,不能适应复杂的森林环境,计算结果容易偏大,难以科学指导森林可持续经营。
FSOS模型基于模拟退火算法和目标函数求最优解,适应能力强,计算结果准确合理,兼顾多目标,通过目标函数和权重设置控制和协调实现各目标,并能指导实际作业,其结果能兼顾经济、生态和社会效益。森林由于龄组结构的不均匀以及树种的生长情况差异,每个周期的年伐面积和蓄积不应该是定额,FSOS能计算每个周期的年伐量,且年伐量会基于每个周期林分的生长变化而变化,呈现出周期性波动,能顺应森林发展的变化,实现森林的可持续经营,使森林朝着结构稳定、龄组占比合理的方向演变。
Rational annual cutting volume of forest management units based on FSOS
-
摘要:
目的 年伐量的计算是森林经营方案编制的核心内容,合理的年伐量能指导森林可持续经营。使用公式计算年伐量的传统方法,结果偏差较大,主观性较强,局限性明显。本研究利用计算机模型来解决传统方法的弊端。 方法 基于建德市林业总场森林资源二类调查数据,使用森林模拟优化模型(forest simulation and optimization system,FSOS)进行用材林主伐方案的年伐量计算分析,并与公式法计算结果进行对比。 结果 公式法难以适应林场复杂的龄组结构,不同公式计算结果差异较大;而FSOS模型适应能力较强,计算结果准确。FSOS结果显示:全场用材林年伐面积76.35 hm2·a−1,年伐蓄积9 073.51 m3·a−1,平均采伐年龄40 a,采伐木材量109.27 m3·hm−2;在未来50 a的模拟经营过程中,年伐量呈现周期性波动,森林龄组结构变化逐渐趋于稳定,规划期末成、过熟林面积占比达40.94%,接近理想状态。 结论 FSOS模型能适应复杂的龄组结构,预测林分生长;远近结合,兼顾多目标,综合考虑林场经营的经济效益和生态效益,科学指导森林经营。图5表3参15 Abstract:Objective The calculation of annual cutting volume is the core content of forest management planning, and rational annual cutting volume can guide sustainable forest management. The traditional method of using formula to calculate annual cutting volume has such disadvantages as large deviation, strong subjectivity and obvious limitation. This study aims to solve the problems of the traditional method by using an excellent computer model. Method Based on the second-class survey data of forest resources in Jiande Forest Farm of Zhejiang Province, forest simulation and optimization system (FSOS) was used to calculate and analyze the annual cutting volume of the main cutting plan of timber forest, and the results were compared with those calculated by the formula method. Result The formula method was difficult to adapt to the complex age group structure of forest farm, and the calculation results of different formulas were quite different, while FSOS model had strong adaptability and the calculation results were accurate and feasible. FSOS results showed that the annual cutting area of timber forest was 76.35 hm2·a−1, the annual cutting volume was 9 073.51 m3·a−1, and the average cutting age was 40 years, with an average cutting volume of 109.27 m3·hm−2. In the next 50 years of simulated forest management process, the annual cutting volume would fluctuate periodically, and the structural change of the forest age group would gradually become stable. The proportion of mature and over-mature forest area at the end of the planning period would reach 40.94%, close to the ideal state. Conclusion FSOS model can adapt to complex age group structure, predict stand growth, take into account multiple objectives, combine short-term and long-term goals, comprehensively consider the economic and ecological benefits of forest farm management, and scientifically guide forest management. [Ch, 5 fig. 3 tab. 15 ref.] -
Key words:
- forest management /
- annual cutting volume /
- Jiande Forest Farm /
- FSOS model
-
表 1 用材林年主伐量公式测算表
Table 1. Result of annual main cutting amount of timber forests calculating by formula
林分 面积轮伐法 成熟度法 第1林龄公式 第2林龄公式 确定采用的年伐量 面积/hm2 蓄积/m3 面积/hm2 蓄积/m3 面积/hm2 蓄积/m3 面积/hm2 蓄积/m3 面积/hm2 蓄积/m3 松木林 49.00 6 897 30.07 4 236 37.80 5 321 44.20 6 222 44.20 6 222 杉木林 41.20 6 492 58.73 9 258 41.60 6 551 33.73 5 317 41.60 6 551 柏木林 0.26 0 0 0 0.60 0 0.47 0 0 0 硬阔类 2.00 280 0.13 19 2.00 273 3.00 412 2.00 273 软阔类 1.60 143 2.33 204 2.00 177 1.33 120 2.00 177 合计 94.06 13 81 91.33 13 717 83.90 12 321 82.73 12 069 89.80 13 223 表 2 主要林分蓄积生长曲线
Table 2. Cumulative growth curve of the main forests
林分 立地级 蓄积生长曲线(Richards方程) R2 林分 立地级 蓄积生长曲线(Richards方程) R2 1 $\scriptstyle y=303.252{(1-{\rm {e}}^{-0.016t})}^{0.804}$ 0.809 1 $\scriptstyle y=172.360{(1-{\rm{e}}^{-0.019t})}^{1.406}$ 0.842 松木林 2 $\scriptstyle y=237.033{(1-{\rm{e}}^{-0.019t})}^{0.979}$ 0.844 软阔类林 2 $\scriptstyle y=144.532{(1-{\rm{e}}^{-0.011t})}^{1.478}$ 0.839 3 $\scriptstyle y=212.702{(1-{\rm{e}}^{-0.020t})}^{1.342}$ 0.941 3 $\scriptstyle y=109.580{(1-{\rm{e}}^{-0.005t})}^{1.070}$ 0.864 1 $\scriptstyle y=199.455{(1-{\rm{e}}^{-0.080t})}^{0.987}$ 0.887 1 $\scriptstyle y=157.360{(1-{\rm{e}}^{-0.164t})}^{3.979}$ 0.934 杉木林 2 $\scriptstyle y=156.676{(1-{\rm{e}}^{-0.197t})}^{8.672}$ 0.952 阔叶混交林 2 $\scriptstyle y=140.502{(1-{\rm{e}}^{-0.244t})}^{16.936}$ 0.886 3 $\scriptstyle y=134.420{(1-{\rm{e}}^{-0.175t})}^{11.818}$ 0.979 3 $\scriptstyle y=125.470{(1-{\rm{e}}^{-0.025t})}^{1.345}$ 0.831 1 $\scriptstyle y=322.000{(1-{\rm {e}}^{-0.019t})}^{1.019}$ 0.741 1 $\scriptstyle y=163.532{(1-{\rm{e}}^{-0.105t})}^{2.320}$ 0.825 柏木林 2 $\scriptstyle y=200.425{(1-{\rm{e}}^{-0.088t})}^{3.080}$ 0.925 针叶混交林 2 $\scriptstyle y=123.737{(1-{\rm{e}}^{-0.195t})}^{9.137}$ 0.894 3 $\scriptstyle y=157.050{(1-{\rm{e}}^{-0.074t})}^{7.397}$ 0.725 3 $\scriptstyle y=94.968{(1-{\rm{e}}^{-0.249t})}^{21.717}$ 0.813 1 $\scriptstyle y=189.580{(1-{\rm{e}}^{-0.020t})}^{0.925}$ 0.907 1 $\scriptstyle y=222.164{(1-{\rm{e}}^{-0.015t})}^{0.461}$ 0.838 硬阔类林 2 $\scriptstyle y=137.292{(1-{\rm{e}}^{-0.017t})}^{1.123}$ 0.889 针阔混交林 2 $\scriptstyle y=131.136{(1-{\rm{e}}^{-0.148t})}^{5.113}$ 0.911 3 $\scriptstyle y=111.853{(1-{\rm {e}}^{-0.067t})}^{3.455}$ 0.830 3 $\scriptstyle y=127.590{(1-{\rm{e}}^{-0.040t})}^{1.324}$ 0.821 表 3 周期采伐报告
Table 3. Periodic harvesting report
周期 采伐小班数目 平均采伐林龄/a 年平均采伐面积/(hm2·a−1) 年平均采伐蓄积/(m3·a−1) 平均采伐木材量/(m3·hm−2) 1 95 38 70.21 8 169.60 116.35 2 202 37 166.80 20 244.57 121.37 3 100 34 92.35 11 067.15 119.84 4 68 43 27.54 3 538.72 128.52 5 69 41 50.58 6 009.78 118.82 6 63 47 53.58 7 009.39 130.83 7 92 43 58.39 6 728.66 115.24 8 172 41 117.61 13 230.70 112.50 9 104 35 97.20 11 112.82 114.33 10 70 43 29.28 3 623.68 123.75 -
[1] 赵晨, 储菊香, 温雪香, 等. 利用“模拟测算法”计算森林合理年伐量[J]. 林业资源管理, 2012(2): 65 − 68. ZHAO Chen, CHU Juxiang, WEN Xuexiang, et al. Application of the simulating calculation method to the annual forest allowable cut quota estimation [J]. For Resour Manage, 2012(2): 65 − 68. [2] 徐军. 采伐限额编制中合理年采伐量的确定[J]. 辽宁林业科技, 2012(6): 27 − 29. XU Jun. Determination of reasonable annual cutting volume in the establishment of cutting quota [J]. Liaoning For Sci Technol, 2012(6): 27 − 29. [3] 魏鑫. 森林年伐量研究及福建省用材林合理年伐量测算系统的建立[D]. 福州: 福建农林大学, 2007. WEI Xin. Study on Rational Annual Forest Logging and Fuzhou Timber Forest Rational Annual Cutting Calculating System Establish[D]. Fuzhou: Fujian Agriculture and Forestry University, 2007. [4] LIU Guoliang, NELSON J D, WARDMAN C W. A target-oriented approach to forest ecosystem design-changing the rules of forest planning [J]. Ecol Mod, 2000, 127(2): 269 − 281. [5] 陈日红, 金伟, 陈锋, 等. 浙江建德蕨类植物区系研究[J]. 浙江林业科技, 2019, 39(2): 42 − 49. CHEN Rihong, JIN Wei, CHEN Feng, et al. Study on Pteridophyte flora in Jiande [J]. J Zhejiang For Sci Technol, 2019, 39(2): 42 − 49. [6] 亢新刚, 崔相慧, 王虹. 冀北次生林3个树种林分生长过程表的编制[J]. 北京林业大学学报, 2001, 23(3): 39 − 42. KANG Xingang, CUI Xianghui, WANG Hong. Compilation of stand growth table for 3 tree species of secondary forest in north Hebei Province [J]. J Beijing For Univ, 2001, 23(3): 39 − 42. [7] RAI P K, TRIPATHI S. Gaussian process for estimating parameters of partial differential equations and its application to the Richards Equation [J]. Stochastic Environ Res Risk Assess, 2019, 19(33): 8 − 9. [8] 刘莉. 森林植物种质资源价值评估的研究[D]. 哈尔滨: 东北林业大学, 2013. LIU Li. Study on Forest Plant Germplasm Resources Value Evaluation[D]. Harbin: Northeast Forestry University, 2013. [9] 刘莉, 刘国良, 陈绍志, 等. 以多功能为目标的森林模拟优化系统(FSOS)的算法与应用前景[J]. 应用生态学报, 2011, 22(11): 3067 − 3072. LIU Li, LIU Guoliang, CHEN Shaozhi, et al. Multiple functions-targeted algorithms and potential applications of forest simulation optimization system (FSOS) [J]. Chin J Appl Ecol, 2011, 22(11): 3067 − 3072. [10] 李霞, 林文军, 张晶海, 等. 呼中林业局主要森林类型林分蓄积生长曲线表的编制[J]. 林业科技, 2006, 31(3): 18 − 19. LI Xia, LIN Wenjun, ZHANG Jinghai, et al. Establishment of the curve table of the main forest types stand accumulation and growth in Huzhong Forestry Bureau [J]. For Sci Technol, 2006, 31(3): 18 − 19. [11] 肖晓伟, 肖迪, 林锦国, 等. 多目标优化问题的研究概述[J]. 计算机应用研究, 2011(3): 805 − 808, 827. XIAO Xiaowei, XIAO Di, LIN Jinguo, et al. Overview on multi-objective optimization problem research [J]. Appl Res Comput, 2011(3): 805 − 808, 827. [12] LIU Guoliang, HAN Shijie. Long-term forest management and timely transfer of carbon into wood products help reduce atmospheric carbon [J]. Ecol Mod, 2009, 220(13): 1719 − 1723. [13] LIU Guoliang, HAN Shijie, ZHAO Xiuhai, et al. Optimization algorithms for spatially constrained forest planning [J]. Ecol Mod, 2006, 194(4): 421 − 428. [14] 王涛. 中国可持续发展林业战略研究总论[J]. 陕西林业, 2003(4): 15 − 19. WANG Tao. On the sustainable development of forestry strategy in China [J]. For Shanxi, 2003(4): 15 − 19. [15] 潘存德, 师瑞峰. 森林可持续经营: 从木材到生物多样性[J]. 北京林业大学学报, 2006, 28(2): 133 − 138. PAN Cunde, SHI Ruifeng. Sustainable forest management: from timber to biodiversity [J]. J Beijing For Univ, 2006, 28(2): 133 − 138. -

-
链接本文:
https://zlxb.zafu.edu.cn/article/doi/10.11833/j.issn.2095-0756.20190651


 下载:
下载:


