-
京津风沙源治理工程是国家重要的生态工程,目前已进入到二期。工程任务的出发点是保护和扩大林草植被,建设内容主要以低效林改造、人工造林(困难立地和宜林地造林)、封山(沙)育林为主,达到减少风沙危害和水土流失、改善首都及周边地区生态状况的目标。其中,以提升物种多样性和完善林分结构为目标的低效林改造是投资最多、工期最长、任务最艰巨的工程类型。低效林主要表现为林地生产力、森林生态服务功能和社会服务功能显著低于同等立地条件下同类林分的平均水平,因此,其改造措施的实施与效果的研究显得尤为重要。森林物种多样性在维持陆地生态系统平衡,保证人类和社会经济可持续发展方面发挥着不可替代的重要作用[1]。其中,研究环境因子对群落组成、植物分布的驱动是群落生态学研究的重要问题[2-4]。在局地植物群落研究上,影响植物群落组成和分布的首要因素是地形因素和立地条件[5-8]。物种分布及多样性格局主要受海拔、坡向和坡度、经纬度等立地条件影响[9-12],通过典型样地调查法的灰色关联度分析[13-14]、神经网络预测[15]和典范对应分析(CCA)排序[16]可知:海拔是影响森林物种多样性的重要因素,坡向和坡度的影响排位则因研究的群落功能层不同而出现较小出入[17]。同时,土壤养分及各维因素之间的交互作用,也会影响到立地环境条件导致微地形因子环境条件的异质性,从而对群落多样性产生影响[18-21]。最大熵模型[22-24](maximum entropy models,MaxEnt模型)是研究影响物种分布的环境因素并揭示环境因素对物种分布概率影响的生态位模型,被广泛应用于动植物的分布区及保护区研究,并表现出良好的预测效果[25-28]。根据最大熵原理在给定的环境条件下选择最优的概率分布[29],并通过逐步修正单一要素的系数来提高增益值,将增益值增额分配给决定该要素的环境变量,将其转化为百分比后给出对影响该物种分布的环境变量贡献率排序,同时生成分布概率对各环境变量的响应曲线。最终通过受试者工作特征曲线(receiver operating characteristic curve,ROC曲线)评定生成结果是否可信[30]。本研究利用筛选的北京市京津风沙源侧柏Platycladus orientalis低效林调查样地多样性数据和位置数据,选取海拔、坡向、坡度、土壤养分等10个立地环境因素,采用最大熵模型方法分析立地环境因素对侧柏低效林的林下物种多样性指数的影响,同时模拟立地环境改造对侧柏低效林物种多样性的响应,并评估立地改造措施对提升侧柏低效林多样性的效果,以期对提升京津风沙源侧柏低效林多样性提供参考。
-
研究区位于北京市山区(39°28′~41°05′N,115°25′~117°30′E)。该区属暖温带大陆性季风气候,多年平均降水量为583.0 mm,年均气温为10.0~12.0 ℃。主要土壤类型为褐土。原始植被类型主要为阔叶落叶林和温带针叶林,山地植被类型为杂草草甸和混生次生的阔叶落叶林,由于环境破坏,山地植被演替为灌丛和萌生丛。
北京市京津风沙源治理工程的低效林改造区主要分布在北京山区,改造区面积约11 218.76 km2,占北京市总面积的68%。2013年至今,北京市京津风沙源二期工程总面积约729.35 km2,其中侧柏低效林面积约240.92 km2,占京津风沙源二期工程总面积的33%。
-
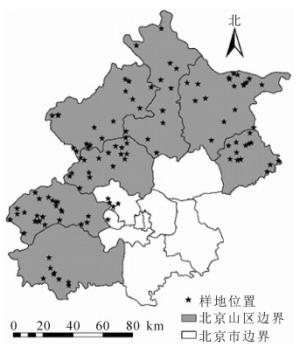
北京市京津风沙源二期低效林改造工程位于北京市西北侧的房山区、门头沟区、昌平区、延庆区、怀柔区、密云区、平谷区以及松山、西山、八达岭和十三陵4个林场。依据工程2013年以来的实施状况、立地条件类型、实施面积、空间布局,选定35个侧柏低效林调查样地(图 1)。
-
① 在低效林改造小班内设置1个20 m × 20 m样地,使用全球定位系统(GPS)获取样地的经纬度、海拔信息,用罗盘测定坡度和坡向。②采用方格纸描点的方法记录样地内乔木株数和位置,用红外线测高器测量乔木的高度,用胸径尺测量乔木胸径,通过设置5个5 m × 5 m大小的灌木样方和10个1 m × 1 m的草本样方调查林下物种多样性及各个物种的盖度,多样性的植物鉴定精确到种,盖度调查以5%为等级间距进行分级估测[31]。样地基本情况见表 1。
表 1 样地基本情况
Table 1. Basic situation of sample plots
样地编号 样地位置 坡向 坡度/(°) 海拔/m 1 十三陵林场花园分区 阳坡 25 260 2 房山长沟镇 半阴坡 10 118 3 门头沟斋堂镇1号 阴坡 12 420 4 门头沟斋堂镇2号 阳坡 5 450 5 平谷王辛庄镇 半阳坡 14 118 6 延庆帮水峪村1号 半阳坡 6 640 7 十三陵林场沟崖分区 半阳坡 25 260 8 房山区张坊镇 阳坡 10 260 9 房山区长沟镇 半阳坡 17 204 10 门头沟斋堂镇3号 半阴坡 12 468 11 门头沟斋堂镇4号 半阳坡 14 490 12 密云高岭镇1号 阳坡 8 209 13 密云高岭镇2号 阳坡 20 280 14 延庆帮水峪村2号 阳坡 22 600 15 平谷金海湖镇 半阳坡 19 300 16 怀柔桥梓镇 阳坡 12 474 17 松山管理处 半阴坡 13 221 18 昌平流村镇西峰山 半阴坡 11 220 19 房山张坊镇东关上村 半阳坡 26 268 20 门头沟沿河城村 半阳坡 15 370 21 密云区古北口镇 半阳坡 12 230 22 密云区不老屯镇 阴坡 15 305 23 平谷区大华山镇 阳坡 20 301 24 延庆区四海镇 半阳坡 18 660 25 八达岭林场 阳坡 24 198 26 十三陵林场蟒山分区 半阳坡 10 120 27 松山自然保护区 阳坡 8 1 010 28 西山林场广宁 北 15 150 29 昌平流村镇古将村 阳坡 10 270 30 房山区水头村 西 35 189 31 房山区口 北 30 104 32 怀柔河西水峪村 阳坡 22 295 33 怀柔河镇村 半阳坡 34 143 34 门头沟清水林场 阳坡 26 521 35 门头沟北岭东五村 阴坡 27 750 -
森林物种多样性包括乔木层、灌木层和草本层各层次的多样性,本研究的研究对象侧柏低效林大多未郁闭和成林,应多关注灌木层和草本层植物群落的多样性,即林下群落的物种多样性指数D[32]:D=W1D1+W2D2。其中:D1和D2为灌木层和草本层的物种多样性指数;W1和W2为给定的灌木层和草本层的权重系数,取值均为0.5。物种多样性指数包括Shannon-Wiener指数、Simpson指数、Gleason指数、Margalef指数和Pielou均匀度指数,计算详见文献[33]。
-
选取北京市海拔、坡向、坡度、全氮、全磷、全钾、速效氮、速效磷、速效钾和土壤有机质共10个立地条件作为环境变量。其中海拔源于30 m分辨率数字高程模型(DEM),坡向和坡度由高程数据提取而来,全氮、全磷、全钾、速效氮、速效磷、速效钾和土壤有机质来源于寒区旱区科学数据中心()。
-
将各个样地对应的Shannon-Wiener指数按升序排列。排列结果显示:Shannon-Wiener指数从0.707开始有显著提升。结合相关对物种多样性的研究[34-35],以Shannon-Wiener指数0.707作为侧柏低效林林下物种多样性高低的筛选点,当Shannon-Wiener指数高于0.707时,认为此时的侧柏低效林林下物种多样性水平高。最终选出12个林下物种多样性水平高的样地作为最大熵模型的点位数据。
-
最大熵模型是以最大熵理论为基础的物种地理尺度空间分布模型。其核心是通过不完全信息推断未知信息,求概率分布在熵值达最大时的条件[36]。模型运行结果采用受试者工作特征曲线(ROC)进行模型的精度验证,通过计算曲线与横坐标轴围成的面积(AUC)判断预测精度。一般而言,当AUC>0.8时,预测结果可被采纳。
-
由表 2可知:35个侧柏低效林样地中,Shannon-Wiener指数的极差最大,Pielou指数的极差最小;Gleason指数的标准差最小,离散程度最低。可推断大多数样地林下植物组成比较固定,种类相对一致。各个多样性指数均能反映样地的物种多样性水平。由于Shannon-Wiener指数是物种多样性指数中最常用的指标,因此,选用Shannon-Wiener指数作为最大熵模型样地筛选的指标。
表 2 侧柏低效林样地林下物种多样性指数
Table 2. Undergrowth species diversity index of cypress low-function forest sample plots
样地编号 Shannon-Wiener Simpson
指数Gleason
指数Margalef
指数Pielou
指数1 0.501 0.542 0.567 0.907 0.827 2 0.668 0.844 0.424 0.844 0.608 3 0.167 0.238 0.125 0.458 0.359 4 0.264 0.298 0.133 0.297 0.131 5 1.001 1.111 0.536 1.029 0.574 6 0.669 0.891 0.713 1.327 0.953 7 0.528 0.297 0.501 0.509 0.480 8 1.358 0.691 0.835 1.200 0.844 9 0.442 0.344 0.268 0.533 0.349 10 1.024 0.620 0.501 0.638 0.932 11 1.069 0.496 1.001 1.365 0.597 12 0.466 0.291 0.334 0.353 0.672 13 0.167 0.339 0.268 0.567 0.349 14 0.707 0.342 0.835 0.878 0.439 15 0.206 0.082 0.501 0.520 0.187 16 1.221 0.667 0.668 1.303 0.881 17 0.623 0.354 0.501 0.499 0.568 18 0.203 0.084 0.501 0.442 0.186 19 0.511 0.214 0.835 1.228 0.318 20 0.119 0.049 0.501 0.542 0.109 21 0.674 0.483 0.334 0.434 0.971 22 0.868 0.510 0.501 1.116 0.790 23 0.203 0.084 0.501 0.442 0.185 24 0.706 0.360 0.668 0.900 0.509 25 0.665 0.861 0.334 0.402 0.959 26 1.438 0.725 0.835 1.516 0.893 27 0.588 0.314 0.501 0.550 0.535 28 0.999 0.556 0.668 0.749 0.721 29 0.162 0.073 0.334 0.205 0.234 30 0.245 0.124 0.334 0.244 0.353 31 1.038 0.672 1.001 1.365 0.579 32 1.399 0.708 0.835 0.929 0.869 33 0.349 0.143 0.668 0.813 0.251 34 1.56 0.781 0.835 0.908 0.970 35 0.582 0.393 0.334 0.209 0.840 极差 1.441 1.062 0.876 1.311 0.862 标准差 0.410 0.275 0.231 0.376 0.281 -
将筛选的样地数据代入最大熵模型,生成ROC曲线(图 2)。从图 2可见:模型训练集曲线的AUC达0.949,完全可以满足分析精度要求[37-38],说明最大熵模型可用于模拟和分析侧柏低效林多样性的概率分布。
-
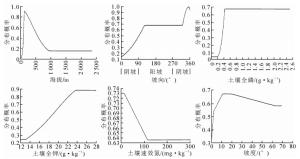
由最大熵模型生成的立地环境因子变量对多样性指数影响的贡献率排序见表 3。表明影响侧柏低效林多样性指数的环境变量主要有8个。影响侧柏低效林物种多样性指数的主要立地环境因子是海拔、坡向和土壤全磷,这三者的累积贡献率之和达86.1%。其中:海拔对侧柏低效林物种多样性指数的贡献率最大,达46.8%。由图 3可知:海拔100~250 m侧柏低效林物种多样性指数高于筛选值的分布概率最大。随着海拔的增加,侧柏低效林林下物种多样性指数高于筛选值的分布概率急剧下降;坡向对侧柏低效林物种多样性指数贡献率次之,达28.9%,从坡向来看,0~90°阴坡对应的侧柏林下物种多样性高于筛选值的分布概率不超过0.5,此范围内坡向对侧柏低效林林下物种多样性高于筛选值的分布概率无影响,在其余坡向上概率值基本维持在0.6左右,此时侧柏低效林在阴坡和阳坡均有可能呈现高林下多样性水平,因此阴坡和阳坡在多样性水平上并无明显差异。土壤全磷是土壤化学性质中贡献率最高的,达10.4%,对侧柏低效林的林下物种多样性具有重要作用;土壤全钾的贡献率为3.9%,当土壤全钾为24 g·kg-1时其对应林下物种多样性高于筛选值的分布概率最大;土壤速效氮贡献率为3.8%,与林下物种多样性呈负相关;坡度的贡献率为3.2%,当坡度为10°~20°时,林下物种多样性高于筛选值的分布概率最大;由于土壤速效钾和速效磷的贡献率低于2.0%,因此不予考虑。
表 3 环境变量贡献率
Table 3. Contribution rate of environmental variables
环境变量 贡献率/% 累积贡献率/% 海拔 46.8 46.8 坡向 28.9 75.7 全磷 10.4 86.1 全钾 3.9 90.0 坡度 3.8 93.8 速效氮 3.2 97.0 速效钾 1.7 98.7 速效磷 1.3 100.0 土壤有机质 0 100.0 全氮 0 100.0 -
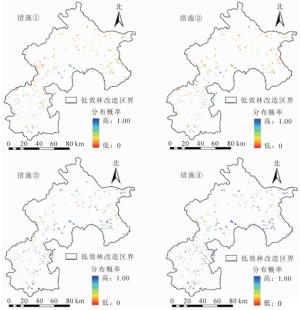
分布概率即相应区域林下物种多样性高于筛选值的概率,数值越大,对应的物种多样性高于筛选值的概率越大,可认为相应区域的林下物种多样性越高。从图 4可见:所有侧柏低效林小班的平均分布概率为0.350,90%以上的小班分布概率低于0.707,侧柏低效林小班的物种多样性有待提高。
-
为提升侧柏低效林小班的林下物种多样性,修改相应环境变量至对应的分布概率表达为最大值的状态是非常必要的。在这些环境变量中,海拔、坡向、年均降水量是自然因素,人为改造难度极大。为了更贴近真实人为改造措施,针对土壤全磷、土壤全钾、坡度实施相应的人工干预措施。现提出4种改造措施:①提高土壤全磷质量分数。保证侧柏低效林小班的土壤全磷最低为0.4 g·kg-1;②微地形改造。采用水平条、水平阶将坡度高于20°的侧柏低效林小班的坡度降到15°;③提高土壤全钾质量分数。保证侧柏低效林小班的土壤全钾最低为24 g·kg-1;④同时施用上述3种措施,提高土壤全磷和全钾质量分数,并进行微地形改造。
-
侧柏低效林小班在改造措施实施后林下物种多样性产生明显变化,空间变化如图 5。实施改造前侧柏低效林小班的分布概率为0.354,提高土壤全磷(措施①)后分布概率提升至0.431,微地形改造(措施②)后概率提升至0.379,提高土壤全钾(措施③)后分布概率提升至0.654,同时实施上述3种措施(措施④)后分布概率提升至0.738。微地形改造措施实施后分布概率提升了7%,与改造前相比没有显著差异,是较为微弱的。主要由于坡度对物种多样性高于筛选值的分布概率影响较小,这个结果很好地解释了最大熵模型对立地环境因子贡献率排序的准确性。说明增施磷肥和钾肥可提高土壤全磷和全钾质量分数,微地形改造措施可提升侧柏低效林的物种多样性,这3种措施之间并无冲突,同时施用效果更佳。
-
影响北京市侧柏低效林物种多样性的主要立地环境因子是海拔、坡向和土壤全磷,这三者的累积贡献率之和达86.1%,其中贡献率最高的为海拔,为46.8%,该结果与么旭阳等[13]、薛鸥等[14]、苏日古嘎等[15]的研究一致。其原因是热量在垂直梯度上受海拔的变化引起不均匀分配,从而使植物群落结构和组成呈不同的表达[10, 16];坡向贡献率达25.9%,坡面的不同朝向导致植物对光照的接收呈较大差异,从而引起植物群落的分布和结构变化。海拔和坡度的变化直接导致侧柏低效林林下群落在温度和光照上的不均衡;土壤全磷的贡献率为9.4%,土壤的速效氮、速效磷和速效钾的贡献率明显小于全氮、全磷、全钾,主要在于森林群落对土壤速效氮、速效磷钾的吸收是一个缓慢的过程,而且低效林的生长环境大多都处于坡陡、土壤侵蚀较大的北京市土石山区,对土壤速效养分的吸收能力不佳。
提高土壤全钾的措施效果最明显,增施磷肥和钾肥以及微地形改造措施可以对提升侧柏低效林的物种多样性起到积极作用。这3种措施同时施用效果比单项措施好,说明改良立地条件可以起到提高侧柏低效林的林下物种多样性的作用。
Reconstruction measures of species diversity of low-function Platycladus orientalis forest in Beijing
-
摘要:
目的 京津风沙源二期低效林改造工程的主要任务之一是提高森林物种多样性。探究影响北京市低效林林下物种多样性指数的环境因素并确定各环境因素影响大小。 方法 以侧柏Platycladus orientalis低效林为研究对象,对35个低效林样地开展调查,获取并计算各样地的物种多样性指数;利用最大熵模型研究10个立地环境因子与侧柏低效林林下物种多样性指数的关系,分析不同立地条件类型对侧柏林下物种多样性的影响。 结果 影响物种多样性的主要环境变量为海拔、坡向、土壤全磷、坡度和土壤全钾,其累积贡献率之和达93.8%;采用提升土壤全磷、土壤全钾和微地形改造的措施后,侧柏低效林林下物种多样性高于筛选值的分布概率,由0.354分别提升至0.431、0.654和0.379,同时实施上述3种措施后,分布概率提升至0.738,单独和同时实施以上措施均有助于提高物种多样性。 结论 改良立地条件可以提高侧柏低效林的林下物种多样性。 Abstract:Objective One of the main tasks of reconstruction of low-function forest of Beijing-Tianjin Sandstorm Source Control Ⅱ Project is to increase species diversity indices. The aim is to explore and assess the effects of various environmental factors on the species diversity indices of understory in low-function forests in Beijing. Method 35 low-function Platycladus orientalis forest plots were investigated and species diversity indices were also calculated. The Maximum Entropy model was used to study the relationship between 10 environmental variables (such as soil properties and topographic factors) and understory species diversity indices of low-function cypress forests, analyze the effects of site conditions on understory biodiversity of cypress forest. Result (1) The main environmental variables affecting the species diversity indices were altitude, slope direction, soil total phosphorus content, slope and soil total potassium content, and the cumulative contribution rate of the five indices reached 93.8%; (2) The probability higher than filter value of species diversity under low-function cypress forests increased from 0.354 to 0.431, 0.654 and 0.379 by improving soil total phosphorus, total potassium content and micro-topography, and the distribution probability was increased to 0.738 after implementing the above three measures. The total phosphorus, total potassium content of soil in classes of low-function cypress forest and slope measures adopted separately and simultaneously can help improve diversity. Conclusion Improvement of site conditions can increase the species diversity indices of low-function cypress forest. -
表 1 样地基本情况
Table 1. Basic situation of sample plots
样地编号 样地位置 坡向 坡度/(°) 海拔/m 1 十三陵林场花园分区 阳坡 25 260 2 房山长沟镇 半阴坡 10 118 3 门头沟斋堂镇1号 阴坡 12 420 4 门头沟斋堂镇2号 阳坡 5 450 5 平谷王辛庄镇 半阳坡 14 118 6 延庆帮水峪村1号 半阳坡 6 640 7 十三陵林场沟崖分区 半阳坡 25 260 8 房山区张坊镇 阳坡 10 260 9 房山区长沟镇 半阳坡 17 204 10 门头沟斋堂镇3号 半阴坡 12 468 11 门头沟斋堂镇4号 半阳坡 14 490 12 密云高岭镇1号 阳坡 8 209 13 密云高岭镇2号 阳坡 20 280 14 延庆帮水峪村2号 阳坡 22 600 15 平谷金海湖镇 半阳坡 19 300 16 怀柔桥梓镇 阳坡 12 474 17 松山管理处 半阴坡 13 221 18 昌平流村镇西峰山 半阴坡 11 220 19 房山张坊镇东关上村 半阳坡 26 268 20 门头沟沿河城村 半阳坡 15 370 21 密云区古北口镇 半阳坡 12 230 22 密云区不老屯镇 阴坡 15 305 23 平谷区大华山镇 阳坡 20 301 24 延庆区四海镇 半阳坡 18 660 25 八达岭林场 阳坡 24 198 26 十三陵林场蟒山分区 半阳坡 10 120 27 松山自然保护区 阳坡 8 1 010 28 西山林场广宁 北 15 150 29 昌平流村镇古将村 阳坡 10 270 30 房山区水头村 西 35 189 31 房山区口 北 30 104 32 怀柔河西水峪村 阳坡 22 295 33 怀柔河镇村 半阳坡 34 143 34 门头沟清水林场 阳坡 26 521 35 门头沟北岭东五村 阴坡 27 750 表 2 侧柏低效林样地林下物种多样性指数
Table 2. Undergrowth species diversity index of cypress low-function forest sample plots
样地编号 Shannon-Wiener Simpson
指数Gleason
指数Margalef
指数Pielou
指数1 0.501 0.542 0.567 0.907 0.827 2 0.668 0.844 0.424 0.844 0.608 3 0.167 0.238 0.125 0.458 0.359 4 0.264 0.298 0.133 0.297 0.131 5 1.001 1.111 0.536 1.029 0.574 6 0.669 0.891 0.713 1.327 0.953 7 0.528 0.297 0.501 0.509 0.480 8 1.358 0.691 0.835 1.200 0.844 9 0.442 0.344 0.268 0.533 0.349 10 1.024 0.620 0.501 0.638 0.932 11 1.069 0.496 1.001 1.365 0.597 12 0.466 0.291 0.334 0.353 0.672 13 0.167 0.339 0.268 0.567 0.349 14 0.707 0.342 0.835 0.878 0.439 15 0.206 0.082 0.501 0.520 0.187 16 1.221 0.667 0.668 1.303 0.881 17 0.623 0.354 0.501 0.499 0.568 18 0.203 0.084 0.501 0.442 0.186 19 0.511 0.214 0.835 1.228 0.318 20 0.119 0.049 0.501 0.542 0.109 21 0.674 0.483 0.334 0.434 0.971 22 0.868 0.510 0.501 1.116 0.790 23 0.203 0.084 0.501 0.442 0.185 24 0.706 0.360 0.668 0.900 0.509 25 0.665 0.861 0.334 0.402 0.959 26 1.438 0.725 0.835 1.516 0.893 27 0.588 0.314 0.501 0.550 0.535 28 0.999 0.556 0.668 0.749 0.721 29 0.162 0.073 0.334 0.205 0.234 30 0.245 0.124 0.334 0.244 0.353 31 1.038 0.672 1.001 1.365 0.579 32 1.399 0.708 0.835 0.929 0.869 33 0.349 0.143 0.668 0.813 0.251 34 1.56 0.781 0.835 0.908 0.970 35 0.582 0.393 0.334 0.209 0.840 极差 1.441 1.062 0.876 1.311 0.862 标准差 0.410 0.275 0.231 0.376 0.281 表 3 环境变量贡献率
Table 3. Contribution rate of environmental variables
环境变量 贡献率/% 累积贡献率/% 海拔 46.8 46.8 坡向 28.9 75.7 全磷 10.4 86.1 全钾 3.9 90.0 坡度 3.8 93.8 速效氮 3.2 97.0 速效钾 1.7 98.7 速效磷 1.3 100.0 土壤有机质 0 100.0 全氮 0 100.0 -
[1] LEVINEL J M, LAMBERS J H R. The importance of niches for maintenance of species diversity[J]. Nature, 2009, 461(7621):254-257. [2] PHILIPS O L, VARGAS N P, MONTEAGUDO A L, et al. Habitat association among Amazonian tree species:a landscape-scale approach[J]. J Ecol, 2003, 91(5):757-775. [3] 于顺利, 马克平, 徐存宝, 等.环境梯度下蒙古栎群落的物种多样性特征[J].生态学报, 2004, 24(12):2932-2939. YU Shunli, MA Keping, XU Cunbao, et al. The species diversity characteristics comparison of Quercus mongolica community along environmental gradient factors[J]. Acta Ecol Sin, 2004, 24(12):2932-2939. [4] 张斌, 张金屯, 苏日古嘎, 等.协惯量分析与典范对应分析在植物群落排序中的应用比较[J].植物生态学报, 2009, 33(5):842-851. ZHANG Bin, ZHANG Jintun, Suriguga, et al. A comparison of co-inertia analysis and canonical correspondence analysis in plant community ordination[J]. Chin J Plant Ecol, 2009, 33(5):842-851. [5] HUO Hong, FENG Qi, SU Yonghong. Shrub communities and environ-mental variables responsible for species distribution patterns in an alpine zone of the Qilian Mountains, Northwest China[J]. J Mt Sci, 2015, 12(1):166-176. [6] 区余端, 苏志尧, 李镇魁, 等.地形因子对粤北山地森林不同生长型地表植物分布格局的影响[J].应用生态学报, 2011, 22(5):1107-1113. OU Yuduan, SU Zhiyao, LI Zhenkui, et al. Effects of topographic factors on the distribution patterns of ground plants with different growth forms in montane forests in North Guangdong, China[J]. Chin J Appl Ecol, 2011, 22(5):1107-1113. [7] MOHAMMADI M F, JALALI S G, KOOCH Y, et al. The influence of landform on the understory plant community in a temperate Beech forest in northern Iran[J]. Ecol Res, 2015, 30(2):385-394. [8] SVENNING J C. Small canopy gaps influence plant distributions in the rain forest understory[J]. Biotropica, 2000, 32(2):252-261. [9] KRAFT N J B, COMITA L S, CHASE J M, et al. Disentangling the drivers of β diversity along latitudinal and elevational gradients[J]. Science, 2011, 333(6650):1755-1758. [10] 马旭东, 张苏峻, 苏志尧, 等.车八岭山地常绿阔叶林群落结构特征与微地形条件的关系[J].生态学报, 2010, 30(19):5151-5160. MA Xudong, ZHANG Sujun, SU Zhiyao, et al. Community structure in relation to micro topography in a montane evergreen broadleaved forest in Chebaling National Nature Reserve[J]. Acta Ecol Sin, 2010, 30(19):5151-5160. [11] BURKE I C, LAUENROTH W K, RIGGLE R, et al. Spatial variability of soil properties in the short grass steppe:the relative importance of topography, grazing, microsite, and plant species in controlling spatial patterns[J]. Ecosystems, 1999, 2(5):422-438. [12] KAMRANI A, JALILI A, NAQINEZHAD A, et al. Relationships between environmental variables and vegetation across mountain wetland sites, N. Iran[J]. Biologia, 2011, 66(1):76-87. [13] 么旭阳, 胡耀升, 刘艳红.长白山阔叶红松林典型森林群落功能多样性及其与地形因子的关系[J].西北农林科技大学学报, 2014, 42(10):95-102. YAO Xuyang, HU Yaosheng, LIU Yanhong. Functional diversity of typical broad-leaved Korean pine forest communities in Changbai Mountains and its relationship with topographicial factors[J]. J Northwest A & F Univ, 2014, 42(10):95-102. [14] 薛鸥, 魏天兴, 朱金兆.环境因子对北京低山区低效林林下植被物种组成和丰富度的影响[J].生态学杂志, 2016, 35(9):2321-2328. XUE Ou, WEI Tianxing, ZHU Jinzhao. Effects of environmental factors on the composition and richness of understory species in low-function forests in Beijing low mountain areas[J]. Chin J Ecol, 2016, 35(9):2321-2328. [15] 苏日古嘎, 张金屯, 王永霞.北京松山自然保护区森林群落物种多样性及其神经网络预测[J].生态学报, 2013, 33(11):3394-3403. Suriguga, ZHANG Jintun, WANG Yongxia. Species diversity of forest communities and its forecasting by neural network in the Songshan National Nature Reserve, Beijing[J]. Acta Ecol Sin, 2013, 33(11):3394-3403. [16] 张昌顺, 谢高地, 包维楷, 等.地形对澜沧江源区高寒草甸植物丰富度及其分布格局的影响[J].生态学杂志, 2012, 31(11):2767-2774. ZHANG Changshun, XIE Gaodi, BAO Weikai. Effects of topographic factors on the plant species richness and distribution pattern of alpine meadow in source region of Lancang River, Southwest China[J]. Chin J Ecol, 2012, 31(11):2767-2774. [17] MUJURU L, KUNDHLANDE A. Small-scale vegetation structure and composition of Chirinda Forest, southeast Zimbabwe[J]. Afr J Ecol, 2007, 45(4):624-632. [18] GASTON K J. Global patterns in biodiversity[J]. Nature, 2000, 405(6783):220-227. [19] SÁNCHEZ-GONZÁLEZ A, LÓPEZ-MATA L. Plant species richness and diversity along an altitudinal gradient in the Sierra Nevada, Mexico[J]. Diversity Distrib, 2005, 11(6):567-575. [20] LACOUL P, FREEDMAN B. Relationships between aquatic plants and environmental factors along a steep Himalayan altitudinal gradient[J]. Aquatic Bot, 2006, 84(1):3-16. [21] ELLUM D S. Demographic Patterns and Disturbance Responses of Understory Vegetation in a Managed Forest of Southern New England: Implications for Sustainable Forestry and Biodiversity Maintenance[D]. New Haven: Yale University, 2007. [22] 朱耿平, 乔慧捷. MaxEnt模型复杂度对物种潜在分布区预测的影响[J].生物多样性, 2016, 24(10):1189-1196. ZHU Gengping, QIAO Huijie. Effect of the Maxent model's complexity on the prediction of species potential distributions[J]. Biodiversity Sci, 2016, 24(10):1189-1196. [23] 张颖, 李君, 林蔚, 等.基于最大熵生态位元模型的入侵杂草春飞蓬在中国潜在分布区的预测[J].应用生态学报, 2011, 22(11):2970-2976. ZHANG Ying, LI Jun, LIN Wei, et al. Prediction of potential distribution area of Erigeron philadelphicus in China based on MaxEnt[J]. Chin J Appl Ecol, 2011, 22(11):2970-2976. [24] 张路. MAXENT最大熵模型在预测物种潜在分布范围方面的应用[J].生物学通报, 2015, 50(11):9-12. ZHANG Lu. Application of MAXENT maximum entropy model in predicting the potential distribution range of species[J]. Biol Bull, 2015, 50(11):9-12. [25] NA Xiaodong, ZHOU Haitao, ZANG Shuying, et al. Maximum Entropy modeling for habitat suitability assessment of Red-crowned crane[J]. Ecol Indic, 2018, 91(5):439-446. [26] JALAEIAN M, GOLIZADEH A, SARAFRAZI A, et al. Inferring climatic controls of rice stem borers' spatial distributions using maximum entropy modelling[J]. J Appl Entomol, 2018, 142(4):388-396. [27] XU Xiang, ZHANG Huayong, YUE Junjie, et al. Predicting shifts in the suitable climatic distribution of walnut (Juglans regia L.) in China:Maximum Entropy Model paves the way to forest management[J]. Forests, 2018, 9(3):103. [28] SARIKAYA O, KARACEYLAN I B, SEN I. Maximum Entropy Modeling (maxent) of current and future distributions of Ips mannsfeldi (Wachtl, 1879) (Curculionidae:Scolytinae) in Turkey[J]. Appl Ecol Environ Res, 2018, 16(3):2527-2535. [29] PHILLIPS S J, ANDERSON R P, SCHAPIRE R E. Maximum entropy modeling of species geographic distributions[J]. Ecol Mod, 2006, 190(3):231-259. [30] PHILLIPS S J, DUDIK M, SCHAPIRE R E. A Maximum Entropy Approach to Species Distribution Modeling in Proceedings of The Twenty-First International Conference on Machine Learning[M]. New York:ACM Press, 2004. [31] ARES A, NEILLA R, PUETTMANN K. Understory abundance, species diversity and functional attribute response to thinning in coniferous stands[J]. For Ecol Manage, 2010, 260(7):1104-1113. [32] 张峰, 张金屯, 上官铁梁.历山自然保护区猪尾沟森林群落植物多样性研究[J].植物生态学报, 2002, 40(增刊1):46-51. ZHANG Feng, ZHANG Jintun, SHANGGUAN Tieliang. Plant diversity of forest community in Zhuweigou of Lishan Moutain Nature Reverse[J]. Acta Phytoecol Sin, 2002, 40(suppl 1):46-51. [33] 卢炜丽.重庆四面山植物群落结构及物种多样性研究[D].北京: 北京林业大学, 2009. LU Weili. Studies on Forest Plant Community Strueture and Biodiversity in Chongqing Simian Mountains[D]. Beijing: Beijing Forestry University, 2009. [34] 汪平, 贾黎明, 李效文, 等.侧柏游憩林抚育对林下植物组成及多样性的影响[J].东北林业大学学报, 2012, 40(11):78-82. WANG Ping, JIA Liming, LI Xiaowen, et al. Effects of tending on species composition and diversity of undergrowth in Platycladus orientalis recreational stands[J]. J Northeast For Univ, 2012, 40(11):78-82. [35] 涂磊.北京西山国家森林公园植物群落研究[D].北京: 北京林业大学, 2016: 70-72. TU Lei. A Study on the Plant Community of Beijing Xishan National Forest Park[D]. Beijing: Beijing Forestry University, 2016: 70-72. [36] ELITH J, PHILLIPS S J, HASTIE T, et al. A statistical explanation of MaxEnt for ecologists[J]. Diversity Distrib, 2011, 17(1):43-57. [37] 李灿, 刘贤安, 王娟, 等.基于MaxEnt模型的四川省红豆杉潜在分布区分析及适宜性评价[J].林业调查规划, 2018, 43(1):22-29. LI Can, LIU Xian'an, WANG Juan, et al. Potential distribution and habitat suitability assessment of Taxus chinensis based on MaxEnt in Sichuan Province[J]. For Inventory Plann, 2018, 43(1):22-29. [38] HANLEY J A, MCNEIL B J. The meaning and use of the area under a Receiver Operating Characteristic (ROC) curse[J]. Radiology, 1982, 143:29-36. -

-
链接本文:
https://zlxb.zafu.edu.cn/article/doi/10.11833/j.issn.2095-0756.2020.01.004


 下载:
下载:


