-
生物量作为反映森林生态系统结构优劣和功能高度最直接的指标之一,其大小是植物群落与周围环境共同作用的结果[1],分析森林生物量变化的驱动因素,可为林业可持续经营提供理论依据[2]。目前,以物种丰富度为代表的物种多样性是最简单的多样性衡量标准,通常被应用于生物量和生产力的预测指标[3-4]。有研究认为:生物多样性对生态系统功能的影响,不仅归因于物种数量,还依赖于物种所具有的功能特征[5]。具有较高功能多样性的生态系统常被认为拥有较高的生产力、恢复力和抗干扰能力,因此,通过比较群落间物种多样性与功能多样性的高低,可分析生态系统的好坏[6-7]。除此之外,林分密度也是控制林木生长与生物量积累的关键因素[8],而且作为最常见的林分经营措施,调整林分密度,可以有效促进纯林向天然林过渡的进程[9]。马尾松Pinus massoniana具有速生、丰产等优良特性,一直被作为中国南方重要的用材树种和荒山绿化造林的先锋树种。然而,由于长期采取单一的纯林经营模式,立地质量降低,生产力下降,严重威胁了林地的可持续经营。目前,通过疏伐补植的措施将针叶纯林改造成针阔混交的近自然林,正逐渐成为替代大面积人工针叶纯林最有希望的途径之一[10]。周东雄[11]以采用疏林结构培育马尾松大径材兼营苦竹Pleioblastus amarus的复合林分为研究对象得出:混交经营有利于马尾松大径材的培育;邹文魁[12]调查分析了40年生马尾松-木荷Schima superba混交林的生物量结构,发现混交乔木层的总生物量高于纯林。综上所述,虽然混交林对马尾松林生物量的积累有一定促进作用,但是存在非自然、非随机的缺点,而且大部分观测对象的周期较短。与此同时,在研究影响生物量变化机制的问题上,一些学者通过研究林下植被生物多样性间接说明生物量的变化[13-14],但忽视了乔木层生物多样性对其生物量变化的影响。作为生态系统中森林地上部分生物量的主体[15],乔木层的生物量在群落中占有很大比例[16-17],研究其生物量与生物多样性的关系具有重要意义[18]。针对混交林与纯林生物多样性以及林分密度之间的变化规律,如何探究出因地制宜的改造措施依然存在很多难点。鉴于此,本研究通过对比不同演替阶段的马尾松人工林生物多样性以及林分密度变化规律,为不同生长阶段的马尾松纯林改造提供有效的数据支持。
-
太子山林场位于湖北省荆门市京山县西南部(30°48′35″~31°02′40″N,112°49′05″~113°03′40″E),北倚大洪山,南接江汉平原。其地貌为低山丘陵区,属中亚热带季风气候,夏秋多雨,冬春干旱,年平均降水量1 094.8 mm,年平均气温16.4 ℃。太子山土壤呈酸性,境内土壤主要为黄褐土、黄棕壤、山地黄棕壤、黄褐色石灰土,其中分布面积最大的是黄棕壤和黄褐色石灰土,矿质养分、有机质状况总体良好。太子山林场内资源丰富,分布着地球上仅能在此成片生长的国家级保护植物对节白蜡Fraxinus hupehensis在内的常绿或落叶针叶林、阔叶林、林下植被等138科、204属近400种。既有秃杉Taiwania flousiana、鹅掌楸Liriodendron chinense、杜仲Eucommia ulmoides、厚朴Magnolia officinalis、楠木Phoebe zhennan、刺楸Kalopanax septemlobus等国家级保护植物,还有第三纪孑遗植物银杏Ginkgo biloba、水杉Metasequoia glyptostroboides等。其中,典型林分有栓皮栎Quercus variabili、麻栎Quercus acutissima、杉木Cunninghamia lanceolata、马尾松Pinus massoniana、柏木Cupressus funebris、湿地松Pinus elliottii、枫香Liquidambar formosana、樟树Cinnamomum camphora等。
-
在2018年7月和2019年6月,依据太子山林场马尾松人工林近自然经营方案,针对早期疏伐后的纯林,采用空间代替时间的方法,分别选择自然演替30年生、40年生以及50年生的马尾松林作为调查对象。其中30年生马尾松林共调查12块样地,这些样地还处于演替早期阶段,并且在原有树种基础上新增了1~2个树种;40年生马尾松林共调查18块样地,这一演替程度的马尾松林包含的演替树种已经达3~4个;50年生的马尾松林共调查18块样地,此阶段的马尾松林在自然演替下新增了5~7个树种。所有样地共计48块,每个样地设置20 m
$ \times $ 20 m样方,记录坡度、坡向、林龄,并对胸径≥5 cm的木本植物每木检尺。 -
生物量计算过程是在统计样地林分组成概况之后,对样地的所有树种进行划分,主要包括马尾松、麻栎、樟树、柏木、杉木、其他阔叶树种。每种树种的生物量计算公式见表1。
表 1 生物量计算方法
Table 1. Biomass calculation methods
树种 生物量计算公式 参考文献 马尾松 ${ W=0.105\;6 ({D}^{2}H{)}^{0.824\;7}} $ [19] 麻栎 $ {W=1.137\;96 \times {10}^{-3}{D}^{2.082\;5}{H}^{2.115\;4} }$ [20] 樟树 $ {W=0.112\;502 \left({D}^{2}H\right)} $ [20] 柏木 $ {W=0.027\;241 ({D}^{2}H{)}^{1.008\;7}} $ [20] 杉木 $ {W=0.257 ({D}^{2}H{)}^{0.697\;0}} $ [21] 其他阔叶树种 $\;\;{ {\ln}W=-1.982+1.209{\ln}{D}^{2}} $ [22] 说明:W为生物量;D为胸径;H为树高 -
引用了亚热带气候带下马尾松与阔叶树种的林木材积生长率方程,并通过林分生物量扩展因子方程将每个样地在10 a的总材积生长量转换为生物量[23-25]。由于柏木与杉木都分布在40年生的样地中,不需要对其进行转换,所以本研究没有考虑其转换的材积生长率公式,只引入了马尾松和其他阔叶树种的生产率方程来计算每木材积生长率(表2),最后通过生物量扩展因子方程将材积换算为生物量(表3)。
表 2 单木材积生长率方程
Table 2. Wood growth rate equation of P. massoniana and broad-leaved trees
树种 单木材积生长率方程 马尾松 ${ Y=5.528+99.865 {\rm{exp} }(-0.101 D-0.086 A)}$ 其他阔叶树种 ${Y=0.088+0.007 D}$ 说明:Y为单木材积生长率;D为单木胸径;A为年龄 表 3 生物量扩展因子方程
Table 3. Biomass expansion factor equation of P. massoniana and mixed coniferous forests
林分 生物量扩展因子方程 马尾松纯林 ${B=0.503\;4 V+20.547\;0 }$ 针阔混交林 ${ B=0.516\;8 V+33.237\;8}$ 说明:B为单木生物量;V为单木材积 -
为了描述群落内物种多样性的分布特征,借助R语言中vegan包的diversity函数计算了Shannon-Wiener指数、Simpson指数以及Pielou指数,计算公式参考文献[26]。
-
功能多样性参数测量采用R的FD包计算每个样地的功能丰富度(FRic)、功能均匀度(FEve)、功能离散度(FDis)、功能多样性(RaoQ),计算公式及含义参见文献[27]。
-
为了排除生物量随着年龄增加而变化的影响,在分析生物量与各因素之间的关系之前,通过林木生长模型将各演替阶段的生物量统一换算为40年生。同时,为了避免立地条件对生物量的影响,选择在相同土壤条件下位于同一坡向以及相近坡度的林分进行研究。通过单因素方差分析探究了不同演替程度下各参数的差异(显著性水平为α=0.05)。使用普通最小二乘(OLS)多元回归模型来检验多样性、林分密度对森林生物量的影响。在拟合模型前所有数据都进行了标准化处理。各参数的计算以及相关性分析主要借助R 3.5.1来实现。
-
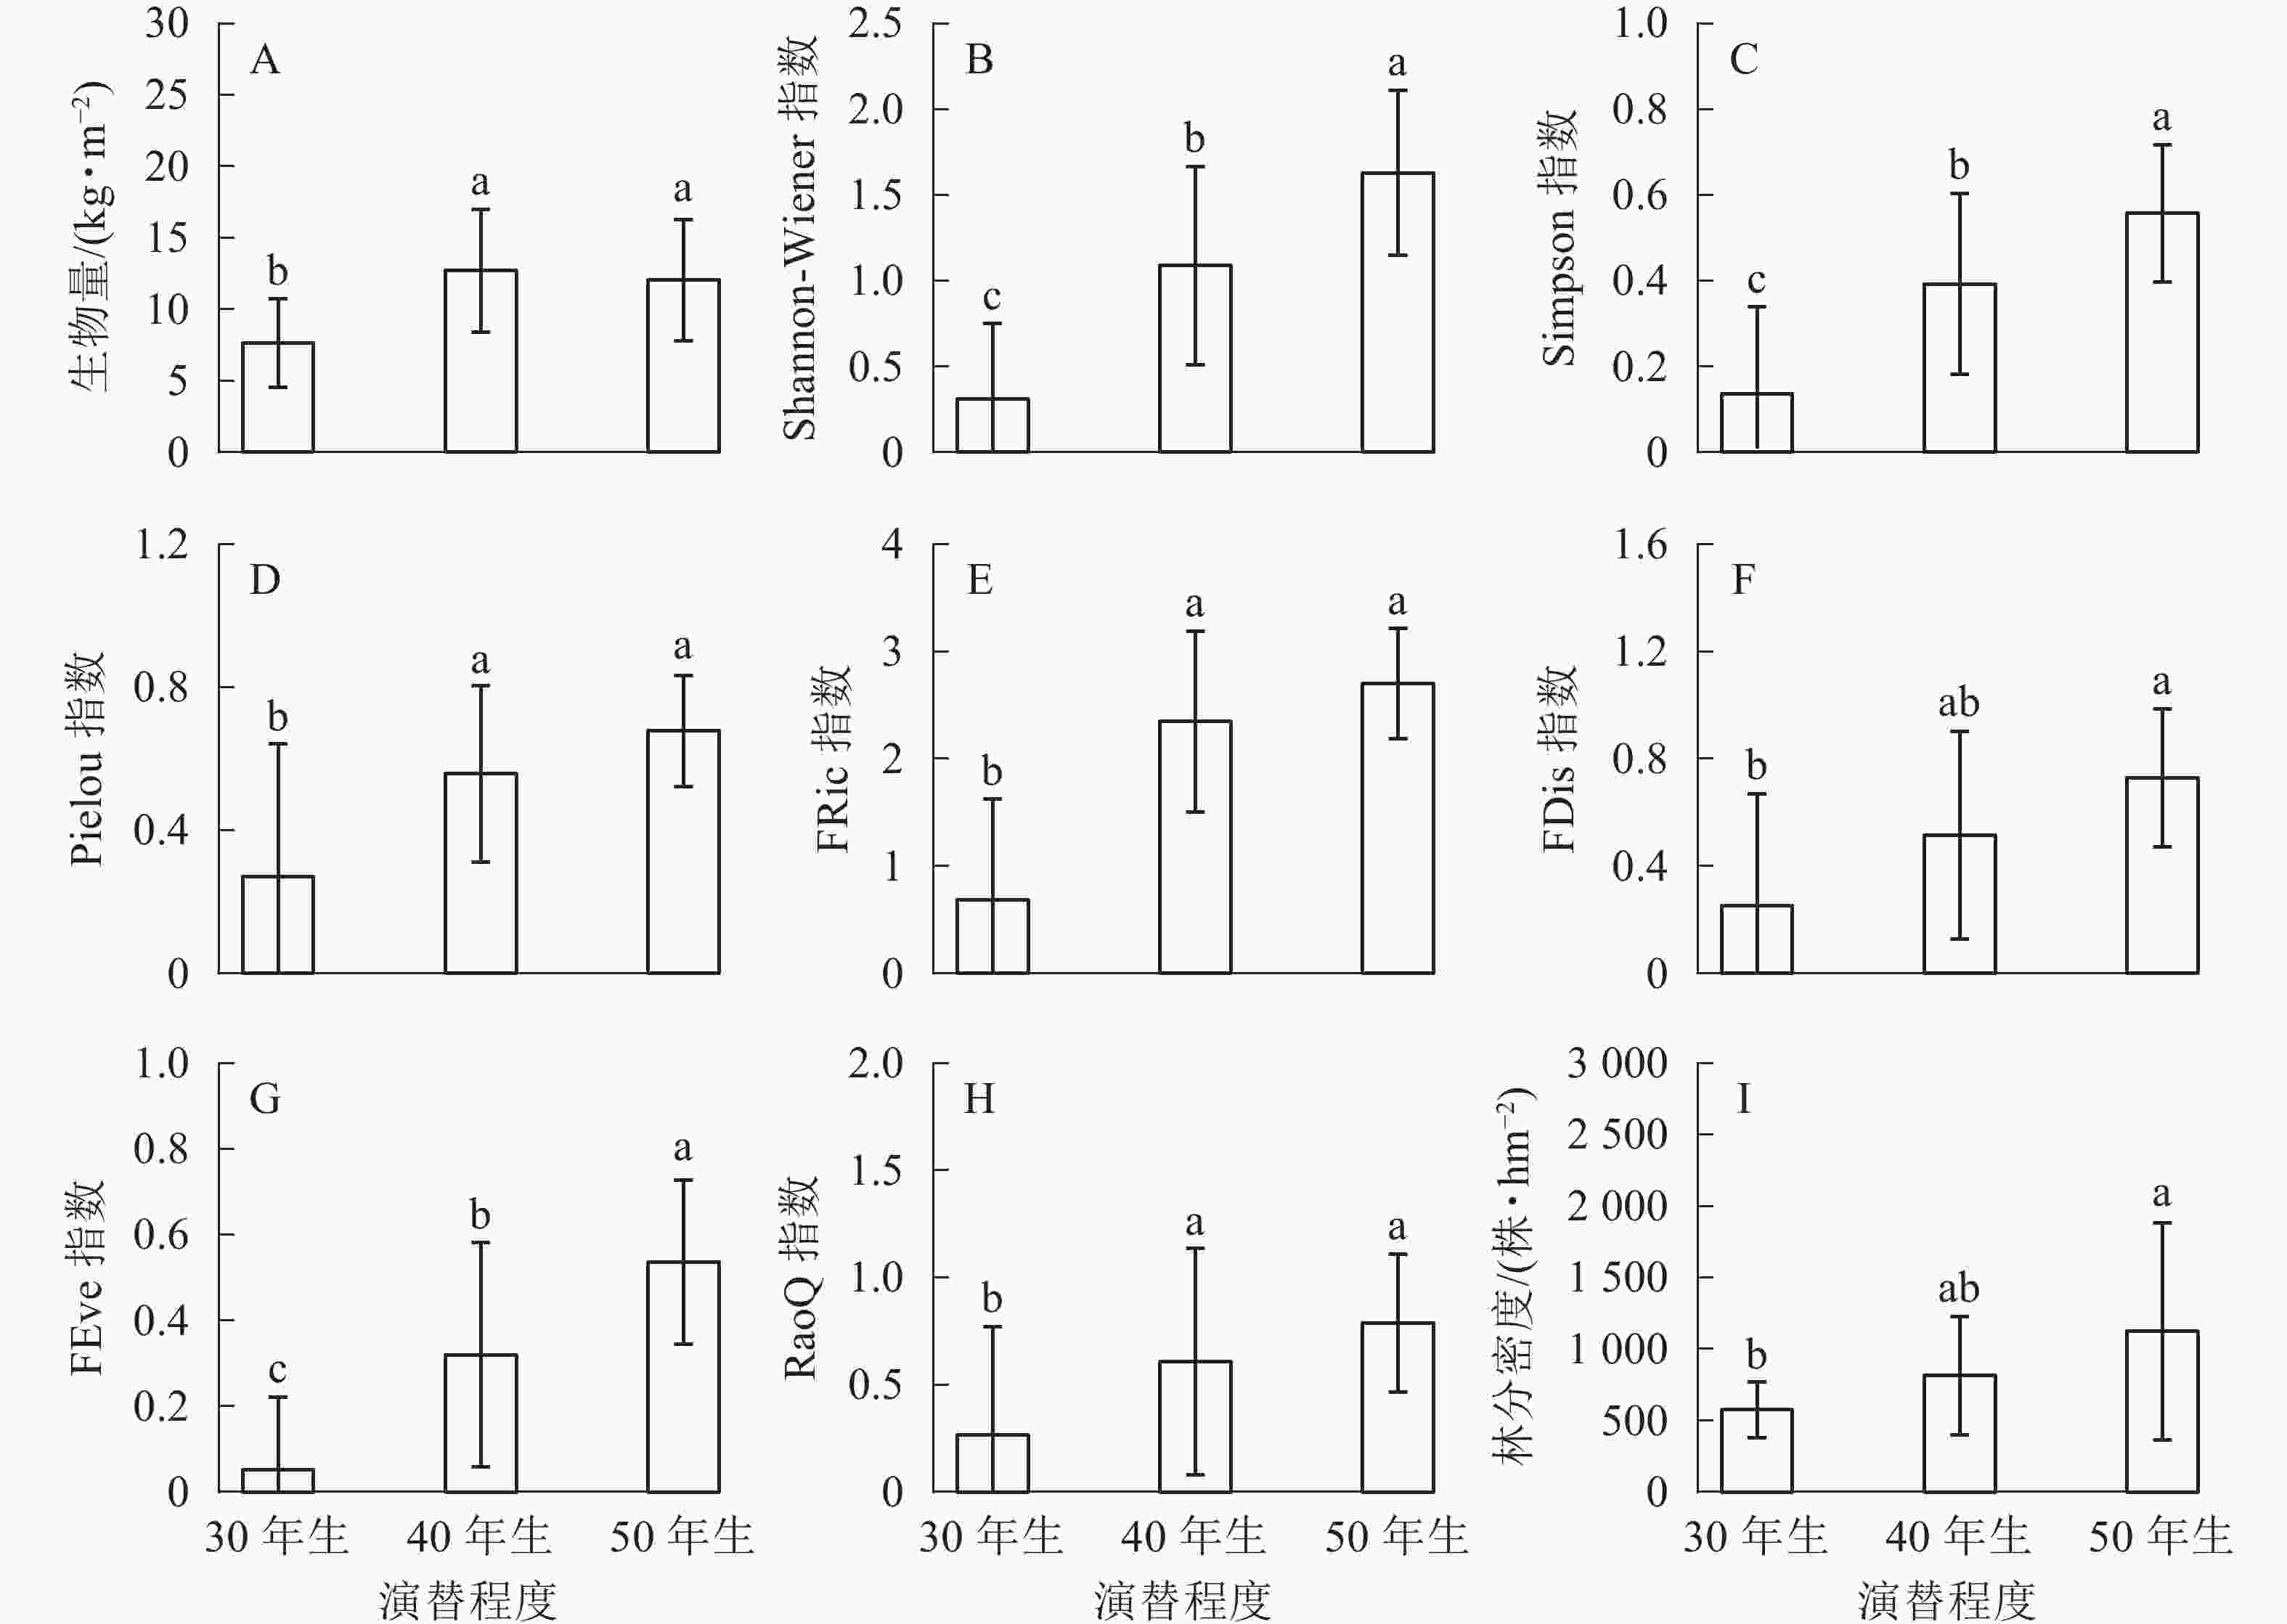
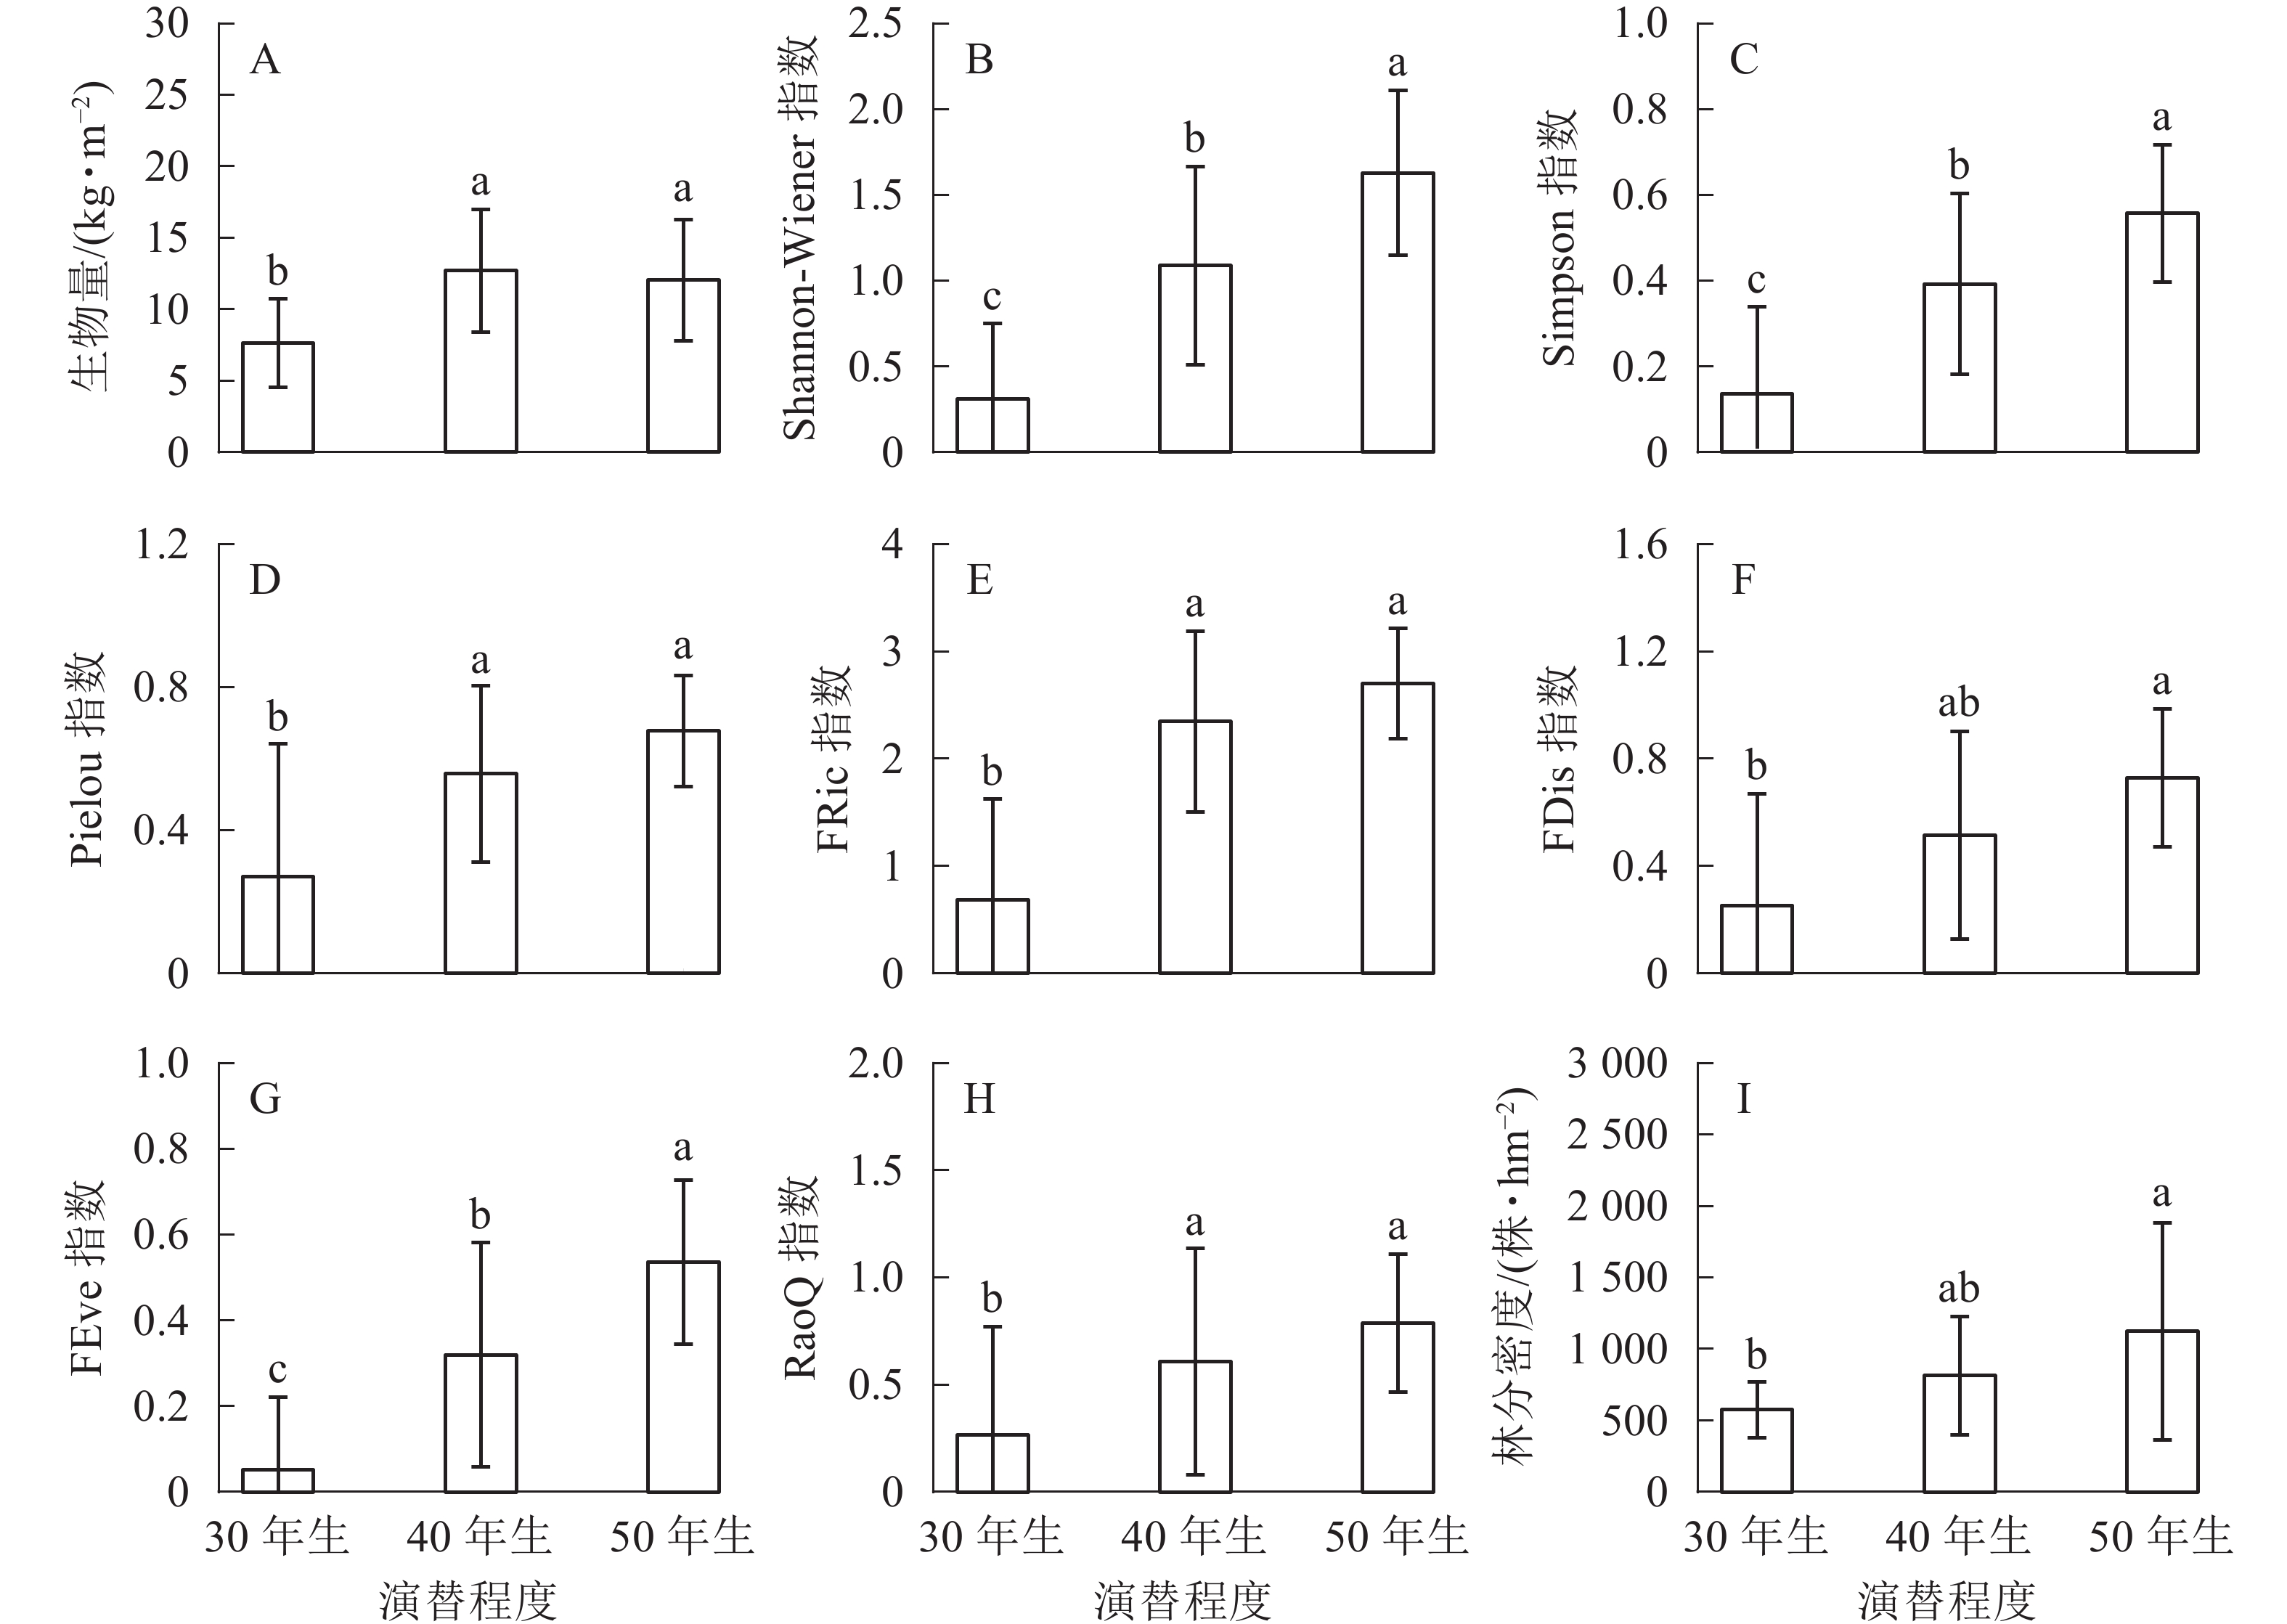
生物量在30年生和40年生、50年生的马尾松林之间均具有显著差异(P<0.05),然而40年生与50年生马尾松林差异不显著(图1A)。在物种多样性指数中,Shannon-Wiener指数在3种不同演替程度下差异显著(P<0.05)(图1B);Simpson指数的变化与Shannon-Wiener指数一致,在不同演替程度下差异显著(P<0.05)(图1C);Pielou指数也随着演替程度的增加呈递增趋势,30年生与40年生、50年生的马尾松林之间均差异显著(P<0.05),40年生与50年生马尾松林差异不显著(P>0.05)(图1D)。功能多样性指数中,功能丰富度在50年生马尾松林中最高,40年生马尾松林次之,30年生马尾松林最低,30年生与40年生、50年生的马尾松林之间均差异显著(P<0.05),40年生与50年生马尾松林差异不显著(P>0.05)(图1E);功能离散度在50年生马尾松林中明显高于其他,40年生与30年生、50年生的马尾松林之间均差异不显著(P>0.05),30年生与50年生马尾松林显著差异(P<0.05)(图1F);功能均匀度随着演替的进行不断提高,且在3种不同演替程度下具有显著差异(P<0.05)(图1G);功能多样性30年生与40年生、50年生马尾松林之间均差异显著(P<0.05),40年生与50年生马尾松林无显著差异(P>0.05)(图1H)。林分密度随着演替的进行不断提高,40年生与30年生、50年生马尾松林之间均无显著差异(P>0.05),30年生与50年生马尾松林差异显著(P<0.05)(图1I)。
-
以生物量作为响应变量,多样性指数、林分密度为解释变量构建线性逐步回归模型,筛选出对生产力解释率最高的最佳子集。从表4可知:虽然多元线性模型R2=0.468并不高,但拟合结果差异极显著(P<0.001)。对生物量影响的重要性从高到低依次为功能离散度(42.71%,P<0.001)、Simpson指数(21.65%,P<0.001)、Pielou指数(19.58%,P<0.01)、Shannon-Wiener指数(16.05%,P<0.01)。
表 4 逐步回归模型筛选结果
Table 4. Stepwise regression model fitting results
变量 估算值 标准差 t P 重要性/% Shannon-
Wiener指数−208.114 67.232 −3.095 <0.01 16.05 Simpson指数 1 021.108 276.740 3.690 <0.001 21.65 Pielou指数 −365.918 107.731 −3.397 <0.01 19.58 功能离散度 −89.342 23.988 −3.724 <0.001 42.71 -
本研究发现:40年生马尾松林生物量相较于30年生马尾松林有明显增加,与50年生马尾松林相比并没有较大差距;但Shannon-Wiener指数、Simpson指数以及Pielou指数随着演替的进行在不断提高。表明演替前期拥有不同性状的树种,可以提升资源的利用效率,这将对生物量的增加产生积极效应[28]。而演替后期,生态系统趋于稳定,树种的增加对林分生物量的影响逐渐减弱。本研究表明:不同演替程度之间功能多样性变化也较为显著。其中功能丰富度递增,说明群落所占据的功能空间有所提高[29]。而且从功能离散度和功能多样性的分布特征也不难看出,树种多的群落中不仅其生态位的互补程度较高,而且具有不同功能特性的树种相对增加,这为群落间个体生产力的提升提供了可能,并增加生态系统的功能。功能均匀度可以体现群落内树种对有效资源全方位的利用效率[29]。功能均匀度随着演替的进行不断提高,这有利于群落对资源利用效率的提高。随着演替的进行,林分密度开始增加,但在演替50年生的样地里也存在林分密度较小的情况,总体分布范围较30年生的有所增大,树种的增加使得单位面积上的树种数量增加。
-
在逐步回归模型筛选的最佳子集中,功能离散度对于生物量的影响占有重要权重。相较于物种多样性,功能多样性指标可以更有效地解释生态系统功能变化[30]。本研究显示:Shannon-Wiener指数、Simpson指数、Pielou指数都对生物量有显著影响,这与温带针叶林、亚热带人工林和热带森林的研究结果相似[31],与TILMAN等[32]的物种多样性对生态系统生物量存在正效应相符,说明在一定研究尺度下,马尾松人工林物种多样性的适度提高会对生物量的增加有促进作用。就功能多样性与生物量之间的关系而言,功能丰富度与碳储量显著相关[33],也有人只证明了功能离散度与碳储量的相关性[34],本研究得出了相似的结论。综合分析模型中,林分密度对生物量没有表现出影响,这可能是生物多样性指标掩饰了林分密度的效应。
-
马尾松人工林在演替进程中,随着树种的增加,物种多样性与功能多样性也随之增加,这使得群落能够占据更多的生态位,从而为获得更多的资源创造条件;同时由于树种间生长特性的不同,增加了群落利用资源的多样性,为个体生物量的积累提供了条件。回归模型结果表明:功能离散度可以更有效地解释生物量的变化,林分中的功能特性的离散化有利于减小群落内的竞争效应,为个体生物量的积累创造有利条件。
Effects of biodiversity on biomass of Pinus massoniana plantation under different succession degrees
-
摘要:
目的 为了解决长期纯林经营模式下马尾松Pinus massoniana林地力衰退、生物多样性降低、生物量下降等问题,探究马尾松人工林在自然演替程度下生物量与生物多样性变化规律以及相关关系。 方法 以湖北省荆门市京山县太子山3种不同自然演替程度下的马尾松人工林为研究对象,采用典型样地法探究其生物量与生物多样性、林分密度之间的关系。 结果 ① 40年生林分与50年生林分的生物量相对于30年生林分具有显著差异(P<0.05),其中40年生林分的平均生物量最高。②多样性指数随着演替的进行不断增加,但在不同演替阶段有所差异。其中Shannon-Wiener指数与Simpson指数在各个演替阶段之间都具有显著差异(P<0.05);Pielou指数在40年生林分与50年生林分之间差异不显著(P>0.05),但都与30年生林分差异显著(P<0.05);功能丰富度、功能多样性与Pielou指数变化一致;功能离散度在40年生林分与其他演替阶段的林分都差异不显著(P>0.05),30年生林分与50年生林分差异显著(P<0.05);功能均匀度在各个演替阶段林分之间都具有显著差异(P<0.05)。③林分密度在40年生林分与其他演替阶段的林分都差异不显著(P>0.05),30年生林分与50年生林分之间差异显著(P<0.05),其变化趋势随着演替程度的进行有所增加。④最佳解释模型中,解释变量包含功能离散度、Shannon-Wiener指数、Simpson指数以及Pielou指数,其中功能离散度相较于其他物种多样性指数更能有效地解释生物量的变化。 结论 生物多样性因子对生物量的变化具有一定可解释性,其中功能参数中的功能离散度对于生物量的影响最大。图1表4参34 Abstract:Objective The purpose of this study is to explore the change law of biomass and biodiversity of Pinus massoniana plantations under natural succession degree and the relationship between them, so as to solve the problems of fertility decline, biodiversity reduction, and biomass decline of P. massoniana forest under the long-term pure forest management mode. Method Taking 3 P. massoniana plantations with different degrees of natural succession in Taizi Mountain, Jingshan County, Jingmen City of Hubei Province as the research object, the typical plot method was used to explore the relationship between biomass, biodiversity and stand density. Result (1) The biomass of 40-year-old and 50-year-old stands was significantly different from that of 30-year-old stand (P<0.05), and the average biomass of 40-year-old stand was the highest. (2) The diversity index increased with the succession, but it was different in different succession stages. Among them, Shannon-Wiener index and Simpson index had significant differences among different succession stages(P<0.05). There was no significant difference in Pielou index between 40-year-old and 50-year-old stands (P>0.05), but both were different from 30-year-old stands. The changes of functional richness and diversity were consistent with Pielou index. There was no significant difference in functional dispersion between 40-year-old stands and stands of other succession stages (P>0.05), but significant difference between 30-year-old stands and 50-year-old stands (P<0.05). There was significant difference in functional evenness among different succession stages (P<0.05). (3) There was no significant difference in stand density between 40-year-old stand and the stands of other succession stages (P>0.05), but significant difference between 30-year-old stand and 50-year-old stand (P<0.05), and the change trend increased with the succession degree. (4) In the best explanation model, the explanatory variables included functional dispersion, Shannon-Wiener index, Simpson index and Pielou index, among which functional dispersion was more effective than other species diversity indexes in explaining biomass changes. Conclusion Biodiversity factors can explain the changes of biomass to some degree, and the functional dispersion of functional parameters has the greatest impact on biomass. [Ch, 1 fig. 4 tab. 34 ref.] -
Key words:
- forest ecology /
- Pinus massoniana /
- biodiversity /
- biomass /
- succession
-
表 1 生物量计算方法
Table 1. Biomass calculation methods
树种 生物量计算公式 参考文献 马尾松 ${ W=0.105\;6 ({D}^{2}H{)}^{0.824\;7}} $ [19] 麻栎 $ {W=1.137\;96 \times {10}^{-3}{D}^{2.082\;5}{H}^{2.115\;4} }$ [20] 樟树 $ {W=0.112\;502 \left({D}^{2}H\right)} $ [20] 柏木 $ {W=0.027\;241 ({D}^{2}H{)}^{1.008\;7}} $ [20] 杉木 $ {W=0.257 ({D}^{2}H{)}^{0.697\;0}} $ [21] 其他阔叶树种 $\;\;{ {\ln}W=-1.982+1.209{\ln}{D}^{2}} $ [22] 说明:W为生物量;D为胸径;H为树高 表 2 单木材积生长率方程
Table 2. Wood growth rate equation of P. massoniana and broad-leaved trees
树种 单木材积生长率方程 马尾松 ${ Y=5.528+99.865 {\rm{exp} }(-0.101 D-0.086 A)}$ 其他阔叶树种 ${Y=0.088+0.007 D}$ 说明:Y为单木材积生长率;D为单木胸径;A为年龄 表 3 生物量扩展因子方程
Table 3. Biomass expansion factor equation of P. massoniana and mixed coniferous forests
林分 生物量扩展因子方程 马尾松纯林 ${B=0.503\;4 V+20.547\;0 }$ 针阔混交林 ${ B=0.516\;8 V+33.237\;8}$ 说明:B为单木生物量;V为单木材积 表 4 逐步回归模型筛选结果
Table 4. Stepwise regression model fitting results
变量 估算值 标准差 t P 重要性/% Shannon-
Wiener指数−208.114 67.232 −3.095 <0.01 16.05 Simpson指数 1 021.108 276.740 3.690 <0.001 21.65 Pielou指数 −365.918 107.731 −3.397 <0.01 19.58 功能离散度 −89.342 23.988 −3.724 <0.001 42.71 -
[1] 邓超. 马尾松纯林与混交林生态系统生物多样性与生物量研究[D]. 成都: 四川农业大学, 2015. DENG Chao. The Study of Biodiversity and Biomass on the Masson Pine Plantation and Masson Pine Mixed Plantation Ecosystem[D]. Chengdu: Sichuan Agricultural University, 2015. [2] 孟庆繁. 人工林生物多样性研究的现状及展望[J]. 世界林业研究, 1998, 11(2): 27 − 32. MENG Qingfan. Current status and prospect of the study on biodiversity of plantation forests [J]. World For Res, 1998, 11(2): 27 − 32. [3] 蔡锰柯. 不同杉木林经营模式植物物种多样性特征的比较研究[D]. 福州: 福建农林大学, 2015. CAI Mengke. The Species Biodiversity Comparative Study of Chinese Fir Forest under Different Management[D]. Fuzhou: Fujian Agriculture and Forestry University, 2015. [4] ZHANG Yu, CHEN H Y H, REICH P B. Forest productivity increases with evenness, species richness and trait variation: a global meta-analysis [J]. J Ecol, 2012, 100(3): 742 − 749. [5] 江小雷, 岳静, 张卫国, 等. 生物多样性、生态系统功能与时空尺度[J]. 草业学报, 2010, 19(1): 219 − 225. JIANG Xiaolei, YUE Jing, ZHANG Weiguo, et al. Biodiversity, ecosystem functioning and spatio-temporal scale [J]. Acta Prataculturae Sin, 2010, 19(1): 219 − 225. [6] 雷羚洁, 孔德良, 李晓明, 等. 植物功能性状、功能多样性与生态系统功能: 进展与展望[J]. 生物多样性, 2016, 24(8): 922 − 931. LEI Lingjie, KONG Deliang, LI Xiaoming, et al. Plant functional traits, functional diversity, and ecosystem functioning: current knowledge and perspectives [J]. Biodiversity Sci, 2016, 24(8): 922 − 931. [7] 张金屯, 范丽宏. 物种功能多样性及其研究方法[J]. 山地学报, 2011, 29(5): 513 − 519. ZHANG Jintun, FAN Lihong. Development of species functional diversity and its measurement methods [J]. Mt Res, 2011, 29(5): 513 − 519. [8] EVANS J. Plantation Forestry in the Tropics[M]. 2 ed. Oxford: Clarendon Press, 1992. [9] 罗应华, 孙冬婧, 林建勇, 等. 马尾松人工林近自然化改造对植物自然更新及物种多样性的影响[J]. 生态学报, 2013, 33(19): 6154 − 6162. LUO Yinghua, SUN Dongjing, LIN Jianyong, et al. Effect of close-to-nature management on the natural regeneration and species diversity in a Masson pine plantation [J]. Acta Ecol Sin, 2013, 33(19): 6154 − 6162. [10] CARNEVALE N J, MONTAGNINI F. Facilitating regeneration of secondary forests with the use of mixed and pure plantations of indigenous tree species [J]. For Ecol Manage, 2002, 163(1): 217 − 227. [11] 周东雄. 杉木乳源木莲混交林林分生产力研究[J]. 林业科技开发, 2004, 18(5): 23 − 25. ZHOU Dongxiong. Productive forces of mixed forest stand of Cunninghamia lanceolata with Manglietia yuyuanensis [J]. J For Eng, 2004, 18(5): 23 − 25. [12] 邹文魁. 马尾松、木荷混交林生物量结构研究[J]. 北华大学学报(自然科学版), 2008, 9(2): 161 − 164. ZOU Wenkui. Biomass structure of mixed Pinus massoniana and Schma superbe forests [J]. J Beihua Univ Nat Sci, 2008, 9(2): 161 − 164. [13] 张令峰. 不同混交比例马尾松林生态功能比较研究[D]. 合肥: 安徽农业大学, 2013. ZHANG Lingfeng. Study on Ecosystem Functions of Masson Pine Mixed Woods with Different Mixed Proportions[D]. Hefei: Anhui Agricultural University, 2013. [14] 王瑞华, 葛晓敏, 唐罗忠. 林下植被多样性、生物量及养分作用研究进展[J]. 世界林业研究, 2014, 27(1): 43 − 48. WANG Ruihua, GE Xiaomin, TANG Luozhong. A review of diversity, biomass and nutrient effect of understory vegetation [J]. World For Res, 2014, 27(1): 43 − 48. [15] 邸月宝, 王辉民, 马泽清, 等. 亚热带森林生态系统不同重建方式下碳储量及其分配格局[J]. 科学通报, 2012, 57(17): 1553 − 1561. DI Yuebao, WANG Huimin, MA Zeqing, et al. Carbon storage and its allocation pattern of forest ecosystems with different restoration methods in subtropical China [J]. Chin Sci Bull, 2012, 57(17): 1553 − 1561. [16] 邹春静, 卜军, 徐文铎. 长白松人工林群落生物量和生产力的研究[J]. 应用生态学报, 1995, 6(2): 123 − 127. ZOU Chunjing, BU Jun, XU Wenduo. Biomass and productivity of Pinus sylvestriformis plantation [J]. Chin J Appl Ecol, 1995, 6(2): 123 − 127. [17] 潘攀, 李荣伟, 向成华, 等. 墨西哥柏人工林生物量和生产力研究[J]. 长江流域资源与环境, 2002, 11(2): 133 − 136. PAN Pan, LI Rongwei, XIANG Chenghua. Biomass and productivity of Cupressus lusitanica plantation [J]. Resour Environ Yangtze Basin, 2002, 11(2): 133 − 136. [18] 黄柳菁, 林欣, 刘兴诏, 等. 广东不同林龄乔木生物量及物种多样性与叶面积指数的关系[J]. 西南林业大学学报(自然科学), 2017, 37(6): 91 − 98. HUANG Liujing, LIN Xin, LIU Xingzhao, et al. The relation among biomass, biodiversity and LAI of trees at different stand ages in Guangdong Province [J]. J Southwest For Univ Nat Sci, 2017, 37(6): 91 − 98. [19] 艾训儒, 沈作奎, 易咏梅. 马尾松种群生物量及其密度效应研究[J]. 湖北林业科技, 1998, 105(3): 16 − 17. AI Xunru, SHEN Zuokui, YI Yongmei. Studies on biomass and density effect in the Pinus massoniana Lamb [J]. Hubei For Sci Technol, 1998, 105(3): 16 − 17. [20] 冯宗炜. 中国森林生态系统的生物量和生产力[M]. 北京: 科学出版社, 1999. [21] 丁洪峰. 闽北杉木人工林生物量及其分配的动态变化[J]. 安徽农业科学, 2016, 44(30): 136 − 138. DING Hongfeng. Dynamic changes of biomass and its allocation of Cunninghamia lanceolata plantation in Northern Fujian Province [J]. J Anhui Agric Sci, 2016, 44(30): 136 − 138. [22] 林开淼. 亚热带常绿阔叶林生物量模型及其分析[J]. 中南林业科技大学学报, 2017, 37(11): 115 − 120, 126. LIN Kaimiao. Research and analysis on biomass allometric equations of subtropical broad-leaved forest [J]. J Cent South Univ For Technol, 2017, 37(11): 115 − 120, 126. [23] 蒋丽秀. 基于森林资源连续清查样地数据的林分林木生长模型研制[J]. 林业调查规划, 2020, 45(1): 8 − 14. JIANG Lixiu. Development of stand and wood growth models based on data of continuous forest inventory [J]. For Inventory Plann, 2020, 45(1): 8 − 14. [24] FANG Jinyun, CHEN Anping, PENG Changhui, et al. Changes in forest biomass carbon storage in China between 1949 and 1998 [J]. Science, 2001, 292(5525): 2320 − 2322. [25] 仲启铖, 傅煜, 张桂莲. 上海市乔木林生物量估算及动态分析[J]. 浙江农林大学学报, 2019, 36(3): 524 − 532. ZHONG Qicheng, FU Yu, ZHANG Guilian. Biomass estimation and a dynamic analysis of forests in Shanghai [J]. J Zhejiang A&F Univ, 2019, 36(3): 524 − 532. [26] DIXON P. VEGAN, a package of R functions for community ecology [J]. J Veg Sci, 2003, 14(6): 927 − 930. [27] LALIBERTÉ E, LEGENDRE P. A distance-based framework for measuring functional diversity from multiple traits [J]. Ecology, 2010, 91(1): 299 − 305. [28] 黄小荣. 广西马尾松林植物功能多样性与生产力的关系[J]. 生物多样性, 2018, 26(7): 690 − 700. HUANG Xiaorong. Relationship between plant functional diversity and productivity of Pinus massoniana plantations in Guangxi [J]. Biodiversity Sci, 2018, 26(7): 690 − 700. [29] MASON N W H, MOUILLOT D, LEE W G, et al. Functional richness, functional evenness and functional divergence: the primary components of functional diversity [J]. Oikos, 2005, 111: 112 − 118. [30] GAZOL A, CAMARERO J J. Functional diversity enhances silver fir growth resilience to an extreme drought [J]. J Ecol, 2016, 104(4): 1063 − 1075. [31] 董希斌, 姜帆. 帽儿山不同森林类型生物多样性恢复效果分析[J]. 林业科学, 2008, 44(12): 77 − 82. DONG Xibin, JIANG Fan. Analysis of the biodiversity restoration of different forest types in Maoer Mountainous region [J]. Sci Silv Sin, 2008, 44(12): 77 − 82. [32] TILMAN D, DOWNING J A. Biodiversity and stability in grasslands [J]. Nature, 1994, 367(6461): 363 − 365. [33] 夏艳菊, 张静, 邹顺, 等. 南亚热带森林群落演替过程中结构多样性与碳储量的变化[J]. 生态环境学报, 2018, 27(3): 424 − 431. XIA Yanju, ZHANG Jing, ZOU Shun, et al. Dynamics of structural diversity and carbon storage along a successional gradient in south subtropical forest [J]. Ecol Environ Sci, 2018, 27(3): 424 − 431. [34] ZITER C, BENNETT E M, GONZALEZ A. Functional diversity and management mediate aboveground carbon stocks in small forest fragments [J]. Ecosphere, 2013, 4(7): 1 − 21. -

-
链接本文:
https://zlxb.zafu.edu.cn/article/doi/10.11833/j.issn.2095-0756.20200334


 下载:
下载:


