


-
城市生态系统碳收支的测算是全球碳循环研究中的重要问题,也是正在完成的一项挑战,同时,低碳建设也已成为世界热点问题之一[1]。通过构建数学模型测算不同区域碳收支的研究结果表明:碳源远大于碳汇,且呈现增长趋势[2]。现有城市区域碳收支研究结果认为:工业与交通是碳排放最大的2个部门[3-4];城市绿地具有一定碳汇能力[5-6],且碳汇强度表现为山体林>行道树>公园[7]。目前,针对城市生态系统碳收支的测算研究主要为省、市及以上尺度,社区等小尺度研究相对较少,而生物量法、涡度相关法以及遥感反演法在小尺度碳汇研究上均有一定局限。如何测算并动态反映社区尺度碳收支情况是需要进一步突破的问题。系统动力学(system dynamics)认为系统是由单元、单元的运动和信息组成,能定性与定量地分析研究系统,以“结构—功能”模拟为突出特点,从系统的微观结构入手建模,构造系统的基本结构,进而模拟与分析系统的动态行为[8]。本研究以浙江农林大学东湖校区为研究对象,以系统动力学VensimPLE软件为技术平台,提出校园碳收支计算的方法并反映其碳收支变化的特征,为“零碳”和“低碳”社区的建设评价提供了量化工具,又为未来校园以及居住区等的低碳建设提供参考。
HTML
-
模型以浙江农林大学东湖校区为系统边界,覆盖时间为2012年,时间步长以月为单位。研究对象坐落于浙江省临安市,校舍建筑面积近60万m2,在校师生约为27 000人。研究对象具有校园与植物园两重属性,是一座集教学、科研、生物多样性保护等功能于一体的现代化生态校园。校园碳收支系统主要包括校园范围内各项人类活动产生的碳排放及自然生态系统的碳收支等2个方面。
人类活动子系统以学校的作息规律造成的人员数量变动为基础,具体包括4个模块:人类呼吸模块主要考虑校园内在校师生日常呼吸产生的碳排放;交通模块主要考虑进入校园的车辆行驶所产生的碳排放;生活办公耗能模块主要考虑学生住宿及教学办公消耗电力产生的碳排放;锅炉能耗模块主要考虑学校食堂化石燃料燃烧产生的碳排放。
自然生态系统以校园内植被、土壤的碳收支活动为基础,具体包括3个模块:植被光合碳吸收估算模块,包含校园内所有植被光合作用净固碳量;植被呼吸碳排放估算模块,包含植被呼吸作用所排碳量;土壤呼吸碳排放估算模块,包含所有土壤呼吸作用所排碳量。
-
人类作为城市生态系统内最重要的活动对象,其自身的呼吸作用作为城市生态系统自然垂直碳输出的一部分,以二氧化碳(CO2)的形式将碳排入大气[9]。通过人均呼吸碳排放量与人口总量共同计算人类呼吸碳排放量的方法已被广泛使用[2, 9-10]:Cp=∫(Cpmon)dt; Cpmon=Cp0×P×t。其中:Cp为人类呼吸碳排量(t);Cpmon为月呼吸碳排量(t);P为在校总人数;t为时长(月平均天数);Cp0为人均呼吸碳排量每天(t·d-1)。交通系统的碳排放与交通量、交通类型、行驶里程数都密切相关。本研究采用何华等[11]对居住区交通碳排放量的测算方法:Ctra=∫(Ctra-m)dt;Ctra-m=Tra×Ct0×t×ntra×Dtra。其中:Ctra为交通碳排量(t);Ctra-m为月交通碳排量(t);Tra为汽车总数;t为时长(月平均天数);Cto为单位里程(1 km)汽车平均碳排量(kg·km-1);ntra为汽车日均通行校园的次数;Dtra为汽车次均校园内行驶千米数(km)。生活办公能耗主要以电力为主。模型利用电力碳排放系数与用电总量共同计算生活办公模块的碳排放:Clife=∫C(life-m)dt; Clife-m=Elife×Ielc; Elife=Estu+Esta。其中:Clife为生活办公碳排量(t);Clife-m为月生活办公碳排量(t);Elife为耗电量(kW·h);Ielc为电碳排放系数[t·(kW·h)-1];Estu为生活区耗电量(kW·h);Esta为教学办公区耗电量(kW·h)。食堂锅炉采用化石燃料燃烧与电力相组合的能源消耗方式,具体为:Cfood=∫(Cfood-m)dt; Cfood-m=ΣEi×Ii。其中:Cfood为锅炉燃烧碳排量(t);Cfood-m为月锅炉燃烧碳排放量(t);Ei为锅炉燃烧各类能耗量;Ii为各类能源碳排放系数。校园内人类活动系统碳排放总量为:Chuman=Cp+Ctra+Clife+Cfood。其中:Chuman为人类活动系统碳排总量。
-
自然生态系统主要指研究范围内植被及土壤共同组成的绿地系统。本研究建立了逐时植物呼吸碳排放方程、逐时土壤呼吸碳排放方程和逐时植物光合碳吸收方程。植物光合碳吸收测算。物种差异、光强、温度和湿度是影响植物光合作用的主要因素,其中光强、温度和湿度均表现为最适情况下促进光合[12-14],过高或过低均抑制光合[15-17]。植物光合碳吸收量具体计算方式如下:Pij=a×Pari2+b×Par+c; ${C_P} = \sum\limits_i^n {\left( {{P_{ij}} \times {A_{ij}}} \right)} $ 。其中:Pij为第j种植被类型第i时的光合速率(μmol·m-2·s-1);Pari为第i时的光合有效辐射(μmol·m-2·s-1);a, b, c为系数项。Aij为第j种植被类型第i时的叶面积(m2);Cp为植被光合碳吸收总量(t)。叶面积是指该种植物的所有叶片的单面叶面积之和。假设常绿植物全年总叶面积不变,估算方法参考居住区绿地碳汇能力评价中叶面积指数的计算方法[1, 18]。植物呼吸碳排放测算:Rik=ak∫ebktikdt[19-20]; ${C_v} = \sum\limits_i^n {\left( {{R_{ij}} \times {A_{ij}}} \right)} $ 。其中Rij为第j种植被类型第i时的呼吸速率(μmol·m-2·s-1);ti为第i时的温度(℃);a,b为系数项;Aij为第j种植被类型第i时的叶面积(m2);Cv为植被光合碳吸收总量(t)。土壤呼吸碳排放测算。土壤呼吸一般表现为土壤向大气净释放二氧化碳[21]。物种差异[22]、温度[23-24]是影响土壤呼吸速率的主要因素。具体计算方式如下:RSik=akebktik[25]; ${C_S} = \sum\limits_i^m {\left( {{R_{{\rm{Sik}}}} \times {A_{{\rm{Sik}}}}} \right)} $ 。其中RSik为第j种植被类型第k时的呼吸速率(μmol·m-2·s-1);ti为第i时的温度(℃);a,b为系数项;ASik为第k种植被类型第i时的叶面积(m2);CS为土壤碳排放总量(t)。
-
人类活动系统中,在校人口总数、车辆通行数量与行驶里数、生活办公用电量、锅炉能源消耗量均由学校相关部门提供。人数调节系数取值0.2。人均呼吸碳排放量为900 g·人-1·d-1[26]。车辆单位里程碳排放量为0.06 kg·km-1[11, 27]。在生活办公与锅炉燃烧模块中,电力与柴油碳排放因子分别为7.72×10⁴ t·(kW·h)-1与0.862 6 t·t-1(二氧化碳/标准煤)[28]。
-
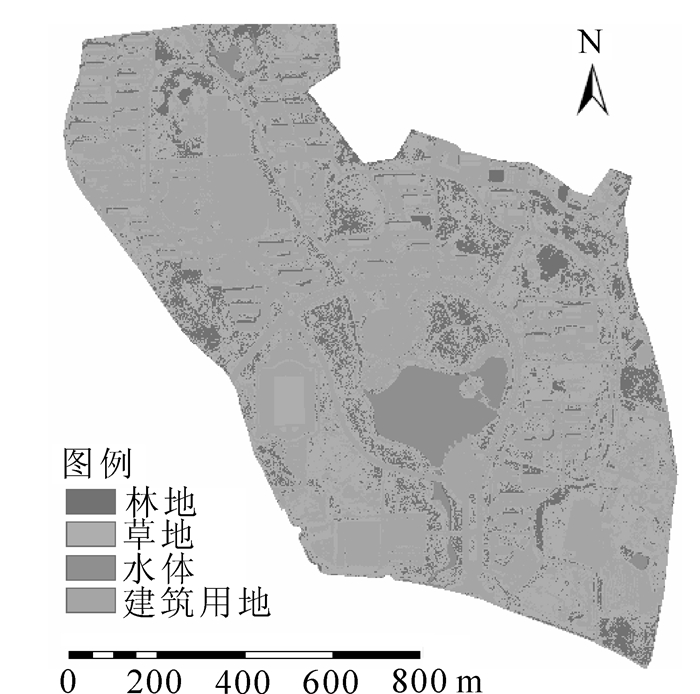
①观测数据。选取校园林地与草地的主流植物种类,以及不同疏密程度与不同环境的绿地,利用Li COR-6400与Li COR-8100分别观测植物光合速率、植物夜间呼吸速率与土壤呼吸速率。同时,记录Li COR-6400与Li COR-8100所测得的温度、湿度与光照强度数据。②校园不同土地利用类型的面积。各种植被类型的面积通过航拍遥感影像分类获得。影像空间分辨率为1 m,选择非监督分类方法ISOData进行分类(图 1),获取林地、草地、水体、建筑用地4种土地利用类型的面积数据(表 1)。③植被叶面积指数。根据乔木与草地的叶面积计算公式,通过校园植被调查数据获取乔木的株数、年龄、冠幅及草地的高度,来计算植被的总叶面积。乔木和草地的叶面积指数平均值分别采用3.41与2.46 [18]。

Figure 1. Aerial remote sensing image and classification results
土地覆盖类型 面积/m2 百分比/% 林地 154 755.0 12.70 草地 471 856.0 38.72 水域 52 107.8 4.28 建筑用地 539 769.0 44.30 合计 1218 487.8 Table 1. Land cover classification results
-
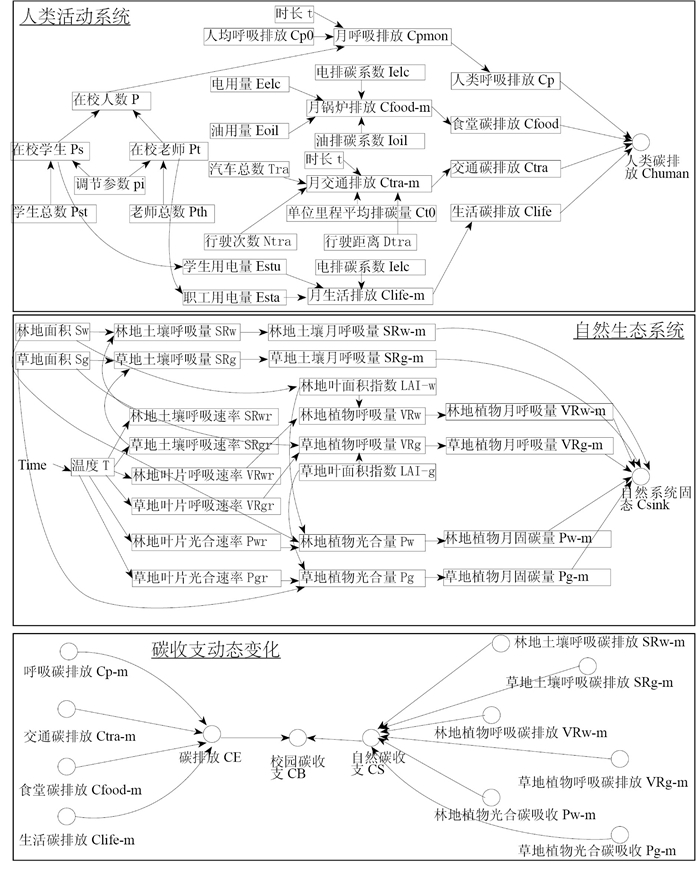
校园碳收支估算模型详细流图见图 2。人类活动系统中,人均用电量、汽车通行量等作为辅助常数变量输入模型,模型按照核算公式运行后可直接计算得到人类活动系统碳排放结果。自然生态系统碳收支的计算相对复杂。在运行模型前,需要在整理观测数据的基础上,取所有植物种类(林地与草地分开)和土壤同一时刻光合作用速率、土壤呼吸速率的均值来分别代表校园区域植被光合速率与土壤呼吸速率。利用SPSS统计软件,选取温度、湿度、光合有效辐射(由光照强度数据转换所得[29])等环境因素数据与各类速率数据拟合。拟合结果(表 2)通过统计学检验后作为计算公式输入模型,温度、湿度等环境因素数据作为辅助变量输入模型,光合与土壤呼吸速率为模型运行后输出的中间结果,自然生态系统碳吸收量为最终输出结果,进行自然生态系统碳收支的核算。

Figure 2. The stock-flow diagram of campus carbon budget
内容 公式 精度R2 林地植物光合速率 P-wood=∫11(-0.000 036×Par2 +0.023 0×Par+2.16)dt 0.809 草地植物光合速率 P-wood=∫11(-0.000 056×Par2 +0.001 6×Par+8.46)dt 0.759 林地植物呼吸速率 VR-wood=∫11 (0.42Swe0.051×f(T, h, PAR, σ) dt 0.937 草地植物呼吸速率 VR-grass=∫11 (1.99Sge0.041×f(T, h, PAR, σ) dt 0.951 林地土壤呼吸速率 SR-wood=∫11 (0.87Swe0.055×f(T, h, PAR, σ) dt 0.958 草地土壤呼吸速率 SR-grass=∫11 (1.52Sge0.06×f(T, h, PAR, σ) dt 0.958 说明:T为温度,PAR为光合有效辐射,σ为二氧化碳浓度,t为时常,Sw为林地面积,Sg为草地面积。 Table 2. Parameterized equations in natural ecosystem
1.1. 模型框架
1.2. 核算方法
1.2.1. 人类活动系统
1.2.2. 自然生态系统
1.3. 数据来源与参数化
1.3.1. 人类活动系统
1.3.2. 自然生态系统
1.3.3. 碳收支模型
-
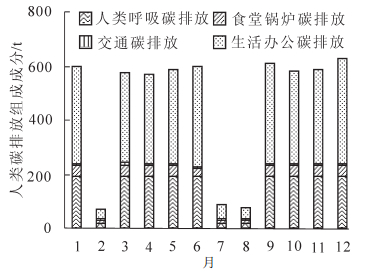
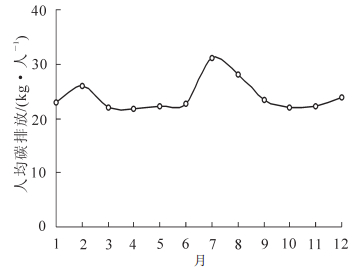
①校园人类活动系统2012年碳排放总量约为5 555.48 t(图 3)。2,7,8月随着在校人数减少出现骤减现象。在正常工作日,4-6月与10-12月碳排放量均呈现上升趋势。这可能是因为夏天与冬天校园内空调等电器电力消耗增多。②校园人类活动系统中生活办公能耗产生的碳排放量最大(3 312.49 t·a-1);其次为人类呼吸排放(1 797.81 t·a-1);锅炉燃烧与交通产生的碳排放量较小,分别为371.80 t·a-1与73.35 t·a-1(表 3)。另外,正常工作时段与寒暑假时段校园碳排放的构成成分的贡献度有轻微差别。在寒暑假时段,人类呼吸碳排放贡献度较正常工作时段下降较多,而交通碳排放与锅炉燃烧碳排放的贡献度较正常工作时段有所上升。这是由于寒暑假时段在校人数骤减程度大于交通与锅炉燃烧碳排放下降程度造成。③校园人均碳排放量约为24 kg·人-1·月-1(图 4),其在8月达到最大(31 kg·人-1·月-1,4月最小(21 kg·人-1·月-1)。与碳排放量月变化特征相反,人均碳排放量在寒暑假时段(2,7,8月)较高。4-6月和10-12月期间,人均碳排放量有缓慢上升趋势。

Figure 3. Carbon emission and composition of human activity system
时间阶段 Cp /% Cfood /% Ctra /% Clife /% 工作日 32.67 6.48 1.13 59.72 寒暑假 26.00 11.92 5.81 56.27 Table 3. Contribution of each kind of carbon emission's composition

Figure 4. Per capital carbon emission in human activity system
-
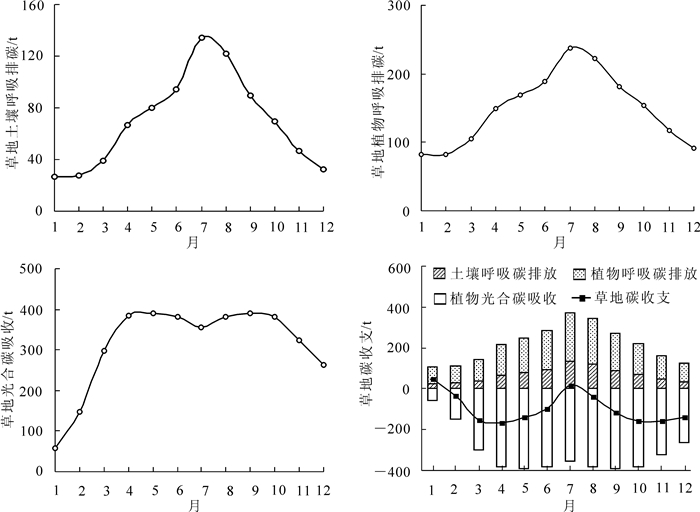
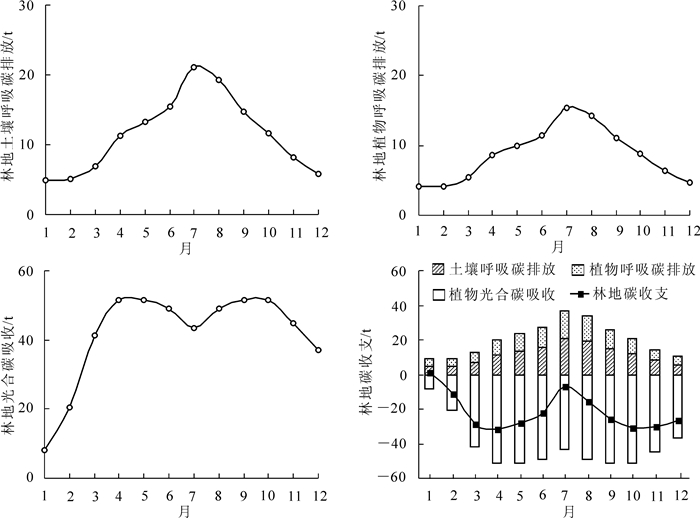
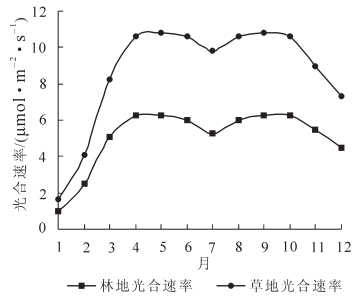
自然生态系统碳收支由林地、草地2种植被类型决定,林地与草地碳收支中各种作用季节变化特征见图 5和图 6。①校园自然生态系统林地碳吸收年累计量达到-258.14 t·a-1,草地碳吸收年累计量为-1 149.82 t·a-1。林地与草地碳吸收量在季节变化上均呈现出双峰特征,春、秋两季较高,林地最高达到-31.82 t·月-1,草地最高达到-168.21 t·月-1。林地与草地碳吸收量均在1月降至最低,分别为0.87 t·月-1与49.32 t·月-1,成为微弱的碳源。校园内林地与草地的光合作用在季节变化上与碳吸收量季节变化特征一致,呈现双峰,且均在春、秋两季表现出较强的光合作用。夏季由于高温环境,光合作用产生“午休”现象,林地与草地光合作用均有所下降。冬季受低温、低光照的环境影响,林地与草地的光合作用均在1月达到全年最低。校园内植物呼吸与土壤呼吸作用在季节变化上呈现单峰特征,夏季7月出现顶峰。受冬季低温、积雪等影响,校园内植物呼吸与土壤呼吸碳排量均在1月达到全年最小值。②校园自然生态系统总碳汇年累计量为-1 407.96 t·a-1,呈现双峰(图 7),4月和10月碳汇量达到2个峰值,分别为-200.02 t·月-1与-190.71 t·月-1;1月和7月碳汇量最低,处于波谷,分别为50.18 t·月-1与9.16 t·月-1。陈云飞等[30]对临安太湖源雷竹Phyllostachys violascens林的二氧化碳通量季节变化进行了研究,表明雷竹生态系统净生态系统交换量(NEE)呈现双峰特征,冬季1月为最大排放源,春、夏、秋季为碳汇,但夏季相对较弱。这与校园自然生态系统固碳特征一致。李霞等[6]针对北京海淀公园二氧化碳通量进行了研究,认为其二氧化碳通量季节变化呈现单峰特征,3-10月为碳汇,11月-翌年2月为碳源,于8-9月碳吸收量达到峰值。这可能与南北气候差异有关,临安夏季7-8月酷暑高温,二氧化碳通量于10:00左右达到峰值后下降[30]。而北京海淀公园夏季二氧化碳通量于12:00左右达到峰值[6]。在碳汇构成成分上,草地碳汇量高于林地碳汇量,这可能由两方面原因造成:一是草地月均光合、呼吸速率均比林地大(图 8和图 9);二是校园内草地面积是林地面积的3.5倍(表 1)。③单位绿化面积碳吸收量月平均值为-187 g·m-2,最小值出现在1月,为80 g·m-2;最大值出现在4月,为-319 g·m-2。

Figure 5. Seasonal changes of carbon budget of grassland in campus

Figure 6. Seasonal changes of carbon budget of woodland in campus

Figure 7. Monthly carbon budget of natural ecosystem in campus

Figure 8. Monthly average plant photosynthetic rate of natural ecosystem in campus

Figure 9. Monthly average vergetable and soil respiration rate of natural ecosystem in campus
-
由于人类活动密集,浙江农林大学东湖校区全年表现为碳源,年累计碳排放量为4 147.48 t·a-1。植被的碳吸收量相对校园人类活动所造成的碳排放量较小,不能弥补其排碳量,碳平衡主要受到校园活动人口及燃料燃烧的影响形成与人类活动系统碳排放特征季节性变化。在2月和8月,校园碳排放强度较弱;1月,碳排放强度最强,碳排放量达到649.04 t·月-1(图 10)。

Figure 10. Monthly carbon budget of whole campus
-
如果要建设低碳校园,则需要提出低碳校园的标准。这个标准实质上就是校园碳源与碳汇的基准,它是对校园碳排放与碳吸收的量化。由于研究对象为已建成使用的校园,不考虑建筑碳源,在明确校园规模与人均生命活动碳排放基准的前提下,低碳校园建设的影响因素主要为绿地碳汇、人均生活用能与交通用能[1]。
基于上述影响因素,假设低碳校园情景的指标取值如下:①校园绿地率提升至60%,单位绿化面积碳汇能力提升20%;②人均生活用能碳排放量削减20%,日均交通碳排放削减20%。在系统动力学模型中,任何相关变量的变化都会带来整个系统相应变化,为低碳校园政策效果评估提供了直观工具。按照上述指标取值调整模型中的校园绿化面积、人均生活用能、交通通行量、平均交通碳排放量等变量后运行模型,得到低碳校园情境下碳收支情况如表 4。
状态 基础数据 计算结果 绿地率/% 单位绿化面积碳汇/(g·m-2) 人均生活用能碳排放/(g·人-1 ·d-1) 日均交通碳排放/(kg·d-1) 绿地碳汇/(t·a-1) 生活用能碳排放(包括锅炉)/(t·a-1) 交通碳排放/(t·a-1) 碳收支/(t·a-1) 人均碳排放量/(g·人-1 ·d-1) 原状态 49 187 535.69 203.8 -1 408 5 555.48 73.35 4 147.48 439.27 低碳情景 60 224 428.55 163.0 -2 066 3 138.95 58.68 2 929.44 310.27 Table 4. Comparation between low-carbon scenario and original state
在低碳校园情境下,校园碳排放量下降至2 929.44 t·a-1,比原状态减少了29%以上。这说明校园的低碳建设仍有余地,但建设空间已有局限。这可能是由于东湖校区人口密集、现状植被覆盖率相对较高、植被体系已相对成熟等原因造成的。
2.1. 人类活动系统结果
2.2. 自然生态系统结果


2.3. 校园碳收支结果

2.4. 低碳校园建设
-
浙江农林大学东湖校区全年碳收支表现为碳源,年累计碳排放约为4 147.48 t·a-1,其中,人类活动系统产生碳排放约为5 555.45 t·a-1,自然生态系统碳吸收量约为-1 407.96 t·a-1。校园全年碳收支季节变化规律与人类活动子系统变化规律相似:寒暑假骤减,冬、夏季排放量较春、秋季高的特征。校园整体碳收支最大值出现在1月,为649.04 t·月-1;最小值出现在2月和8月,约为22.00 t·月-1。在校园人类活动子系统中,生活办公耗能是最主要的碳排放来源,贡献率达到55%以上。人均碳排放量平均为24 kg·人-1·月-1。在自然生态子系统中,林地年碳汇量为258.14 t·a-1,草地年碳汇量为1 149.82 t·a-1。碳汇呈现双峰的季节变化特征:春、秋两季较高,冬季达到最低。在4月达到-200.02 t·月-1,7月降低至9.16 t·月-1。单位绿化面积碳吸收量月平均值为-187.00 g·m-2。在完成校园碳收支测算的基础上,模拟低碳校园情景,从绿地碳汇能力、人均生活用能与交通用能3个方面控制校园碳收支,达到比原始状态削减29%以上碳排放量的结果。
本研究虽利用Vensim模型得到浙江农林大学东湖校区全年碳收支的动态结果,但未能很好地反映碳汇系统与碳源系统间相互作用与反馈机制,未能研究确定碳汇能力最大化的植物配置模式。今后有必要进一步进行该方面的研究。另外,本研究虽给出了低碳校园建设与评价基准的参考,但未深入考究该标准的操作可行性和区域的适应性,这是今后低碳城市建设有待研究和解决的问题。
 DownLoad: