Volume 34 Issue 5
Sep.  2017
Turn off MathJax
Article Contents

HUANG Xingzhao, WANG Zefu, XU Xiaoniu. Comparison of fitting approaches with biomass expansion factor equations[J]. Journal of Zhejiang A&F University, 2017, 34(5): 775-781. doi: 10.11833/j.issn.2095-0756.2017.05.002
Citation: HUANG Xingzhao, WANG Zefu, XU Xiaoniu. Comparison of fitting approaches with biomass expansion factor equations[J]. Journal of Zhejiang A&F University, 2017, 34(5): 775-781. doi: 10.11833/j.issn.2095-0756.2017.05.002

Comparison of fitting approaches with biomass expansion factor equations

doi: 10.11833/j.issn.2095-0756.2017.05.002
  • Received Date: 2016-11-28
  • Rev Recd Date: 2017-02-20
  • Publish Date: 2017-10-20
  • Biomass equations for the biomass expansion factor (fBEF) have been widely applied for accurate stand biomass estimations. The question here is how to improve the fitting precision of these biomass expansion factor (fBEF) equations by using different methodologies. Stand biomass data were obtained from 53 permanent sample plots located in Cunninghamia lanceolata plantations of Anhui and Fujian Provinces across China. The least squares approach, the nonlinear mixed model approach, and the hierarchical Bayesian approach were applied to establish BEF equations so as to test the effect of regions. Split-plot design with regions of Anhui and Fujian Provence and sample plots as replications. Results showed significant differences between Fujian and Anhui Provinces for stand biomass, volume, and fBEF at different ages. The R2 and mean deviation (dMD) values for the least squares approach was R2 = 0.643, dMD = 0.376; for the nonlinear mixed model approach was R2 = 0.802, dMD = 0.233; and for the hierarchical Bayesian approach was R2 = 0.804, dMD = 0.228. Also, there were highly significant differences in fitted results between the least squares and the nonlinear mixed model approaches, as well as between the least squares and the hierarchical Bayesian approaches (P < 0.01). However, no significant differences were found between the nonlinear mixed model approach and the hierarchical Bayesian approach (P = 0.547). Thus, both the mixed model approach and the Bayesian hierarchical approach were effective methods for estimating stand biomass at the regional scale.
  • [1] WU Lizhou, WANG Xiaohui, WANG Zhihui, FANG Xin, ZHU Tingyu, DING Lixia.  Crops identification based on hyperspectral data and random forest method . Journal of Zhejiang A&F University, 2020, 37(1): 136-142. doi: 10.11833/j.issn.2095-0756.2020.01.018
    [2] MU Yanan, DING Lixia, LI Nan, LU Linying, WU Ming.  Classification of coastal wetland vegetation in Hangzhou Bay with an object-oriented, random forest model . Journal of Zhejiang A&F University, 2018, 35(6): 1088-1097. doi: 10.11833/j.issn.2095-0756.2018.06.012
    [3] HU Mengxiao, HANG Yun, HUANG Huahong, ZHANG Shenglong, TONG Zaikang, LOU Xiongzhen.  A near infrared prediction model and variation analysis of wood crystallinity in Cunninghamia lanceolata . Journal of Zhejiang A&F University, 2017, 34(2): 361-368. doi: 10.11833/j.issn.2095-0756.2017.02.022
    [4] WANG Mingchu, SUN Yujun.  Based on mixed-effects model and empirical best linear unbiased predictor predicting growth profile of height for Chinese fir . Journal of Zhejiang A&F University, 2017, 34(5): 782-790. doi: 10.11833/j.issn.2095-0756.2017.05.003
    [5] CHEN Dong, WU Baoguo, LIU Jiancheng, LU Yuanchang.  Design and implementation of forest management knowledge service system based on frame representation . Journal of Zhejiang A&F University, 2017, 34(3): 491-500. doi: 10.11833/j.issn.2095-0756.2017.03.015
    [6] CAO Xiaoyu, LI Jiping, FENG Yao, ZHANG Caicai, FANG Xiaona.  Stand spatial structure for an uneven-aged Cunninghamia lanceolata ecological forest . Journal of Zhejiang A&F University, 2015, 32(1): 84-91. doi: 10.11833/j.issn.2095-0756.2015.01.012
    [7] PAN Jianhua, SUN Jie, ZHENG Linshui, CHEN Huiming, YE Huiqun, WU Lidong.  Growth with intermediate cuttings in mature Chinese fir plantations . Journal of Zhejiang A&F University, 2014, 31(2): 291-295. doi: 10.11833/j.issn.2095-0756.2014.02.019
    [8] YU Le, Lü Jianxiong, LI Xianjun, XU Kang, WU Yiqiang, JIANG Jiali.  Comparison of X-ray scanning and slice methods for moisture distribution measurements when drying Cunninghamia lanceolata plantation wood . Journal of Zhejiang A&F University, 2013, 30(4): 543-547. doi: 10.11833/j.issn.2095-0756.2013.04.013
    [9] WEI Xiao-hui, SUN Yu-jun, MA Wei.  A height growth model for Cunninghamia lanceolata based on Richards’ equation . Journal of Zhejiang A&F University, 2012, 29(5): 661-666. doi: 10.11833/j.issn.2095-0756.2012.05.004
    [10] XU Ai-jun, HUANG Xiao-yin, JIANG Guang-yu, SHAO Jian-long.  Precision fire hazard divisions for collective forest in southern China . Journal of Zhejiang A&F University, 2012, 29(1): 65-71. doi: 10.11833/j.issn.2095-0756.2012.01.012
    [11] DING Li-xia, WANG Zhi-hui, GE Hong-li.  Continuum removal based hyperspectral characteristic analysis of leaves of different tree species . Journal of Zhejiang A&F University, 2010, 27(6): 809-814. doi: 10.11833/j.issn.2095-0756.2010.06.001
    [12] ZHU Xiang-hui, WANG Chuan-jia, WANG Ren-dong, WENG Yong-fa, MA Fei-jie, GUO Lu, FANG Huai-yuan, ZHU Tang-jun.  Study on the methodology for monitoring Chinese fir carbon sink of CDM-afforestation and reforestation(AR) project . Journal of Zhejiang A&F University, 2008, 25(3): 336-341.
    [13] TU Yu-he, YE Gong-fu, LIN Wu-xing, ZHAO Shi-rong, ZHEN Zhao-fei.  Big-diameter-oriented cultivation techniques of Cunninghamia lanceolata with suitable management density . Journal of Zhejiang A&F University, 2005, 22(5): 530-534.
    [14] JIN Yong-ming, QIAN Jun, LOU Jian-qiang, YU You-ming, YE Liang-ming.  Study on manufacturing joiner core by PSL method . Journal of Zhejiang A&F University, 2003, 20(1): 5-7.
    [15] ZHOU Guo-mo, GUO Ren-jian WEI Xin-liang, WANG Xue-jun, .  Growth model and cutting age of Chinese fir planted forest in Zhejiang Province . Journal of Zhejiang A&F University, 2001, 18(3): 219-222.
    [16] YU Yong-qing, FU Shun-hua.  Application of Gompertz increase model to prediction of forestry product value . Journal of Zhejiang A&F University, 2001, 18(1): 85-88.
    [17] JIANG Zhi-biao, XU Yi-xin, JIN Zheng-fa, SHAO Xiao-ping, HU Xiao-ming.  No-tillage seedling of Cunninghamia lanceolata . Journal of Zhejiang A&F University, 1999, 16(3): 318-321.
    [18] Lin Sizu, Huang Qingzheng, Wu Wangming.  A Computerized Simulation Test on the Effectiveness of Several Models of Chinese Fir and Masson Pine . Journal of Zhejiang A&F University, 1993, 10(2): 184-188.
    [19] Zheng Yongping, Zeng Jianfu, Wang Hemu, Shi Bailin, Yu Qionghua.  Polymorphic Site Model for Chinese Fir in Zhejiang Province . Journal of Zhejiang A&F University, 1993, 10(1): 55-62.
    [20] Luo Fuyu, Fang Yanfu, Li Longchang.  Study on Growth Model of Man-made Forest of Chinese Fir in Suichang County . Journal of Zhejiang A&F University, 1993, 10(1): 49-54.
  • [1]
    TOMPPO E, GSCHWANTNER T, LAWRENCE M, et al. National Forest Inventories: Pathways for Common Reporting [M]. New York: Springer, 2010: 23.
    [2]
    BROWN S L, LUGO A E. Aboveground biomass estimates for tropical moist forests of the Brazilian amazon [J]. Interciencia, 1992, 17(1): 8-18.
    [3]
    SCHROEDER P, BROWN S, MO Jiangming, et al. Biomass estimation for temperate broadleaf forests of the United States using inventory data [J]. For Sci, 1997, 43(3): 424-434.
    [4]
    BROWN S L, SCHROEDER P E. Spatial patterns of aboveground production and mortality of woody biomass for eastern U.S. forests [J]. Ecol Appl, 1999, 9(3): 968-980.
    [5]
    BROWN S L, SCHROEDER P E, KERN J S. Spatial distribution of biomass in forests of the eastern USA [J]. For Ecol Manage, 1999, 123(1): 81-90.
    [6]
    FANG Jingyun, LIU Guohua, XU Songling. Biomass and net production of forest vegetation in China [J]. Acta Ecol Sin, 1996, 16(5): 497-508.
    [7]
    FANG Jingyun, WANG G G, LIU Guohua, et al. Forest biomass of China: an estimation based on the biomass-volume relationship [J]. Ecol Appl, 1998, 8(4): 1084-1091.
    [8]
    FANG Jingyun, CHEN Anping, PENG Changhui, et al. Changes in forest biomass carbon storage in China between 1949 and 1998 [J]. Science, 2001, 292(5525): 2320-2322.
    [9]
    FANG Jingyun, OIKAWA T, KATO T, et al. Biomass carbon accumulation by Japan's forests from 1947-1995 [J]. Glob Biogeochem Cycl, 2005, 19(2). doi:10.1029/2004GB002253.
    [10]
    FANG Jingyun, WANG Zhangming. Forest biomass estimation at regional and global levels, with special reference to China's forest biomass [J]. Ecol Res, 2001, 16(3): 587-592.
    [11]
    FANG Jingyun, GUO Zhaodi, PIAO Shilong, et al. Terrestrial vegetation carbon sinks in China, 1981-2000 [J]. Sci China Ser D Earth Sci, 2007, 50(9): 1341-1350.
    [12]
    GREEN E J, ROESCH F A, SMITH A F M, et al. Bayesian estimation for the three-parameter Weibull distribution with tree diameter data [J]. Biometrics, 1994, 50(1): 254-269.
    [13]
    BULLOCK B P, BOONE E L. Deriving tree diameter distributions using Bayesian model averaging [J]. For Ecol Manage, 2007, 242(2/3): 127-132.
    [14]
    CLARK J S, WOLOSIN M, DIETZE M, et al. Tree growth inference and prediction from diameter censuses and ring widths [J]. Ecol Appl, 2007, 17(7): 1942-1953.
    [15]
    ZAPATACUARTAS M, SIERRA C A, ALLEMAN L. Probability distribution of allometric coefficients and Bayesian estimation of aboveground tree biomass [J]. For Ecol Manage, 2012, 277(4): 173-179.
    [16]
    ZHANG Xiongqing, DUAN Aiguo, ZHANG Jianguo. Tree biomass estimation of Chinese fir (Cunninghamia lanceolata) based on Bayesian method [J]. PLoS One, 2013, 8(11): e79868. doi: 10.1371/journal.pone.0079868.
    [17]
    HUANG Xingzhao, CHEN Dongsheng, SUN Xiaomei, et al. Estimation of above-ground tree biomass based on probability distribution of allometric parameters [J]. Sci Silv Sin, 2014, 50(6): 34-41.
    [18]
    GELMAN A. Analysis of variance: why it is more important than ever [J]. Ann Stat, 2005, 33(1): 39-42.
    [19]
    GELMAN A, HILL J. Data Analysis Using Regression and Multilevel/Hierarchical Models [M]. New York: Cambridge University Press, 2007: 46.
    [20]
    KERY M. Introduction to WinBUGS for Ecologists: A Bayesian Approach to Regression, ANOVA, Mixed Models and Related Analyses [M]. Amsterdam: Elsevier, 2010.
    [22]
    BAAYEN R H, DAVIDSON D J, BATES D M. Mixed-effects modeling with crossed random effects for subjects and items [J]. J Mem Lang, 2008, 59(4): 390-412.
    [23]
    GILKS W R, THOMAS A, SPIEGELHALTER D J. A language and program for complex Bayesian modeling [J]. J Roy Stat Soc, 1994, 43(1): 169-178.
    [24]
    FINLEY A O, BANERJEE S, CARLIN B P. An R Package for univariate and multivariatem hierarchical point-referenced spatial models [J]. J Stat Softw, 2007, 19(4): 1-24.
    [25]
    GREEN E J, STRAWDERMAN W E. A comparison of hierarchical Bayes and empirical Bayes methods with a forestry application [J]. For Sci, 1992, 38(2): 350-366.
    [26]
    BATES D M, WATTS D G. Non-linear regression analysis and its applications [J]. J Mark Res, 1988, 60: 856865. doi: 10.1002/9780470316757.
    [27]
    STURTZ S, LIGGES U, GELMAN A. R2WinBUGS: a package for running WinBUGS from R [J]. J Stat Softw, 2005, 12(3): 1-16.
    [28]
    ZENG Weisheng. Methodology on Modeling of Single-Tree Biomass Equations for National Biomass Estimation in China [D]. Beijing: Chinese Academy of Forestry. 2011: 28-42.
    [29]
    FU Liyong, ZENG Weisheng, TANG Shouzheng. Analysis the effect of region impacting on the biomass of domestic masson pine using mixed model [J]. Acta Ecol Sin, 2001, 31(19): 5797-5808.
    [30]
    CLARK J S, GELFAND A E. Hierarchical Modeling for the Environmental Sciences: Statistical Methods and Applications [M]. England: Oxford University Press, 2006: 135-142.
    [31]
    HADFIELD J D. MCMC methods for multi-response generalized linear mixed models: the MCMCglmm R package [J]. J Stat Softw, 2010, 33(2): 1-22.
    [32]
    BROOKS S P, GELMAN A. General methods for monitoring convergence of iterative simulations [J]. J Comput Graph Stat, 1998, 7(4): 434-455.
    [33]
    PAAP R. What are the advantages of MCMC based inference in latent variable models? [J]. Stat Neerland, 2002, 56(1): 2-22.
    [34]
    BOOTH J G, HOBERT J P. Maximizing generalized linear mixed model likelihoods with an automated Monte Carlo EM algorithm [J]. J Roy Stat Soc Ser B Stat Methodol, 1999, 61(1): 265-285.
    [35]
    LELE S R. DENNIS B, LUTSCHER F. Data cloning: easy maximum likelihood estimation for complex ecological models using Bayesian Markov chain Monte Carlo methods [J]. Ecol Lett, 2007, 10(7): 551-563.
    [36]
    CHEN Dongsheng, HUANG Xingzhao, SUN Xiaomei, et al. A comparison of hierarchical and non-hierarchical Bayesian approaches for fitting Allometric larch (Larix spp.) biomass equations [J]. Forests, 2016, 7(1): 18. doi:10.3390/f7010018.
    [37]
    BARRIO-ANTA M, BALBOA-MURIAS M A, CASTEDO-DORADO F, et al. An ecoregional model for estimating volume, biomass and carbon pools in maritime pine stands in Galicia (northwestern Spain) [J]. For Ecol Manage, 2006, 223(1/3): 24-34.
  • 加载中
通讯作者: 陈斌, bchen63@163.com
  • 1. 

    沈阳化工大学材料科学与工程学院 沈阳 110142

  1. 本站搜索
  2. 百度学术搜索
  3. 万方数据库搜索
  4. CNKI搜索

Figures(1)  / Tables(3)

Article views(3505) PDF downloads(432) Cited by()

Related
Proportional views

Comparison of fitting approaches with biomass expansion factor equations

doi: 10.11833/j.issn.2095-0756.2017.05.002

Abstract: Biomass equations for the biomass expansion factor (fBEF) have been widely applied for accurate stand biomass estimations. The question here is how to improve the fitting precision of these biomass expansion factor (fBEF) equations by using different methodologies. Stand biomass data were obtained from 53 permanent sample plots located in Cunninghamia lanceolata plantations of Anhui and Fujian Provinces across China. The least squares approach, the nonlinear mixed model approach, and the hierarchical Bayesian approach were applied to establish BEF equations so as to test the effect of regions. Split-plot design with regions of Anhui and Fujian Provence and sample plots as replications. Results showed significant differences between Fujian and Anhui Provinces for stand biomass, volume, and fBEF at different ages. The R2 and mean deviation (dMD) values for the least squares approach was R2 = 0.643, dMD = 0.376; for the nonlinear mixed model approach was R2 = 0.802, dMD = 0.233; and for the hierarchical Bayesian approach was R2 = 0.804, dMD = 0.228. Also, there were highly significant differences in fitted results between the least squares and the nonlinear mixed model approaches, as well as between the least squares and the hierarchical Bayesian approaches (P < 0.01). However, no significant differences were found between the nonlinear mixed model approach and the hierarchical Bayesian approach (P = 0.547). Thus, both the mixed model approach and the Bayesian hierarchical approach were effective methods for estimating stand biomass at the regional scale.

HUANG Xingzhao, WANG Zefu, XU Xiaoniu. Comparison of fitting approaches with biomass expansion factor equations[J]. Journal of Zhejiang A&F University, 2017, 34(5): 775-781. doi: 10.11833/j.issn.2095-0756.2017.05.002
Citation: HUANG Xingzhao, WANG Zefu, XU Xiaoniu. Comparison of fitting approaches with biomass expansion factor equations[J]. Journal of Zhejiang A&F University, 2017, 34(5): 775-781. doi: 10.11833/j.issn.2095-0756.2017.05.002
  • 如何精准估算和预测森林生物量以及碳储量成为当前的研究热点[1]。生物量转换因子(fBEF, biomass expansion factors)是林分生物量与木材蓄积的比值,因它可以利用森林资源清查数据计算,已广泛用于林分生物量的估算。BROWN等[2-5]和FANG等[6-9]利用不同森林类型生物量转换因子的平均值乘以相应森林类型的总蓄积,得到不同森林类型的生物量。FANG等[8-11]利用生物量转化因子连续函数,提升了森林生物量的估算精度。生物量转换因子连续函数fBEFa+b/V,其中ab为参数,fBEF为生物量转换因子,V为林分蓄积。该方程符合林分的生长规律,具有普遍适用性[10]。利用生物量转换因子连续函数估算森林生物量已成为普遍使用的方法,在拟合方法上均是使用经典统计学方法。贝叶斯统计学认为未知参数为随机变量,应用一个概率分布去描述未知参数的未知分布,这个概率分布是在抽样前就有的关于未知参数的先验信息的概率描述,并利用后验分布检验先验信息。贝叶斯统计已被广泛应用于林业的研究中,如林木的径阶分布规律[12-13]、立木胸径和树高生长模型[14]、立木生物量模型[15-17]。利用贝叶斯统计学的方法拟合生物量转换因子连续函数尚未见报道。另一方面,以往研究均是利用固定的生物量转换因子连续函数估算某一类型森林生物量,尚未考虑区域对该类型森林生物量的影响。混合模型和贝叶斯分层在拟合生物量转换因子连续函数时,可以解决区域对某一类型森林生物量的影响。混合模型既可以反映总体平均变化趋势,又可反映个体(区域)之间的差异[18-19],因此特别适用于多层次(区域)的数据[20]。杉木Cunninghamia lanceolata是中国南方重要用材树种。根据第8次全国森林资源调查,杉木天然林面积居第9位,人工林面积居首位[21]。本研究以不同区域杉木人工林生物量数据为基础,分别使用经典统计学方法、混合模型方法和贝叶斯分层法拟合生物量转换因子连续函数,比较3种方法的预估精度,阐述区域对林分生物量的影响,以期为森林生物量的精准估算提供技术支撑。

  • 以安徽省六安市马鬃岭林场和福建省建瓯市东安林场2个区域的杉木人工林为研究对象。马鬃岭林场位于31°10′~31°30′N,115°31′~115°50′E,属于北亚热带季风气候,年均气温为13.5 ℃,年降水量为1 200.0 mm。林地土壤为山地黄棕壤,土层厚达50 cm,pH 5.5~6.3。东安林场位于26°30′~27°20′N,118°00′~119°20′E,属于亚热带季风气候,年均气温为18.8 ℃,年降水量为1 700.0 mm。林地土壤为红壤,土层厚达40 cm,pH 5.2~6.0。

  • 2014年7-9月,选择不同年龄序列的典型杉木人工林,分别在2个区域设置0.06 hm2的样地53块(马鬃岭林场26块,东安林场27块)。在样地调查的基础上,按照胸径分布(8,10,12,…)选择样木2~3株·径级-1伐倒测量,共计57株样木(马鬃岭林场28株,东安林场29株)。在生物量调查中,为了提高样木生物量的测定精度,采用“分层切割法”测定样木的树干、树皮、树枝、树叶(地上部分)的鲜质量,并分别取样品测定。各器官分别取样后将样品带回实验室,在105 ℃下进行30 min的杀青处理,然后将烘箱的温度调到80 ℃烘干至恒量,测出各组分样品的含水率,然后根据样品含水率推算出各组分的生物量。在样地每木检尺和立木地上生物量测定的基础上,根据立木的生物量(y)方程yaD2HbDH分别为胸径和树高,两区域参数ab的值分别是6.30×10⁻²和2.47,7.40×10-2和2.39);根据立木材积(V)方程VaDbHc(两区域参数abc的值分别是5.18×10-5,1.85和1.02,5.20×10-5,1.78和1.03),计算出样地的林分生物量和蓄积(表 1)。根据公式fBEFB/VB为林分生物量,V为林分蓄积量)计算生物量转换因子。

    试验地属性12年生(n=21)23年生(n=18)31年生(n=18)
    生物量/(t·hm-2)林分蓄积/(m3·hm-2)生物量/(t·hm-2)林分蓄积/(m3·hm-2)生物量/(t·hm-2)林分蓄积/(m3·hm-2)
    均值44.4735.63122.3087.71208.41127.07
    马鬃岭标准差7.916.0615.0411.9814.0820.56
    范围33.96~56.3328.52~46.22101.38~156.5870.01~105.21191.99~230.82106.04~173.89
    均值52.1147.74155.19108.84244.92169.83
    东安标准差18.1411.2122.1515.6629.7119.62
    范围23.4~86.8531.12~71.27113.72~197.3085.13~145.41210.38~312.06149.31~204.59

    Table 1.  Descriptive statistics of Cunninghamia lanceolata plots sampled at difference regions

  • FANG等[8-11]利用倒数方程来表示生物量转换因子和林分蓄积之间的关系。方程表达式为fBEFia+b/Vi。其中:fBEFi为第i块样地的生物量转换因子,Vi为第i块样地的林分蓄积,ab为方程参数。当林分为成熟林(蓄积量很大)时,fBEF趋向稳定;当林分为幼龄林(蓄积量很小)时,fBEF很大[10]

  • ① 最小二乘法。经典统计学通常使用最小二乘法。本研究使用最小二乘法拟合式(1)。最小二乘法通过误差的平方最小化求解参数,其公式为:

    通过生物量转化因子的实测值fBEFi与估计值a+b/Vi两者之差的平方和最小,求出参数ab。② 非线性混合模型方法。非线性混合模型是通过考虑回归函数依赖于固定和随机效应的非线性关系拟合方程[22]。非线性混合模型在式(1)中的表现形式如下:

    式(2)中:i=1,2,…,mj=1,2,…,nfBEFij表示第i个区域第j块样地的生物量转换因子,Vij表示第i个区域第j块样地的林分蓄积,m表示区域,n表示第i个区域的样地个数,xi表示参数矩阵,eij表示误差,f表示非线性函数。③ 贝叶斯分层方法。使用贝叶斯分层方法拟合式(1),首先理解贝叶斯原理。假设:x={x1x2x3,…}为实测数据,θ={θ1θ2θ3,…}为未知参数,贝叶斯原理的表达式:

    式(3)中:p定义为概率分布(密度函数)。在经典统计学中通过最小二乘法计算参数θ的值,不同的θ有不同的分布;在贝叶斯统计中为利用概率分布p计算参数θ的值,θ为同一种的分布[23]。就是根据参数向量θ的先验信息推算其先验分布为πθ)。没有样本信息时,只能根据先验分布对θ进行推算。在已知实测数据x的情况下,依照px, θ)对参数θ进行计算。计算公式:

    式(4)称为贝叶斯公式的密度函数形式,即在实测数据x已知情况下,θ的条件分布πθ | x),定义为θ的后验分布。基于后验分布πθ | x)对θ进行统计,可以排除与θ无关的信息,使得推断更为有效合理。2个区域杉木人工林生物量转换因子和林分蓄积数据含有嵌套:包含区域间和样地间,这样的数据类型称之为分层数据[24]。本数据分为2层,第1层是区域间的生物量转换因子和林分蓄积数据,第2层为每个区域内样地的生物量转换因子和林分蓄积数据。利用贝叶斯分层模型估计异速生物量方程的参数时,首先要对参数ab给出第2层(区域内)的先验π2ab)先验分布(通常为为信息的先验分布),使得参数ab的后验分布πa, b | d)在d给定下为以正常分布[25]。由贝叶斯定理计算参数θab的联合后验分布:

    θ为参数ab的先验分布。式(6)和式(7)计算θ的条件后验部分:

    式(9)中:πθj | a, b, dxj))为第1层(区域间)θj的后验分布。利用式(8)计算参数ab的后验分布πa, b, d):

  • 本研究使用2个区域杉木人工林生物量转换因子数据。分别使用最小二乘法、混合模型和贝叶斯分层方法拟合生物量转化因子连续函数。同时,使用决定系数(R2)和平均偏差(dMD)对拟合效果进行评价。R2dMD的计算方法如下:

    式(10)和式(11)中:yi为实际观测值,yi为样本平均值, ${{\hat y}_i}$ 为模型预测值,n为样本数。采用F统计检验两两比较最小二乘法、非线性混合模型和贝叶斯分层方法之间的差异。F统计检验计算公式[26]

    式(12)中:STSSAfdfASTSSBfdfB为两两比较时拟合的残差平方和及自由度。通过F值的大小来判定最小二乘法、混合模型和贝叶斯分层方法之间之间是否存在差异,为是否需要建立适用于区域的杉木生物量转化因子连续方程做出判断。数据统计分析及绘图使用R 2.14.0软件完成,其中非线性混合模型使用NLME程序包、贝叶斯分层方法使用R2WinBUGS程序包[27]

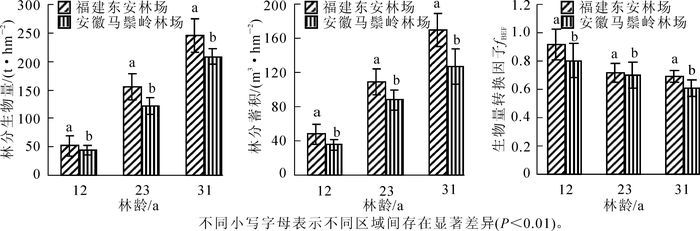
  • 图 1表明:林分生物量、林分蓄积和fBEF随林龄呈现规律性变化。林分生物量和林分蓄积随林龄的增大而增加,fBEF随林龄的增大而降低。从12年生到31年生,林分生物量和林分蓄积的年平均增长率分别为5.33%和6.31%;fBEF的年平均减少率为5.22%。同时,比较不同区域各林龄(12年生、23年生、31年生)间林分生物量、林分蓄积和fBEF的差异,结果表明:不同区域间杉木林分生物量、林分蓄积和fBEF均存在显著差异(P<0.01)。因此,拟合生物量转换因子连续函数时,必须考虑区域因子对方程的影响。

    Figure 1.  Compared the stand biomass, volumes and fBEF at difference regions

  • 分别使用最小二乘法、非线性混合模型法和贝叶斯分层法等3种方法拟合生物量转换因子连续函数,结果如表 2所示:3种方法都可以拟合生物量转换因子连续函数(P<0.01)。其中非线性混合模型参数βaβb为参数ab的固定效应值,σaσb为参数的区域随机效应值,σab为参数的区域随机效应的协方差值。贝叶斯分层方法对生物量转换因子连续函数进行拟合时,通过设置迭代次数由马尔科夫蒙特卡洛链的收敛效果评估参数ab的后验分布。本研究利用贝叶斯分层方法拟合时均设置10 000次迭代,贝叶斯分层方法使用3条马尔科夫蒙特卡洛链(迭代有3个颜色),在500开平稳始迭代,且演进过程也比较稳定,可以断定参数值可以较好的收敛。表 2a1b1a2b2分别代表福建和安徽2个区域生物量转换因子连续函数的参数值。

    拟合方法参数参数值标准差P
    最小二乘法a0.600 00.019<0.001
    b12.927 01.336<0.001
    非线性混合模型βa0.605 00.015<0.001
    βb12.651 02.977<0.001
    σa0.000 1
    σb3.883 0
    σab0.268 0
    e0.062 0
    贝叶斯分层a10.601 00.014<0.001
    b116.739 02.241<0.001
    a20.764 00.016<0.001
    b22.040 00.397<0.001

    Table 2.  BEF-stem volume equation fitted results of different approaches

  • 使用3种方法拟合生物量转换因子连续函数,拟合结果如表 3。最小二乘法、非线性混合模型法和贝叶斯分层法的决定系数R2分别为0.643,0.802和0.804;平均偏差分别为0.376,0.233和0.228。从R2和平均偏差初步得出非线性混合模型法和贝叶斯分层法拟合效果相似。使用F检验两两比较拟合效果,结果表明:最小二乘法的拟合效果与非线性混合模型法和贝叶斯分层法之间有显著差异,非线性混合模型法和贝叶斯分层法之间无显著差异。非线性混合模型法和贝叶斯分层法均考虑了区域因子,可以显著提升生物量转化因子连续函数的拟合效果。

    拟合方法R2平均偏差dMDFP>|F|
    10.6430.376
    20.8020.233
    30.8040.228
    1 vs 216.437<0.001
    1 vs 316.509<0.001
    2 vs 31.0490.547
        说明:1,2和3分别代表最小二乘法、非线性混合模型法和贝叶斯分层法。vs表示比较。P是probability的缩写,其值是F检验的原假设对应的F值。

    Table 3.  Comparing the fitted results at different approaches

  • 本研究偏重拟合方法研究,利用非线性混合模型和贝叶斯分层方法拟合生物量转化因子连续函数时,以区域设置为随机效应消除其对林分生物量估算的影响,可以显著提升生物量转化因子连续函数的拟合效果。参照曾伟生[28]利用混合模型估算立木生物量的方法,以区域为随机效应利用混合模型拟合生物量转换因子连续函数,进一步证实区域对生物量转换因子(fBEF)的估算存在显著影响。符利勇等[29]利用混合模型估算马尾松Pinus massoniana立木生物量,证实不同起源的马尾松立木生物量存在差异,并且区域和起源对立木生物量的影响存在交互作用。贝叶斯分层方法是通过迭代[30]把一系列复杂的高维问题转化为简单的低维问题,由1条或几条收敛的马尔科夫链蒙特卡罗链[31]拟合生物量转化因子连续函数。本研究中的贝叶斯分层方法产生3条马氏链即可达到一个平稳状态。相对于经典统计方法利用渐进方差估计建模过程的精确性,贝叶斯原理则利用马氏链的平稳分布和收敛来估计[32-33],因为在平稳分布中抽取的样本包含许多不确定的信息,这些不确定信息对建模过程产生的影响归于马氏链是否真正平稳分布与收敛,而不是在估计中运用样本产生的方差来断定[34-35]

    对于立木生物量的拟合方法的研究中,MAURICIO等[15]利用先验信息的贝叶斯方法可以减少样本量。ZHANG等[16]比较了最小二乘法、没有先验信息的贝叶斯方法和有先验信息的贝叶斯方法3种方法。结果表明:先验信息在立木生物量的拟合中发挥重要作用。黄兴召等[17]证明在立木样本量小于50株时,有先验信息的贝叶斯方法的拟合精度明显高于最小二乘法。这些算法的比较其样本均来自同一个区域。CHEN等[36]在大区域尺度拟合立木生物量时,发现贝叶斯分层方法显著优于有先验信息的贝叶斯方法,但是,在大区域拟合生物量中,尚未见非线性混合模型和贝叶斯分层之间的差异研究。

    本研究基于不同区域杉木人工林生物量和林分蓄积量数据,系统地介绍如何利用最小二乘法、非线性混合模型法和贝叶斯分层方法拟合生物量转换因子连续函数,并证实非线性混合模型法和贝叶斯分层方法可以显著提升杉木人工林生物量的估算效果,为大尺度估算林分生物量提供理论参考。通过F检验,比较3种方法的拟合效果,发现以区域为随机效应和分层基础的非线性混合模型法和贝叶斯分层法可以显著提升林分生物量的预估精度。区域之间的地理位置、气候条件、土壤条件等均不相同,这些是造成生物量差异的主要因子[37]。区域作为随机效应可以很好地解释林分生物量差异的原因,进一步区分哪种因素造成了生物量的差异,已成为今后研究的重要内容之一。

Reference (37)

Catalog

    /

    DownLoad:  Full-Size Img  PowerPoint
    Return
    Return