DOU Xiaowen, WU Dengyu, ZHANG Xiaojing, et al. Study on the factors affecting breast-height basal area increment of evergreen broad-leaved forest in Mount Tianmu[J]. Journal of Zhejiang A&F University, 2023, 40(5): 1063-1072. DOI: 10.11833/j.issn.2095-0756.20220651
Citation: TANG Sijia, TANG Mengping, SHEN Qianyong, et al. Relationship of spatial structure and regeneration dynamics in Phyllostachys edulis[J]. Journal of Zhejiang A&F University, 2018, 35(1): 1-9. DOI: 10.11833/j.issn.2095-0756.2018.01.001

Relationship of spatial structure and regeneration dynamics in Phyllostachys edulis

DOI: 10.11833/j.issn.2095-0756.2018.01.001
  • Received Date: 2017-02-28
  • Rev Recd Date: 2017-04-29
  • Publish Date: 2018-02-20
  • To determine the relationship between spatial structure and regeneration dynamics of a Phyllostachys edulis stand, an experiment was conducted in Mount Tianmu National Nature Reserve of Zhejiang Province. Data was taken from Ph. edulis stand in 2010, 2012, 2014. Fourur spatial structural indices, namely, nearest bamboo number, uniform angle, neighborhood comparison, and competition index, were selected to describe spatial structural characteristics of the bamboo. A principal component analysis was used for analysis. Results indicated an order of importance for spatial structural indices affecting Ph. edulis growth as nearest bamboo number > neighborhood comparison > competition index > uniform angle, and an order concerning importance of spatial structural indices affecting Ph. edulis death as nearest bamboo number > competition index > neighborhood comparison > uniform angle. New bamboo was apt to grow in an area where the nearest bamboo number was < 4 or > 7; whereas, old bamboo was apt to die if the nearest bamboo number was > 7. Living bamboo, new bamboo, and dead bamboo all presented a clustered distribution pattern with no significant differences at the uniform angles (P>0.05). Living bamboo had an intermediate status with new bamboo in a sub-dominant state and dead bamboo in a relatively disadvantageous state. All showed highly significant differences in neighborhood comparison (P < 0.01). An intensity of average competition index as dead bamboo > living bamboo > new bamboo. This indicated that the growth condition had an important effect on bamboo regeneration.
  • [1] JIANG Zhonglong, YE Liuxin, LIU Jun, LIN Song, XU Minyu, WU Jiasen, LIU Juan, LIU Haiying.  Effects of enclosure duration on litter and soil water holding capacity of Phyllostachys edulis forest . Journal of Zhejiang A&F University, 2020, 37(5): 860-866. doi: 10.11833/j.issn.2095-0756.20190603
    [2] YE Peng, YE Changmin, ZHOU Tongyue, LU Yujun, YANG Fan, TANG Mengping.  Spatial structure characteristics of close-to-nature Phyllostachys edulis forests in Zhejiang Province . Journal of Zhejiang A&F University, 2020, 37(2): 228-234. doi: 10.11833/j.issn.2095-0756.2020.02.005
    [3] HU Ce, LIANG Xie'en, WANG Haixiang, XU Chao, ZHOU Zheyu, ZHU Li'na, HUANG Haonan, ZHANG Rumin, WEN Guosheng.  Diurnal variation of Phyllostachys edulis photosynthesis and transpiration during its rapid growth period . Journal of Zhejiang A&F University, 2018, 35(2): 277-283. doi: 10.11833/j.issn.2095-0756.2018.02.011
    [4] GAO Pingzhen, CHEN Shuanglin, GUO Ziwu, YANG Qingping.  Nitrogen-fixing plants and their economic value as an understory in Phyllostachys edulis stands . Journal of Zhejiang A&F University, 2018, 35(1): 161-166. doi: 10.11833/j.issn.2095-0756.2018.01.021
    [5] TANG Sijia, TANG Mengping, ZHAO Saisai, DU Xiufang, SHEN Qianyong, PANG Chunmei.  Competitive spatial patterns for Moso bamboo on Mount Tianmu . Journal of Zhejiang A&F University, 2018, 35(2): 199-208. doi: 10.11833/j.issn.2095-0756.2018.02.002
    [6] YU Shuhong, ZHOU Guomo, SHI Yongjun, LÜ Yulong, SHEN Zhenming.  Net carbon sinks in the initial stages of moso bamboo stands . Journal of Zhejiang A&F University, 2016, 33(5): 807-815. doi: 10.11833/j.issn.2095-0756.2016.05.012
    [7] WANG Yang, LENG Yanzhi, SU Changjiang, SONG Congwen, CHENG Dehua, CAO Yingnan, ZHANG Min, FU Cuilin.  Spatial structure and distribution pattern of natural Toona ciliata populations in the Enshi Region . Journal of Zhejiang A&F University, 2016, 33(1): 17-25. doi: 10.11833/j.issn.2095-0756.2016.01.003
    [8] ZENG Yingying, WANG Yukui, CAI Xianfeng, YU Xiaopeng, LI Hongji, YUAN Jiali, ZHANG Rumin, WEN Guosheng.  Nutritional elements in organs of a Phyllostachys edulis stand during its fast growth period . Journal of Zhejiang A&F University, 2015, 32(2): 272-277. doi: 10.11833/j.issn.2095-0756.2015.02.015
    [9] GU Honghao, WENG Jun, KONG Jiajie, YE Xiaomeng, LIU Yongjun, QI Lianghua, SONG Xinzhang.  Ecological stoichiometry of Phyllostachys edulis leaves with extensive and intensive management . Journal of Zhejiang A&F University, 2015, 32(5): 661-667. doi: 10.11833/j.issn.2095-0756.2015.05.002
    [10] FAN Peipei, WEI Xinliang, GUO Ruyi, TANG Mengping.  Forest tree spatial characteristics of a coniferous, broad-leaf mixed forest on Mount Tianmu . Journal of Zhejiang A&F University, 2015, 32(5): 675-682. doi: 10.11833/j.issn.2095-0756.2015.05.004
    [11] CAO Xiaoyu, LI Jiping, FENG Yao, ZHANG Caicai, FANG Xiaona.  Stand spatial structure for an uneven-aged Cunninghamia lanceolata ecological forest . Journal of Zhejiang A&F University, 2015, 32(1): 84-91. doi: 10.11833/j.issn.2095-0756.2015.01.012
    [12] LI Beilei, SONG Zhaoliang, JIANG Peikun, ZHOU Guomo, LI Zimin.  Phytolith distribution and carbon sequestration in China with Phyllostachys edulis . Journal of Zhejiang A&F University, 2014, 31(4): 547-553. doi: 10.11833/j.issn.2095-0756.2014.04.009
    [13] WU Aibin, YOU Xianxiang, ZHAO Yanxia, QIN Yanjie, LIU Xin.  Acquisition and analysis spatial structure of Platycladus orientalis plantations based on 3S . Journal of Zhejiang A&F University, 2014, 31(1): 57-63. doi: 10.11833/j.issn.2095-0756.2014.01.009
    [14] LI Cuiqin, ZHOU Yufeng, GU Lei, SHI Yongjun, SHEN Zhenming, XU Xiaojun, LI Ruijun.  Carbon transfer of Phyllostachys edulis filar products . Journal of Zhejiang A&F University, 2013, 30(1): 63-68. doi: 10.11833/j.issn.2095-0756.2013.01.009
    [15] WANG Qun, ZHANG Jin-chi, TIAN Yue-liang, YE Li-xin, LIU Sheng-long.  Stand spatial structure of a natural mixed forest in the Fengyang Mountains of Zhejiang . Journal of Zhejiang A&F University, 2012, 29(6): 875-882. doi: 10.11833/j.issn.2095-0756.2012.06.011
    [16] DONG Da-chuan, KONG Zhen, YANG Wei-xi, LI Shuang-shuang, GAO Rong-fu, GAO Pei-jun.  Spectral reflectance of leaves for Phyllostachys pubescens at different canopy layers using a 4th order derivative . Journal of Zhejiang A&F University, 2011, 28(6): 893-899. doi: 10.11833/j.issn.2095-0756.2011.06.009
    [17] ZHANG Li-yang, WEN Guo-sheng, WANG Sheng-jie, LIU Zhao-ling.  Four light-response models to estimate photosynthesis of Phyllostachys pubescens . Journal of Zhejiang A&F University, 2011, 28(2): 188-193. doi: 10.11833/j.issn.2095-0756.2011.02.003
    [18] DENG Ying-ying, TANG Meng-ping, XU Wen-bing, CHEN Yong-gang, LOU Ming-hua, ZHAO Ming-shui.  Spatial structure of bamboo culm of an almost natural,pure Phyllostachys pubescens forest in Mount Tianmu . Journal of Zhejiang A&F University, 2011, 28(2): 173-179. doi: 10.11833/j.issn.2095-0756.2011.02.001
    [19] HE Ying,  WEI Xin-liang,  CAI Xia,  LI Ke-zhui,  WANG Zhen.  Quantitative analysis of community structure in ecological landscape forests . Journal of Zhejiang A&F University, 2007, 24(6): 711-718.
    [20] CAO Yong-hui, XIAO Jiang-hua, CHEN Shuang-lin, WU Bo-lin, WU Ming, ZHANG De-ming.  Effect of everygreen brood-leaved trees on Phyllostachys pubescens growth and their competition in the mixed forest . Journal of Zhejiang A&F University, 2006, 23(1): 35-40.
  • [1]
    LIU Min. Study on the 8th national forest inventory from multiple perspective [J]. For Econ, 2014(5): 3-15.
    [2]
    ZHOU Guomo, JIANG Peikun. Density, storage and spatial distribution of carbon in Phyllostachys pubescens forest [J]. Sci Silv Sin, 2004, 40(6): 20-24.
    [3]
    XIAO Fuming, FAN Shaohui, WANG Silong, et al. Estimation of the carbon balance in Moso bamboo and Chinese fir plantation ecosystem [J]. Sci Silv Sin, 2010, 46(11): 59-65.
    [4]
    QI Lianghua, LIU Guanglu, FAN Shaohui, et al. Effects of different tending measures on carbon density, storage, and allocation pattern of Phyllostachy edulis forests in western Fujian Province [J]. Chin J Ecol, 2009, 28(8): 1482-1488.
    [5]
    PRETZSCH H. Analysis and modeling of spatial stand structures: methodological considerations based on mixed beech-larch stands in Lower Saxony [J]. For Ecol Manage, 1997, 97(3): 237-253.
    [6]
    TANG Mengping, TANG Shouzheng, LEI Xiangdong, et al. Study on spatial structure optimizing model of stand selection cutting [J]. Sci Silv Sin, 2004, 40(5): 25-31.
    [7]
    AGUIRRE O, HUI Gangying, GADOW K, et al. An analysis of spatial forest structure using neighborhood-based variables [J]. For Ecol Manage, 2003, 183(1/3): 137-145.
    [8]
    TANG Mengping. Advances in study of forest spatial structure [J]. Sci Silv Sin, 2010, 46(1): 117-122.
    [9]
    ZHENG Jinxuan, DONG Wenyuan, CHEN Chong, et al. Studies on the growth and rhythm of natural moso bamboo population in Haiziping [J]. J Bamboo Res, 2008, 27(2): 32-37.
    [10]
    JIA Xiuhong, ZHENG Xiaoxian. Analysis on the spatial structure of the spruce-fir mixed stands of coniferous and broad-leaved trees in the over-logged forest [J]. J Huazhong Agric Univ, 2006, 25(4): 436-440.
    [11]
    MAO Lei, WANG Dongmei, YANG Xiaohui, et al. Spatial patterns of young Pinus sylvestris var. mongolica saplings and their regeneration analysis in different stands of Inner Mongolia, northern China [J]. J Beijing For Univ, 2008, 30(6): 71-77.
    [12]
    XI Qinghu, TIE Niu, SHU Mei, et al. Study on natural regeneration of Larix gmelinii in cold-temperate zone [J]. For Resour Manage, 2009(1): 44-48.
    [13]
    TANG Mengping, ZHOU Guomo, CHEN Yonggang, et al. Mingling of evergreen broad-leaved forests in Tianmu Mountain based on Voronoi diagram [J]. Sci Silv Sin, 2009, 45(6): 1-5.
    [14]
    QIU Jianxi, TANG Mengping, SHEN Lifen, et al. The relationship between spatial structure and DBH of close-to-nature Phyllostachys edulis stands in Tianmu Mountain [J]. Acta Ecol Sin, 2015, 35(12): 4081-4088.
    [15]
    DING Lixia, WANG Zuliang, ZHOU Guomo, et al. Monitoring Phyllostachys pubescens stands expansion in National Nature Reserve of Mount Tianmu by remote sensing [J]. J Zhejiang For Coll, 2006, 23(3): 297-300.
    [16]
    CHEN Xin'an. Discussion on the growth regulation of on-year and off-year moso bamboo [J]. Cent South For Inv Plan, 2010, 29(1): 21-23.
    [17]
    TANG Mengping, CHEN Yonggang, SHI Yongjun, et al. Intraspecific and interspecific competition analysis of community dominant plant populations based on Voronoi diagram [J]. Acta Ecol Sin, 2007, 27(11): 4707-4716.
    [18]
    GADOOW K V, HUI Gangying, ALBERT M. Das Winkelmaβ-ein strukturparameter zur beschreibung der individu-alverteilung in Waldbeständen [J]. Centr Ges For, 1998, 115(1): 1-9.
    [19]
    POMMERENING A. Evaluating structural indices by reversing forest structural analysis [J]. For Ecol Manage, 2006, 224(3): 266-277.
    [20]
    POMMERENING A, STOYAN D. Edge-correction needs in estimating indices of spatial forest structure [J]. Can J For Res, 2006, 36(7): 1723-1739.
    [21]
    HUI Gangying, von GADOW K, ALBERT M. A new parameter for stand spatial structure: neighborhood comparison [J]. For Res, 1999, 12(1): 1-6.
    [22]
    ZHAO Zhonghua, HUI Gangying, HU Yanbo, et al. Method and application of stand spatial advantage degree based on the neighborhood comparison [J]. J Beijing For Univ, 2014, 36(1): 78-82.
    [23]
    XIN Yingying, WEI Xinliang. Dominance in a mixed conifer and broadleaved forest of Qingshan Lake, Zhejiang [J]. J Zhejiang A&F Univ, 2011, 28(4): 601-606.
    [24]
    HEGYI F. A simulation model for managing Jack-pine stands[G]//FRIES J. Growth Models for Tree and Stand Simulation. Stockholm: Royal College of Forestry, 1974: 74-90.
    [25]
    TANG Mengping, XU Wenbing, CHEN Yonggang, et al. Relationship between spatial structure and biomass of a close-to-nature Phyllostachys edulis stand in Tianmu Mountain [J]. Sci Silv Sin, 2011, 47(8): 1-6.
    [26]
    LI Jiping, FENG Yao, ZHAO Chunyan, et al. Discussion on the analysis method of uniform angle index based on Voronoi diagram: take Fushou Forest Farm as an example [J]. For Resour Manage, 2015(4): 33-38.
    [27]
    WANG Wei, HU Kai, WU Dongqin, et al. Studies on the ramet population structure of the clonal moso bamboo in Chongqing [J]. J Bamboo Res, 2008, 27(2): 16-20.
    [28]
    HUANG Lixia, YUAN Weigao, HUANG Jianhua, et al. Comparative study on spatial structure of Phyllostachys heterocycla var. pubescens stand with different management [J]. J Zhejiang For Sci Technol, 2008, 28(3): 48-51.
    [29]
    CAO Liuqing, LI Xiaofeng. Research on cultivation technology of big-diameter bamboo [J]. J Bamboo Res, 2003, 22(4): 34-41.
    [30]
    ZHENG Yushan, HONG Wei. A study on age structure model of bamboo stand and its application [J]. Sci Silv Sin, 1998, 34(3): 32-39.
  • 加载中
  • Cited by

    Periodical cited type(8)

    1. 龙丹,吴逸卿,周伟龙,朱子安,周文婕,仲磊,沈国春,刘金亮,于明坚. 百山祖国家公园与邻近地区常绿阔叶林群落特征比较. 浙江农林大学学报. 2025(01): 12-22 . 本站查看
    2. 张孟昕,陈波,刘伟琪,漆一宁,张明. SSA-XGBoost与时空特征选取的大坝变形预测模型. 水力发电学报. 2024(01): 84-98 .
    3. 吴莎,边更战,易烜,吕勇. 青冈栎次生林林分形高模型构建. 林草资源研究. 2024(01): 134-142 .
    4. 吕洁,童茜坪,金星姬,Timo Pukkala. 应用优化建模法构建红松人工林单木直径生长模型. 东北林业大学学报. 2024(05): 63-69+74 .
    5. 姜鹏博,窦啸文,韦新良,罗海豪,汤孟平. 基于树种谱系的林木种间竞争分析. 森林与环境学报. 2024(04): 414-422 .
    6. 池静姚,潘磊磊,Kwon SeMyung,张晓,李雨衡,杨晓晖,时忠杰. 呼伦贝尔沙地樟子松天然林结构多样性和竞争对树木生长的影响. 中国沙漠. 2024(05): 29-40 .
    7. 徐军亮,候佳玉,毋彤,翟乐鑫,罗鹏飞,卫苗,章异平. 4个环孔材树种木质部年内生长动态及与气候因子的关系. 浙江农林大学学报. 2024(06): 1105-1113 . 本站查看
    8. 林文胜,王宏翔. 基于功能性状的大明山天然林树种分组及单木生长模拟. 广西林业科学. 2024(06): 807-818 .

    Other cited types(2)

通讯作者: 陈斌, bchen63@163.com
  • 1. 

    沈阳化工大学材料科学与工程学院 沈阳 110142

  1. 本站搜索
  2. 百度学术搜索
  3. 万方数据库搜索
  4. CNKI搜索

Figures(2)  / Tables(7)

Article views(3841) PDF downloads(712) Cited by(10)

Related
Proportional views

Relationship of spatial structure and regeneration dynamics in Phyllostachys edulis

doi: 10.11833/j.issn.2095-0756.2018.01.001

Abstract: To determine the relationship between spatial structure and regeneration dynamics of a Phyllostachys edulis stand, an experiment was conducted in Mount Tianmu National Nature Reserve of Zhejiang Province. Data was taken from Ph. edulis stand in 2010, 2012, 2014. Fourur spatial structural indices, namely, nearest bamboo number, uniform angle, neighborhood comparison, and competition index, were selected to describe spatial structural characteristics of the bamboo. A principal component analysis was used for analysis. Results indicated an order of importance for spatial structural indices affecting Ph. edulis growth as nearest bamboo number > neighborhood comparison > competition index > uniform angle, and an order concerning importance of spatial structural indices affecting Ph. edulis death as nearest bamboo number > competition index > neighborhood comparison > uniform angle. New bamboo was apt to grow in an area where the nearest bamboo number was < 4 or > 7; whereas, old bamboo was apt to die if the nearest bamboo number was > 7. Living bamboo, new bamboo, and dead bamboo all presented a clustered distribution pattern with no significant differences at the uniform angles (P>0.05). Living bamboo had an intermediate status with new bamboo in a sub-dominant state and dead bamboo in a relatively disadvantageous state. All showed highly significant differences in neighborhood comparison (P < 0.01). An intensity of average competition index as dead bamboo > living bamboo > new bamboo. This indicated that the growth condition had an important effect on bamboo regeneration.

DOU Xiaowen, WU Dengyu, ZHANG Xiaojing, et al. Study on the factors affecting breast-height basal area increment of evergreen broad-leaved forest in Mount Tianmu[J]. Journal of Zhejiang A&F University, 2023, 40(5): 1063-1072. DOI: 10.11833/j.issn.2095-0756.20220651
Citation: TANG Sijia, TANG Mengping, SHEN Qianyong, et al. Relationship of spatial structure and regeneration dynamics in Phyllostachys edulis[J]. Journal of Zhejiang A&F University, 2018, 35(1): 1-9. DOI: 10.11833/j.issn.2095-0756.2018.01.001
  • 毛竹Phyllostachys edulis林是中国南方一种特殊的森林类型。中国是毛竹的主产地,毛竹林面积达443万hm2,占所有竹林面积的74%[1]。毛竹生长快、周期短、产量高、用途广[2],同时具有较强的固碳能力,在应对气候变化上有不可低估的作用[3-4]。森林空间结构是森林生长过程的驱动因子,对森林未来的发展具有决定性作用[5-6]。毛竹林的结构在一定程度上决定了其稳定性、发展的可能性与经营空间的大小[6]。近年来,对毛竹林经营管理的认识已从立竹度、年龄结构和树种组成等非空间结构向毛竹空间分布格局、年龄隔离和竞争(或大小空间排列)等空间结构[7-8]逐渐深化。毛竹依赖多年生竹鞭发笋繁殖,出笋周期2 a;竹笋出土50 d后高度生长和直径生长基本完成[9],生长速率大于乔木林。目前,对乔木林空间结构与其生长规律的研究较多[10-12],而关于毛竹林空间结构及林分更替动态关系的研究鲜见报道。本研究以浙江天目山国家级自然保护区内少受人为干扰的毛竹为研究对象,基于地理信息系统(geographic information system, GIS)的维诺(Voronoi)图空间分析功能确定空间结构单元[13],选用最近邻竹株数(nearest bamboo number),角尺度(uniform angle index),大小比数(neighborhood comparison),竞争指数(competition index)等4个空间结构指数,采用主成分分析方法,研究毛竹林空间结构与更替动态的关系,旨在为毛竹林经营提供科学依据。

  • 浙江天目山国家级自然保护区位于浙江省西北部杭州市临安区境内的西天目山(30°18′30″~30°24′55″N, 119°23′47″~119°28′27″E),总面积为1 050 hm2,主峰海拔为1 506 m。年平均气温为8.8~14.8 ℃,年积温为2 500~5 100 ℃,年降水量为1 390~1 870 mm,相对湿度为76%~81%。受海洋暖湿气候影响,该区森林植被丰茂,呈垂直带状分布:海拔870 m以下为常绿阔叶林,870~1 100 m为常绿、落叶阔叶混交林,1 100~1 380 m为落叶阔叶林,1 380~1 500 m为落叶矮林。毛竹林镶嵌于其他森林类型之间,多分布在海拔350~900 m,其林下植被稀少,主要树种有豹皮樟Litsea coreana var. sinensis,连蕊茶Camellia fraterna,细叶青冈Cyclobalanopsis myrsinaefolia,微毛柃Eurya hebeclados和短尾柯Lithocarpus brevicaudatus[14]。该区多年来坚持“不动一草一木”的方针,区内毛竹林少有人为干扰,毛竹生长状况接近自然状态[15]

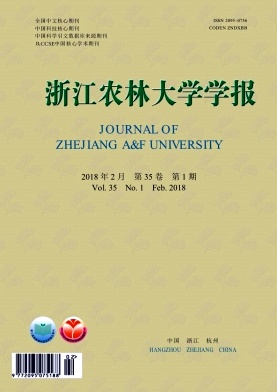
  • 2009年7月,在浙江天目山国家级自然保护区内,选择毛竹林典型地段,建立1块大小为100 m × 100 m的固定标准地。中心海拔为840 m,最高处海拔886 m,最低处海拔810 m;主坡向南偏东30°,平均坡度为37°;下部平缓,上部相对较急,水平方向相对一致(图 1);土壤类型为黄壤,壤质,土层厚度中。利用南方全站仪NTS355设定标准地的坐轴,采用相邻网格法将整个标准地划分为100个10 m × 10 m的样方;测定标准地内每株毛竹的基部三维坐标(xyz)。用枝痕法、观杆法确定毛竹年龄,用号竹法在胸高位置标记毛竹年份和竹号。每木调查测定毛竹胸径、竹高、年龄、枝下高、冠幅、弯曲状态等因子。2010-2015年,每年4月调查毛竹林固定标准地内的新笋地径,7月复查。

    Figure 1.  3D map of the sample plot

  • 根据各年毛竹林标准地复查数据,确定当年出笋长成的毛竹为新竹,当年状态为存活而翌年死亡的毛竹为死竹。因毛竹生长周期存在大小年现象,小年很少出笋或不出笋[16]。本试验以毛竹林各大年(2010,2012和2014年)数据为依据,对毛竹林更替状况与空间结构的关系进行研究。各大年活竹、新竹和死竹的统计数据见表 1

    年份 类别 数量/株 平均胸径/cm 平均株高/m
    2010 活竹 6 154 11.0 14.67
    新竹 896 11.4 13.97
    死竹 584 10.0 13.58
    2012 活竹 6 057 11.2 14.78
    新竹 763 11.3 14.53
    死竹 342 10.4 14.20
    2014 活竹 6 095 11.2 14.60
    新竹 651 11.1 14.30
    死竹 308 10.3 13.47

    Table 1.  Statistical data of Phyllostachys edulis in 2010, 2012 and 2014

  • 以标准地内任意1株毛竹为对象竹,基于Voronoi图确定由对象竹与相邻竹组成的空间结构单元[17]。每个Voronoi多边形内包含的1株毛竹即为对象竹,与其相邻Voronoi多边形内的毛竹即为最近相邻竹。对标准地采用八邻域平移法作边缘校正;计算空间结构指数时,矫正标准地内的毛竹为对象竹。

  • 从对象竹出发,测定任意2株相邻竹之间的2个夹角;设小角为α,最近邻竹均匀分布时的夹角为标准角α0。根据GADOW等[18]和POMMERENING等[19-20]研究,角尺度标准角随着最近邻株数n的变化而变化,取值为360°/(n+1)。角尺度(Wi)被定义为α角小于标准角的个数占所考察的最近邻株数n的比例。计算公式为:

    式(1)中:Wi为对象竹i的Voronoi角尺度,n为最近邻竹株数,αij为离散变量,当第jα角小于α0时,αij=1,反之,αij=0。

  • 大小比数是表达树种空间优势程度的良好指标,是对大小分化度的改进。大小比数(Ui)被定义为大于对象竹的相邻竹株数占最近相邻竹总株数的比例[21-22]。可选择胸径、树高和冠幅等作为比较指标[23]。本研究中以胸径作为比较指标。大小比数计算公式为:

    式(2)中:Ui为对象竹i的大小比数,n为最近邻竹株数,Kij为离散变量,当相邻竹j胸径大于对象竹i时,Kij=1,反之,Kij=0。

  • 竞争指数被广泛应用并被证明能够很好地解释植物竞争的强度、作用和竞争结果[23]。Hegyi竞争指数在形式上反映了林木个体竞争与生存空间的关系,方法简便易行[24]。因此,本研究采用Hegyi竞争指数计算毛竹林标准地内各对象竹的竞争指数。计算公式为:

    式(3)中:Ci为对象竹i的竞争指数,n为最近邻竹株数,didj分别为对象竹i和相邻竹j胸径,Lij为对象竹i和相邻竹j之间的距离。

  • 方差分析(analysis of variance, ANOVA)是用于2个及2个以上样本均数差别的显著性检验。对毛竹各空间结构指数中活竹、新竹和死竹的均值比较采用单因素方差分析(one-way ANOVA),且两两比较时选择最小显著性差异(least significant difference, LSD)法。

  • 主成分分析(principal component analysis, PCA)是一种简化数据集的方法。通过对毛竹林空间结构指数作主成分分析可以确定影响毛竹林更替的主导因子。对毛竹林空间结构指数进行标准化;然后计算空间结构指数的相关矩阵特征值、贡献率、累积贡献率以及其各主成分;最后对各主成分进行解释,并进行重要性排序[25]。本研究采用SPSS for Windows软件计算各空间结构指数的相关矩阵特征值、贡献率、累积贡献率和载荷矩阵。

  • 对象竹的最近邻竹对其更替有最直接的影响[25]。基于GIS的Voronoi图可以确定各对象竹的最近邻竹株数。结果表明(表 2):在各大年,活竹、新竹和死竹的最近邻竹株数频率分布中5~7株的频率最多;各年新竹或死竹的平均最近邻竹株数与活竹平均最近邻竹株数接近,均为6株左右。单因素方差分析发现,各年活竹、新竹和死竹在最近邻竹株数上不存在显著差异(P>0.05),表明三者具有一致的分布特征,即最近邻竹株数分布不影响竹林更替,毛竹林分具有相对稳定性。

    年份 对象竹 最近邻竹株数频率分布 平均最近邻竹数/株
    3 4 5 6 7 8 > 8株
    2010 活竹 0.02 0.13 0.26 0.30 0.19 0.06 0.04 6.01 a
    新竹 0.03 0.14 0.24 0.28 0.20 0.07 0.04 6.06 a
    死竹 0.02 0.11 0.24 0.30 0.20 0.08 0.04 6.06 a
    2012 活竹 0.01 0.09 0.26 0.31 0.21 0.07 0.05 6.00 a
    新竹 0.01 0.10 0.24 0.29 0.22 0.08 0.06 6.13 a
    死竹 0.01 0.08 0.24 0.30 0.21 0.09 0.06 6.03 a
    2014 活竹 0.01 0.11 0.25 0.31 0.19 0.08 0.05 6.00 a
    新竹 0.02 0.12 0.23 0.29 0.20 0.09 0.05 6.07 a
    死竹 0.01 0.10 0.23 0.30 0.21 0.10 0.06 6.13 a
    说明:相同字母表示活竹、新竹和死竹在相同年份的最近邻竹株数间差异不显著(P>0.05)。

    Table 2.  Statistics of nearest bamboo number of live bamboo, new bamboo and dead bamboo in 2010, 2012 and 2014

    对比新竹与活竹、死竹与活竹的最近邻竹株数频率分布(图 2)可以看出:新竹在“3株”“4株”或“7株以上”的最近邻竹株数频率要高于活竹;而死竹在“7株以上”的最近邻竹株数频率要高于活竹。说明新竹更容易在较低密度或较高密度区域内发笋生长,而死竹主要出现于较高密度区域。因此,为减少毛竹生长过程中的自然损耗,在毛竹林经营过程中应对毛竹林高密度(最近邻竹株数>7株)区域进行择伐。

    Figure 2.  Distribution of the nearest bamboo number of live bamboo, new bamboo and dead bamboo

  • 角尺度(Wi)可用于描述林木空间分布格局。根据Voronoi角尺度判别标准[26],林木空间分布格局有3种:Wi∈[0.327,0.357],随机分布;Wi<0.327,均匀分布;Wi>0.357,聚集分布。对各大年活竹、新竹、死竹角尺度进行统计(表 3)发现,新竹呈随机分布的频率高于活竹,原因是毛竹受所处生境条件影响,新竹呈现随机分布的可能性变大,与王微等[27]对重庆典型毛竹分株种群结构特征研究结果一致。死竹呈聚集分布的频率高于活竹,原因是聚集程度较高的区域竞争也更激烈,毛竹更易死亡。整体来看,各大年毛竹活竹、新竹和死竹平均角尺度均大于0.357,说明毛竹林整体上呈聚集分布,与黄丽霞等[28]研究结果一致。平均角尺度的单方差分析结果则表明,三者不存在显著性差异(P>0.05);说明毛竹林整体的空间分布格局少受毛竹更替的影响,具有相对稳定性。

    年份 对象竹 角尺度频率分布 平均角尺度 分布格局
    均匀分布 随机分布 聚集分布
    2010 活竹 0.27 0.16 0.58 0.385 a 聚集分布
    新竹 0.26 0.20 0.53 0.378 a 聚集分布
    死竹 0.25 0.13 0.62 0.389 a 聚集分布
    2012 活竹 0.25 0.17 0.59 0.390 a 聚集分布
    新竹 0.24 0.20 0.56 0.379 a 聚集分布
    死竹 0.23 0.14 0.62 0.391 a 聚集分布
    2014 活竹 0.25 0.15 0.60 0.391 a 聚集分布
    新竹 0.24 0.21 0.55 0.373 a 聚集分布
    死竹 0.24 0.13 0.63 0.394 a 聚集分布
    说明:相同字母表示活竹、新竹和死竹在相同年份的角尺度间差异不显著(P>0.05)。

    Table 3.  Statistics of uniform angle of live bamboo, new bamboo and dead bamboo in 2010, 2012 and 2014

  • 大小比数描述相邻毛竹之间的差异,反映立竹在毛竹林中的生长优势程度。对某一对象竹而言,大小比数取值为0.00,(0.00,0.25],(0.25,0.50],(0.50,0.75],(0.75,1.00]时,分别对应优势、亚优势、中庸、劣势和绝对劣势。对各大年活竹、新竹、死竹的大小比数进行统计(表 4)可以看出:新竹处于优势和亚优势的频率都大于活竹,说明新竹在林分生长中处于有利地位;而死竹处于劣势和绝对劣势的频率高于活竹,说明在受压环境下的毛竹更易死亡。总的来看,毛竹林整体处于中庸状态,大小比数的频率分布基本呈现均衡分布的特征;新竹主要处于亚优势状态,而死竹主要处于劣势状态。单因素方差分析结果表明:各大年毛竹活竹、新竹和死竹在大小比数上存在极显著差异(P<0.01),大小比数排序为死竹>活竹>新竹,反映了立竹的优势程度对毛竹更替有重要影响。因此,在毛竹林经营过程中,应提早采伐处于受压状态的毛竹,释放生长空间,为潜在新竹创造有利生长条件。

    年份 对象竹 大小比数频率分布 平均大小比数
    优势 亚优势 中庸 劣势 绝对劣势
    2010 活竹 0.19 0.17 0.24 0.19 0.21 0.49 a***
    新竹 0.26 0.20 0.21 0.13 0.19 0.38 b***
    死竹 0.06 0.09 0.18 0.24 0.43 0.65 c***
    2012 活竹 0.20 0.17 0.24 0.19 0.20 0.49 a***
    新竹 0.26 0.19 0.24 0.12 0.19 0.38 b***
    死竹 0.06 0.11 0.23 0.19 0.42 0.63 c***
    2014 活竹 0.20 0.18 0.24 0.19 0.20 0.49 a***
    新竹 0.27 0.20 0.21 0.10 0.22 0.40 b***
    死竹 0.09 0.13 0.20 0.19 0.40 0.60 c***
    说明:**表示不同字母活竹、新竹和死竹在相同年份的大小比数间差异极显著(P<0.01)。

    Table 4.  Statistics of neighborhood comparison of live bamboo, new bamboo and dead bamboo in 2010, 2012 and 2014

  • 计算各大年活竹、新竹、死竹竞争指数,并根据毛竹竞争指数(Ci)的大小,将竞争强度划分成3个等级:Ci≤4,弱度竞争;4<Ci≤8,中度竞争;8<Ci,强度竞争。分析结果见表 5。从表 5可知:新竹处于弱度竞争的频率高于活竹,处于中度竞争和强度竞争的频率低于活竹,平均竞争指数小于活竹,说明新竹中有较多个体在弱竞争环境下生长。而死竹处于强度竞争的频率大于活竹,平均竞争指数也大于活竹,说明在强竞争环境下的毛竹更易死亡。对各大年毛竹活竹、新竹和死竹的竞争指数进行单因素方差分析,结果表明:活竹和新竹无显著差异(P>0.05),而活竹和死竹、新竹和死竹间存在显著差异(P<0.05)。推测原因是新竹在笋期时已经历竞争,保留了较多优势新竹,因此,在整体呈聚集分布的毛竹林中处于有利竞争地位;同时受环境条件影响,部分新竹在弱竞争环境下生长,逐渐加剧这个区域的竞争强度,表现在竞争强度上为无显著差异;而死竹在强竞争环境下,多处于劣势和绝对劣势易被淘汰,表现在竞争指数上为存在显著差异,说明竞争是驱动毛竹更替的重要因素。

    年份 对象竹 竞争强度频率分布 平均竞争指数
    弱度竞争 中度竞争 强度竞争
    2010 活竹 0.10 0.68 0.22 6.57 a
    新竹 0.13 0.65 0.21 6.54 a
    死竹 0.08 0.63 0.29 6.83 b*
    2012 活竹 0.13 0.66 0.21 6.52 a
    新竹 0.17 0.63 0.20 6.46 a
    死竹 0.12 0.65 0.24 6.84 b*
    2014 活竹 0.13 0.66 0.21 6.46 a
    新竹 0.15 0.63 0.21 6.41 a
    死竹 0.12 0.65 0.24 6.66 b*
    说明:*表示不同字母活竹、新竹和死竹在相同年份的竞争强度间差异显著(P < 0.05)。

    Table 5.  Statistics of competition intensity of livel bamboo, new bamboo and dead bamboo in 2010, 2012 and 2014

  • 为确定影响毛竹林更替的主要空间结构因子,对各大年毛竹林新竹和死竹的空间结构指数进行主成分分析。由表 6可知:新竹空间结构指数的第1主成分中最近邻竹株数的因子载荷最大,表明毛竹新竹受最近邻竹的影响最大;最近邻竹株数和角尺度为正载荷,大小比数和竞争指数为负载荷,表明前两者和后两者对毛竹新竹的影响不同,前两者反映毛竹的分布特征,后两者反映毛竹之间的竞争关系。第2主成分中,竞争指数的载荷最大,反映立竹在林分中的竞争强度对毛竹新竹存在重要影响。第3主成分中主要反映了立竹在林分中的生长优势程度对新竹的影响。主成分分析表明:影响新竹生长的空间结构指数重要性排序依次为最近邻竹株数>大小比数>竞争指数>角尺度。

    年份 分量 空间结构指数 贡献率/% 累积贡献率/%
    最近邻竹株数 角尺度 大小比数 竞争指数 特征值
    2010 F1 0.810 0.748 -0.321 -0.366 1.453 36.32 36.32
    F2 0.235 0.396 0.701 0.713 1.212 30.30 66.62
    F3 0.241 -0.261 0.616 -0.540 0.798 19.94 86.57
    F4 0.481 -0.463 -0.160 0.257 0.537 13.44 100.00
    2012 F1 0.830 0.820 -0.204 -0.020 1.403 35.08 35.08
    F2 -0.191 0.015 0.638 0.808 1.096 27.40 62.48
    F3 0.115 -0.286 0.735 -0.547 0.934 23.35 85.83
    F4 0.512 -0.496 -0.111 0.217 0.567 14.18 100.00
    2014 F1 0.827 0.814 -0.122 -0.252 1.425 35.62 35.62
    F2 0.167 0.200 0.797 0.826 1.385 34.64 70.26
    F3 -0.291 0.366 0.450 -0.464 0.636 15.89 86.15
    F4 0.450 -0.405 0.315 -0.297 0.554 13.85 100.00

    Table 6.  Principal component analysis on spatial structure indices of new bamboo in 2010, 2012 and 2014

    分析表 7发现:第1主成分中最近邻竹株数的因子载荷最大,表明毛竹死亡受最近邻竹的影响最大;最近邻竹株数和角尺度为正载荷,大小比数和竞争指数为负载荷,表明前两者和后两者对毛竹死亡的影响不同。第2主成分中,大小比数的载荷最大,反映立竹在林分中的生长优势程度对毛竹死亡存在重要影响。第3主成分中主要反映了竞争强度对毛竹死亡的影响。主成分分析结果表明:影响毛竹死亡的空间结构指数重要性排序依次为最近邻竹株数>大小比数>竞争指数>角尺度。

    年份 分量 空间结构指数 贡献率/% 累积贡献率/%
    最近邻竹株数 角尺度 大小比数 竞争指数 特征值
    2010 F1 0.857 0.822 -0.129 -0.291 1.510 37.75 37.75
    F2 0.139 0.253 0.806 0.769 1.325 33.12 70.87
    F3 -0.129 0.236 -0.565 0.538 0.680 17.01 87.88
    F4 0.480 -0.453 -0.120 0.188 0.485 12.12 100.00
    2012 F1 0.846 0.795 -0.230 -0.306 1.494 37.35 37.35
    F2 0.105 0.348 0.739 0.640 1.088 27.19 64.54
    F3 0.084 0.001 -0.622 0.704 0.889 22.22 86.75
    F4 0.516 -0.497 0.121 0.046 0.530 13.25 100.00
    2014 F1 0.844 0.831 0.160 -0.080 1.435 35.87 35.87
    F2 0.011 -0.087 0.794 0.786 1.255 31.37 67.24
    F3 -0.035 0.206 -0.582 0.598 0.740 18.50 85.74
    F4 -0.535 0.510 0.138 -0.073 0.570 14.26 100.00

    Table 7.  Principal component analysis on spatial structure indices of dead bamboo in 2010, 2012 and 2014

  • 本研究以浙江天目山国家级自然保护区毛竹林为研究对象,利用最近邻竹株数、角尺度、大小比数和竞争指数等4个空间结构指数,研究了空间结构与毛竹林更替的关系,为提高毛竹林经营管理水平提供了参考依据。研究表明:各大年活竹、新竹和死竹的最近邻竹株数均为6株,三者在角尺度上无显著性差异,均具有相对稳定的聚集分布特征。说明虽然毛竹属散生竹,但其繁殖方式是以母竹为中心向周边发笋长出新竹,新竹分布受竹鞭延伸限制,所以呈现聚集分布;但聚集分布会造成毛竹种内竞争和自然死亡,且这种死亡并不改变其聚集分布特征。显然,毛竹林分布格局与其更替存在密切相关。

    在毛竹林经营管理中,应当充分考虑毛竹林更替与空间结构关系,通过砍竹和留笋等措施优化调控毛竹林的空间结构[25, 29],为毛竹林丰产营造最佳密度、胸径和年龄结构[30]。本研究结果提示:为减少毛竹生长过程中的自然损耗,为毛竹生长创造有利条件,应对毛竹林高密度区域进行疏伐(最近邻竹株数>7株);对处于受压状态的毛竹,还应提早采伐;维持毛竹林适当的竞争强度,可避免因种内竞争激烈而导致毛竹减产。毛竹林在生长过程中受多因素的影响,实际上,环境因子如地形因子、土壤因子、植被因子等都影响毛竹林的更替,因此,结合立地条件分析毛竹林空间与更替的关系有待进一步研究。

Reference (30)

Catalog

/

DownLoad:  Full-Size Img  PowerPoint
Return
Return