


-
供给侧结构性改革是以改革带动结构调整,促进全要素生产率增长。农业现代化的重要标志之一是农业全要素生产率(total factor productivity, TFP)不断增长,在生产要素边际报酬递减规律与资源环境的共同约束下,仅依靠要素投入推动农业增长将难以持续,不断提高农业全要素生产率对农业可持续发展尤其重要[1]。理论上在多产出情况下,除了技术进步、技术效率变化和规模效率变化外,混合效率变化也是驱动全要素生产率增长的动力[2]。所谓混合效率是指在投入一定和技术可行的条件下,由于产出混合结构的改变,使得总产出增加或降低,这一过程效率称为混合效率。农业结构调整即改变农业产出结构,使得农业总产出发生改变,从而改变混合效率,进而影响农业全要素生产率增长。农业结构调整受价格机制的影响[3],如果根据资源环境约束和市场需求改变农产品的生产结构,可以形成结构更合理的农产品有效供给,提高农业全要素生产率[4]。1978年以来,中国农业产出结构有较大改变,1978年农业产值占农林牧渔总产值的80.0%,林业占3.4%,畜牧业占15.0%,渔业占1.6%。与1978年相比,2016年农业产值占农林牧渔总产值的比例下降到52.3%,林业比例基本没变为5.7%,畜牧业比例上升到32.9%,渔业比例上升到9.1%(按1990年不变价格计算所得)。然而,农业结构调整是促进还是抑制了农业全要素生产率增长?其影响程度在时空上又是如何变化的?目前已有研究尚未给出明确回答。2010年之前,研究农业全要素生产率增长及其驱动因素所利用的方法主要是基于数据包络分析的曼奎斯特全要素生产率指数法[5-14],但这些研究并未讨论混合效率变化对农业全要素生产率增长的影响。这种方法之所以应用如此广泛,主要是由于它很容易分解[15]。但它存在局限性,未能识别混合效率变化对全要素生产率增长的影响:一是如果规模报酬可变,这时存在混合效率变化对全要素生产率增长的影响,不过这时用它测度与分解全要素生产率增长存在系统偏差[16-17]。二是如果规模报酬不变,用它测算与分解全要素生产率增长才适当,但这时不存在混合效率变化对全要素生产率增长的影响。也就是说,用该方法测度与分解全要素生产率增长,存在着先验假定技术规模报酬不变的缺陷,不能正确识别出混合效率变化这个驱动因素。鉴于此,O’DONNELL[15]通过构造乘积完备全要素生产率指数,提出了全要素生产率指数加总数量框架(aggregate quantity framework),将全要素生产率增长彻底分解成技术进步、技术效率变化、规模效率变化和混合效率变化,从而可以识别混合效率变化对全要素生产率增长的影响。该分解无需先验假定技术规模报酬性质。目前,也有文献利用该框架测度与分解农业全要素生产率增长[18-23],这些研究虽然关注到了混合效率变化这个驱动因素,但没有进一步分析基于产出导向的混合效率变化在农业生产中的实际含义,即没有分析导致农业生产中混合效率变化的原因——农业结构调整。因此,本研究利用该框架重点研究混合效率变化对农业全要素生产率增长的影响,进而评估农业结构调整对农业全要素生产率增长的贡献。
HTML
-
中国农业结构调整的阶段大致划分为以下5个阶段:1979-1984、1985-1991、1992-1997、1998-2003和2004-2016年[3, 24-27]。
1979-1984年:这一阶段结构调整的直接诱因是生产队承担的粮食征购任务太重,农民生产积极性受到严重挫伤[3]。1981年《关于积极发展农村多种经营的报告》提出“决不放松粮食生产,积极发展多种经营”的方针,使粮食、经济作物生产结构合理,让农林牧副渔得到整体推进。1978-1984年,粮食、棉花、油料和肉类产量分别以5.0%、19.3%、14.8%和10.3%的速度递增[24]。这次农业结构调整基本是政府用行政手段要求农民种什么种多少,并未遵循各地区的资源禀赋和比较优势[28]。因此,这一时期的农业结构调整可能会抑制农业全要素生产率增长。
1985-1991年:经过上一时期的农业结构调整,粮棉开始“卖难”[3]。1985年“继续贯彻决不放松粮食生产、积极发展多种经营的方针”,决定支持发展畜牧业、水产养殖业和林业等产业。1986年强调“在调整产业结构中,要正确处理粮食生产和多种经营的关系”[27]。这个时期的农业结构调整仍是政府用强大的行政手段要求农民种什么种多少,而不是通过价格机制引导[28]。因此,这一时期的农业结构调整可能仍不会带来农业全要素生产率增长。
1992-1997年:进入20世纪90年代后,市场需求发生了变化,对优质农产品的需求量增加[25]。为此,1992年《关于发展高产优质高效农业的决定》提出以市场为导向继续调整和不断优化农业生产结构,并明确要求“不论种植业还是林业、畜牧业和水产业,都要把扩大优质产品的生产放在突出地位,并作为结构调整的重点抓紧抓好”[27]。各地按照发展高产优质高效农业的方针,鼓励农民根据市场需求,调整生产结构,发展高附加值农产品[25]。在新的经济环境中,市场机制对农业生产起了决定性作用[29]。因此,这一时期的农业结构调整促进了农业全要素生产率增长。
1998-2003年:1997和1998年农产品价格普遍下滑引发了此次农业结构调整[3]。1999年《关于当前调整农业生产结构的若干意见》提出,农业结构调整的主要内容是调整和优化种植业作物和品种结构,优化区域布局,发展畜牧业和农产品加工业。2000和2002年《关于做好农业和农村经济工作的意见》提出的发展无公害蔬菜和绿色食品,提高农产品质量安全,逐步成为农业结构调整的重要内容[27]。因此,这一时期的农业结构调整可能会进一步促进农业全要素生产率增长。
2004-2016年:2004年开始,恢复粮食生产、提高粮食综合生产能力又成为农业结构调整的重心和基础[27]。2004-2006年都提出,要按照高产、优质、高效、生态、安全的要求,调整优化农业结构。2014年提出确保“谷物基本自给、口粮绝对安全”的国家粮食安全新目标。但粮食价格政策制约了农业结构调整的进程,粮食价格持续高位运行导致农业结构畸形化,2015年开始对粮食价格进行改革,但时机较晚[30]。因此,这一时期的农业结构调整可能会阻碍农业全要素生产率增长。
-
假定Q(qt)、X(xt)为生产单位t期的总产出和总投入,qt∈R+N、qt∈R+M分别为产出和投入向量,则生产单位t期的全要素生产率:Yt=Q(qt)/X(xt)[31]。生产单位s期到t期的全要素生产率指数:Yst=Yt/Ys=Qst/Xst。其中:产出、投入数量指数分别是Qst=Q(qt)/Q(qs)、Xst=X(xt)/X(xs),即全要素生产率指数表示为两者之比。如果加总函数Q(·)和X(·)满足线性齐次、非递减和非负性质,那么全要素生产率指数为乘积完备[15]。
-
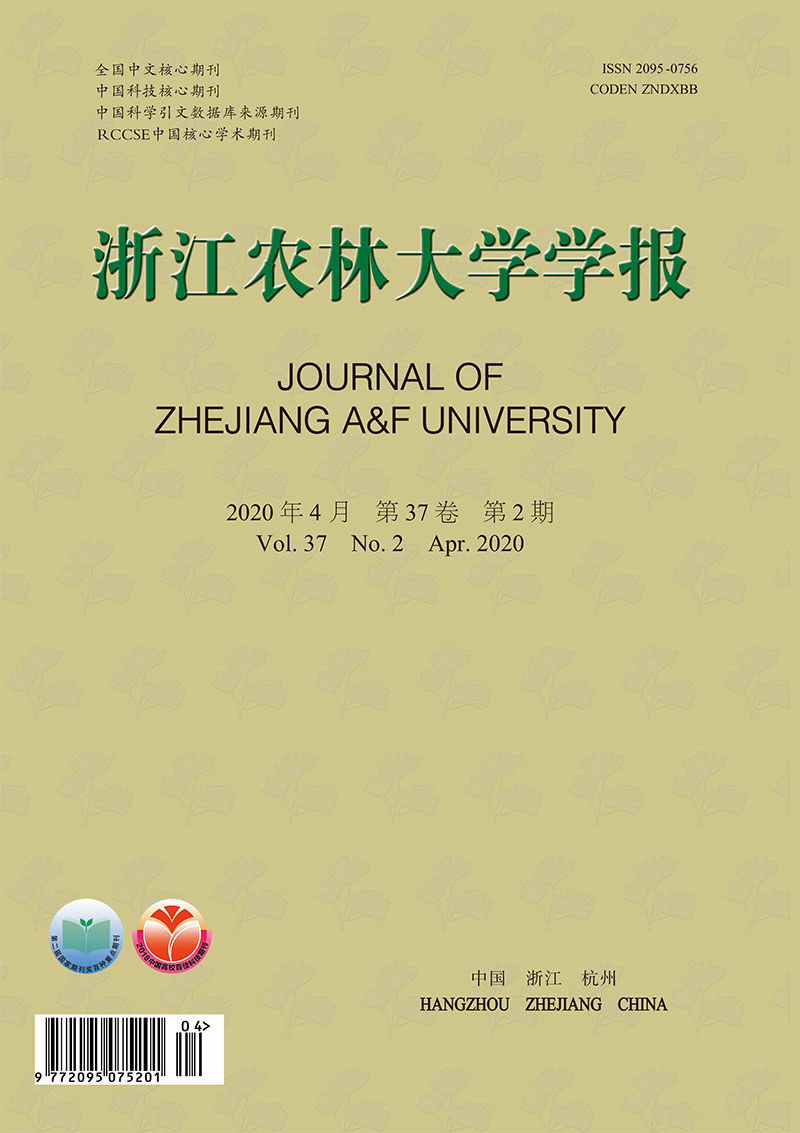
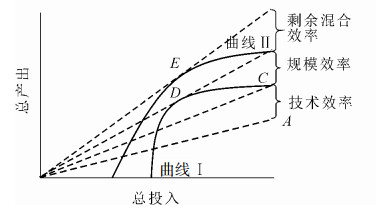
加总数量框架以全要素生产率之比定义以下3个效率[15]。图 1是基于产出导向的效率分解,曲线Ⅰ和曲线Ⅱ分别是产出结构不变、可变的前沿,各条虚线的斜率表示相应的全要素生产率。①技术效率(technical efficiency):A点全要素生产率与C点全要素生产率之比,即为技术效率Tt=A/C。②规模效率(scale efficiency):C点全要素生产率与D点全要素生产率之比,即为规模效率St=C/D。③混合效率(mix efficiency):该效率是本研究关注的重点。如图 2所示:假设仅有2种产出,总产出Q(qt)=a1q1t+a2q2t。其中:曲线为产出组合(q1t,q2t)的生产前沿,虚线是等产出线。①假设产出结构不变,则技术效率Tt等于OA的距离与OD的距离之比。②假设产出结构可变,则混合效率Mt等于OH的距离与OE的距离之比。
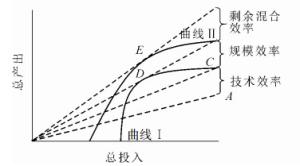
Figure 1. Output-oriented efficiency decomposition
Figure 2. Output-oriented mixing efficiency
在图 1中,D点到E点的全要素生产率变化,即为混合效率,在此分解路径下也称为剩余混合效率(residual mix efficiency):Rt=D/E。图 1的A、D、E意义与图 2一致。
-
t期总效率为A点全要素生产率与E点全要素生产率之比,即:
所以,t期全要素生产率可以表示为:
同理,s期全要素生产率也可表示为:
则生产单位s期与t期全要素生产率之比为全要素生产率指数:
其中:$\frac{{Y_t^*}}{{Y_s^*}}$表示技术进步;$\frac{{{T_t}}}{{{T_s}}} \times \frac{{{S_t}}}{{{S_s}}} \times \frac{{{R_t}}}{{{R_s}}}$表示分解的3个效率变化。
乘积完备的全要素生产率指数还有另外一个分解路径[15]:
其中:$\frac{{{T_l}}}{{{T_s}}} \times \frac{{{K_l}}}{{{K_s}}} \times \frac{{{M_t}}}{{{M_s}}}$是另一分解路下的3个效率变化,$\frac{{{K_t}}}{{{K_s}}}$为剩余规模效率变化,$\frac{{{M_t}}}{{{M_s}}}$为混合效率变化。考虑到乘积完备的全要素生产率指数的2个分解路径,若仅根据一个分解路径测度与分解全要素生产率增长可能存在偏差。因此,本研究将2个分解进行了几何平均。
-
Hicks-Moorsteen全要素生产率指数构建如下:
产出、投入数量指数为$Q_{st}^M = {\left[{\frac{{D_o^t\left( {{x_t}, {q_t}} \right)D_o^s\left( {{x_s}, {q_t}} \right)}}{{D_o^t\left( {{x_t}, {q_s}} \right)D_o^s\left( {{x_s}, {q_s}} \right)}}} \right]^{1/2}}、\quad X_{st}^M = {\left[{\frac{{D_I^t\left( {{x_t}, {q_t}} \right)D_I^s\left( {{x_t}, {q_s}} \right)}}{{D_I^t\left( {{x_s}, {q_t}} \right)D_I^s\left( {{x_s}, {q_s}} \right)}}} \right]^{1/2}}$,Hicks-Moorsteen全要素生产率指数为两者之比:$Y_{st}^{HM} = \frac{{Q_{st}^M}}{{X_{st}^M}} = \left[{\frac{{D_o^t\left( {{x_t}, {q_t}} \right)D_o^s\left( {{x_s}, {q_t}} \right)D_I^t\left( {{x_s}, {q_t}} \right)D_I^s\left( {{x_s}, {q_s}} \right)}}{{D_o^t\left( {{x_t}, {q_s}} \right)D_o^s\left( {{x_s}, {q_s}} \right)D_I^t\left( {{x_t}, {q_t}} \right)D_I^s\left( {{x_t}, {q_s}} \right)}}} \right]$,其中:投入产出加总函数为距离函数D(x, q),该函数满足以下性质:非递减、非负、线性齐次。所以,Hicks-Moorsteen全要素生产率指数是乘积完备的。另外,O’DONNELL[15]证明了曼奎斯特全要素生产率指数是Hicks-Moorsteen全要素生产率指数的特例,曼奎斯特全要素生产率指数不是乘积完备的。
2.1. 乘积完备全要素生产率指数的构建
2.2. 技术效率、规模效率和混合效率

2.3. 乘积完备全要素生产率指数的分解
2.4. 全要素生产率指数的测度
-
4个产出变量分别用农、林、牧、渔总产值表示,并用各自的总产值指数分别平减为1990年不变价格。
-
劳动投入:用农林牧渔业从业人员数表示,由于均无2013-2016年数据,本研究采用指数平滑方法对其进行了预测。土地投入:用农作物总播种面积与水产养殖面积之和表示。机械动力投入:用农业机械总动力表示。化肥投入:用化肥施用量(折纯量)表示。灌溉投入:用有效灌溉面积表示。
-
本研究为1979-2016年中国28个省级地区(不包括港澳台地区)农业投入与产出数据。由于1997年重庆被设立直辖市,1988年海南独立设省,因此,将重庆和海南的数据分别并入四川和广东。考虑西藏特殊的资源禀赋和数据可得性,故样本不含西藏。所有的数据均来自历年《中国农村统计年鉴》《新中国60年统计资料汇编》和《新中国农业60年统计资料汇编》。
3.1. 产出变量
3.2. 投入变量
3.3. 数据来源
-
本研究采用DPIN 3.0S软件分解与测度了中国农业全要素生产率增长。表 1分别从时间和空间2个维度报告了测度与分解结果。
地区 年份 Hicks-Moorsteen TFP指数 混合效率指数 技术进步指数 技术效率指数 规模效率指数 全国 1979-2016 1.037 0.998 1.049 0.997 0.994 1979-1984 1.045 0.996 1.044 1.004 1.001 1985-1991 1.015 0.993 1.049 0.986 0.988 1992-1997 1.042 1.005 1.036 0.997 1.003 1998-2003 1.045 0.999 1.072 0.989 0.986 2004-2016 1.040 0.996 1.046 1.005 0.993 东部地区 1979-2016 1.059 1.004 1.055 1.000 0.999 1979-1984 1.056 1.000 1.054 1.004 0.998 1985-1991 1.055 1.017 1.042 0.996 1.000 1992-1997 1.064 1.019 1.029 1.003 1.012 1998-2003 1.095 1.013 1.068 1.000 1.011 2004-2016 1.043 0.987 1.070 1.000 0.987 东北地区 1979-2016 1.045 0.995 1.054 1.000 0.996 1979-1984 1.067 0.996 1.064 1.000 1.006 1985-1991 1.019 0.956 1.107 0.996 0.967 1992-1997 1.053 1.007 1.050 0.996 1.000 1998-2003 1.039 0.997 1.072 0.998 0.975 2004-2016 1.049 1.009 1.017 1.005 1.017 中部地区 1979-2016 1.020 0.998 1.041 0.995 0.987 1979-1984 1.013 0.987 1.031 1.005 0.990 1985-1991 0.975 0.991 1.038 0.965 0.982 1992-1997 1.050 1.001 1.040 1.019 0.990 1998-2003 1.011 1.010 1.041 0.980 0.981 2004-2016 1.040 1.000 1.047 1.004 0.989 西部地区 1979-2016 1.026 0.993 1.046 0.996 0.992 1979-1984 1.047 0.997 1.037 1.004 1.009 1985-1991 1.003 0.985 1.044 0.988 0.988 1992-1997 1.014 0.995 1.036 0.979 1.004 1998-2003 1.023 0.982 1.095 0.982 0.969 2004-2016 1.036 0.999 1.034 1.011 0.992 东部包括北京、天津、河北、山东、上海、江苏、浙江、福建和广东。东北包括辽宁、吉林、黑龙江。中部包括山西、安徽、江西、河南、湖北和湖南。西部包括广西、内蒙古、四川、贵州、云南、陕西、甘肃、青海、宁夏和新疆。表中指数减1为增长率 Table 1. Measurement and decomposition of agricultural TFP growth in China
-
1979-2016年,中国农业全要素生产率年均增长3.7%,与以往研究的测算结果基本一致[32]。其中混合效率变化年均增长-0.2%,说明混合效率变化在一定程度上抑制了农业全要素生产率增长,即农业结构调整未带来农业全要素生产率增长。技术进步年均增长4.9%,这与尹朝静等[32]测算结果较为接近。技术效率变化年均下降0.3%,规模效率变化年均下降0.6%。
从地区看,东部和东北的农业全要素生产率分别以5.9%和4.5%的年均速度增长,明显高于中部和西部的2.0%和2.6%。各地区混合效率变化年均增长0.4%、-0.5%、-0.2%、-0.7%,意味着只有东部地区混合效率变化使东部地区农业全要素生产率有所增长,即东部地区农业结构调整带来了东部地区农业全要素生产率增长。各地区农业全要素生产率增长主要源于技术进步,年均增长5.5%、5.4%、4.1%、4.6%。
-
农业全要素生产率每年以4.5%增速提升,但混合效率下滑0.4%,也就是说,混合效率变化使农业全要素生产率损失,即农业结构调整尚未提高农业全要素生产率。农业全要素生产率增长主要源于技术进步4.4%,其次是技术效率变化0.4%和规模效率变化0.1%。从地区看,4个地区农业全要素生产率年均增长率分别为5.6%、6.7%、1.3%、4.7%。混合效率变化年均增长0%、-0.4%、-1.3%、-0.3%,混合效率变化没有使各地区农业全要素生产率增长,即各地区农业结构调整尚未推动各地区农业全要素生产率增长。技术进步贡献较大,4个地区年均变化5.4%、6.4%、3.1%、3.7%。
-
从全国看,农业全要素生产率增长较上期有所下降,每年仅有1.5%的增长。混合效率变化-0.7%,说明混合效率变化未使农业全要素生产率提升,农业结构调整未提高农业全要素生产率。此间技术进步是唯一源泉,以每年4.9%增长,而技术效率和规模效率变化以每年1.4%和1.2%下滑。从地区看,4个地区农业全要素生产率年均增长5.5%、1.9%、-2.5%、0.3%。混合效率变化年均增长1.7%、-4.4%、-0.9%、-1.5%,东部明显为正,表明东部地区农业结构调整促使其全要素生产率增长。各地区自技术进步年均增长4.2%、10.7%、3.8%、4.4%。
-
农业全要素生产率以每年4.2%的增长重回高峰,混合效率变化(0.5%)发挥了正影响效应,即农业结构调整推动了农业全要素生产率增长。而技术进步3.6%,规模效率变化0.3%,技术效率变化-0.3%。这可以看出混合效率变化成为第二重要的驱动因素。从地区看,各地区农业全要素生产率年均增长6.4%、5.3%、5.0%、1.4%。各地区混合效率变化年均增长1.9%、0.7%、0.1%、-0.5%,可以看出,除了西部地区混合效率变化阻碍了其农业全要素生产率提升,另外3个地区的混合效率变化都使各自农业全要素生产率提升,也即农业结构调整促使东部、东北、中部地区的农业全要素生产率增长,西部地区的农业结构调整未提升其农业全要素生产率。技术进步年均增长2.9%、5.0%、4.0%、3.6%。
-
从全国看,农业全要素生产率年均增长4.5%。年均混合效率变化-0.1%,未带来农业全要素生产率增长,也就是说,农业结构调整没有促进农业全要素生产率增长。技术进步(7.2%)贡献最大,技术、规模效率变化(-1.1%、-1.4%)处于恶化状态。可见,混合效率变化的负效应最小。从地区上看,农业全要素生产率年均增长东部9.5%、东北3.9%、中部1.1%、西部2.3%。各地区混合效率变化年均增长1.3%、-0.3%、1.0%、-1.8%,这说明各地区混合效率变化差异较大,东部和中部地区混合效率变化在一定程度上促进了其农业全要素生产率增长,也即东部和中部地区农业结构调整推动了其农业全要素生产率增长,而东北和西部地区混合效率变化在一定程度上限制了其农业全要素生产率增长,也即东部和西部地区农业结构调整没有带来其农业全要素生产率提升。技术进步贡献最大,年均6.8%、7.2%、4.1%、9.5%。
-
农业全要素生产率年均增长较快(4.0%),混合效率变化-0.4%,意味着农业结构调整并未带来农业全要素生产率增长。农业全要素生产率提高得益于技术进步4.6%和技术效率变化0.5%,而规模效率变化损失0.7%。从地区看,4个地区农业全要素生产率年均增长4.3%、4.9%、4.0%、3.6%,混合效率变化年均增长-1.3%、0.9%、0%、0.1%,可以看出,东部地区混合效率变化抑制了其农业全要素生产率增长,东北和西部地区的混合效率变化产生了正效应,中部地区混合效率变化对其农业全要素生产率增长无影响,即农业结构调整仅在东北和西部地区推动了其农业全要素生产率增长。各地区技术进步年均增长7.0%、1.7%、4.7%、3.4%。
4.1. 测度与分解结果
4.2. 农业结构调整对中国农业全要素生产率增长的贡献
4.2.1. 1979-1984年
4.2.2. 1985-1991年
4.2.3. 1992-1997年
4.2.4. 1998-2003年
4.2.5. 2004-2016年
-
农业供给侧改革的核心内容是农业结构调整,农业领域降成本、补短板及去产能要依赖于农业结构调整[33]。1978年以来,中国农业结构调整大致经历5个重要时期,那么是否带来农业全要素生产率增长值得研究。结果表明:农业结构调整对农业全要素生产率增长的贡献在时空维度上存在较大差异:从时间上看,仅1992-1997年的混合效率变化使农业全要素生产率得到提升,即该阶段农业结构调整推动了农业全要素生产率增长,而其他时段农业结构调整并没有带来农业全要素生产率增长。从地区上看,仅东部地区混合效率变化给其农业全要素生产率增长贡献了动力,即东部地区农业结构调整推动了东部地区农业全要素生产率增长。
在市场经济条件下,如果农业结构根据农产品价格、资源禀赋进行调整,那么农业结构调整能够促进农业全要素生产率增长。现实中,农民获取价格信息有限、农业资源受到约束,使得农业结构调整未必能带来农业全要素生产率增长。因此,首先应健全信息咨询机构,然后根据地区差异、比较优势调整结构。其次,农业结构调整受价格的调控,在尊重市场价的前提下,政府应依据市场需求结构变动的规律制定导向性的政策,来适当引导农民种植结构的调整。此外,应依据农民经营效益的差异化变动给予相应补贴,保障农民收入。通过结构调整推动农产品由低水平供需平衡迈向高水平供需平衡,并推动农业全要素生产率增长。
 DownLoad: