Volume 38 Issue 4
Aug.  2021
Turn off MathJax
Article Contents

GUO Jianhui, WEI Xinliang, ZHU Jindi, YANG Jingjing, ZHANG Jiyan. Correlation between non-spatial structure distribution characteristics and productivity of natural coniferous and broad-leaved mixed forests in Zhejiang[J]. Journal of Zhejiang A&F University, 2021, 38(4): 682-691. doi: 10.11833/j.issn.2095-0756.20200442
Citation: GUO Jianhui, WEI Xinliang, ZHU Jindi, YANG Jingjing, ZHANG Jiyan. Correlation between non-spatial structure distribution characteristics and productivity of natural coniferous and broad-leaved mixed forests in Zhejiang[J]. Journal of Zhejiang A&F University, 2021, 38(4): 682-691. doi: 10.11833/j.issn.2095-0756.20200442

Correlation between non-spatial structure distribution characteristics and productivity of natural coniferous and broad-leaved mixed forests in Zhejiang

doi: 10.11833/j.issn.2095-0756.20200442
  • Received Date: 2020-07-06
  • Rev Recd Date: 2021-03-18
  • Available Online: 2021-08-09
  • Publish Date: 2021-08-20
  •   Objective  The objective of this study is to explore the distribution characteristics of non-spatial structure and the correlation between non-spatial structure and productivity of coniferous and broad-leaved mixed forests in Zhejiang Province, so as to provide theoretical basis and technical support for improving forest quality.  Method   Based on the data of natural coniferous and broad-leaved mixed forest sample plots and sample wood from the consecutive forest resource inventory in 1999, 2004, and 2009, the diameter at breast height(DBH), tree height, volume, and non-spatial structure factors and accumulation per unit area of conifer species were extracted. Patterns of non-spatial structure distribution in each period was modeled to explore characteristics of change. The continuous function method of biomass conversion factor was used to estimate biomass and productivity, and then the partial correlation analysis between non-spatial structure and productivity was performed.  Result  There existed regular distribution characteristics of forest non-spatial structure factors in different periods. The non-spatial structure factors and productivity showed a positive correlation. From 1999 to 2009, the proportion of coniferous species in the coniferous and broad-leaved mixed forest in Zhejiang Province increased gradually, and the productivity in the first period (1.39 t·hm−2·a−1) was higher than that in the second period (1.15 t·hm−2·a−1). The mean value of DBH, tree height and volume per plant were approximately normal.  Conclusion  In the management of coniferous and broad-leaved mixed forests, priority should be given to the proportion of coniferous and broad-leaved mixed forest in order to maintain the high productivity of the forest stand. The proportion of species should be kept above 50% and the mixed forests with a low proportion of coniferous species should be artificially intervened. If DBH is lower than 10.00 cm, tending should be strengthened, and if DBH is higher than 12.00 cm, cutting should be carried out in time. The average volume and tree height of per plant should be maintained at 0.040−0.070 m3·plant−1 and 7.00−10.00 m respectively. [Ch, 6 fig. 5 tab. 34 ref.]
  • [1] AN Xiaonan, WANG Yunqi, LI Yifan.  Effects of simulated acid rain leaching on the litter decomposition of coniferous broad-leaved mixed forest and evergreen broad-leaved forest in Mount Jinyun . Journal of Zhejiang A&F University, 2022, 39(3): 516-523. doi: 10.11833/j.issn.2095-0756.20210350
    [2] HUANG Jianfeng, TAN Wei, CHAI Zongzheng, CAI Zhaojun.  Spatial structure characteristics and regulation for the Pinus massoniana near-mature forest in the central Guizhou Province, China . Journal of Zhejiang A&F University, 2019, 36(4): 749-756. doi: 10.11833/j.issn.2095-0756.2019.04.015
    [3] CHEN Ting, SHI Yongjun, ZHOU Guomo, ZHENG Zerui, LI Chong.  Interannual variation characteristics for stand structures in the early stages of new moso bamboo carbon sink stands . Journal of Zhejiang A&F University, 2015, 32(2): 181-187. doi: 10.11833/j.issn.2095-0756.2015.02.003
    [4] FAN Peipei, WEI Xinliang, GUO Ruyi, TANG Mengping.  Forest tree spatial characteristics of a coniferous, broad-leaf mixed forest on Mount Tianmu . Journal of Zhejiang A&F University, 2015, 32(5): 675-682. doi: 10.11833/j.issn.2095-0756.2015.05.004
    [5] ZHANG Jiecun, XU Lihua, ZHANG Maozhen, TANG Mengping.  Spatial structure and species diversity with an improved mingling index . Journal of Zhejiang A&F University, 2014, 31(3): 336-342. doi: 10.11833/j.issn.2095-0756.2014.03.002
    [6] GAO Peijun, QIU Yonghua, ZHOU Ziqiu, HE Renhua, XU Jia.  Productivity and photosynthetic ability of Phyllostachys edulis with nitrogen fertilization . Journal of Zhejiang A&F University, 2014, 31(5): 697-703. doi: 10.11833/j.issn.2095-0756.2014.05.006
    [7] WU Aibin, YOU Xianxiang, ZHAO Yanxia, QIN Yanjie, LIU Xin.  Acquisition and analysis spatial structure of Platycladus orientalis plantations based on 3S . Journal of Zhejiang A&F University, 2014, 31(1): 57-63. doi: 10.11833/j.issn.2095-0756.2014.01.009
    [8] WANG Jing, WEI Xinliang, XU Jian, FAN Peipei.  Spatial distribution patterns of a coniferous-broadleaved mixed forest in Mount Tianmu, China . Journal of Zhejiang A&F University, 2014, 31(5): 668-675. doi: 10.11833/j.issn.2095-0756.2014.05.002
    [9] HE Lie-yan, KANG Xin-gang, ZHAO Jun-hui, GAO Yan, FENG Qi-xiang.  Diameter class diversity indices for spruce-fir conifer and broadleaf mixed stands in the Changbai Mountains . Journal of Zhejiang A&F University, 2011, 28(3): 432-438. doi: 10.11833/j.issn.2095-0756.2011.03.013
    [10] XIN Ying-ying, WEI Xin-liang.  Dominance in a mixed conifer and broadleaved forest of Qingshan Lake, Zhejiang . Journal of Zhejiang A&F University, 2011, 28(4): 601-606. doi: 10.11833/j.issn.2095-0756.2011.04.013
    [11] YU Bao, ZHANG Qiu-liang, WANG Li-ming, WU Jisiguleng.  Characteristics of biomass and productivity in Larix gmelinii natural forests with different stand structures . Journal of Zhejiang A&F University, 2011, 28(1): 52-58. doi: 10.11833/j.issn.2095-0756.2011.01.009
    [12] AI Xun-ru, YI Yong-mei, YAO Lan, WANG Bo-quan, XIONG Biao.  Effects of human disturbance on species diversity of Pinus massoniana-Cunninghamia lanceolata mixed forest in Suobuya Stone Forest . Journal of Zhejiang A&F University, 2010, 27(2): 178-184. doi: 10.11833/j.issn.2095-0756.2010.02.003
    [13] ZHANG Xiao-peng, YIN You, YU Li-zhong, YAO Li-hai, YING Hui, ZHANG Na.  Influence of water and soil nutrients on biomass and productivity of fine tree roots:a review . Journal of Zhejiang A&F University, 2010, 27(4): 606-613. doi: 10.11833/j.issn.2095-0756.2010.04.022
    [14] LI Yi-qiu, FENG Zhong-ke.  Non-quidistance gray mode forecast of forest resource dynamic changes in Shandong Province . Journal of Zhejiang A&F University, 2009, 26(1): 7-12.
    [15] HE Ying,  WEI Xin-liang,  CAI Xia,  LI Ke-zhui,  WANG Zhen.  Quantitative analysis of community structure in ecological landscape forests . Journal of Zhejiang A&F University, 2007, 24(6): 711-718.
    [16] WEN Zuo-wu.  Comparison of productivity between first and second rotation stands of Pinus massoniana planted in different densities . Journal of Zhejiang A&F University, 2004, 21(1): 22-27.
    [17] YU Yi-wu, WU Jia-sen, JIANG Pei-kun, WU Xiao-hong.  Analysis on nutrient elements in litter under different forests in Huzhou City . Journal of Zhejiang A&F University, 2002, 19(2): 153-156.
    [18] XIE Jin-sheng, HUANG Rong-zhen, CHEN Yin-xiu, YANG Yu-sheng, WANG Wei-ming.  Change of biomass and productivity of Pinus massoniana community after closing of hillsides and management in serious eroded red soil . Journal of Zhejiang A&F University, 2001, 18(4): 354-358.
    [19] QIAN Guo-qin.  Productivity and ecological characteristics of mixed forest of Chinese sweet gum and Chinese fir . Journal of Zhejiang A&F University, 2000, 17(3): 289-293.
    [20] FU Jun, QIAN Teng, HUANG Rong-Lai.  Multi-clone admixture planting of Carolina poplar in protective belt along the Changjiang River . Journal of Zhejiang A&F University, 1999, 16(4): 346-352.
  • [1]
    BARUFFOL M, SCHMID B, BRUELHEIDE H, et al. Biodiversity promotes tree growth during succession in subtropical forest[J]. PLoS One, 2013, 8(11): e81246. doi: 10.1371/journal.pone.0081246.
    [2]
    FORRESTER D I, KOHNLE U, ALBRECHT A T, et al. Complementarity in mixed-species stands of Abies alba and Picea abies varies with climate, site quality and stand density [J]. For Ecol Manage, 2013, 304: 233 − 242.
    [3]
    ZHANG Yu, CHEN Y H C. Individual size inequality links forest diversity and above-ground biomass [J]. J Ecol, 2015, 103: 1245 − 1252.
    [4]
    PRETZSCH H, del RÍO M, AMMER C, et al. Growth and yield of mixed versus pure stands of Scots pine (Pinus sylvestris L.) and European beech (Fagus sylvatica L.) analysed along a productivity gradient through Europe [J]. Eur J For Res, 2015, 134(5): 927 − 947.
    [5]
    MAN Rongzhou, LIEFFERS V J. Are mixtures of aspen and white spruce more productive than single species stands? [J]. For Chronicle, 1998, 75(3): 505 − 513.
    [6]
    ANYOMI K A, RAULIER F, BERGERON Y, et al. The predominance of stand composition and structure over direct climatic and site effects in explaining aspen (Populus tremuloides Michaux) site index within boreal and temperate forests of western Quebec, Canada [J]. For Ecol Manage, 2013, 302: 390 − 403.
    [7]
    ANYOMI K A, RAULIER F, BERGERON Y, et al. Spatial and temporal heterogeneity of forest site productivity drivers: a case study within the eastern boreal forests of Canada [J]. Landscape Ecol, 2014, 29(5): 905 − 918.
    [8]
    PUKKALA T, LÄHDE E, LAIHO O. Species interactions in the dynamics of even-and uneven-aged boreal forests [J]. J Sustainable For, 2013, 32(4): 371 − 403.
    [9]
    PERI T, KORHONEN K, SAIRANEN A. Occurrence of, heterobasidion annosum, in pure and mixed spruce stands in Southern Finland [J]. Scandinavian J For Res, 1990, 5(1/4): 113 − 125.
    [10]
    MÖYKKYNEN T, PUKKALA T. Optimizing the management of Norway spruce and scots pine mixtures on a site infected by Heterobasidion coll [J]. Scandinavian J For Res, 2010, 25(2): 127 − 137.
    [11]
    GRIESS V C, ACEVEDO-CABRA R, HÄRTL F, et al. Does mixing tree species enhance stand resistance against natural hazards? a case study for spruce [J]. For Ecol Manage, 2012, 267(3): 284 − 296.
    [12]
    JACTEL H, BAUHUS J, BOBERG J, et al. Tree diversity drives forest stand resistance to natural disturbances [J]. Curr For Rep, 2017, 3(3): 223 − 243.
    [14]
    ZHANG Zhihua. Research of Forest Structure and Carbon Storage of Coniferous and Broad-leaved Mixed Forest in Tianmu Mountain[D]. Hangzhou: Zhejiang A&F University, 2012.
    [15]
    JIANG Jun. Study on Structural Dynamic and Silvicultural System of Conifer-broadleaved Mixed Plantation in Southern Tropical Montane Region[D]. Beijing: Chinese Academy of Forestry, 2015.
    [16]
    DONG Xibin, LI Yaoxiang, JIANG Lichun. The effects of thinning on stand structure for larch plantation [J]. J Northeast For Univ, 2000, 28(1): 16 − 18.
    [17]
    GUO Mengzhao, GAO Lushuang, FAN Chunyu. Research progress on species diversity and productivity [J]. World For Res, 2019, 32(3): 18 − 23.
    [18]
    FANG Jingyun, CHEN Anping, ZHAO Shuqing, et al. Estimating biomass carbon of China’s forests: supplementary notes on report published in Science (291: 2320−2322) by FANG et al. (2001) [J]. Chin J Plant Ecol, 2002, 26(2): 243 − 249.
    [19]
    PETERSON D L, WARING R H. Overview of the oregon transect ecosystem research project [J]. Ecol Appl, 1994, 4(2): 211 − 225.
    [20]
    FANG Jingyun, CHEN Anping, PENG Changhui, et al. Changes in forest biomass carbon storage in China between 1949 and 1998 [J]. Science, 2001, 292(5525): 2320 − 2322.
    [21]
    ZHANG Maozhen, WANG Guangxing, LIU Anxing. Estimation of forest biomass and net primary production for Zhejiang Province based on continuous forest resources inventory [J]. Sci Silv Sin, 2009, 45(9): 13 − 17.
    [22]
    WANG Yanfang, LIU Ling, SHANGGUAN Zhouping. Dynamics of forest biomass carbon stocks from 1949 to 2008 in Henan Province, east-central China [J]. J For Res, 2018, 29(2): 439 − 448.
    [23]
    LIU Enbin, SHI Yongjun, LI Yongfu, et al. Non Spatial Structural Characteristic of Moso Bamboo Forest and Its Dynamcs in Zhejiang Province [J]. Sci Silv Sin, 2013, 49(9): 1 − 7.
    [24]
    JIN Xingji, LI Fengri, JIA Weiwei, et al. Modeling and predicting bivariate distributions of tree diameter and height [J]. Sci Silv Sin, 2013, 49(6): 74 − 82.
    [25]
    ZHENG Lifeng, ZHOU Xinnian. Diameter distribution of trees in natural stands managed on polycyclic cutting system [J]. For Stud China, 2010, 12(1): 21 − 25.
    [26]
    WANG Lanfang, WEI Xinliang, TANG Mengping. Geographical elifferentiation characteristics influencing procluctivity of Cunninghamia lanceolata forests in Zhejiang Province[J]. J Zhejiang A&F Univ, 2019, 36(6): 1107 − 1114.
    [27]
    WANG Yanfang, LIU Ling, YUE Feixue, et al. Forest aboveground carbon storage with the Grain for Green Program in Heran Province[J]. J Zhejiang A&F Univ, 2019, 36(3): 507 − 514.
    [28]
    LU Yuanchang, LEI Xiangdong, JIAN Lei. A new function for modeling diameter frequency distribution in the tropical rain forest of Xishuangbanna, Southwest of China [J]. For Stud China, 2003, 5(2): 1 − 6.
    [29]
    KUDUS A K, AHMAD M I, LAPONGAN J. Nonlinear regression approach to estimating Johnson SB parameters for diameter data [J]. Can J For Res, 1999, 29(3): 310 − 314.
    [30]
    LIU Chuangmin, ZHANG Lianjun, DAVIS C J, et al. A finite mixture model for characterizing the diameter distributions of mixed-species forest stands [J]. For Sci, 2002, 48(4): 653 − 661.
    [31]
    GU Wangming, LU Zeyang, HUANG Chunliang, et al. Screening study of fire resistant tree species in Jianshui County, Yunnan Province [J]. J Beijing For Univ, 2020, 42(2): 49 − 60.
    [32]
    IDE J, KUME T, WAKIYAMA Y, et al. Estimation of annual suspended sediment yield from a Japanese cypress (Chamaecyparis obtusa) plantation considering antecedent rainfalls [J]. For Ecol Manage, 2009, 257(9): 1955 − 1965.
    [33]
    PENG Wei, DONG Lihu, LI Fengri. Carbon storage of forest vegetation and allocation for main forest types in the east of Daxing’an Mountains based on additive biomass model [J]. Chin J Appl Ecol, 2016, 27(12): 3749 − 3758.
    [34]
    WANG Lanfang. Study on the Geographical Differentiation Characteristics of Main Forest Types Productivity in Zhejiang[D]. Hangzhou: Zhejiang A&F University, 2019.
  • 加载中
通讯作者: 陈斌, bchen63@163.com
  • 1. 

    沈阳化工大学材料科学与工程学院 沈阳 110142

  1. 本站搜索
  2. 百度学术搜索
  3. 万方数据库搜索
  4. CNKI搜索

Figures(6)  / Tables(5)

Article views(1188) PDF downloads(65) Cited by()

Related
Proportional views

Correlation between non-spatial structure distribution characteristics and productivity of natural coniferous and broad-leaved mixed forests in Zhejiang

doi: 10.11833/j.issn.2095-0756.20200442

Abstract:   Objective  The objective of this study is to explore the distribution characteristics of non-spatial structure and the correlation between non-spatial structure and productivity of coniferous and broad-leaved mixed forests in Zhejiang Province, so as to provide theoretical basis and technical support for improving forest quality.  Method   Based on the data of natural coniferous and broad-leaved mixed forest sample plots and sample wood from the consecutive forest resource inventory in 1999, 2004, and 2009, the diameter at breast height(DBH), tree height, volume, and non-spatial structure factors and accumulation per unit area of conifer species were extracted. Patterns of non-spatial structure distribution in each period was modeled to explore characteristics of change. The continuous function method of biomass conversion factor was used to estimate biomass and productivity, and then the partial correlation analysis between non-spatial structure and productivity was performed.  Result  There existed regular distribution characteristics of forest non-spatial structure factors in different periods. The non-spatial structure factors and productivity showed a positive correlation. From 1999 to 2009, the proportion of coniferous species in the coniferous and broad-leaved mixed forest in Zhejiang Province increased gradually, and the productivity in the first period (1.39 t·hm−2·a−1) was higher than that in the second period (1.15 t·hm−2·a−1). The mean value of DBH, tree height and volume per plant were approximately normal.  Conclusion  In the management of coniferous and broad-leaved mixed forests, priority should be given to the proportion of coniferous and broad-leaved mixed forest in order to maintain the high productivity of the forest stand. The proportion of species should be kept above 50% and the mixed forests with a low proportion of coniferous species should be artificially intervened. If DBH is lower than 10.00 cm, tending should be strengthened, and if DBH is higher than 12.00 cm, cutting should be carried out in time. The average volume and tree height of per plant should be maintained at 0.040−0.070 m3·plant−1 and 7.00−10.00 m respectively. [Ch, 6 fig. 5 tab. 34 ref.]

GUO Jianhui, WEI Xinliang, ZHU Jindi, YANG Jingjing, ZHANG Jiyan. Correlation between non-spatial structure distribution characteristics and productivity of natural coniferous and broad-leaved mixed forests in Zhejiang[J]. Journal of Zhejiang A&F University, 2021, 38(4): 682-691. doi: 10.11833/j.issn.2095-0756.20200442
Citation: GUO Jianhui, WEI Xinliang, ZHU Jindi, YANG Jingjing, ZHANG Jiyan. Correlation between non-spatial structure distribution characteristics and productivity of natural coniferous and broad-leaved mixed forests in Zhejiang[J]. Journal of Zhejiang A&F University, 2021, 38(4): 682-691. doi: 10.11833/j.issn.2095-0756.20200442
  • 森林是具有自我生长调节能力的生态系统,其结构(例如林分密度、年龄和树木大小)影响森林的生物量和生产力[1-3]。森林生物量是整个森林生态系统运行的能量基础和营养物质来源,是研究生物生产力、净第一性生产力、碳循环等问题的基础。森林生产力一直是森林生态系统研究的核心内容之一,不仅反映了森林生长的水平和质量,也是森林与环境关联的具体体现。研究表明:针阔混交林可能会提高森林生产力[4-5];由于阔叶树种可提高林地的肥力[5-7],通常会改善针阔混交林中针叶树的生长[5, 8];树种混交改善了林分健康状况[9-10],并降低了林分的生物脆弱性和非生物风险[11-12]。MAN等[5]和PRETZSCH等[4]研究了这种作用的机制,认为针阔混交林比纯林更具研究价值。森林的非空间结构包括树种组成、胸径组成、树高结构、冠幅结构和年龄结构等因子。林木个体的胸径、树高和材积结构是反映森林结构的重要指标。不论是人工林还是天然林,在未遭受到严重干扰的情况下,林分内部的特征因子都表现一定的分布状态和较为稳定的结构规律[13]。目前,针对胸径、树高结构的研究居多,对材积结构的研究匮乏,且多为同期的胸径、树高分布状态,缺乏多期数据进行佐证研究结果[14-16]。国内外学者对森林非空间结构与生产力的相关研究多集中于林分密度、多样性[17]或是比较纯林和混交林不同的非空间结构下生产力的差异,极少对非空间结构分布特征进行归纳总结,以及与生产力两者的相关性进行研究,尤其是为保持林分高生产力,非空间结构因子应满足何种定量条件的探索更少。本研究在掌握非空间结构分布特征的基础上,寻求非空间结构与生产力间的定量关系,可为森林的经营管理和生产力提高提供技术支持和理论依据。

  • 浙江省位于中国东南部沿海的亚热带地区,地理坐标为27°06′~31°11′N,118°01′~123°10′E,总体地势格局西南高东北低,呈阶梯下降;海拔最高达1 929 m。研究区域属亚热带季风气候,光照较多,雨量丰沛,年平均气温15.0~18.0 ℃。全省滩涂资源面积为1 952.6 km2。有沿海岛屿3 000余个,占全国岛屿总数的40%。向来有“七山一水二分田”的说法。

    浙江省全省土壤以丘陵山地红壤、黄壤等地带性土壤和海岛饱和红壤为主;森林类型主要有针叶林、针阔混交林、常绿阔叶林、常绿落叶阔叶混交林等,其中针阔混交林面积为70.10 万hm2,占11.5%;蓄积为5 564.40 万m3,占14.4%。针阔混交林比例明显偏低。

  • 以研究区1999、2004和2009年共3期森林资源连续清查数据作为基础数据(包含样地数据和样木数据)。样地采用28.28 m×28.28 m的正方形,面积0.08 hm2,样地间距4 km×6 km,各期按统一的主要技术标准进行调查。样地数据主要有样地号、横纵坐标、海拔、坡度、优势树种、活立木蓄积等因子,样木数据主要有立木类型、检尺类型、树种和胸径等因子。

    3期森林资源连续清查数据均以浙江省行政范围为1个总体,按95%可靠性,以活立木蓄积精度达90%以上,森林面积精度达95%以上,人工林面积精度达90%以上,固定样地复位率达98%以上,固定样木复位率达95%以上进行总体抽样。

    在森林资源连续清查的外业调查样木树种中,记载了树种或树种组的代码。调查中记载的优势树种,依据《国家森林资源连续清查浙江省第7次复查技术操作细则》,以调查样地中该树种蓄积占样地总蓄积65%以上来确定。幼龄林无蓄积或主要树种蓄积很少时,依主要树种确定;如树种很多,分不清优势时,将多个生物学特性和生态学特性相近的树种合并为树种组记载。

  • ①数据筛选。提取研究区内1999、2004和2009年3期森林资源连续清查数据中的样地数据。在各期样地数据中,以“优势树种+森林起源”组合代码为条件,筛选获得天然针阔混交林样地。在样地中,对样木数据进行检查核对,将样木数据中同一树种代码转换为具体的、相同的树种名称。②样地检核。对经筛选后获得的天然针阔混交林样地,根据3期各个样地的横纵坐标地理位置,对期初和期末在同一地理位置的样地进行检核。1999年95个样地,2004年127个样地,2009年127样地。同一样地前后森林资源连续清查的时间间隔为5 a。根据样地的全球定位系统经纬度坐标,在ArcGIS软件中,导入研究区域图层,得到研究区的样地分布情况。

  • 统计3个时期样地中各树种株数占比,探究1999−2009年浙江省针阔混交林各时期针叶树种组成比例情况。

  • 选择平均胸径、平均树高、平均单株材积统计每个样地的平均水平。

    式(1)中:$\overline D$为胸径均值(cm),Di为第i个样地的胸径均值(cm),n为样地数量(个)。

    式(2)中:$ \overline H $为树高均值(m),Hi为第i个样地的树高均值(m),n为样地数量(个)。

    式(3)中:$ \overline V$为单株材积均值(m3·株−1),Vi为第i个样地的材积均值(m3·株−1),n为样地数量(个)。将单株材积共划分为11个级别:从0开始,隔0.02 m3·株−1分为1个级别,0.20 m3·株−1以上的统一划分为1个级别。胸径(cm)和树高(m)取整数。统计所有样地胸径、树高和单株材积级别均值相同的样地比例。在MATLAB中根据比例分布的柱状图,采用幂律分布、韦伯分布、傅里叶分布、高斯函数分布等分别对各时期胸径、树高和单株材积进行最优概率密度曲线拟合。采用R2检验模型的拟合度。由此拟合出最适的各时期胸径、树高和材积的分布形态图,根据函数曲线的特征描述分布形态。

  • 采用方精云等[18]提出的生物量换算因子连续函数法,对1999−2009年的每次调查数据进行生产力的估算,每相邻2次调查为1期数据(1999−2004年为第1期,2004−2009年为第2期),共2期,计算各期森林每年每公顷产生的生物量,作为生产力估测值;以复位样地的活立木蓄积为基础,计算各样地2次调查的单位面积蓄积之差作为各期的单位面积蓄积增长量;通过换算因子将蓄积量转换为生物量,以此作为生产力。在已知森林蓄积的情况下[19]

    式(4)中:B为单位面积生物量(t·hm−2),V为单位面积蓄积量(m3·hm−2),αβ为参数,α=0.714,β=16.915[20]。本研究采用修正式[21]

    式(5)中:$ {\rm{\Delta }}B $为生产力,α为生物量转换参数1;V1为前一期调查样地单位面积蓄积量(m3·hm−2);V2为后一期调查样地单位面积蓄积量(m3·hm−2);${{\rm{\Delta }}n}$为2期数据调查的间隔期(a);$ \left( {{V_{\rm{c}}} + {V_{\rm{d}}}} \right){\left( {1 + p} \right)^{{\rm{\Delta }}m}}$${\Delta }n$年内的未测生长量(按${\Delta }m$年计算)的单位面积消耗量;其中${\Delta }m$为采伐木和枯损木从最后一次调查到被采伐或枯损时所经历的时间(a),取${\Delta }m={\Delta }n/2$VcVd分别为间隔期$ {\Delta }n$年内单位面积采伐和枯损蓄积;p为年平均生长率,如式(6)所示。

    绘制各时期的生物量、生产力柱状图以描述总体情况。

  • 森林非空间结构主要包括胸径、树高、材积和树种组成。其中树种组成以针叶树种比例为指标进行分析。分别计算不同胸径、树高、材积和树种组成所对应的生产力,用散点图加以描述,反映生产力在森林非空间结构各指标的分布规律。

    在SPSS软件中对生产力随胸径、树高、单株材积、针叶树种比例等的变化进行偏相关分析,得出生产力与胸径、树高、材积和针叶树种比例等的相关性。

  • 表1表明:1999−2009年浙江省针阔混交林中针叶树种比例逐年下降,其中,马尾松Pinus massoniana所占比例从31%降到17%,杉木Cunninghamia lanceolata所占比例基本维持在20%左右;针叶树种所占比例从50%降到37%。阔叶树种比例逐年上升。其中,栎类Quercus所占比例从8%升至20%,木荷Schima superba所占比例从0%升至24%,其他硬阔类树种从37%降到9%,软阔叶类树种维持在3%~6%的低占比状态,阔叶树种所占比例从49%升至56%。该时期的针阔混交林中出现阔叶树种比例增多的趋势,其中栎类和木荷为主要增多的阔叶树种。

    年份针阔混交林主要树种比例/%
    马尾松杉木栎类木荷其他硬阔类其他软阔类其他
    19993119 8 03732
    2004252212131567
    200917202024 937

    Table 1.  Proportion change of main tree species of coniferous and broad-leaved mixed forest in Zhejiang Province from 1999 to 2009

  • 胸径分布形态。森林群落中林木的胸径结构及其分布形态是反映群落结构的重要指标。各时期的胸径分布形态见图1。经统计拟合,得到浙江省针阔混交林各时期胸径分布最符合的均是高斯分布,其最优拟合函数模型见表2

    Figure 1.  Chest diameter distribution at different periods

    年份函数模型R2顶点胸径值/cm
    1999${ y = 0.241\;2{{\rm{e}}^{ - {{\left( {\tfrac{{x - 9.183}}{{2.355}}} \right)}^2}}}}$0.666 0* 9.183
    2004${y = 0.324\;3{{\rm{e}}^{ - {{\left( {\tfrac{{x - 8.264}}{{1.495}}} \right)}^2}}}}$0.850 5**8.264
    2009${y = 0.266\;0{ {\rm{e} }^{ - { {\left( {\tfrac{ {x - 8.880} }{ {2.068} } } \right)}^2} } } }$0.880 7**8.880
      说明:*P<0.05;** P<0.01。y表示概率,x表示胸径

    Table 2.  Best fitting function model of DBH distribution in different periods

    图1表2可知:随着针阔混交林的生长发育,各时期的胸径分布形态均呈近似正态分布,高斯分布模型的顶点胸径值先减小后增大。在95%的置信区间里,1999年的胸径为[6.22,12.13] cm,2004年的胸径为[6.21,10.31] cm,2009年的胸径为[6.21,11.55] cm。各时期胸径范围区间上限和区间的范围都出现了先减小后增大的趋势,说明1999−2009年针阔混交林的胸径范围和范围上限都是先减小后增大,胸径范围下限基本不变。

    树高分布形态。群落树高结构反映个体在垂直空间分布状况,也是群落发展的重要表征之一。各时期的树高分布形态如图2。经统计拟合,得到浙江省针阔混交林各时期树高分布最符合的是高斯分布,其最优拟合函数模型见表3

    Figure 2.  Tree height distribution in different periods

    年份函数模型R2顶点树高值/m
    1999${ y = 0.218\;5{ {\rm{e} }^{ - { {\left( {\tfrac{ { x - 6.581} }{ {2.558} } } \right)}^2} } }{\rm{} } }$0.817 0**6.58 1
    2004${ y= 0.222\;9{ {\rm{e} }^{ - { {\left( {\tfrac{ { x - 6.927} }{ {2.472} } } \right)}^2} } } }$0.950 8**6.92 7
    2009${ y = 0.244\;7{ {\rm{e} }^{ - { {\left( {\tfrac{ { x - 7.661} }{ {2.153} } } \right)}^2} } } }$0.937 2**7.66 1
      说明:*P<0.05;** P<0.01。y表示概率,x表示树高

    Table 3.  Optimal fitting function model of tree height distribution in different periods

    表3图2可知:随着针阔混交林的生长发育,各时期的树高分布形态均呈近似正态分布。各时期高斯分布模型的顶点树高值不断增大。在95%的置信区间里,1999年的树高为[3.48,9.69] m,2004年的树高为[3.90,9.95] m,2009年的树高为[4.95,10.37] m。各时期树高范围区间上下限和区间的范围都在增大,说明1999−2009年针阔混交林,树高的范围和树高的高度都在逐年增大。

    各时期的单株材积等级分布形态如图3。经统计拟合,得到浙江省针阔混交林各时期材积分布最符合的是高斯分布,其最优拟合函数模型见表4

    Figure 3.  Volume distribution of different periods

    年份函数模型R2顶点材积值/(m·株−1)
    1999${ y = 0.496\;6{ {\rm{e} }^{ - { {\left( {\tfrac{ {x - 1.992} }{ {1.010} } } \right)}^2} } } }$0.973 9**0.040
    2004${ y = 0.421\;2{{\rm{e}}^{ - {{\left( {\tfrac{{x - 1.884}}{{1.348}}} \right)}^2}}}}$0.992 9**0.037
    2009${ y = 0.476\;6{{\rm{e}}^{ - {{\left( {\tfrac{{x - 1.908}}{{1.074}}} \right)}^2}}}}$0.939 5**0.038
      说明:*P<0.05;** P<0.01。y表示概率,x表示材积

    Table 4.  Best fitting function model of volume distribution in different periods

    图3表4可知:随着针阔混交林的生长发育,各时期的材积等级分布形态均呈左偏正态分布。各时期高斯分布的顶点材积值变化不大,从1999年的0.040 m3·株−1减小到2004年的0.037 m3·株−1,再增加到2009年的0.038 m3·株−1。在95%的置信区间里,1999年的材积为(0,0.070] m3·株−1,2004年的材积为(0,0.077] m3·株−1,2009年的材积为(0,0.070] m3·株−1。各时期材积的范围上限和范围大小基本稳定在0.070 m3·株−1,说明1999−2009年针阔混交林材积范围和上限基本不变。

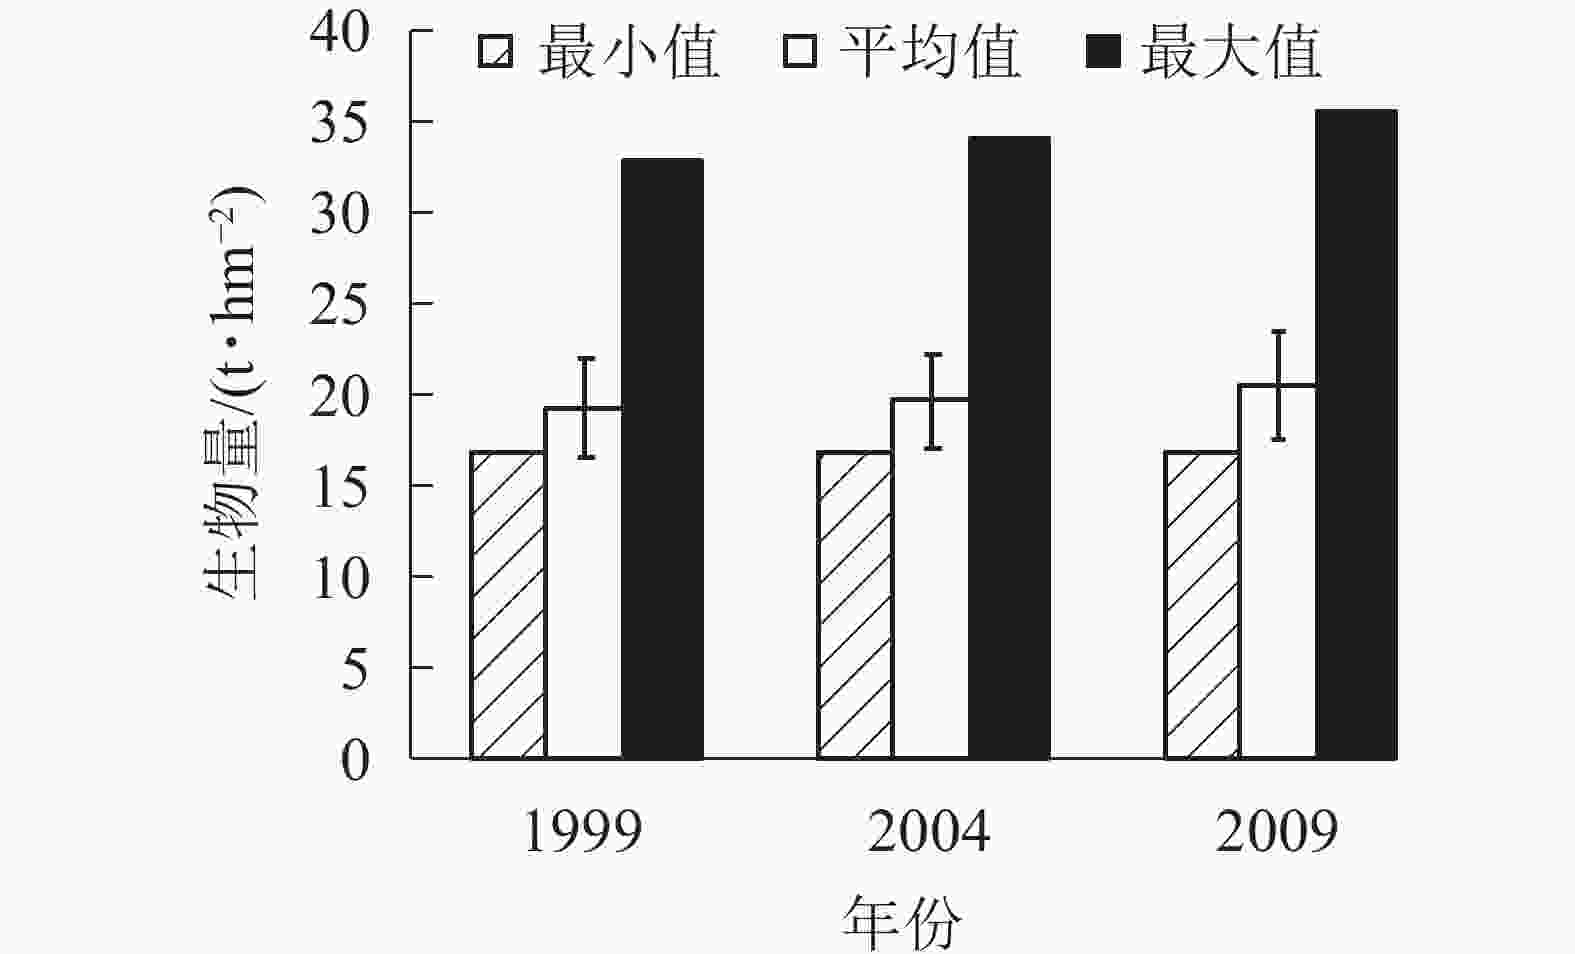
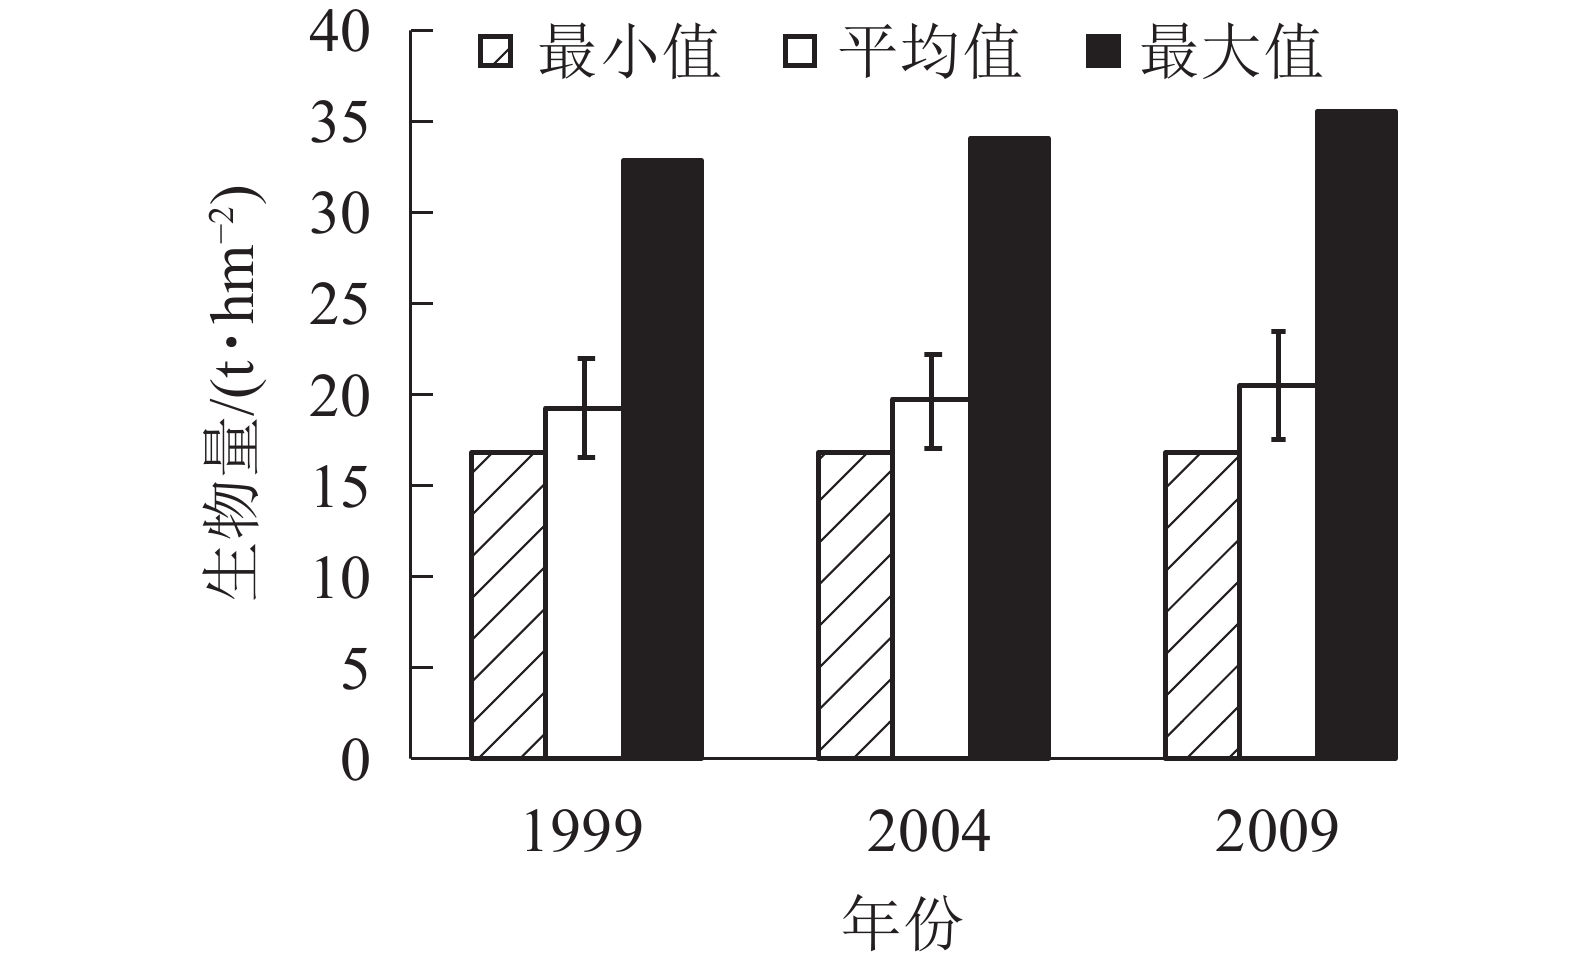
  • 图4可知:3个时期生物量的最小值基本在17.00 t·hm−2。平均生物量从1999年的19.42 t·hm−2增加到2004年的19.74 t·hm−2,再增加到2009年的20.57 t·hm−2。各时期的生物量最大值也是从1999年的32.97 t·hm−2增加到2004年的34.16 t·hm−2,再增加到2009年的35.66 t·hm−2,说明1999−2009年,生物量呈逐年上升的趋势。各时期的平均生物量虽然呈上升趋势,但总体上升幅度不大,在2%左右。

    Figure 4.  Biomass of coniferous and broad-leaved mixed forest in different periods

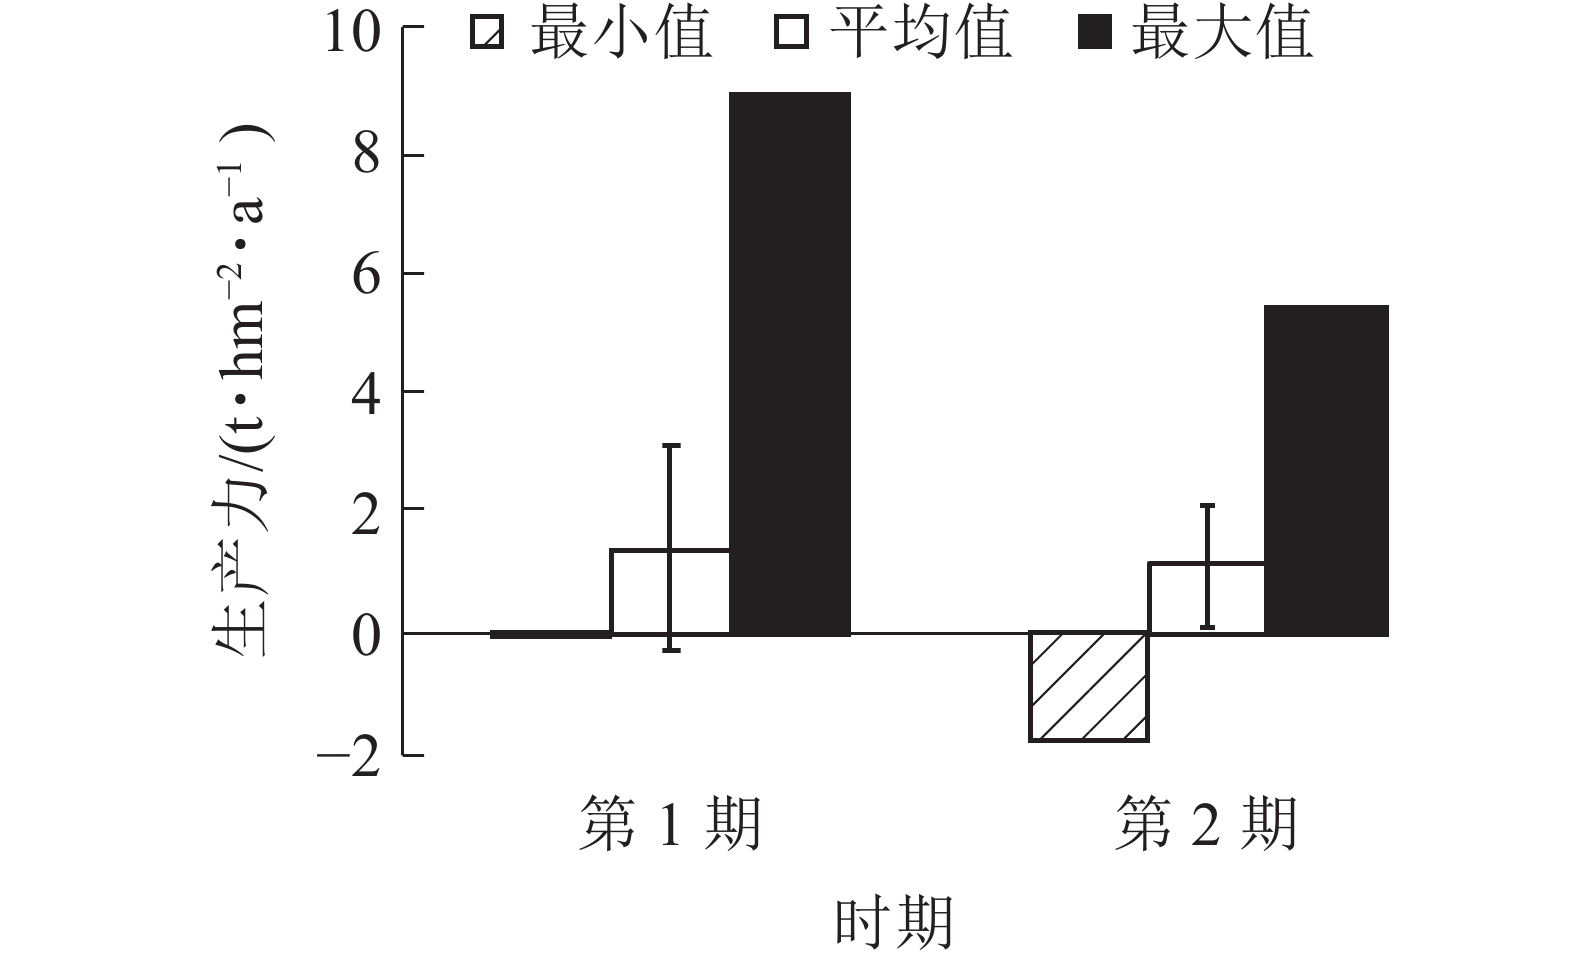
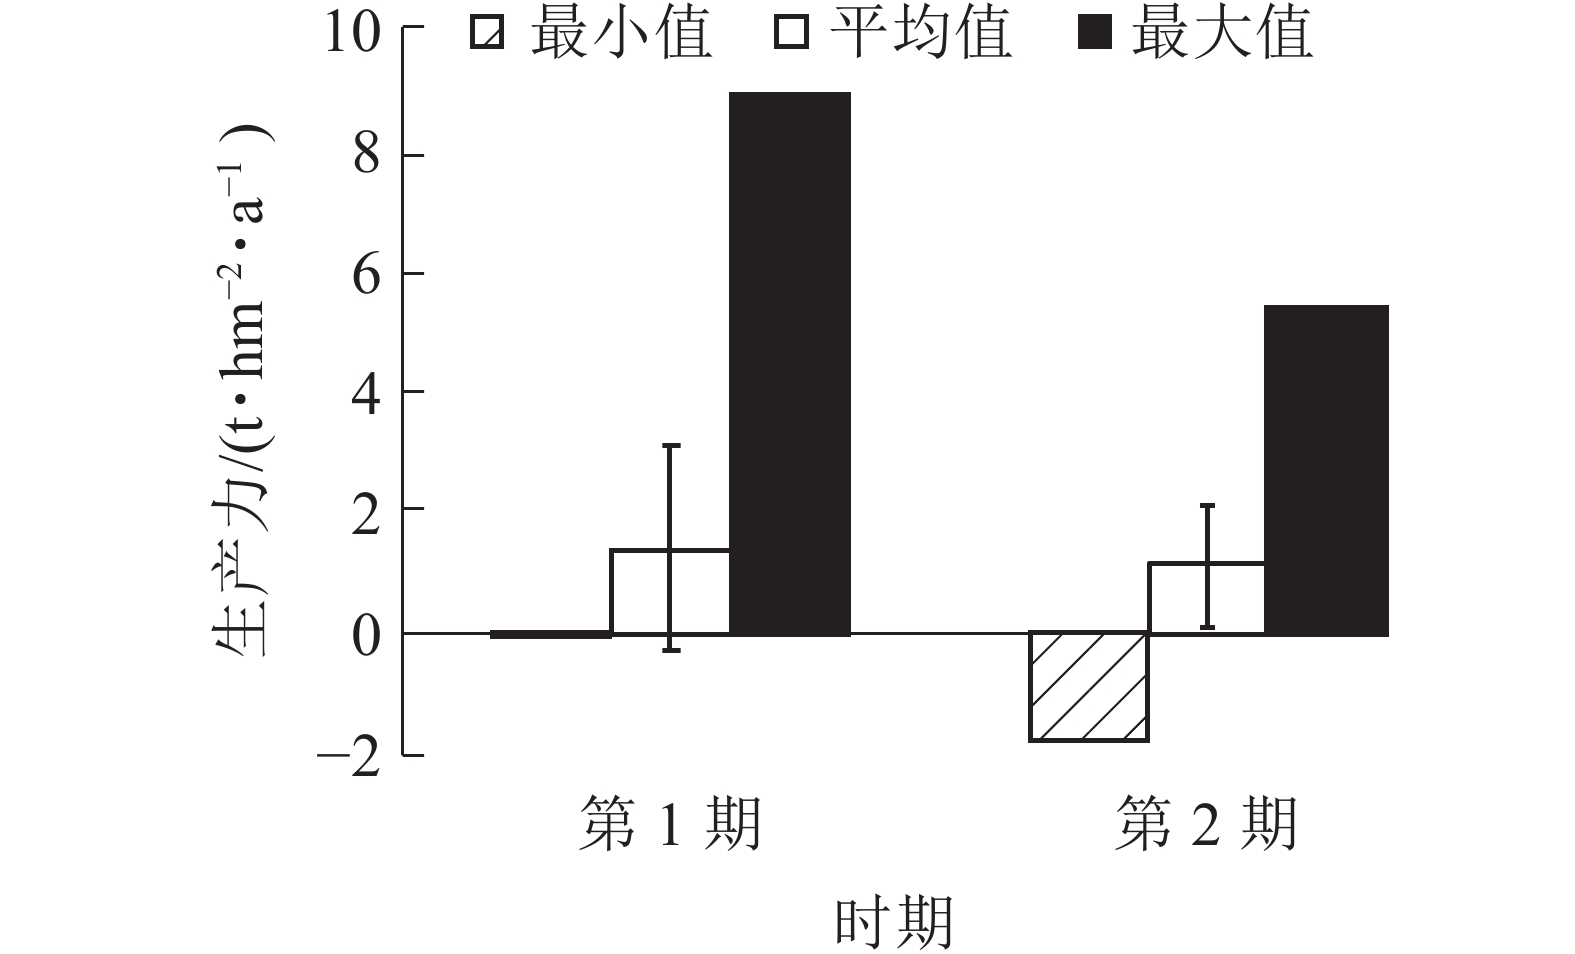
    图5可知:2期生产力均为负值,分别为−0.08和−0.19 t·hm−2·a−1。平均生产力从第1期(1999~2004年)的1.39 t·hm−2·a−1降低到第2期(2004~2009年)的1.15 t·hm−2·a−1。生产力最大值也从第1期(1999~2004年)的8.89 t·hm−2·a−1降低到第2期(2004~2009年)的5.37 t·hm−2·a−1,说明1999−2009年生产力呈下降趋势。平均生产力与生产力最大值差值较大,生产力存在较大的提高空间。

    Figure 5.  Productivity of coniferous and broad-leaved mixed forests in different periods

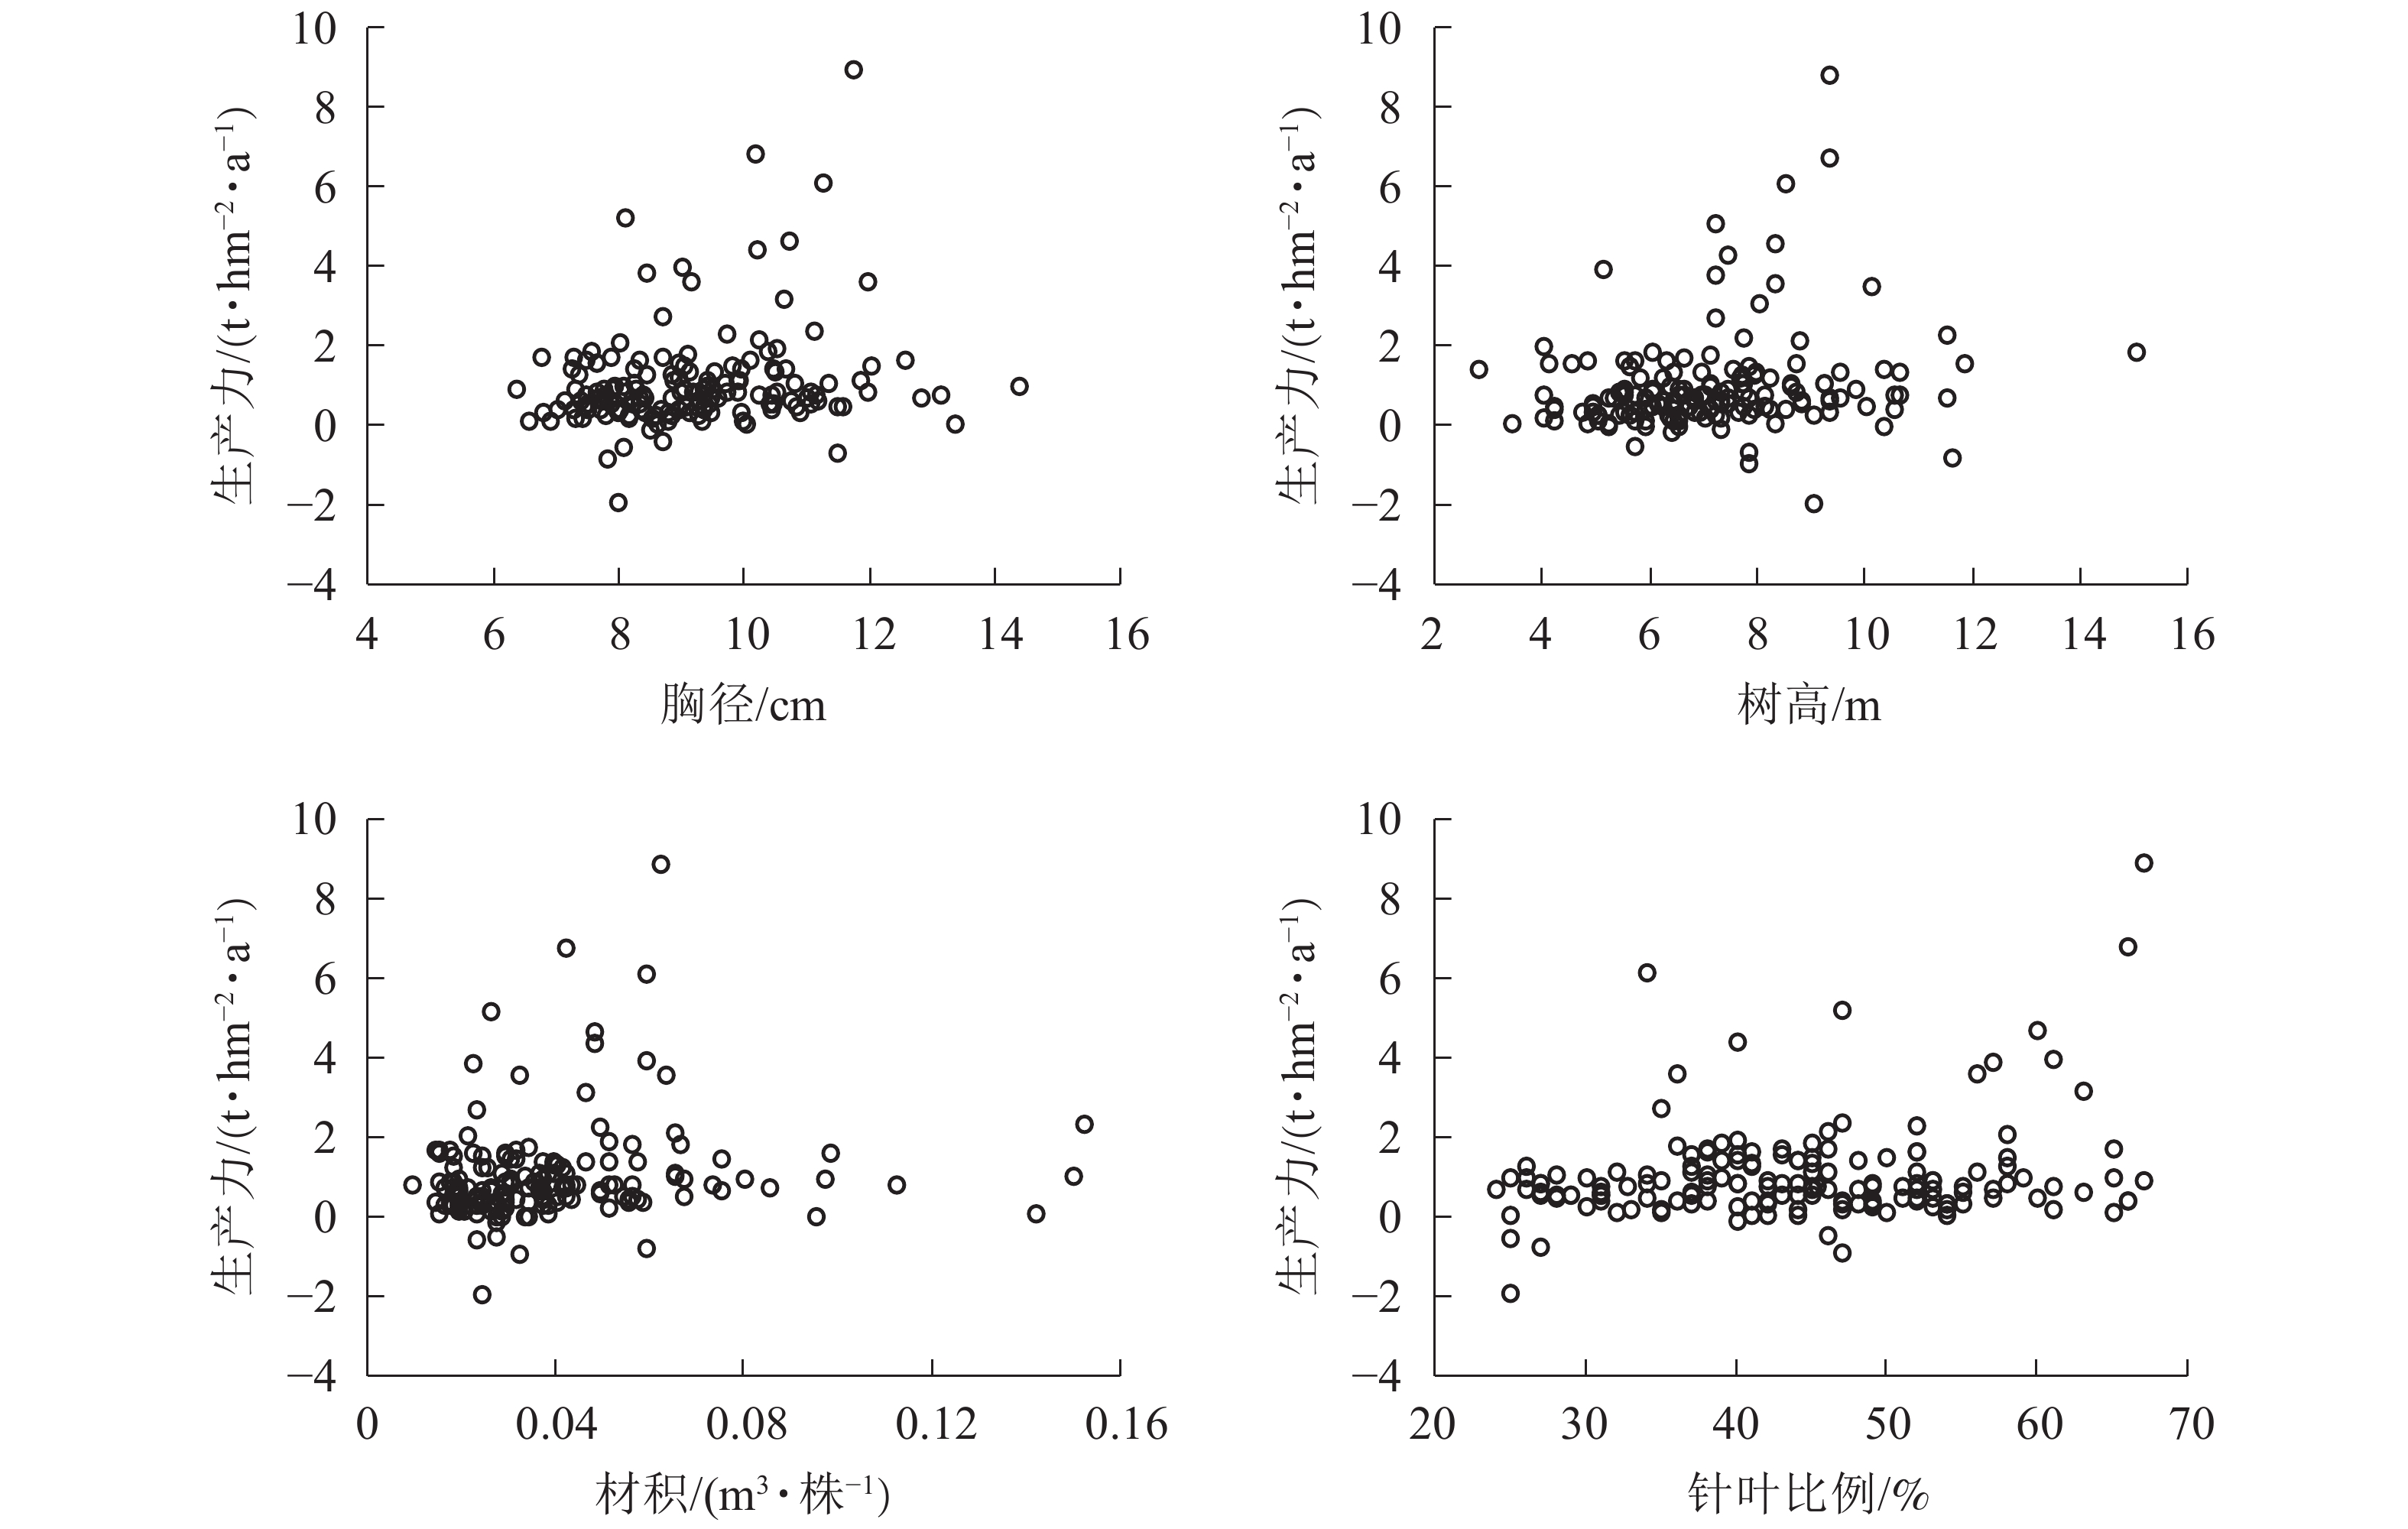
  • 图6显示:1999−2009年,林分平均胸径为[10.00,12.00] cm时生产力较高,在胸径为12.00 cm时达到顶峰。在胸径为8.00~9.00 cm时,出现多个生产力负值。在胸径为最大值15.10 cm时,生产力也未明显提高。说明胸径达12.00 cm后的增长对生产力的提高作用不大。整体胸径小于10.00 cm的样地达到64.8%。由此可知:通过适度提高林分平均胸径对提高森林生产力存在一定的空间和潜力。树高为[7.00,10.00] m时生产力较高,在树高为9.00 m时达到顶峰。在树高为6.00、8.00和12.00 m时均有生产力为负值的情况。树高低于7.00 m的样地约占39.8%;在树高生长到12.00 m后,生产力的提高并不明显。由此可知:在树高小于12.00 m时,树高增加有助于提高生产力。材积为[0.040,0.070] m3·株−1时,生产力较好。在材积为0.060 m3·株−1时生产力达到顶峰。材积低于0.040 m3·株−1的样地约占65.6%。生产力出现负值主要集中在材积小于0.040 m3·株−1的范围。由此可知:提高单株材积有助于生产力的稳定与提高。当针叶树种比例为50%~65%时,林分生产力水平较高。在48%以上时,林分生产力没有出现负值,整体呈现出随着针叶树种比例增加而提高的趋势。由此可知:保持林分内较高的针叶树种比例能形成较高的林分生产力。浙江省针阔混交林中,针叶树种占比小于50%的样地数占68.8%,表明在针阔混交林经营管理中通过森林树种结构调整生产力有一定的提升空间。
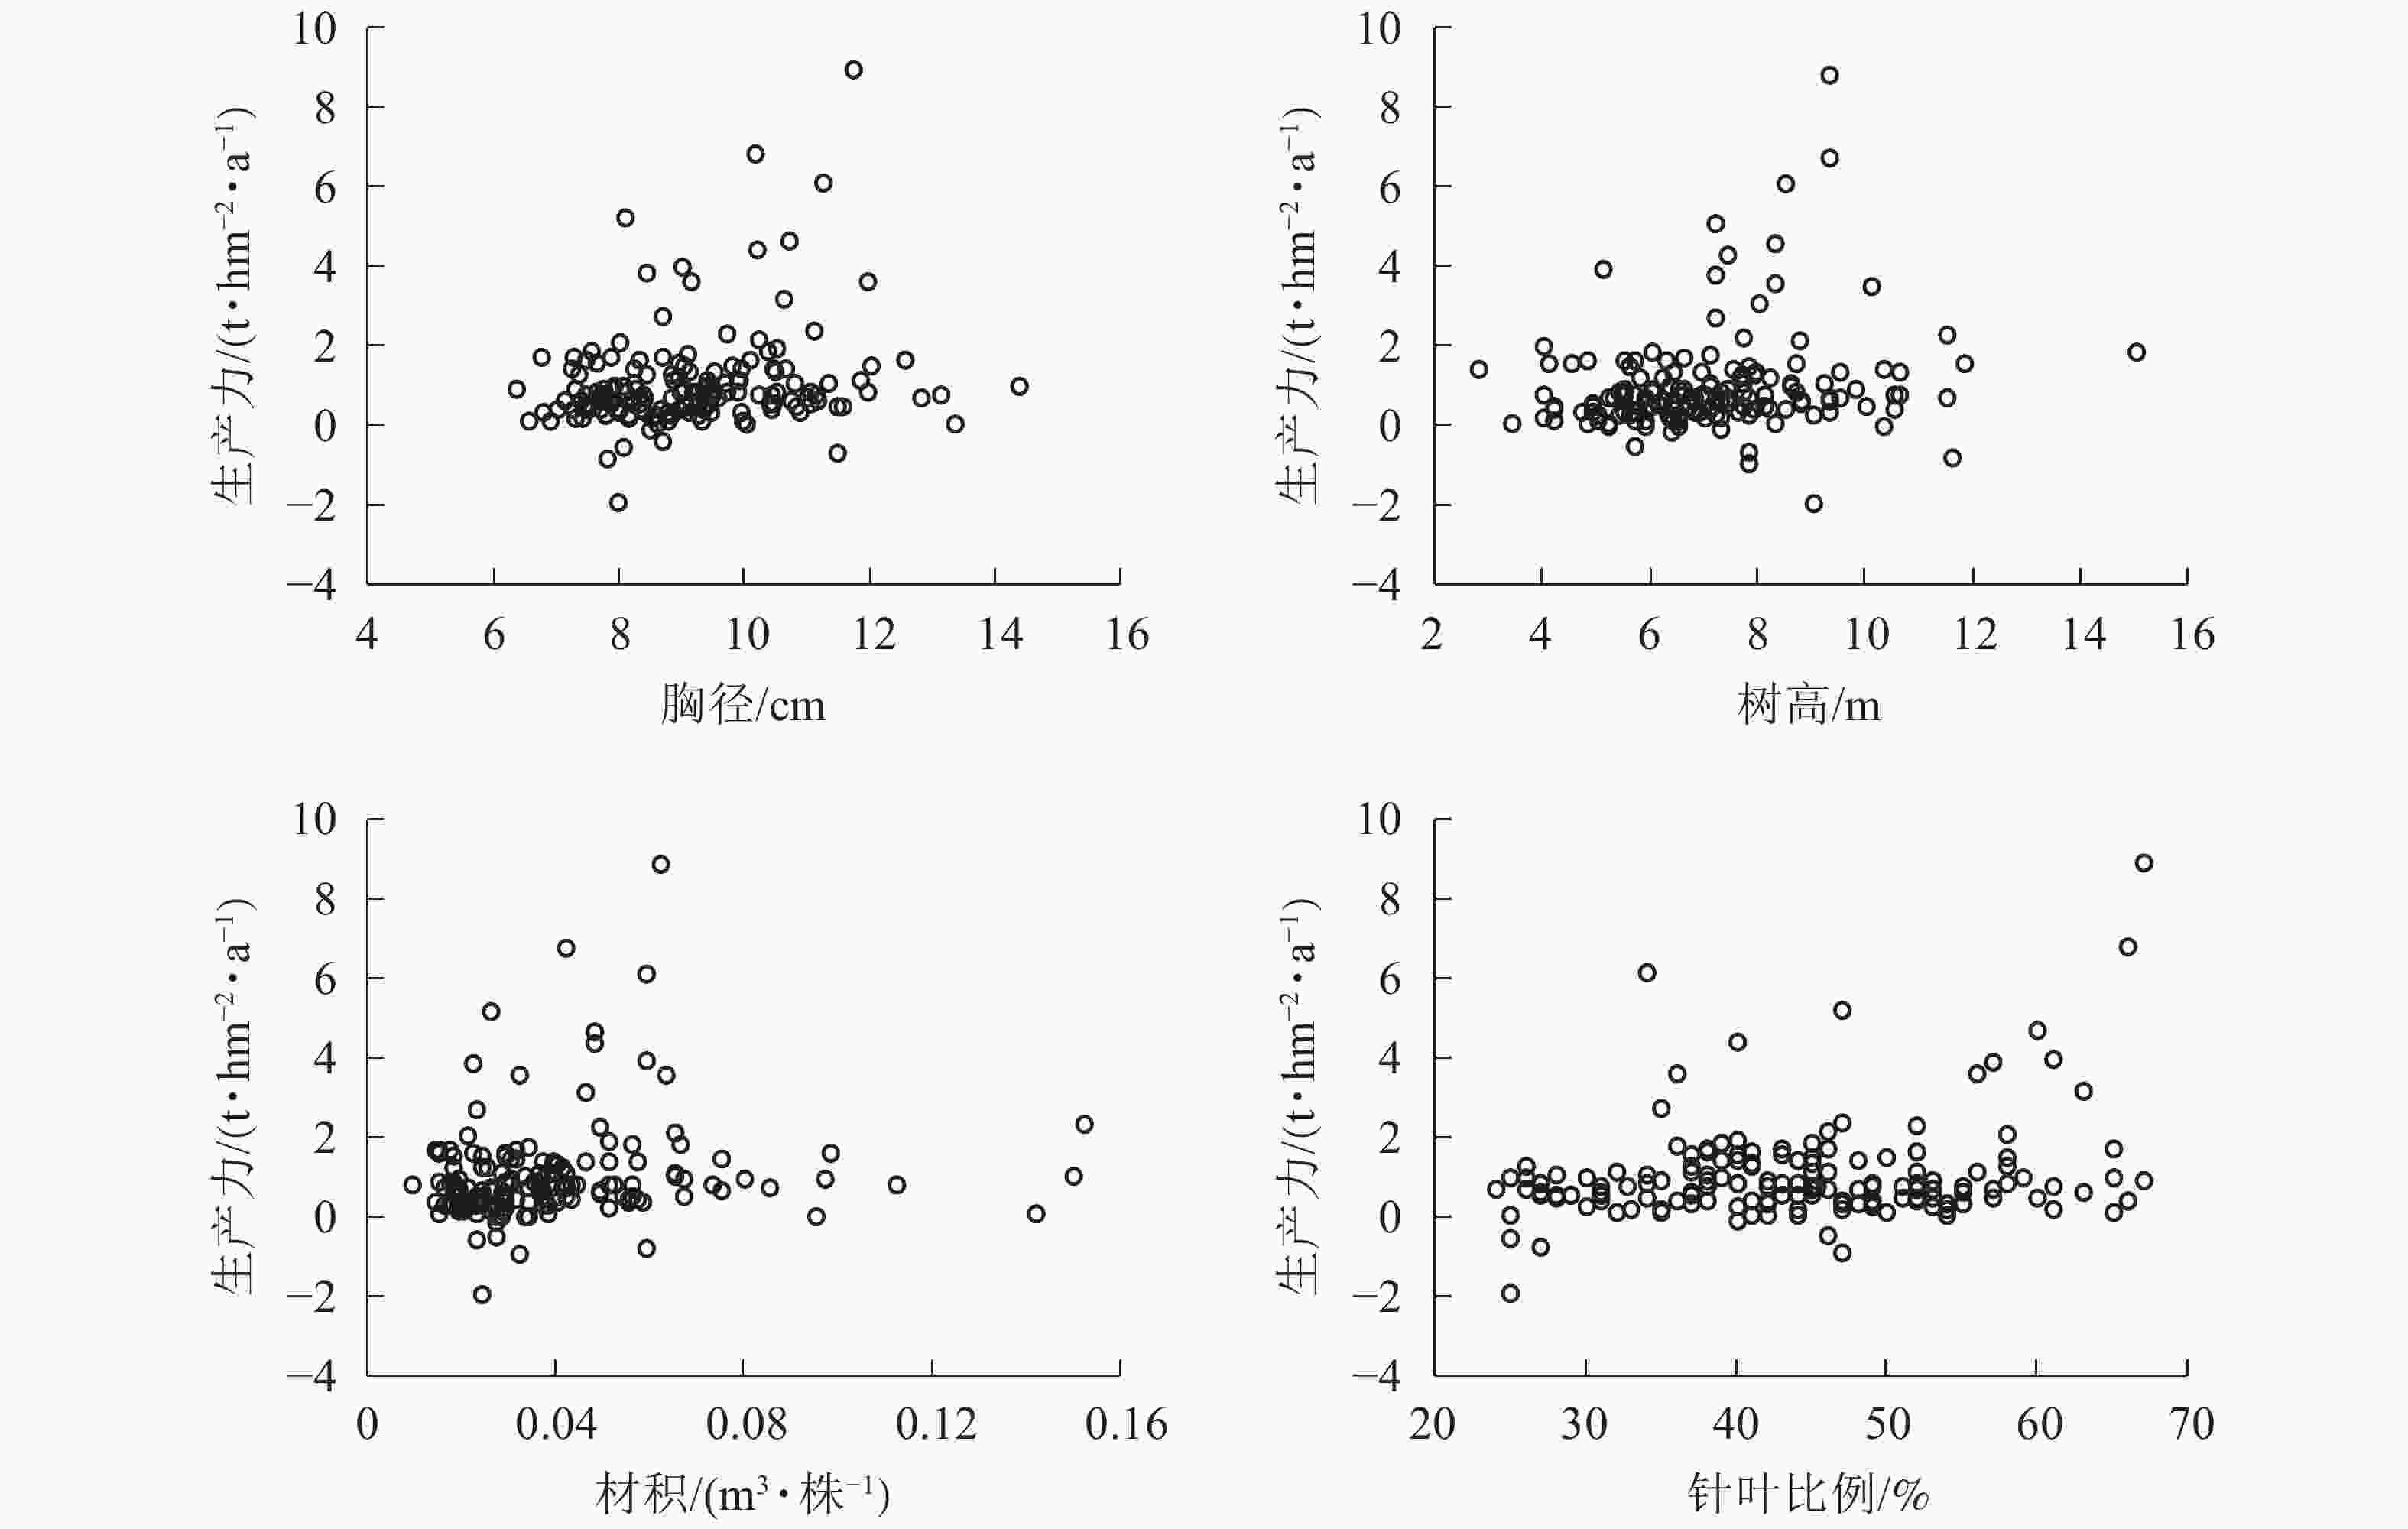
    Figure 6.  Relationship between breast diameter, tree height, volume, the proportion of coniferous species and productivity

    表5可见:生产力与胸径、树高、平均单株材积和针叶树种比例均呈显著(P<0.05)或极显著(P<0.01)正相关,其相关性大小依次为针叶树种比例、胸径、平均单株材积、树高。由此可知:林分生产力与针叶树种的比例关系较为密切,针叶树种的生长对林分生产力的作用和影响比阔叶树种要大。在实际生产经营过程中若要保持较高的森林生产力水平,首先要保持针叶树种在森林中的比例在50%以上,其次是提高林分的平均胸径。

    项目生产力胸径树高平均单
    株材积
    针叶树
    种比例
    生产力   1
    胸径    0.210**1
    树高    0.181*0.572**1
    平均单株材积0.209**0.705**0.641**1
    针叶树种比例0.282**0.020−0.167*−0.1161
      说明:*P<0.05;** P<0.01

    Table 5.  Forest structure and productivity correlation coefficients matrix

  • 树种组成是基于森林资源连续清查数据实测过程中树种在各时期所占数量比例的变化得出的。多数国内学者依据树种的存活率来选择适合更新的树种[22-23]。在研究树种组成比例中,虽然浙江省天然针阔混交林的树种数多达10余种,但在森林群落结构中真正占据主导地位的是马尾松、杉木、木荷、栎类和其他硬阔类树种等。

  • 非空间结构因子的测算准确与否很大程度上决定了最终的试验结果。由于平均值易受极端值影响,所以根据胸径、树高和单株材积的分布形态拟合出相应的函数分布,选取其正态分布的顶点值比平均值更具代表性。各时期胸径范围下限都在5.00 cm以上,原因与调查时低于5.00 cm的胸径不进行测量有关。这也从侧面证明了拟合效果良好,得出的结论符合事实。国内外有许多胸径—树高与蓄积量的相关模型研究[24]。各时期胸径均值和材积均值呈现一致的趋势。材积与胸径、树高与胸径的相关性极高,且为正相关。在建立以蓄积量模型时,可尝试用材积代表胸径和树高2个指标。

  • 早前,已有学者提出基于森林资源清查资料估算地区森林生物量等方面的研究设想[25]。森林资源连续清查具有调查地域广阔和时间跨越度长的特点。国内已有许多森林生产力、林分结构、有机碳储量、森林资源现状和森林资源动态分析等相关研究[26-31]都基于此数据,说明森林资源连续清查数据具备足够的可用性,被广大学者用于多方面研究。采用换算因子将蓄积量转换为生物量是一种有效的方法。在建立生物量模型时,通常利用对数转换的线性回归、非线性回归得出模型参数估计值[32]。国内有学者建立了可加性生物量模型[33]。与传统生物量模型相比,两者都是以胸径为自变量的异速生长方程为基础模型,但前者的立木总生物量与各分项生物量之和能够保证相等,解决了各分项生物量的估计值大于总生物量估计值问题,提高了参数的估计有效程度。如何针对森林资源连续清查数据建立更为有效的生物量模型也是未来值得探索的一个方向。

    有相关研究同样基于森林资源连续清查数据,采用换算因子将蓄积量转换为生物量得到杉木林、马尾松林和阔叶林的生产力[34]。与之相比,本研究中针阔混交林的生产力远低于杉木林,与马尾松林和阔叶林的生产力较为接近。原因主要是杉木林自身属于速生树种,且近年来人为干预较多。选取的针阔混交林样地人为经营管理较少,靠自然力生长发育。

  • ①1999−2009年,浙江省针阔混交林针叶树种比例逐期上升,胸径分布形态近似正态分布,正态分布顶点值基本不变,维持在9 cm左右。树高分布形态近似正态分布,正态分布顶点值呈上升趋势,从6.581 m增长到了6.927 m。单株材积分布形态近似左偏正态分布,正态分布顶点值基本不变,维持在0.037 m3·株−1左右。②各时期生物量上升,生产力第1期(1.39 t·hm−2·a−1)高于第2期(1.15 t·hm−2·a−1)。③生产力与胸径、树高、材积和针叶树种比例呈正相关。胸径大小为10.00~12.00 cm,树高为7.00~10.00 m,单株材积均值为0.040~0.070 m3·株−1。针叶树种比例高于50%时,林分处于较高的生产力水平,其中胸径大小为12.00 cm时达到顶峰。超过12.00 cm,生产力的提高不明显。树高在9.00 m时生产力达到顶峰。达12.00 m后,生产力的提高并不明显。单株材积均值在小于0.040 m3·株−1时,生产力容易出现负值。④森林生产力与胸径、树高、单株材积和针叶树种比例呈正相关,相关性从大到小依次为针叶树种比例、胸径、单株材积、树高。

    在针阔混交林的经营管理中,为保证林分处于高生产力的状态,要优先考虑针阔混交的比例。针叶树种比例尽量维持在50%以上,针叶树种比例偏低的混交林要进行人为干预。胸径若低于10.00 cm要加强抚育,高于12.00 cm的应及时进行采伐。应维持单株材积均值为0.040~0.070 m3·株−1,树高为7.00~10.00 m。

Reference (34)

Catalog

    /

    DownLoad:  Full-Size Img  PowerPoint
    Return
    Return