


-
城市发展是指城市由小到大、由简单到复杂的演变过程。城市发展质量体现了城市区域的协调发展能力,能有效地反映城市发展水平,也关系到城市社会、环境、生活、经济等各个方面的可持续发展情况[1]。城市作为经济发展的重要载体,需要践行高质量发展理念[2−3],是中国经济发展新常态下的必然选择和基本特征[4]。由此可见,对城市发展质量进行评估,有助于明确城市发展过程中的潜在问题与不足,对制定合理城市发展战略,保障城市高质量建设和可持续发展具有重要的现实意义。
近年来,围绕城市发展质量问题,学者从不同视角进行了探讨。从研究对象看,学者对城市个体[5−7]、城市群[8]、跨区域城市群[9−11]等开展了包括城市发展质量测度、变化趋势、驱动因素等的探索分析。从研究角度看,有单一因子的评价,也有多因子分析,但复合多因子指标比单一指标具有更好的解释力[12],多因子指标评价集中于社会、经济、环境、设施等几个维度。目前,城市文化维度对城市发展影响的解释较为缺乏,同时也尚未构建各维度综合性逻辑框架。从研究方法看,主要有层次分析法(AHP)[13]、熵值法[14−15]、主成分分析法[16]、线性回归[17]等。其中,熵权法基于评价指标的原始信息求得权重,与AHP法相比,它客观性更强、精确度更高,可最大程度地降低指标权重误差,而且在指标数量、样本多少以及数据分布等方面都没有严格的要求和限制,且在评价中可充分利用原始数据,信息损失较少,同时,该方法还具有操作简单、真实可靠、表征直观等优点[18]。
因此,本研究从多因素角度探析城市发展质量内涵,构建了城市发展质量综合评价多维测度框架体系,探究了浙江省城市发展质量分异特征,同时引入障碍度模型,对城市发展质量的影响机制进行诊断分析,以期为浙江省各城市发展策略制定提供理论参考。
-
浙江省位于中国东南沿海(27°02′~31°11′N,118°01′~123°10′E),总面积为10.55万km2。本次研究区域为浙江省11个地级行政区,包括杭州、宁波、温州、嘉兴、湖州、绍兴、金华、衢州、舟山、台州、丽水。至2019年末,浙江省常住人口为5 850万人,比上年末增加了113万人,城镇化率为70.0%,地区生产总值为62 352亿元。
本研究所有评价指标数据来源于浙江省统计年鉴,各行政区统计年鉴,各地区的国民经济和社会发展统计公报、生态环境公报等。部分数据来源于政府网站的其他发文。所用数据的时间节点为2010、2015和2019年。
-
熵权法是一种根据指标变异性程度来确定客观权重根的方法,能够有效反映数据隐含的信息,增强指标的差异性和分辨性,达到全面反映各类信息的目的[19]。TOPSIS模型是系统工程中有限方案多目标决策分析方法[20]。
基于熵权-TOPSIS模型的城市发展质量评价包括对判断矩阵进行标准化处理、计算概率矩阵、计算每个指标的信息熵、归一化得到每个指标的熵权、计算加权决策矩阵、计算方案的优劣值,具体计算公式及步骤参考文献[21−23],最后,得到不同城市的贴近度(Si),来定义城市发展质量的优劣程度,如式(1)所示:
式(1)中:Si的取值为0~1,Si越大,表示第i项城市发展质量越接近于最优水平。根据文献[24−25],将贴近度划分为4个等级,表示城市发展质量的高低,即贴近度在0~0.18时为低水平,0.18~0.32时为较低水平,0.32~0.50时为中等水平,0.50~0.70时为较好水平,0.70~1.00时为优质水平;$ D_i^ + $、$ D_i^ - $表示每个方案在各因素下的最优距离与最劣距离。
-
对影响浙江省城市发展质量的主要障碍因素进行分析与诊断,可以针对性地制定和调整城市发展规划政策。计算公式如下:
式(2)中:Oj表示第j项指标的障碍度;Ij为指标偏离度,为各指标值与最优目标值之间的差距,可以用1与各指标的极值标准化值的差值来表示;Fj为因子贡献度,可用各指标权重值来表示;n为指标数量。
-
城市是一个开放的复杂系统,城市发展可以理解为是以新城镇化为目标,涵盖了社会、经济、环境、文化等各方面的整合提升和彼此关联运作的结果[26]。由此可以将城市发展分解为4个方面,即社会功能、经济发展、生态环境、文化特质。其中,社会功能开发程度决定了城市中享受的社会福利和保障措施程度,以满足城市居民的各种活动需求,是城市公共服务能力的体现;经济发展活力是城市赖以生存和发展的基础和动力源,是城市竞争力的关键所在;生态环境质量是人类活动行为给自然环境所产生的积极影响和消极影响的综合外部环境响应结果,一方面人类活动促使环境要素发生改变,另一方面生态系统的承载能力约束着人口、经济的规模,制约着城市发展的效率,从而推进着城市的环境治理行为。城市文化特质是文化在地理景观中清晰、有意义的印记,是城市发展的内在驱动力,同时文化既有社会属性,也有经济和产业属性,可有效助推城市经济发展和创新。由此,城市发展质量内涵可理解为区域复杂系统中,社会功能、经济发展、环境响应和文化提升等多个过程综合作用的效果。
-
从社会功能、经济发展、生态环境、文化特质4个维度出发,构建了城市发展质量测度体系(表1)。其中,社会功能系统主要选取了反映道路交通建设情况和城市服务能力等方面的指标,表达城市居民生活便捷程度,是城市发展质量的直观感受;经济发展系统主要从产业发展和经济水平2个角度衡量城市经济发展情况,是城市发展活力的具体表征;生态环境系统主要涵盖了环境效果和城市绿地建设2个方面,体现城市发展开发利用过程对环境的影响及治理效果;文化特质系统强调了城市的文化遗产保护和文旅融合,体现了城市发展过程中风貌保护和文化的可持续开发利用情况。
目标 系统 准则层 指标层 城市发展质量 社会功能 道路交通 人均道路面积C1/(m2·人−1) 每万人拥有公共交通数量C2/(辆·万人−1) 城市服务 养老保险参保率C3/% 教育支出公共预算占比C4/% 每万人卫生技术人员C5/(人·万人−1) 经济发展 产业发展 规模以上工业总产值C6/亿元 第三产业就业比例C7/% 第三产业占比C8/% 经济水平 人均GDP C9/(元·人−1) 人均社会消费品零售总额C10/(元·人−1) 人均可支配收入C11/(元·人−1) 生态环境 环境效果 水质达标率C12/% 空气质量优良率C13/% 城市绿地 人均公园绿地面积C14/(m2·人−1) 建成区绿化覆盖率C15/% 文化特质 文化遗产 历史文化名镇(村)数量C16/个 非物质文化遗产保护C17/个 文旅融合 旅游收入C18/亿元 旅游人数C19/人次 说明:所有指标均为正指标。 Table 1. Evaluation index system of urban development quality
-
如表2所示:2010—2019年,浙江省城市发展质量总体水平稳步提升,贴近度平均值从0.340提升至0.365,低水平发展城市比例由36.3%将至18.2%,但各城市间的差距有所增大,贴近度差值从2010年的0.627增加至2019年的0.721。城市间排序相对稳定,杭州和宁波一直位列第1位和第2位;舟山、衢州等5个城市位于后5位,且排序较为稳定;温州、嘉兴等4个城市位列中间,排序随时间有所调整,其中嘉兴的城市建设效果明显,提升速度较快。杭州和宁波的城市建设质量明显优于其他城市,9 a间一直保持前列,究其原因,这2个城市都为浙江省的副省级城市,杭州还是浙江省省会城市,城市建设规模大,经济实力强,容易集中各类社会资源推进城市建设,提升城市发展质量。
城市 2010年 2015年 2019年 贴近度 排序 贴近度 排序 贴近度 排序 杭州 0.765 1 0.756 1 0.819 1 宁波 0.661 2 0.678 2 0.789 2 温州 0.389 4 0.369 6 0.339 4 嘉兴 0.320 6 0.384 4 0.447 3 湖州 0.166 8 0.222 8 0.232 9 绍兴 0.424 3 0.486 3 0.337 5 金华 0.366 5 0.373 5 0.290 6 衢州 0.107 11 0.147 10 0.153 10 舟山 0.138 10 0.145 11 0.098 11 台州 0.243 7 0.231 7 0.258 7 丽水 0.158 9 0.208 9 0.255 8 Table 2. Comprehensive evaluation results of urban development quality in Zhejiang Province
-
2010年,浙江省城市发展质量空间格局呈现以杭州和宁波为双重心的结构特征,杭州和宁波为高值区,绍兴、金华和温州等3个城市为中等水平,湖州、衢州、丽水和舟山等4个城市为低水平,低水平城市占比较大,城市发展质量总体水平不高。2015年,浙江省城市发展质量明显提升,其中嘉兴的城市发展质量水平提升明显,形成了以杭州和宁波为中心的环杭州湾高质量发展城市群的分布结构。2019年,浙江省城市发展质量总体较好,环杭州湾高质量城市发展分布结构特征进一步加强,宁波上升为优质水平,但金华发展质量评价值有所降低,由中等水平降至较低水平,衢州和舟山仍处于低水平。
-
从表3可见:经济发展和文化特质层面的得分与城市发展质量水平较为一致,城市发展质量得分较高的城市(杭州、宁波等),经济发展和文化特质得分也相对较高。生态环境的评价得分则与城市发展质量水平不一致,其中,城市生态环境较好的城市(湖州、衢州和丽水等),在城市发展质量得分方面却低于其他城市。通过计算标准差,发现各城市子系统发展不均衡。其中,经济发展的标准差最大,2010年为0.289,虽然后面呈现下降趋势,但均高于其他子系统,说明城市间经济发展水平不均衡性明显;社会功能标准差为0.109~0.163,城市间差异较小;生态环境标准差先升后降,不均衡现象总体呈缓解趋势;文化特质标准差先降后升,说明各城市不均衡性呈扩大趋势,2019年达0.209,仅低于经济发展子系统。
年份 系统 各城市子系统评价值 标准差 杭州 宁波 温州 嘉兴 湖州 绍兴 金华 衢州 舟山 台州 丽水 2010 社会功能 0.659 0.694 0.513 0.526 0.521 0.332 0.340 0.375 0.464 0.373 0.258 0.121 经济发展 0.976 0.920 0.346 0.452 0.235 0.564 0.272 0.035 0.253 0.275 0.044 0.289 生态环境 0.799 0.369 0.264 0.209 0.747 0.797 0.655 0.792 0.680 0.525 0.775 0.216 文化特质 0.697 0.455 0.437 0.204 0.127 0.258 0.443 0.120 0.088 0.244 0.222 0.185 2015 社会功能 0.697 0.753 0.316 0.380 0.393 0.363 0.282 0.261 0.426 0.294 0.180 0.163 经济发展 0.903 0.914 0.339 0.528 0.332 0.634 0.341 0.159 0.254 0.285 0.162 0.254 生态环境 0.725 0.375 0.195 0.223 0.839 0.347 0.781 0.837 0.564 0.371 0.796 0.241 文化特质 0.707 0.426 0.476 0.238 0.192 0.281 0.468 0.190 0.137 0.301 0.315 0.167 2019 社会功能 0.642 0.630 0.366 0.339 0.355 0.487 0.417 0.408 0.535 0.349 0.167 0.109 经济发展 0.821 0.887 0.269 0.543 0.249 0.375 0.207 0.065 0.177 0.245 0.057 0.264 生态环境 0.537 0.337 0.631 0.243 0.746 0.765 0.636 0.810 0.628 0.307 0.637 0.192 文化特质 0.860 0.564 0.478 0.233 0.252 0.280 0.452 0.227 0.095 0.316 0.404 0.209 Table 3. Evaluation value of urban development quality subsystem in Zhejiang Province
-
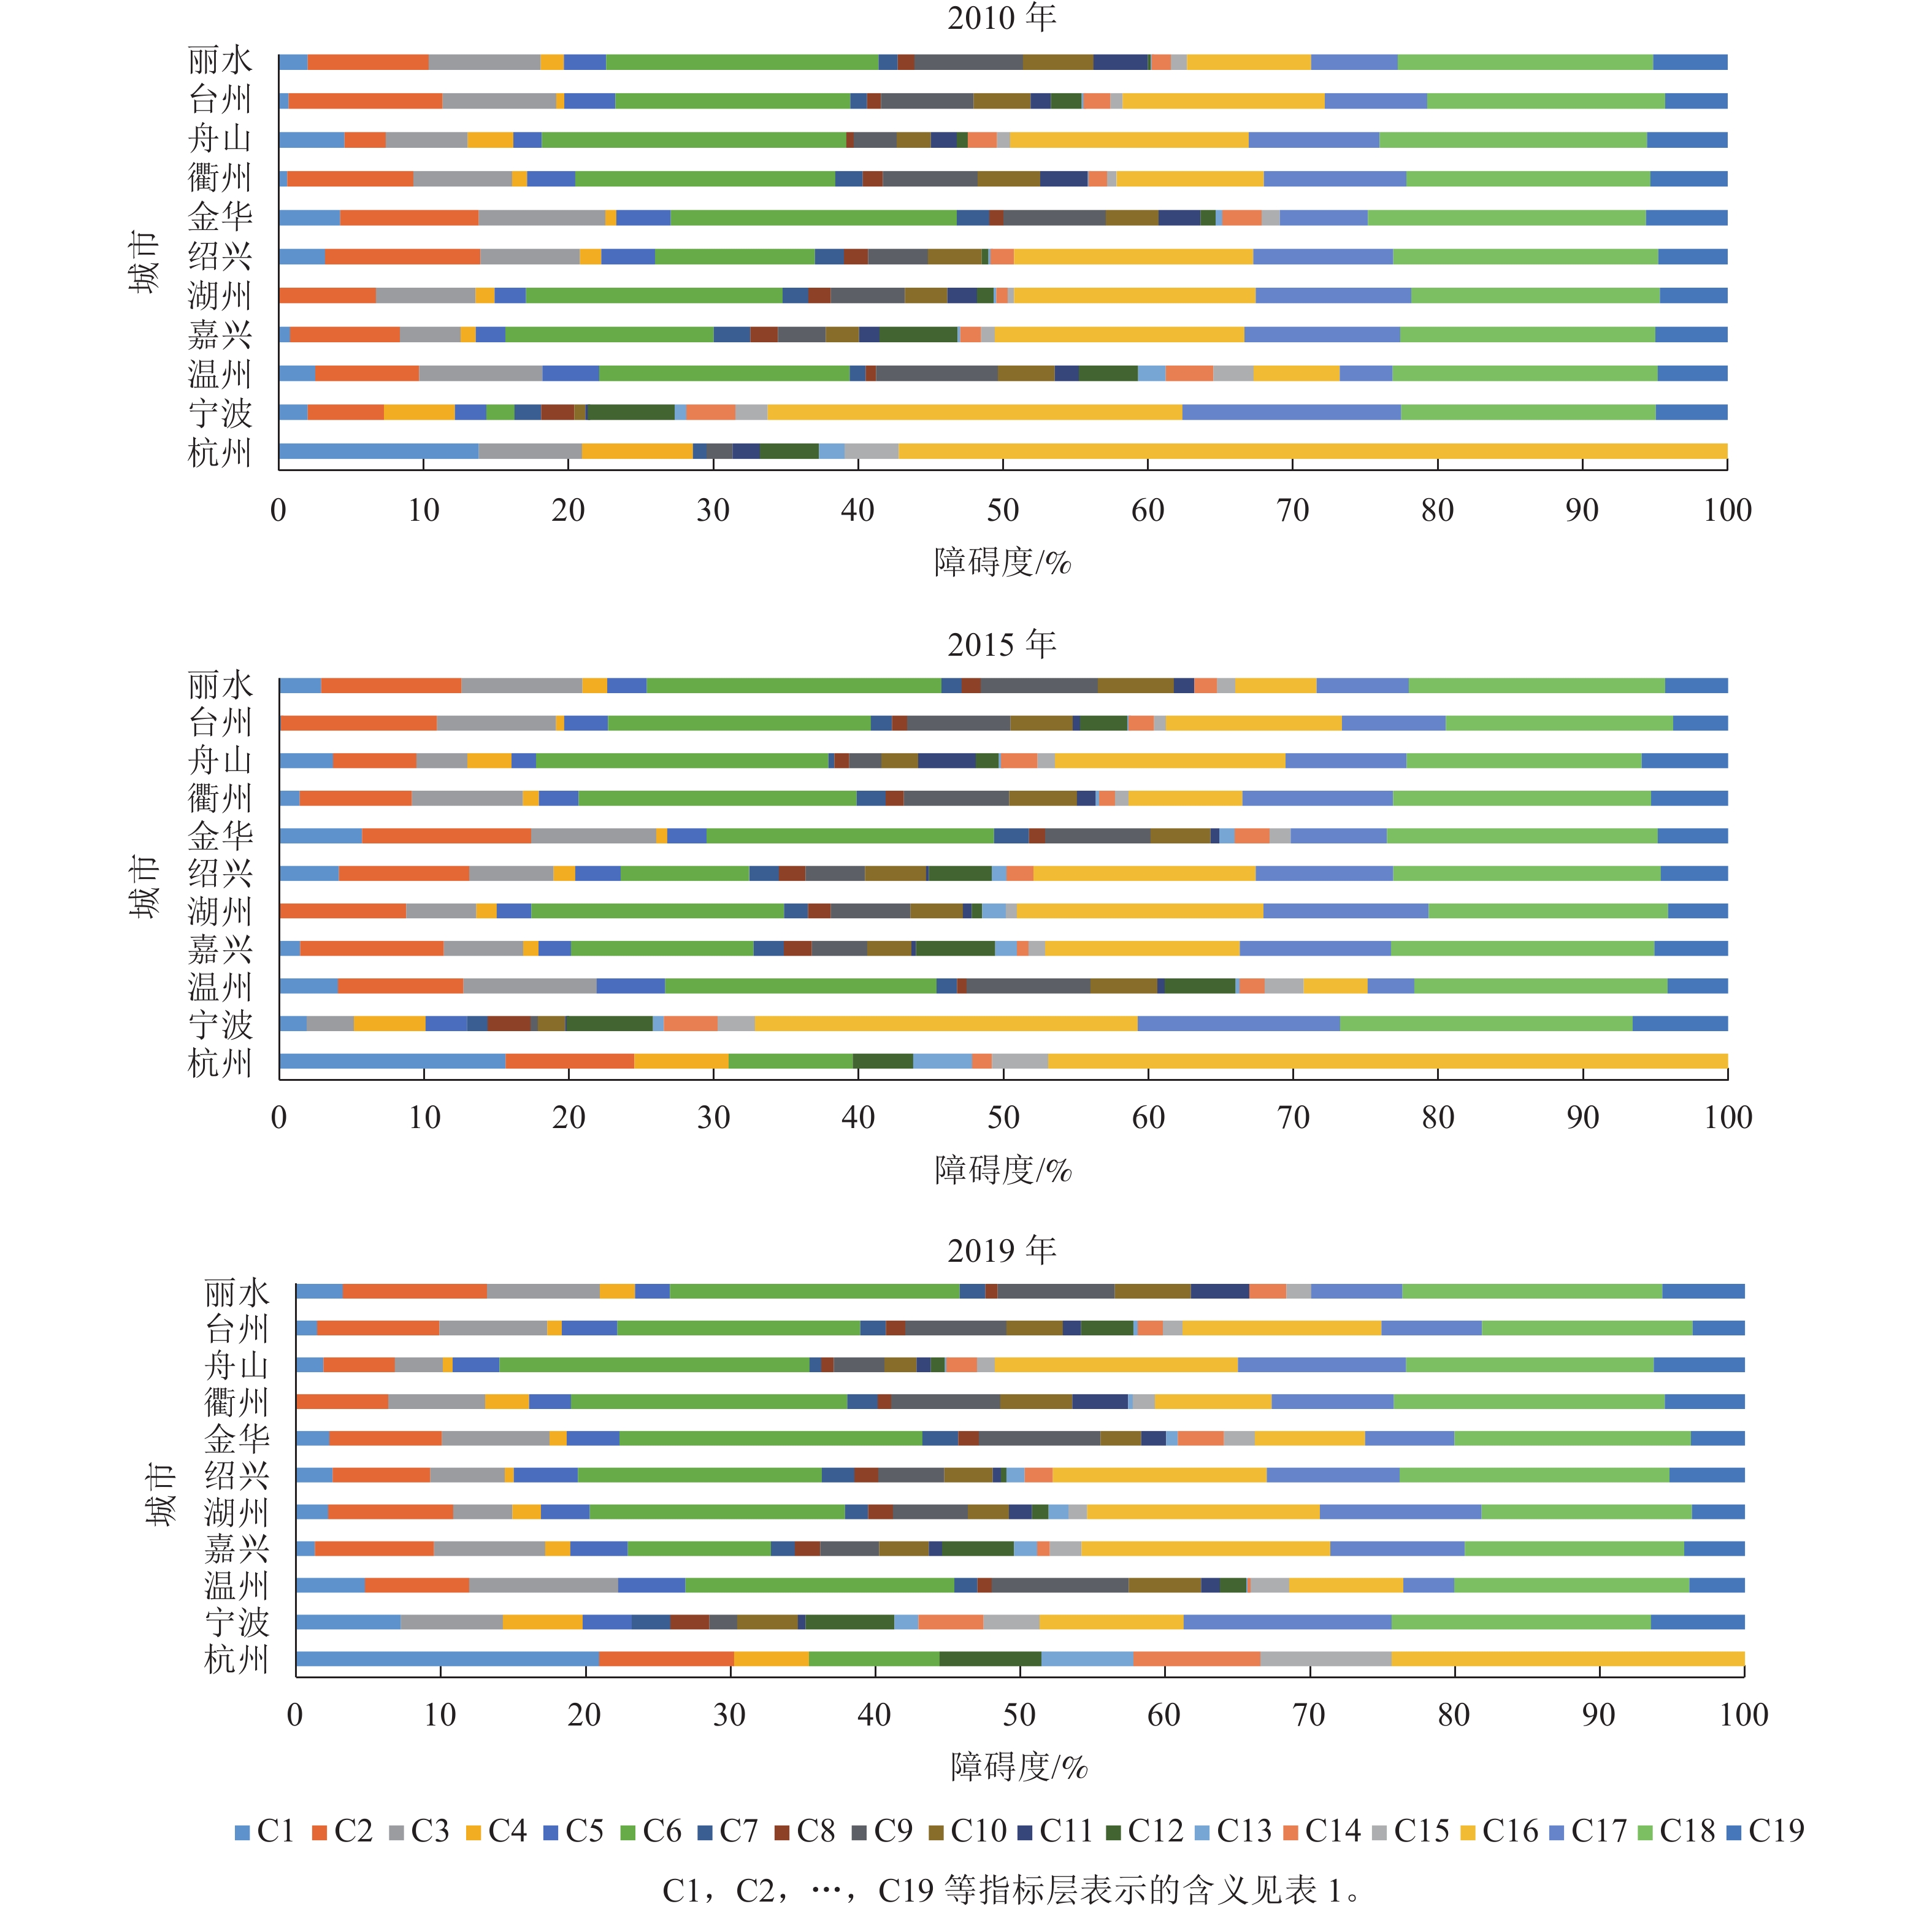
图1和图2表明:4个子系统对浙江省城市发展质量的障碍度变化存在一定差异。从具体数值来看,文化特质子系统障碍度最大,平均达43.29%,后面依次是经济发展、社会功能和生态环境子系统,平均分别为27.81%、22.25%和6.65%。这表明文化特质子系统对浙江省城市发展质量的制约性最大,生态环境子系统影响最小,浙江省生态环境保护情况较好。从发展趋势来看,生态环境和经济发展的平均障碍度呈递增态势,其中生态环境增长最为明显,9 a间增长了40.15%;文化特质子系统呈下降趋势,下降了13.95%,社会功能的平均障碍度趋于平稳,改变不大。由此可见,浙江省未来在文化特质上,需要挖掘各地的特色,将历史文化保护与城市更新相结合,进一步做好文旅融合;在经济发展上,应注重高质量发展理念,推动质量、效率和动力等的变革,优化经济结构、转换增长动力,经济实现量的合理增长和质的稳步提升;同时,需进一步加快民生事业发展,完善基础设施建设,提高公共服务能力,为居民提供更好的社会功能;在生态环境方面,虽然在各子系统中障碍度最低,但是呈上升趋势,说明社会经济的发展给生态环境带来了较大的压力,需要进一步加强生态环境建设,给居民提供更好的生活环境。
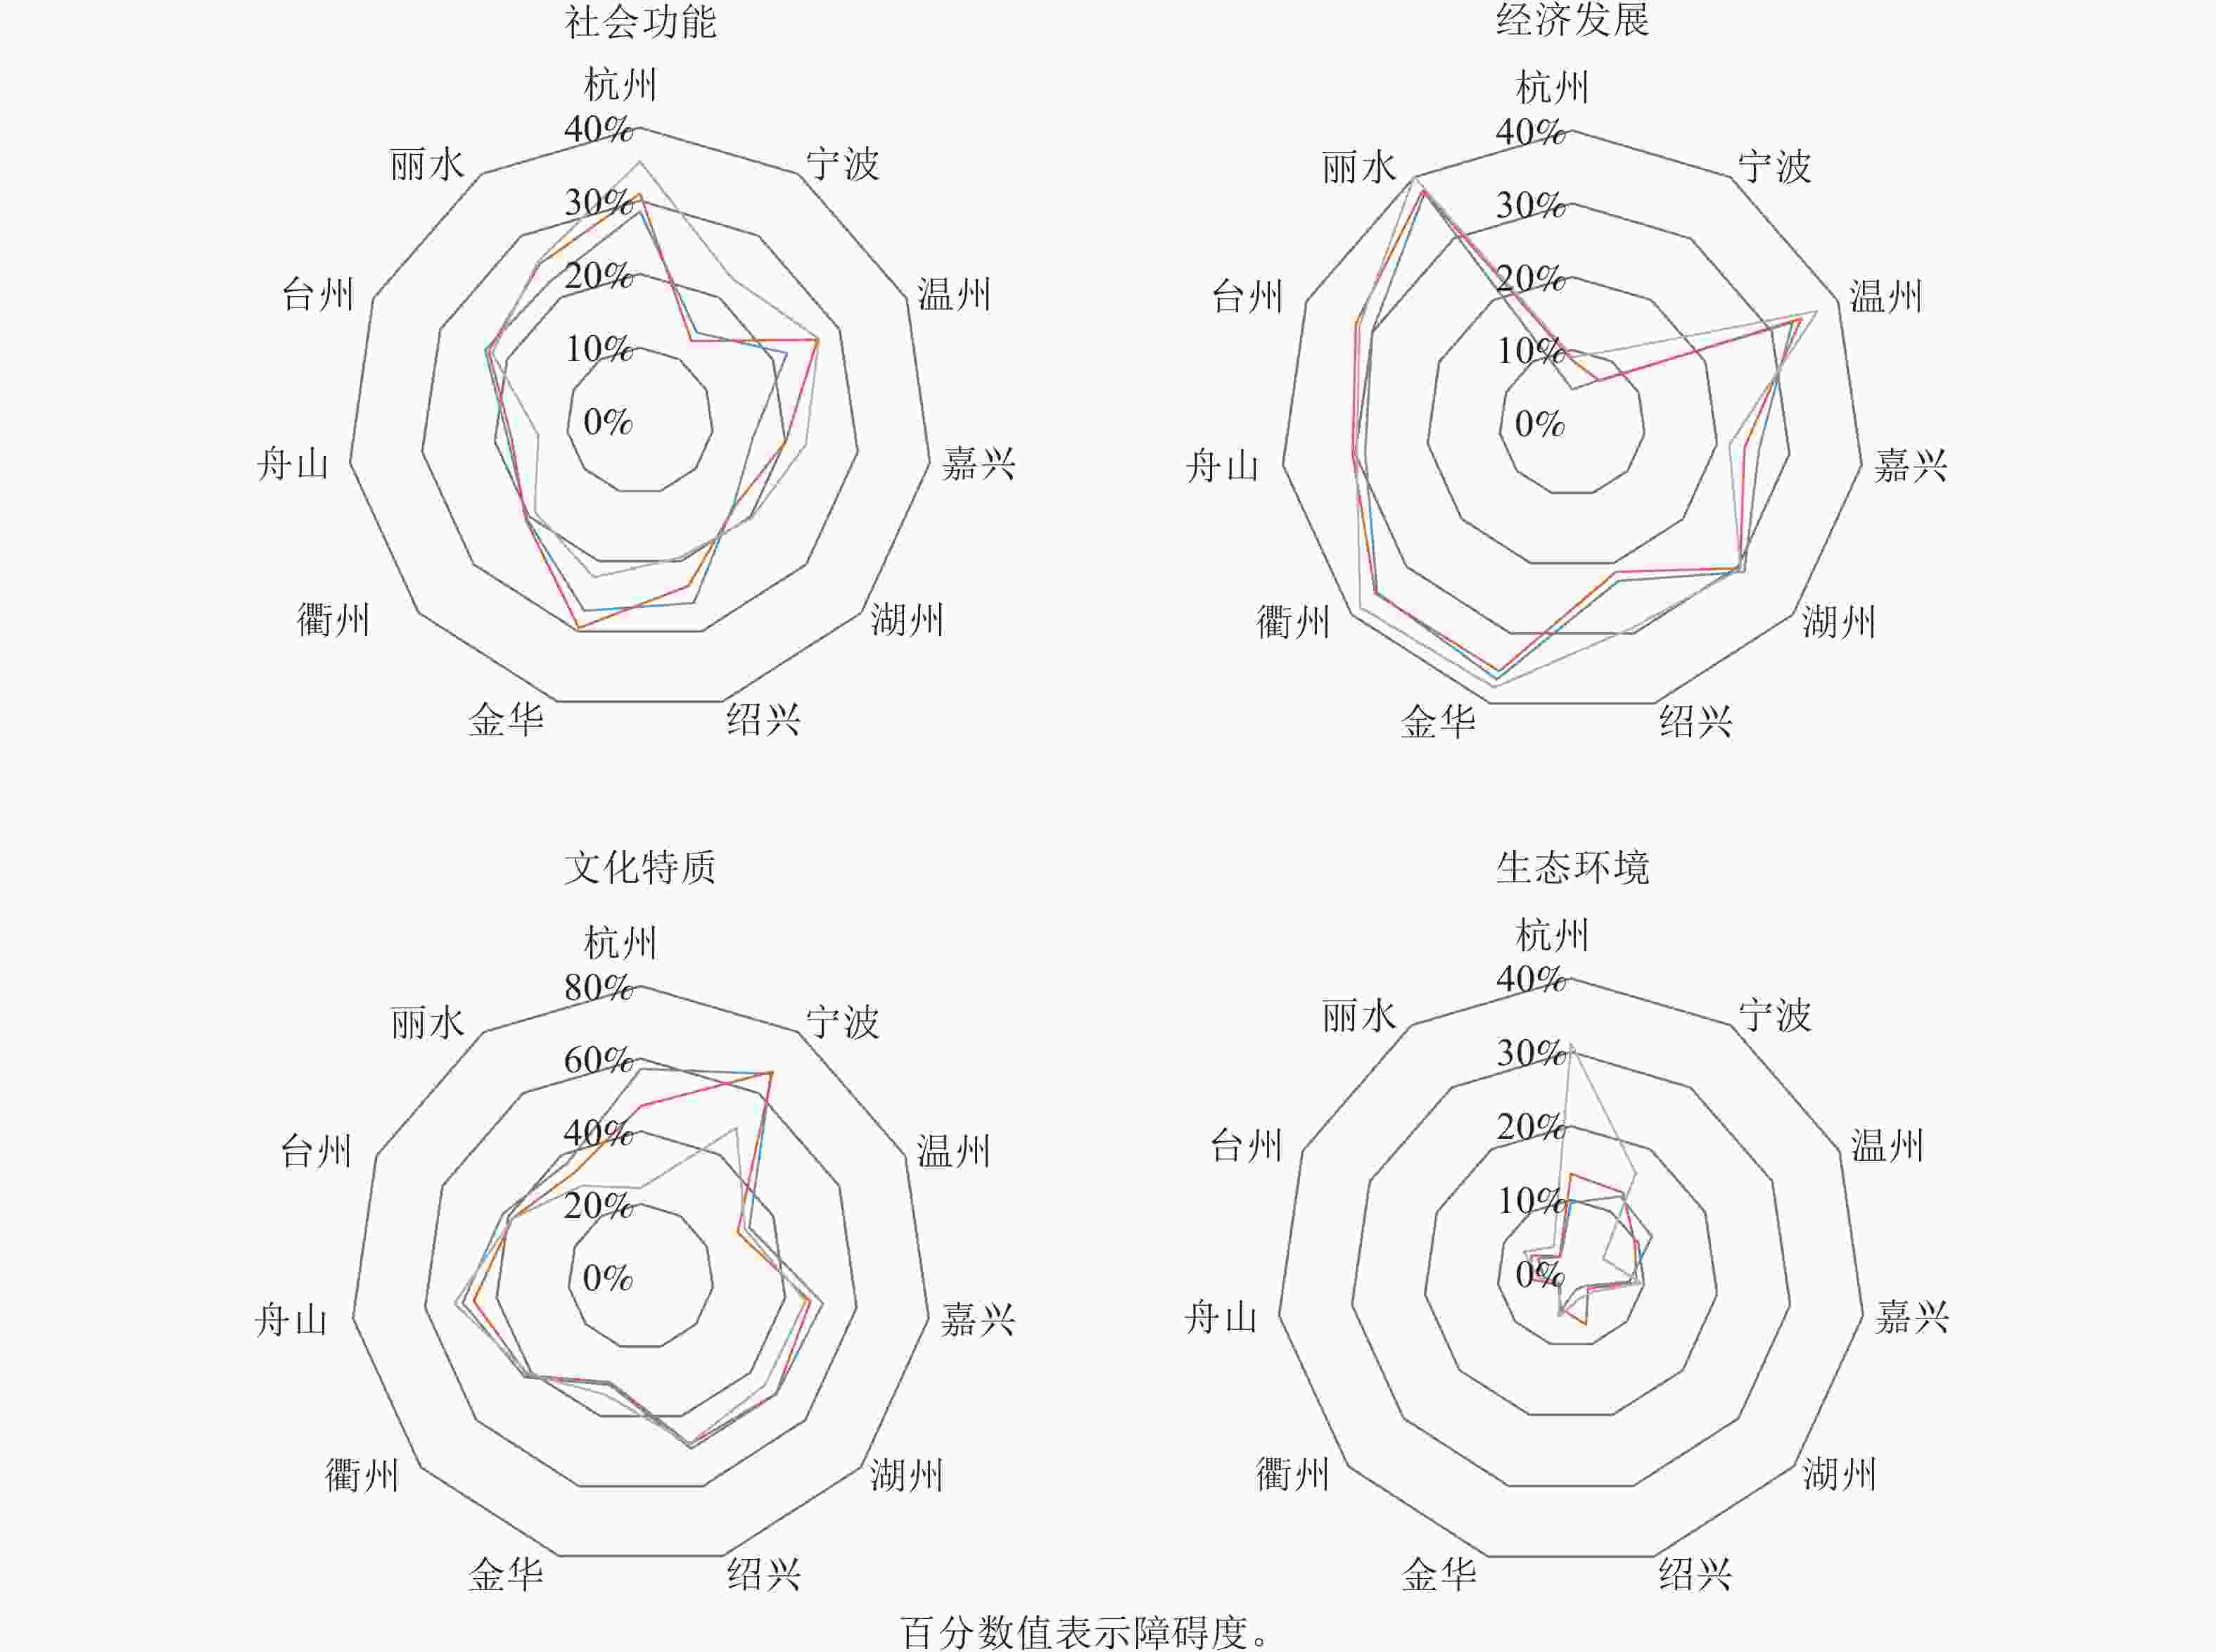
Figure 1. Obstacle degree of urban development quality subsystem in Zhejiang Province
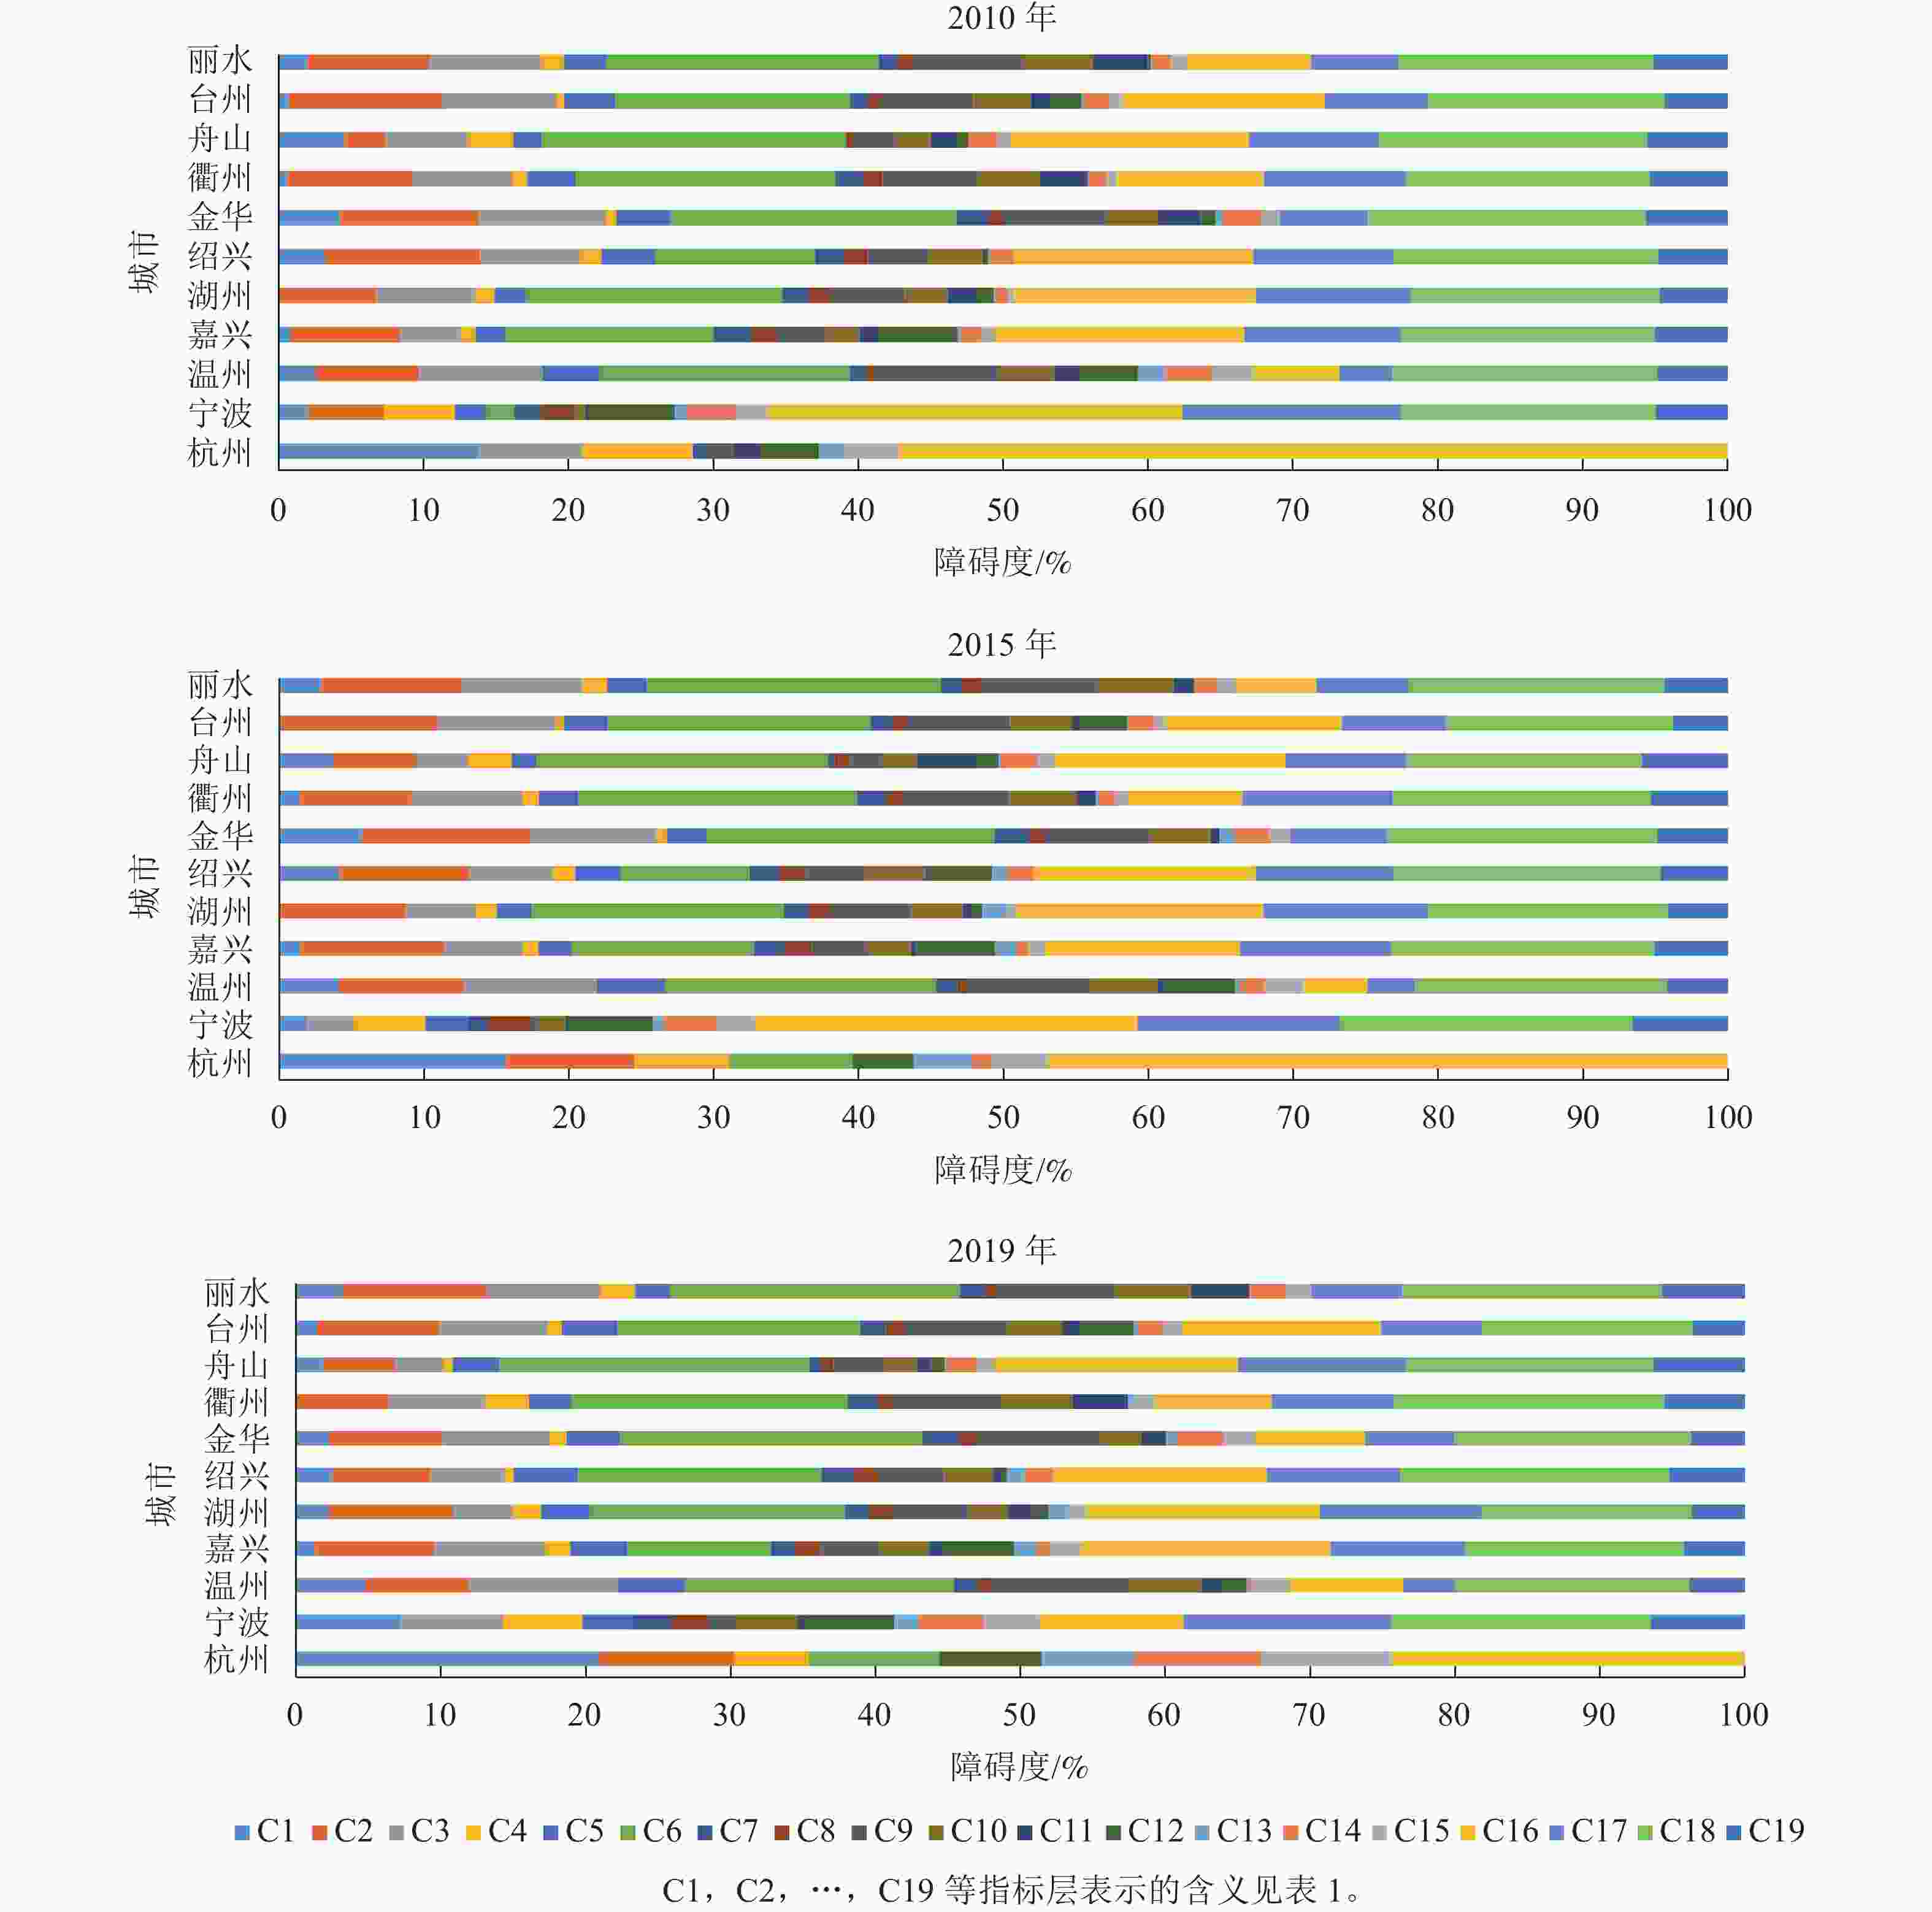
Figure 2. Obstacle degree of urban development quality index layer in Zhejiang Province
各城市的指标层障碍度因子也存在明显差异。从数值大小和出现频次来看,规模以上工业总产值、历史文化名镇(村)数量最为活跃,说明这2个指标对浙江省城市发展质量水平的影响最大。经济相对发达的城市,在规模以上工业总产值、人均GDP等经济发展方面具有很大优势,障碍度都小于经济相对落后的城市,如杭州和宁波,2010、2015及2019年,规模以上工业总产值、人均GDP都不是主要障碍因子,制约城市发展质量水平的主要是水质达标率、空气质量优良率、每万人拥有公交数量等,主要原因是经济相对发达的城市,人口规模大,集聚程度高,人地矛盾较为突出,这对城市环境改善和基础设施配套完善方面造成较大的压力。就历史文化名镇(村)数量来说,经济落后和发达地区在2010年都是主要障碍因子,而2015年后,衢州、丽水等经济相对落后地区,该指标已经不是主要障碍因子,主要原因是这些城市发展速度慢,而随着历史文化保护认知程度的提升,很快修正了原来盲目扩张对原有城市历史痕迹的破坏。相反,经济发展和城市扩张越快速的城市,对于历史文化街区、历史建筑等的破坏越严重。如杭州市指标层障碍因子最大的就是历史文化名镇(村)数量,2010年达57.64%,9 a间虽呈下降趋势,但一直是主要障碍因子。究其原因是自20世纪90年代以来,随着城市快速发展,杭州全面启动了旧城改造计划,大片的历史街区和传统民居群被“抹平”。自2013年以来,逐渐形成了名城保护和城市协调发展模式,历史文化街区、镇(村)等得到了有效保护,相关的指标对城市发展质量制约作用降低。另外,文化特质子系统中的旅游收入一直为大部分城市的主要障碍因子,说明加强特色文化挖掘和开发,做好文旅融合是以后关注的重点之一。经济相对落后的城市(丽水、衢州等),在规模以上工业总产值、人均GDP等方面明显表现不足,一直是主要障碍因子,说明制定的经济发展策略效果尚显不足;同时经济发展力不足也制约了这些城市基础设施、公共服务能力等社会功能方面的供给力,因此相关指标也是这类城市的主要障碍因子。温州、嘉兴、绍兴等城市质量评价值处于中间的城市,也是浙江省经济发展的中等城市,指标层主要障碍因子也集中于规模以上工业总产值、每万人拥有公共交通数量和历史文化名镇(村)数量等。
-
从时间上来看,浙江省各城市发展质量评价结果总体呈现差异性增大的趋势;从空间上来看,高质量城市集中在以杭州和宁波为中心的环杭州湾区域。主要原因是这2个城市人口、经济、基础设施等各项要素资源集聚,有利于城市高效快速发展;同时这2个城市具有较强的辐射效应,形成了杭州都市圈和宁波都市圈,周边的城市,如嘉兴、绍兴、金华、台州、湖州等城市发展质量综合排名和分值较高或者呈上升趋势。但是都市圈也会出现“虹吸作用”及城市间的资源错配,导致周边其他城市吸纳产业、集聚人口能力不足,出现城市发展缓慢的问题,如金华市,近年来出现发展后续动力不足的状况,城市发展质量综合评分值有所降低。温州和丽水的发展相对独立,受杭州和宁波辐射影响较小。温州得益于原来较好的产业经济基础,但近年来城市经济发展速度缓慢,其经济发展子系统是主要障碍因子层,且障碍度有所提升,2019城市发展质量综合评价值已低于嘉兴;丽水良好的发展态势得益于优质的生态环境和人文环境,其中,丽水的生态环境状况指数连续15 a位列浙江省第1位。衢州和舟山2个城市与其他城市差距较大,主要原因是经济薄弱,文旅融合不足,经济发展和文化特质子系统是主要障碍因子层,但这2个城市分别属于杭州都市圈和宁波都市圈,舟山还地处长江三角洲腹地,发展潜力较大。
-
浙江省城市发展质量总体呈上升趋势,并逐渐形成了以杭州和宁波为中心的环杭州湾高质量城市发展群,衢州等经济相对落后地区城市发展质量水平相对滞后,城市间的发展差距在扩大。各城市在生态环境、社会功能、经济发展及文化特质等4个子系统的评价结果存在不均衡现象,其中,经济发展的不均衡现象最为显著,说明浙江省各城市具有不同的发展优势和弱势,体现了发展不平衡和不充分的事实现状。
本研究认为不同地区宜采取针对性的措施,提出如下政策建议:①经济相对发达的城市(杭州和宁波等),需重点关注人口聚集带来的人地关系紧张问题,在发展经济的同时,解决好生态环境保护、公共服务设施完善及城市更新与历史文化遗产保护问题等;②生态环境优势明显的城市(衢州、丽水等),需在良好生态本底基础上,保持生态优先、绿色发展战略,发展生态工业,实施高质量经济发展道路,推进城市基础设施建设,满足居民对高品质美好生活需求;③加强都市圈内城市间的功能性联系,构建一体化综合交通体系,加快社会保障同城化,并根据城市差异性,充分发挥各自的比较优势,实行差异性功能定位,实现都市圈优势互补,形成发展合力;④温州作为传统经济强市,因聚焦自身的历史传统、现有基础和未来发展潜力,强化产业创新升级,培育浙江省经济增长第三极,以打造杭州-宁波-温州“铁三角”。⑤加强各城市历史文化传承、保护与挖掘,把深厚的历史底蕴和丰富的文化遗产,融入城市品质提升规划中,让文化赋能城市品质提升,同时立足各自优势文化资源禀赋,推动文旅融合提档升级。
Spatiotemporal differences and influencing factors of urban development quality in Zhejiang Province
doi: 10.11833/j.issn.2095-0756.20220623
- Received Date: 2022-09-28
- Accepted Date: 2023-05-30
- Rev Recd Date: 2023-05-26
- Available Online: 2023-07-13
- Publish Date: 2023-08-20
-
Key words:
- urban development quality /
- entropy weight-TOPSIS model /
- evaluation /
- obstacle degree /
- Zhejiang Province
Abstract:
| Citation: | ZHANG Yanfei, ZHOU Xiaoguang, WU Yaqi. Spatiotemporal differences and influencing factors of urban development quality in Zhejiang Province[J]. Journal of Zhejiang A&F University, 2023, 40(4): 892-900. DOI: 10.11833/j.issn.2095-0756.20220623

|
 DownLoad: