Volume 41 Issue 1
Feb.  2024
Turn off MathJax
Article Contents

WANG Jianwu, JI Biyong, WANG Zhengyi, ZHU Chenghao. Impact of subtropical forest landscape pattern on forest carbon density in Lishui City of Zhejiang Province[J]. Journal of Zhejiang A&F University, 2024, 41(1): 30-40. doi: 10.11833/j.issn.2095-0756.20230205
Citation: WANG Jianwu, JI Biyong, WANG Zhengyi, ZHU Chenghao. Impact of subtropical forest landscape pattern on forest carbon density in Lishui City of Zhejiang Province[J]. Journal of Zhejiang A&F University, 2024, 41(1): 30-40. doi: 10.11833/j.issn.2095-0756.20230205

Impact of subtropical forest landscape pattern on forest carbon density in Lishui City of Zhejiang Province

doi: 10.11833/j.issn.2095-0756.20230205
  • Received Date: 2023-03-14
  • Accepted Date: 2023-10-12
  • Rev Recd Date: 2023-10-05
  • Available Online: 2024-01-19
  • Publish Date: 2024-02-20
  •   Objective  This study, with an quantitative analysis of the effects of forest landscape pattern on forest carbon density in Lishui City, Zhejiang Province, is aimed to provide theoretical basis for forest management, ecological protection and restoration so as to improve forest carbon sink function.   Method  First, the forest carbon density of the continuous forest inventory plots was measured by using the biomass model and carbon coefficient. Then, the distribution map of regional forest carbon density was formed by ordinary Kriging interpolation before an analysis was conducted of the spatial autocorrelation characteristics of forest carbon density. Lastly, five landscape pattern indicators and three natural factors were selected, and multiscale geographically weighted regression (MGWR) models were used to investigate the effects of forest landscape pattern on forest carbon density, while the spatial non-stationarity affecting the results was analyzed.   Result  From 2012 to 2019, the average forest carbon density in Lishui increased from 23.19 t·hm−2 to 31.96 t·hm−2, and the spatial distribution showed a significant positive spatial autocorrelation. Forest landscape pattern significantly affected forest carbon density, showing different scale effects, and the degree of impact was also different in space. Landscape pattern indexes contagion (CONTAG) and patch density (PD) had a greater driving force on forest carbon density, while largest path index (LPI) had a smaller one.   Conclusion  The effects of forest landscape pattern on forest carbon density showed obvious spatial heterogeneity and the results of this paper can provide reference for making differentiated forest management policies and implementing targeted ecosystem protection and restoration projects. [Ch, 3 fig. 4 tab. 42 ref.]
  • [1] LIN Zhouyu, HAN Renjie, LI Jian.  Courses, characteristics and motivations of spatial and temporal evolution of national forest cities in China . Journal of Zhejiang A&F University, 2024, 41(1): 183-191. doi: 10.11833/j.issn.2095-0756.20230248
    [2] JIAO Xinyu, LONG Mei, LIU Zhixiong.  Spatiotemporal distribution and influencing factors of wild Cymbidium faberi from the perspective of historical geographic information system . Journal of Zhejiang A&F University, 2023, 40(6): 1261-1272. doi: 10.11833/j.issn.2095-0756.20220766
    [3] XU Hao, LI Wei, LIU Wei, WANG Chengkang.  Spatio-temporal evolution of Nanjing’s urban green space pattern and its influencing factors . Journal of Zhejiang A&F University, 2023, 40(2): 407-416. doi: 10.11833/j.issn.2095-0756.20220332
    [4] ZHANG Chenghu, LIU Ju, HU Baoqing, CHEN Xiufen.  Spatial pattern and its influencing factors of water conservation services in Xijiang River Basin, Guangxi . Journal of Zhejiang A&F University, 2022, 39(5): 1104-1113. doi: 10.11833/j.issn.2095-0756.20210616
    [5] HUANG Xiaofen, BAI Ou.  Spatial distribution characteristics and influencing factors of forest villages in Zhejiang Province . Journal of Zhejiang A&F University, 2022, 39(4): 884-893. doi: 10.11833/j.issn.2095-0756.20210558
    [6] HE Sixiao, ZHANG Jianguo.  Spatial distribution characteristics and influencing factors of forest health care brand resources in Zhejiang Province . Journal of Zhejiang A&F University, 2022, 39(1): 180-189. doi: 10.11833/j.issn.2095-0756.20210103
    [7] ZHU Danmiao, CHEN Junhui, JIANG Peikun.  Research progress on soil organic carbon and microbial characteristics of Cunninghamia lanceolata plantation and their influencing factors . Journal of Zhejiang A&F University, 2021, 38(5): 973-984. doi: 10.11833/j.issn.2095-0756.20200598
    [8] WANG Yue, LUAN Yaning, WANG Dan, DAI Wei.  Changes of soil organic carbon storage in Pinus tabulaeformis forest and its influencing factors . Journal of Zhejiang A&F University, 2021, 38(5): 1023-1032. doi: 10.11833/j.issn.2095-0756.20210390
    [9] ZUO Qianqian, WANG Shaojun.  Regulation mechanism of biotic and abiotic factors on the nitrogen mineralization of forest soil . Journal of Zhejiang A&F University, 2021, 38(3): 613-623. doi: 10.11833/j.issn.2095-0756.20200482
    [10] GE Yang, ZHANG Jianguo.  Spatial distribution features and influence factors of forest towns in Zhejiang Province . Journal of Zhejiang A&F University, 2020, 37(2): 374-381. doi: 10.11833/j.issn.2095-0756.2020.02.024
    [11] HE Shanqiong, MENG Cifu, HUANG Zhangting, JIANG Peikun, WU Qifeng, SHEN Jing.  Research progress and forecast of phytolith-occluded organic carbon stability in soil . Journal of Zhejiang A&F University, 2016, 33(3): 506-515. doi: 10.11833/j.issn.2095-0756.2016.03.020
    [12] LI Hongji, CAI Xianfeng, YUAN Jiali, ZENG Yingying, YU Xiaopeng, WEN Guosheng.  Photosynthetic carbon fixation in Phyllostachys edulis during its fast growth period . Journal of Zhejiang A&F University, 2016, 33(1): 11-16. doi: 10.11833/j.issn.2095-0756.2016.01.002
    [13] NIU Xiaodong, JIANG Hong, WANG Fan.  Stable isotope composition for atmospheric water vapor in the forest ecosystem of Mount Tianmu . Journal of Zhejiang A&F University, 2015, 32(3): 327-334. doi: 10.11833/j.issn.2095-0756.2015.03.001
    [14] LU Xinyue, LI Lanying, WAN Chaowei, HUANG Wenjing, LI Lang.  On farmer households’ response to the “Two Separations and Two Exchanges” policy . Journal of Zhejiang A&F University, 2013, 30(5): 734-739. doi: 10.11833/j.issn.2095-0756.2013.05.016
    [15] Lü Kunlong, RAO Liangyi, LI Feifei, LI Huijie, ZHU Mengxun, ZHU Zhenya, ZHOU Jian.  Storage and determinants of coarse woody debris in China’s forests . Journal of Zhejiang A&F University, 2013, 30(1): 114-122. doi: 10.11833/j.issn.2095-0756.2013.01.017
    [16] DU Qun, XU Jun, WANG Jianwu, ZHANG Feng, JI Biyong.  Correlation between forest carbon distribution and terrain elements of altitude and slope . Journal of Zhejiang A&F University, 2013, 30(3): 330-335. doi: 10.11833/j.issn.2095-0756.2013.03.004
    [17] ZHANG Jiajia, FU Weijun, DU Qun, ZHANG Guojiang, JIANG Peikun.  Determinants of spatial distribution of forest litter carbon densities in Zhejiang Province . Journal of Zhejiang A&F University, 2013, 30(6): 814-820. doi: 10.11833/j.issn.2095-0756.2013.06.003
    [18] LI De-hui, LI Xian-wei, WANG Qiao, RONG Li, YANG Miao, LIUShuo.  A review of forest root respiration-determinants and response to global change . Journal of Zhejiang A&F University, 2007, 24(2): 231-238.
    [19] ZHAO Ren-you, WANG Ming-yue, XU Zhen-wang, CHENG Rong-liang, ZHU Zhen-xin, YE Yu-zhu.  Forest injurious plants and their control in Lishui City of Zhejiang Province . Journal of Zhejiang A&F University, 2006, 23(6): 625-628.
    [20] WEN Gui-feng, SUN Fang-li, YU Hong-wei.  Influencing factors of dyeing depth on Castanopsis sclerophylla . Journal of Zhejiang A&F University, 2004, 21(1): 6-9.
  • [1]
    IPCC. An IPCC Special Report on the Impacts of Global Warming of 1.5 above Pre-industrial Levels and Related Global Greenhouse Gas Emission Pathways, in the Context of Strengthening the Global Response to the Threat of Climate Change, Sustainable Development, and Efforts to Eradicate Poverty [M]. Cambridge: Cambridge University Press, 2018: 616.
    [2]
    PINGOUD K, EKHOLM T, SOIMAKALLIO S, et al. Carbon balance indicator for forest bioenergy scenarios [J]. GCB Bioenergy, 2016, 8(1): 171 − 182.
    [3]
    HU Yanqiu, SU Zhiyao, LI Wenbin, et al. Influence of tree species composition and community structure on carbon density in a subtropical forest [J/OL]. PLoS One, 2015, 10(8): e0136984[2023-03-10]. doi: 10.1371/journal.pone.0136984.
    [4]
    LAFLOWER D M, HURTEAU M D, KOCH G W, et al. Climate-driven changes in forest succession and the influence of management on forest carbon dynamics in the Puget Lowlands of Washington State, USA [J]. Forest Ecology and Management, 2016, 362: 194 − 204.
    [5]
    YU Wenmeng, ZHANG Tingting, SU Shipeng, et al. Effects of labor transfer and forest management on forest carbon density based on an empirical study of 253 villages in Fujian Province [J]. Acta Ecologica Sinica, 2022, 42(23): 9820 − 9829.
    [6]
    LIN Yuying, LI Baoyin, QIU Rongzu, et al. Geographic variation of road network effects on forest carbon density based on GWR model: a case study of the upstream district of the Minjiang River [J]. Scientia Geographica Sinica, 2022, 42(6): 1113 − 1123.
    [7]
    REN Yin, YAN Jing, WEI Xiaohua, et al. Effects of rapid urban sprawl on urban forest carbon stocks: integrating remotely sensed, GIS and forest inventory data [J]. Journal of Environmental Management, 2012, 113: 447 − 455.
    [8]
    ZHANG Qiuju, FU Bojie, CHEN Liding. Several problems about landscape pattern change research [J]. Scientia Geographica Sinica, 2003, 23(3): 264 − 270.
    [9]
    WANG Meiling, ZHANG Jichao, WANG Bojian, et al. Dynamics of forest landscape pattern in Changbai Mountain [J]. Chinese Journal of Ecology, 2017, 36(11): 3138 − 3147.
    [10]
    WALZ U. Monitoring of landscape change and functions in Saxony (eastern Germany): methods and indicators [J]. Ecological Indicators, 2008, 8(6): 807 − 817.
    [11]
    LIANG Liang, SCHWARTZ M D. Landscape phenology: an integrative approach to seasonal vegetation dynamics [J]. Landscape Ecology, 2009, 24(4): 465 − 472.
    [12]
    PIRES C A, RIBEIRO M F, VILLA P M, et al. Multiple drivers influence tree species diversity and above-ground carbon stock in second-growth Atlantic forests: implications for passive restoration [J/OL]. Journal of Environmental Management, 2022, 318: 115588[2023-03-12]. doi:10.1016/j.jenvman.2022.115588.
    [13]
    CHEN Yaru. The Response of Forest Productivity and Carbon Storage to Landscape Pattern Change in Three Gorges Reservoir Area [D]. Beijing: Chinese Academy of Forestry, 2017.
    [14]
    MATOS F A, MAGNAGO L F, MIRANDA C A, et al. Secondary forest fragments offer important carbon and biodiversity co-benefits [J]. Global Change Biology, 2020, 26(2): 509 − 522.
    [15]
    CHAPLIN K R, RAMLER I, SHARP R, et al. Degradation in carbon stocks near tropical forest edges [J/OL]. Nature Communications, 2015, 6: 10158[2023-03-12]. doi:10.1038/ncomms10158.
    [16]
    ZHANG Dan. Spatial-temporal Changes of Urban Forest Structure and Carbon Storage under Rapid Urbanization: a Case Study in Changchun [D]. Beijing: University of Chinese Academy of Sciences, 2015.
    [17]
    SONG Jie. Research on Temporal and Spatial Changes of Forest Carbon Storage and Forest Landscape Pattern in Qilian Mountains [D]. Lanzhou: Gansu Agricultural University, 2021.
    [18]
    LÜ Hailiang. Spatial and Temporal Variations of Urban Vegetation and Soil Carbon Storage: a Case Study in Harbin [D]. Beijing: University of Chinese Academy of Sciences, 2017.
    [19]
    TANG Yiwu, SHE Jiyun, HU Biao, et al. Coupling of forest carbon density and landscape pattern index in Haikou [J]. Journal of Northwest Forestry University, 2020, 35(6): 168 − 175.
    [20]
    DU Qun, XU Jun, WANG Jianwu, et al. Correlation between forest carbon distribution and terrain elements of altitude and slope [J]. Journal of Zhejiang A&F University, 2013, 30(3): 330 − 335.
    [21]
    ZHU Chenghao, WANG Zhengyi, JI Biyong, et al. Measurement and spatial econometric analysis of forest carbon sequestration efficiency in Zhejiang Province, China [J/OL]. Forests, 2022, 13(10): 1583[2023-03-12]. doi:10.3390/f13101583.
    [22]
    FOTHERINGHAM A S, YANG Wenbai, KANG Wei. Multiscale Geographically Weighted Regression (MGWR) [J]. Annals of the American Association of Geographers, 2017, 107(6): 1247 − 1265.
    [23]
    LIU Yongting, YANG Zhao, XU Guanglai, et al. Impacts of urbanization on habitat quality using MGWR models in Wanjiang City belt [J]. Scientia Geographica Sinica, 2023, 43(2): 280 − 290.
    [24]
    MA Yong, ZHANG Rui. Spatial pattern and influencing factors of county-scale eco-efficiency: case of the Yangtze River economic belt [J]. Journal of China University of Geosciences (Social Science Edition), 2021, 21(6): 62 − 76.
    [25]
    LI Wenhui, XU Quanli, YI Junhua, et al. Predictive model of spatial scale of forest fire driving factors: a case study of Yunnan Province, China [J/OL]. Scientific Reports, 2022, 12(1): 19029[2023-03-12]. doi:10.1038/s41598-022-23697-6.
    [26]
    ORDWAY E M, ASNER G P. Carbon declines along tropical forest edges correspond to heterogeneous effects on canopy structure and function [J]. Proceedings of the National Academy of Sciences of the United States of America, 2020, 117(14): 7863 − 7870.
    [27]
    DIAO Jiaojiao, LIU Jinxun, ZHU Zhiliang, et al. Active forest management accelerates carbon storage in plantation forests in Lishui, southern China [J]. Forest Ecosystems, 2022, 9(1): 33 − 46.
    [28]
    Technical Committee on Forestry of Standardization Administrator of Zhejiang. Code for Forest Management Inventory: DB33/T 640−2017 [S]. Hangzhou: Market Supervision Administration of Zhejiang Province, 2017.
    [29]
    JI Biyong, TAO Jixing, ZHANG Guojiang, et al. Zhejiang Province’ s forest vegetation biomass assessment for guaranteed accuracy [J]. Journal of Zhejiang A&F University, 2012, 29(3): 328 − 334.
    [30]
    ZHANG Guojiang, JI Biyong, WANG Wenwu, et al. City-county synchronized monitoring system of forest resources in the city with districts under its jurisdiction [J]. Journal of Zhejiang A&F University, 2011, 28(1): 46 − 51.
    [31]
    WU Jianguo. Landscape Ecology: Pattern, Process, Scale and Hierarchy [M]. Beijing: Higher Education Press, 2007.
    [32]
    TALHELM A F, PREGITZER K S, KUBISKE M E, et al. Elevated carbon dioxide and ozone alter productivity and ecosystem carbon content in northern temperate forests [J]. Global Change Biology, 2014, 20(8): 2492 − 2504.
    [33]
    GUSTAFSON E J, MIRANDA B R, de BRUIJN A M, et al. Do rising temperatures always increase forest productivity? Interacting effects of temperature, precipitation, cloudiness and soil texture on tree species growth and competition [J]. Environmental Modelling &Software, 2017, 97: 171 − 183.
    [34]
    LU Chaoqun, SUN Shucun. A review on the distribution patterns of carbon density in terrestrial ecosystems [J]. Acta Phytoecologica Sinica, 2004, 28(5): 692 − 703.
    [35]
    BAI Limin, FENG Xinghua, SUN Ruifeng, et al. Spatial and temporal responses of habitat quality to urbanization: a case study of Changchun City, Jilin Province, China [J]. Chinese Journal of Applied Ecology, 2020, 31(4): 1267 − 1277.
    [36]
    WANG Tian, LU Fuqiang, LI Zuzheng. Study on vegetation landscape connectivity of Changzhou City based on remote sensing data [J]. Journal of Forest and Environment, 2021, 41(2): 188 − 197.
    [37]
    TOBLER W. Computer movie simulating urban growth in the Detroit region [J]. Economic Geography, 1970, 46: 234 − 240.
    [38]
    ZHU Congmou, ZHANG Xiaoling, ZHOU Mengmeng, et al. Impacts of urbanization and landscape pattern on habitat quality using OLS and GWR models in Hangzhou, China [J/OL]. Ecological Indicators, 2020, 117(2): 106654[2023-03-12]. doi:10.1016/j.ecolind.2020.106654.
    [39]
    SHEN Tiyan, YU Hanchen, ZHOU Lin, et al. On hedonic price of second-hand houses in Beijing based on multi-scale geographically weighted regression: scale law of spatial heterogeneity [J]. Economic Geography, 2020, 40(3): 75 − 83.
    [40]
    ZHAO Chunyan. Research on Edge Effect and Coupling Mechanism of Forest Landscape Patches [D]. Changsha: Central South University of Forestry and Technology, 2012.
    [41]
    TIAN Chao, YANG Xinbing, LIU Yang. Edge effect and its impacts on forest ecosystem: a review [J]. Chinese Journal of Applied Ecology, 2011, 22(8): 2184 − 2192.
    [42]
    de LIMA R A, OLIVEIRA A A, PITTA G R, et al. The erosion of biodiversity and biomass in the Atlantic forest biodiversity hotspot [J/OL]. Nature Communications, 2020, 11(1): 6347[2023-03-12]. doi:10.1038/s41467-020-20217-w.
  • 加载中
通讯作者: 陈斌, bchen63@163.com
  • 1. 

    沈阳化工大学材料科学与工程学院 沈阳 110142

  1. 本站搜索
  2. 百度学术搜索
  3. 万方数据库搜索
  4. CNKI搜索

Figures(3)  / Tables(4)

Article views(223) PDF downloads(39) Cited by()

Related
Proportional views

Impact of subtropical forest landscape pattern on forest carbon density in Lishui City of Zhejiang Province

doi: 10.11833/j.issn.2095-0756.20230205

Abstract:   Objective  This study, with an quantitative analysis of the effects of forest landscape pattern on forest carbon density in Lishui City, Zhejiang Province, is aimed to provide theoretical basis for forest management, ecological protection and restoration so as to improve forest carbon sink function.   Method  First, the forest carbon density of the continuous forest inventory plots was measured by using the biomass model and carbon coefficient. Then, the distribution map of regional forest carbon density was formed by ordinary Kriging interpolation before an analysis was conducted of the spatial autocorrelation characteristics of forest carbon density. Lastly, five landscape pattern indicators and three natural factors were selected, and multiscale geographically weighted regression (MGWR) models were used to investigate the effects of forest landscape pattern on forest carbon density, while the spatial non-stationarity affecting the results was analyzed.   Result  From 2012 to 2019, the average forest carbon density in Lishui increased from 23.19 t·hm−2 to 31.96 t·hm−2, and the spatial distribution showed a significant positive spatial autocorrelation. Forest landscape pattern significantly affected forest carbon density, showing different scale effects, and the degree of impact was also different in space. Landscape pattern indexes contagion (CONTAG) and patch density (PD) had a greater driving force on forest carbon density, while largest path index (LPI) had a smaller one.   Conclusion  The effects of forest landscape pattern on forest carbon density showed obvious spatial heterogeneity and the results of this paper can provide reference for making differentiated forest management policies and implementing targeted ecosystem protection and restoration projects. [Ch, 3 fig. 4 tab. 42 ref.]

WANG Jianwu, JI Biyong, WANG Zhengyi, ZHU Chenghao. Impact of subtropical forest landscape pattern on forest carbon density in Lishui City of Zhejiang Province[J]. Journal of Zhejiang A&F University, 2024, 41(1): 30-40. doi: 10.11833/j.issn.2095-0756.20230205
Citation: WANG Jianwu, JI Biyong, WANG Zhengyi, ZHU Chenghao. Impact of subtropical forest landscape pattern on forest carbon density in Lishui City of Zhejiang Province[J]. Journal of Zhejiang A&F University, 2024, 41(1): 30-40. doi: 10.11833/j.issn.2095-0756.20230205
  • 气候变化是人类面临的全球性问题。到2050年,为了将全球升温控制在1.5 ℃以内,必须增加约1亿 hm2森林[1]。森林生态系统是全球陆地生态系统中最大的碳库[2]。森林碳密度是衡量森林生态系统固碳能力的重要指标,其影响机制越来越受到重视,已围绕树种组成[3]、气候驱动变化[4]、森林管护水平[5]、道路网络[6]和城市扩张[7]等自然与人为因素开展了富有成效的研究。

    实际上,景观格局反映了自然与人为因素在不同时空尺度上作用的最终结果,并能够体现各生态过程在不同时空尺度上的相互作用关系[8]。森林景观格局反映了森林景观的组成、空间分布、数量、结构和功能等信息[9],森林景观规模异质性的增加,改变了森林的结构、功能和过程[10],关注森林景观异质性能更好地衡量碳循环等森林生态功能[11]。森林景观如何影响森林储量受到越来越多关注[12],关于森林景观格局对森林碳储量的影响机制也进行了研究。森林景观格局优化可以促进森林碳储量提高[13],扩大斑块面积从而提高森林景观连通性,促进次生林碳储量提升[14],而森林破碎化则会减少森林边缘的碳储量[15]。张丹[16]研究了不同尺度城市森林景观格局与碳储量的相关性,并指出增加森林斑块面积和连结度,减小斑块的平均邻近距离与周长面积比均可增加城市森林碳储量。宋洁[17]分析了祁连山森林景观格局对森林碳储量的相关性,认为增加森林景观面积、景观形状复杂度、景观聚集度和连通性能够提升森林碳储量。吕海亮[18]研究了城市森林碳密度与景观格局关系,认为平均斑块面积与碳密度呈显著正相关,而景观形状指数则与其呈显著负相关。也有学者聚焦森林景观格局对森林碳密度的影响研究,通过耦合协调度模型探究碳密度与森林景观不同组成、分布等特征的关系[19]。然而,量化森林景观格局对森林碳密度影响的研究还不多,且以上研究虽然解析了森林景观格局对森林碳密度的相关性,但很少从空间上解释森林景观对森林碳密度的影响规律。实际上森林碳密度具有空间自相关性[20-21],忽略地理因素的空间非平稳性,易导致结果有偏差或估计效率低下。

    目前,地理加权回归模型(GWR)、空间计量模型、地理探测器等方法已被用于分析研究对象与各类驱动因素之间的空间关联性。其中,GWR解释模型方差比其他模型更有效,且相比于普通最小二乘模型(OLS),能较好地揭示解释变量的空间异质性,但GWR模型是基于恒定带宽,忽略了解释变量尺度作用差异。为此,FOTHERINGHAM等[22]提出了多尺度地理加权(MGWR)模型,解决了不同解释变量在不同尺度同一带宽的问题,即允许在多个空间尺度上建立自变量和因变量的关系模型。MGWR模型已成功应用于生境质量[23]、生态效率[24]、森林火灾[25]等的驱动因素分析,但在森林景观研究中的应用仍处于探索阶段。

    本研究选取了浙江省丽水市为研究区域,采用MGWR模型探究亚热带森林景观格局对森林碳密度的影响机制和空间非平稳性,为研究区域森林碳密度时空特征提供框架,以期为制定国土绿化、森林质量提升政策,因地制宜开展森林保护与管理提供依据。

    • 丽水市位于浙江省西南部,27°25′~28°57′N和118°41′~120°26′E,地貌以丘陵、中山为主,市域面积为1.73万km2。丽水市属中亚热带季风气候,温暖湿润,雨量充沛,具有典型的山地气候。作为南方亚热带重要的集体林区,及浙江省森林资源最为丰富的设区市,截至2019年,丽水市森林面积为142.14万hm2,森林覆盖率为82.27%,森林蓄积量为0.96亿m3,居浙江省前列。近年来,随着快速的城市化和社会发展,该地区土地利用发生了相当大的变化,这对森林提供生态系统服务能力产生了重要影响[26]。同时该地区国家公园和自然保护地建设,以及森林管理活动也对森林碳循环产生了重大影响[27],增强了森林景观格局和森林碳密度的空间异质性。

    • ①土地利用矢量数据来源于浙江省森林资源年度变更成果。将研究区的土地利用分为乔木林地、竹林地、灌木林地、未成林造林地、苗圃地、迹地、宜林地和非林地等8种类型。为更细致刻画森林景观特征,进一步把乔木林地细分为针叶林、阔叶林、针阔混交林等3种类型。地类和树种分类按照DB33/T 640—2017《森林资源规划设计调查规程》[28]执行。②样地数据来源于丽水市716个森林资源连续清查样地(以下简称连清样地)的现场调查,全市以公里格网4 km×6 km间距布设样地,单个样地面积为0.08 hm2,形状为正方形。③数字高程模型来源于地理空间数据云(http://www.gscloud.cn/),分辨率为30 m。④年降水量和年平均气温数据根据资源环境科学与数据中心下载的中国756个气象站观测数据,通过普通Kriging法进行空间插值形成栅格数据,分辨率为30 m。以上数据均取2012和2019年的数据。

    • ①利用2012和2019年连清样地实测的样木数据,将每株样木树种归类至表1所列的树种类型。②使用树高-胸径曲线模型计算单株树(竹)高;③使用冠长模型计算单株树(竹)冠长;④使用单株立木(竹)生物量模型计算各样地内的单株活立木(竹)的地上和地下部分生物量,再通过与含碳率的乘积测算单株活立木(竹)的碳储量;⑤将样地内各株活立木(竹)的碳储量累加形成样地林分水平的碳储量,然后除以样地面积得到森林碳密度。⑥利用ArcMap 10.8的球面半变异函数模型的普通Kriging法,形成丽水市森林碳密度空间分布图。树高-胸径曲线模型、冠长模型、生物量模型见表1,含碳率见表2

      树种类型树高-胸径曲线模型冠长模型生物量模型
      松类 $H = 78.711\,0 + \dfrac{ { - 10\,051.620\,0} }{ {0.984\,8 \; D_{\rm{BH}} + 129.719\,5} }$ $L = 0.908\,2 \; {H^{0.741\,3} }$ ${B_{松类 } } = {B_1} + {B_2} + {B_3}$
      ${B_1} = 0.060\,0 \; {H^{0.793\,4} } \; {D_{\rm{BH} }^{1.800\,5} }$
      ${B_2} = 0.137\,7 \; {L^{0.405\,2} } \; {D_{\rm{BH} }^{1.487\,3} } $
      ${B_3} = 0.041\,7 \; {H^{ - 0.078\,0} } \; {D_{\rm{BH} }^{2.261\,8} }$
      杉类 $H = 119.583\,9 + \dfrac{ { - 24\,448.214\,0} }{ {0.988\,4 \; D_{\rm{BH}} + 205.692\,4} }$ $L = 0.487\,0 \; {D_{\rm{BH}}^{0.170\,7} } \; {H^{0.897\,1} }$ ${B_{ 杉类 } } = {B_1} + {B_2} + {B_3}$
      ${B_1} = 0.064\,7 \; {H^{0.895\,9} } \; {D_{\rm{BH} }^{1.488\,0} }$
      ${B_2} = 0.097\,1 \; {L^{0.034\,6} } \; {D_{\rm{BH} }^{1.781\,4} }$
      ${B_3} = 0.061\,7 \; {H^{ - 0.103\,7} } \; {D_{\rm{BH} }^{2.115\,3} }$
      硬阔类Ⅰ $H = 58.208\,2 + \dfrac{ { - 6\,994.739\,0} }{ {0.984\,8 \; D_{\rm{BH}} + 127.719\,5} }$ $L = 0.631\,6 \; {H^{1.180\,1} } \; {{\rm{e}}^{ - 0.051\,1 \; H} }$ ${B_{ 硬阔类{\text{Ⅰ}} } } = {B_1} + {B_2} + {B_3}$
      ${B_1} = 0.056\,0 \; {H^{0.809\,9} } \; {D_{\rm{BH} }^{1.814\,0} }$
      ${B_2} = 0.098\,0 \; {L^{0.461\,0} } \; {D_{\rm{BH} }^{1.648\,1} }$
      ${B_3} = 0.054\,9 \; {H^{0.106\,8} } \; {D_{\rm{BH} }^{2.095\,3} }$
      硬阔类Ⅱ ${B_{ 硬阔类{\text{Ⅱ}}} } = {B_1} + {B_2} + {B_3}$
      ${B_1} = 0.080\,3 \; {H^{0.781\,5} } \; {D_{\rm{BH} }^{1.805\,6} }$
      ${B_2} = 0.286\,0 \; {L^{0.945\,0} } \; {D_{\rm{BH} }^{1.096\,8} }$
      ${B_3} = 0.247\,0 \; {H^{0.174\,5} } \; {D_{\rm{BH} }^{1.795\,4} }$
      软阔类 $L = 0.441\,3 \; {H^{1.377\,0} } \; {{\rm{e}}^{ - 0.060\,3 \; H} }$ ${B_{ 软阔类 } } = {B_1} + {B_2} + {B_3}$
      ${B_1} = 0.044\,4 \; {H^{0.719\,7} } \; {D_{\rm{BH} }^{1.709\;5} }$
      ${B_2} = 0.085\,6 \; {L^{0.397\,0} } \; {D_{\rm{BH} }^{1.226\;6} }$
      ${B_3} = 0.045\,9 \; {H^{0.106\,7} } \; {D_{\rm{BH} }^{2.024\,7} }$
      乔木经济
       树种类
      $L = 0.618\,9 \; {H^{1.204\,8} } \; {{\rm{e}}^{ - 0.038\,2 \; H} }$ 使用硬阔类Ⅰ的公式
      竹类 $H = 24.557\,0 + \dfrac{ { - 233.809\,9} }{ {D_{\rm{BH}} + 8.434\,3} }$ $L = 0.705\,6 \; {H^{1.174\,8} } \; {{\rm{e}}^{ - 0.060\,1 \; H} }$ ${B_{ 竹类 } } = {B_1} + {B_2} + {B_3}$
      ${B_1} = 0.039\,8 \; {H^{0.577\,8} } \; {D_{\rm{BH} }^{1.854\,0} }$
      ${B_2} = 0.280\,0 \; {L^{0.274\,0} } \; {D_{\rm{BH} }^{0.835\,7} }$
      ${B_3} = 0.371\,0 \; {H^{0.135\,7} } \; {D_{\rm{BH} }^{0.981\,7} }$
        说明:H是树高(m),DBH是胸径(cm),L是冠长(m),B1B2B3分别是单株立木(竹)的树干生物量(kg)、树冠生物量(kg)和树根生物量(kg)。松类包括马尾松Pinus massoniana、湿地松P. elliottii、黄山松P. taiwanensis等树种;杉类包括杉木Cunninghamia lanceolata、水杉Metasequoia glyptostroboides、池杉Taxodiun distichum var. imbricatum等树种;硬阔类Ⅰ包括木荷Schima superba、红楠Machilus thunbergii、樟Camphora officinarum等树干木材密度小于0.7 g·cm−3的树种;硬阔类Ⅱ包括青冈Quercus glauca、苦槠Castanopsis sclerophylla、栎类Quercus等树干木材密度大于0.7 g·cm−3的树种;软阔类包括桤木Alnus cremastogyne、槭树Acer miyabei、檫木Sassafras tzumu等树种;乔木经济树种类包括栗Castanea mollissima、枇杷Eriobotrya japonica、香榧Torreya grandis ‘Merrillii’等树种;竹类包括刚竹Phyllostachys sulphurea、毛竹Ph. edulis、早竹Ph. violascens等。

      Table 1.  Height-diameter curves model, crown length model and biomass model

      树种含碳率树种含碳率树种含碳率
      冷杉Abies fabri 0.499 9 柳杉Cryptomeria japonica var. sinensis 0.523 5 杨树Populus 0.495 6
      云杉Picea asperata 0.520 8 水杉Metasequoia glyptostroboides 0.501 3 硬阔类 0.483 4
      铁杉Tsuga chinensis 0.502 2 樟树Cinnamomum camphora 0.491 6 软阔类 0.495 6
      柏木Cupressus funebris 0.503 4 楠木Phoebe zhennan 0.503 0 针叶混交林 0.510 1
      黑松Pinus thunbergii 0.514 6 栎类Quercus 0.500 4 阔叶混交林 0.490 0
      华山松Pinus armandii 0.522 5 桦木类Betula 0.491 4 针阔混交林 0.497 8
      油杉Keteleeria fortunei 0.499 7 椴树Tilia tuan 0.439 2 竹类 0.504 2
      马尾松Pinus massoniana 0.459 6 檫木Sassafras tzumu 0.484 8 乔木经济树种 0.483 4
      高山松Pinus densata 0.500 9 桉树Eucalyptus 0.525 3 其他树种 0.500 0
      杉木Cunninghamia lanceolata 0.520 1 木麻黄Casuarina equisetifolia 0.498 0

      Table 2.  Carbon contents of species

      为验证碳密度空间分布结果精度可靠性,基于已有数据,先将空间分布结果由栅格转为矢量面要素的格网,并裁切提取出丽水市行政范围内的格网;再将每个格网的面积与其碳密度相乘并汇总加和得到丽水市森林碳储量;然后按照文献[29]所述的系统抽样统计方法,基于连清样地计算丽水市森林碳储量的估计中值、估计精度和估计区间;最后根据文献[30],基于空间分布结果计算的森林碳储量如落入估计区间,则说明该结果是有精度保证的,森林碳储量是碳密度乘以丽水市面积得到,也可说明森林碳密度空间分布结果是有精度保证的。

    • 选择5个常用且相关性较低的景观指标:香农多样性指数(SHDI)、最大斑块指数(LPI)、斑块密度(PD)、蔓延度指数(CONTAG)、景观形状指数(LSI)。各指标的含义和计算公式见文献[31]。另外,本研究选择了年平均降水量(PREP)、年平均气温(TEMP)、海拔(ELEV)作为控制变量。气温和降水量是影响森林固碳能力最常见的气候要素,其影响是双向的。气温会影响植被光合作用和净初级生产力,从而影响森林生长[32],但高温引起的呼吸增加可能使碳储量随着温度升高而减少[33]。一定范围内的水资源会促进森林的生长,水分过多则会抑制土壤呼吸,影响植物生长[34]。使用Fragstats 4.2软件,参照已有对市级尺度的景观研究[35-36],选取5 km×5 km为窗口大小,采用移动窗口法生成各景观指标栅格图,基于ArcMap 10.8生成4 km×4 km的格网(研究区共计1 204个网格),对每个格网的景观格局指标数值和控制变量数值分区统计。

    • 地理学第一定律表明,在涉及具有地理空间的数据时,事物之间距离越近关联性越大[37]。采用Global Moran’ s I和Local Moran’ s I来描述森林碳密度的全域和局部聚类特征。计算公式可见文献[38]。Moran’ s I介于−1到1之间,>0表示存在正相关性,<0表示存在负相关性, 0表明不存在空间自相关。使用GeoDa 1.12绘制LISA (local indicators of spatial association)图,反映森林碳密度的空间格局,LISA图包括4个类别,“高—高”和“低—低”表示空间正相关,“高—低”和“低—高”表示空间负相关。Global Moran’ s I也将用于量化MGWR模型的残差空间自相关,如果残差存在显著的空间自相关,则表明模型中缺失了关键解释变量。

    • 采用MGWR模型探究森林景观格局对森林碳密度的多尺度影响。MGWR模型通过不断寻找各解释变量的最优带宽并不断更新参数估计值,直至系数迭代收敛,从而形成最终回归结果[39]。该模型如下:

      其中,yi是格网i的被解释变量;xij是格网i的第j个解释变量;$ {\beta _{{bw}j}}\left( {{u_i},{v_i}} \right) $为格网i的第j个解释变量的局部回归系数,(ui, vi)为格网i的空间位置,bwj为第j个解释变量回归系数所使用的带宽bwm为解释变量的个数;εi为误差项。本研究采用MGWR 2.2进行模型构建,MGWR形式选择Gaussian,空间Kernel类型选择Adaptive Bisquare函数,带宽搜寻方法采用Golden Section,模型最优化准则采用AICc准则。

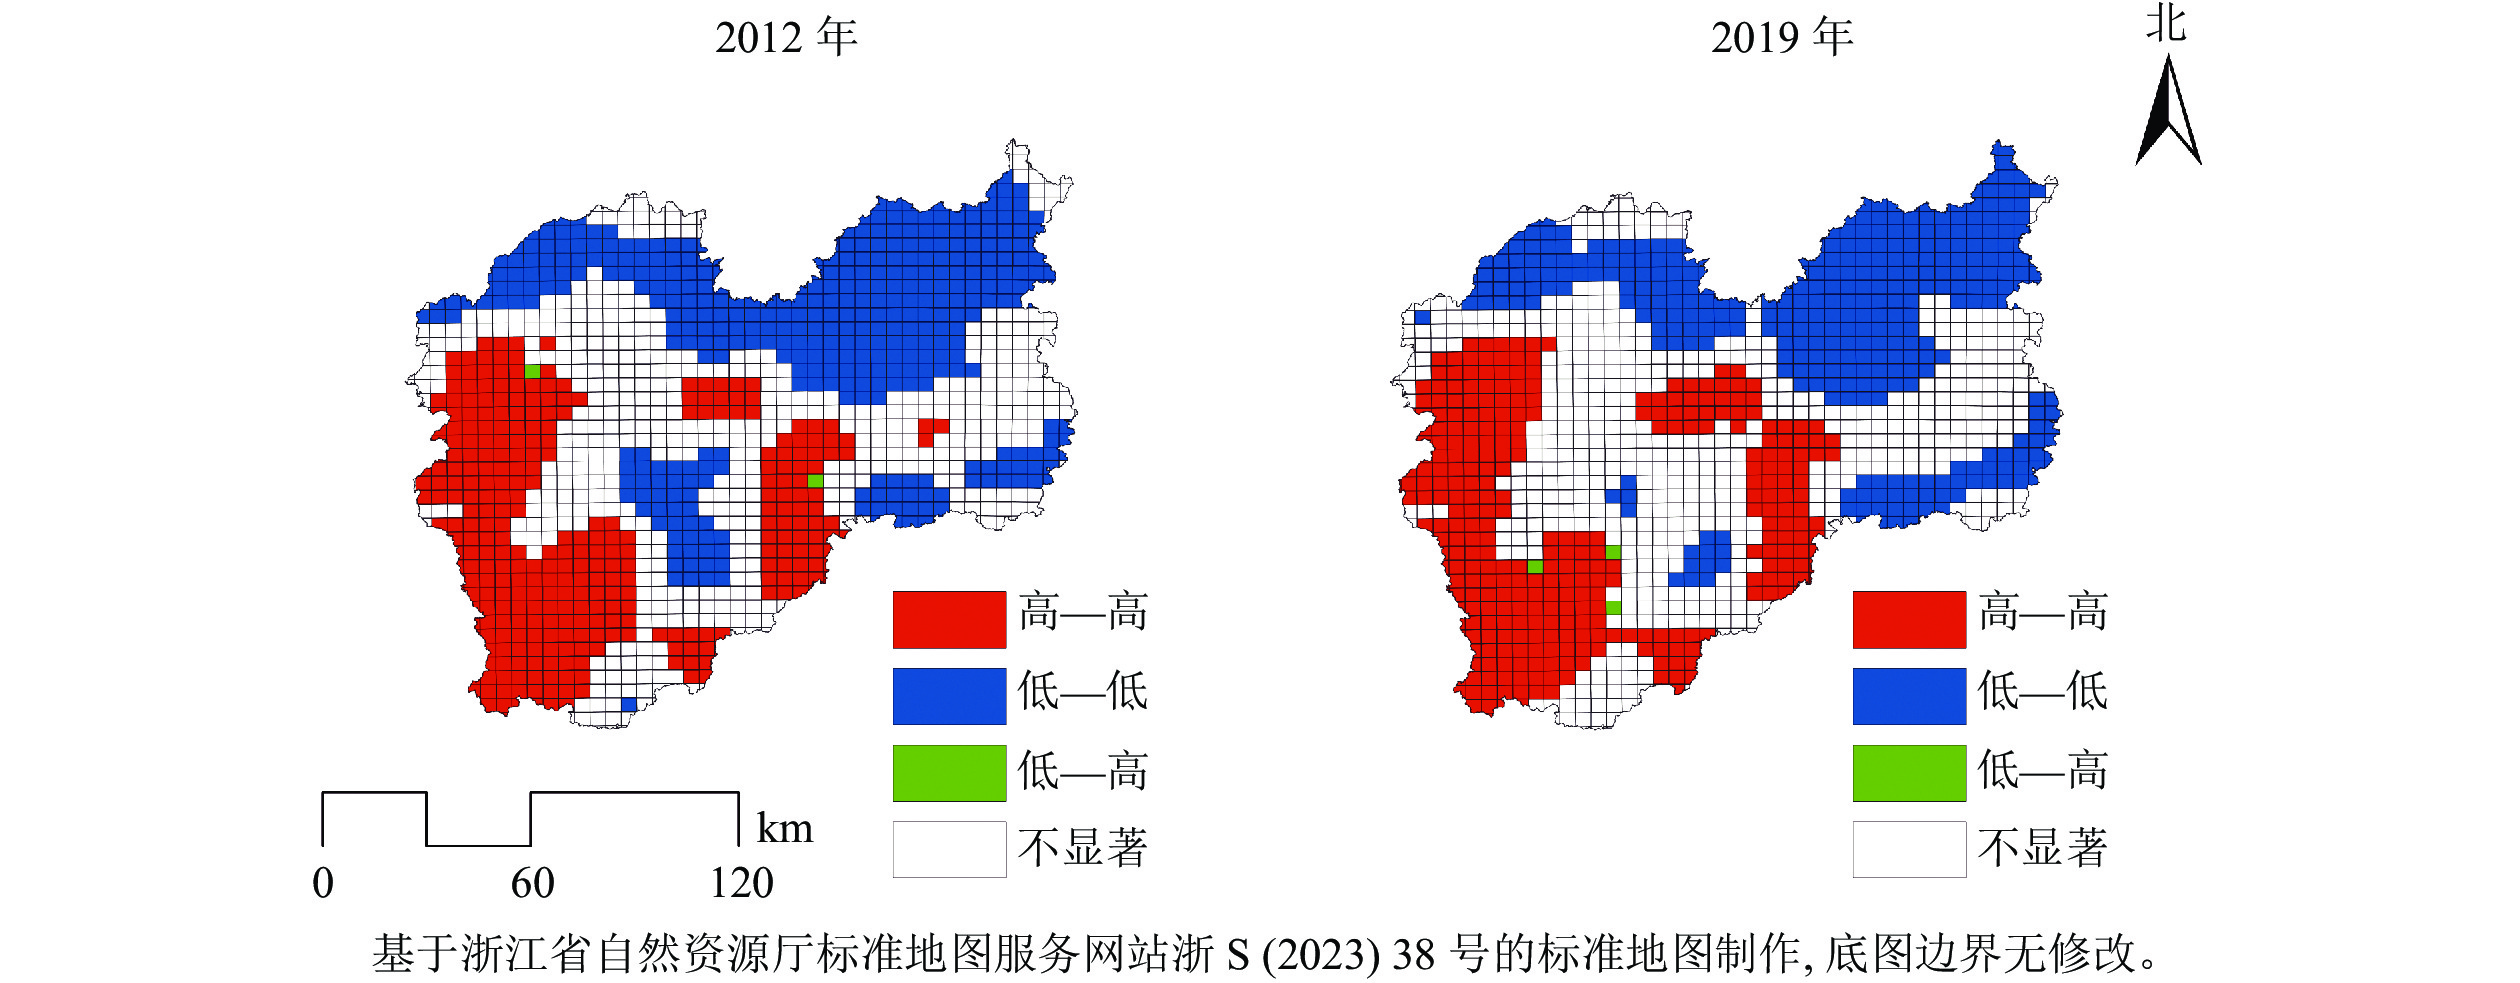
    • 2012—2019年,研究区森林碳密度平均值从23.19 t·hm−2提高到31.96 t·hm−2,年均增量为1.25 t·hm−2。根据研究区森林资源连续清查结果,森林面积和森林蓄积量分别从2012年的132.81万hm2和0.65亿m3增加到142.14万hm2和0.96亿m3,年均分别增加1.33万hm2和0.04亿m3,森林面积和森林蓄积量逐年上升促进了森林碳密度增加。森林碳密度空间分布格局存在显著差异,低森林碳密度主要在研究区的北部、西部和西南部的森林碳密度较高(图1)。2012和2019年研究区的Global Moran’ I分别为0.889和0.891 (P<0.01),表明森林碳密度较高或较低区域趋于聚集。由图2发现:①“高—高”区域主要分布在西南部和中南部地区。西南部是瓯江源头,拥有钱江源-百山祖国家公园百山祖园区等多处自然保护地,得益于较少的人为干扰、公益林保护和森林生态保护修复,森林质量高。②“低—低”区域主要分布在北部,北部地区包含松谷平原和碧湖平原,这些地区耕地、建筑用地较多,受人类活动影响频繁。③“低—高”区域分布极少,说明出现周围森林碳密度高而本地森林碳密度低的空间结构概率较低。

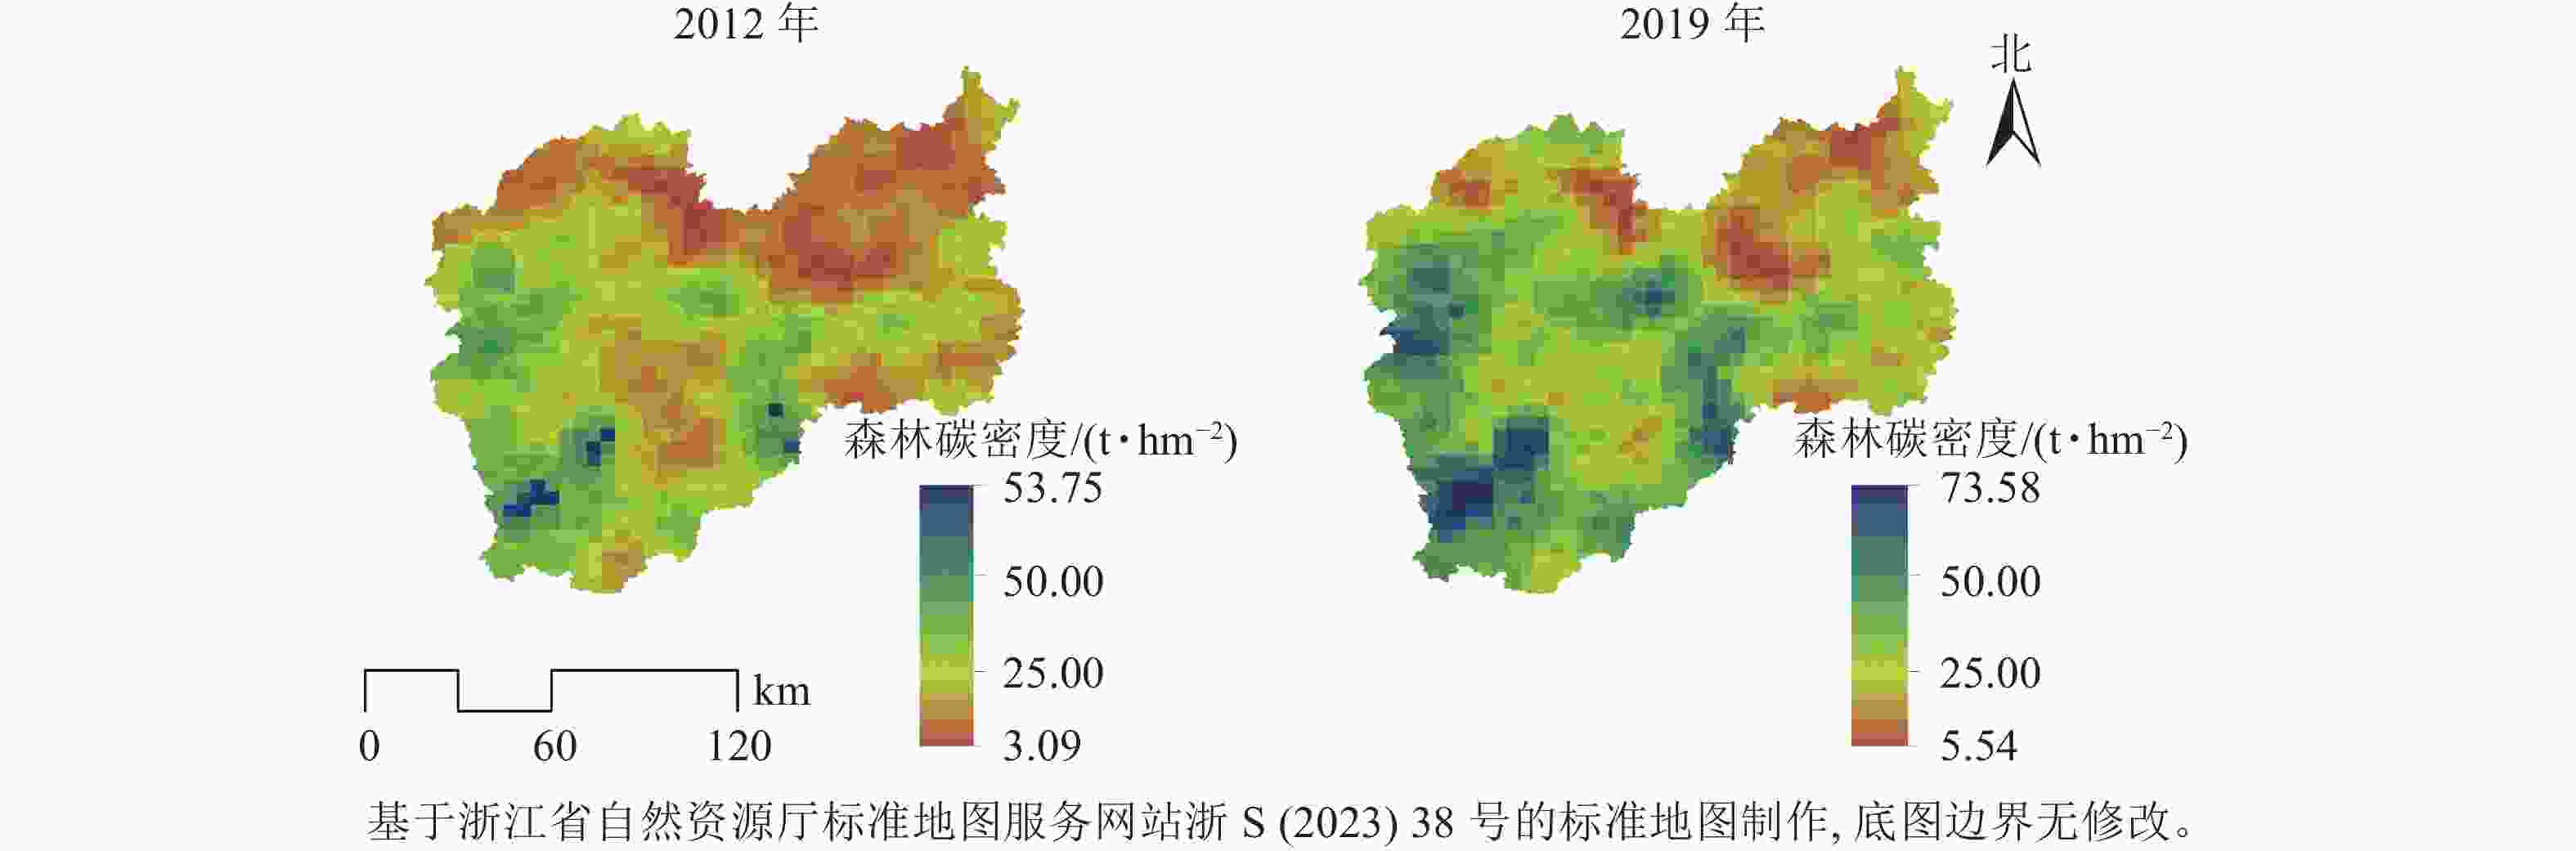
      Figure 1.  Spatial distribution map of forest carbon density in Lishui City

      Figure 2.  Spatiotemporal characteristics of LISA map of forest carbon density in Lishui City

      基于丽水市连清样地,系统抽样统计结果(表3)表明:2012年全市森林碳储量估计中值为4 023.48万t,估计区间为(3 729.05~4 317.90)万t,估计精度为92.68% (P<0.05)。2019年全市森林碳储量估计中值为5 541.19万t,估计区间为(5 192.46~5 889.91)万t,估计精度93.71%为(P<0.05)。2012和2019年基于空间分布结果计算的森林碳储量分别为4 023.08万t和5 543.42万t,均位于相应年份的估计区间内,说明森林碳密度空间分布结果是有精度保证的。

      年份基于空间分布结果的
      计算值/万t
      样地森林碳储量
      均值/t
      基于连清样地的
      计算值/万t
      基于连清样地计算值的
      估计区间/万t
      估计精度/%
      20124 023.081.864 023.48(3 729.05, 4 317.90)92.68
      20195 543.422.575 541.19(5 192.46, 5 889.91)93.71

      Table 3.  Forest carbon storage in Lishui City based on the continuous forest inventory and spatial distribution of forest carbon density, respectively

    • 表4可见:2012和2019年的MGWR模型的Adj-R2分别达0.898和0.892。模型的带宽包含44、79、992和1 204,由于研究区被划分为1 204个网格,因此从行政边界角度看,带宽992和1204的空间尺度可定义为市级,44和79可定义为县级。LSI带宽为44,作用尺度较小,表明景观形状复杂度对森林碳密度的影响在空间上存在较大差异。CONTAG、LPI和SHDI的带宽都较大,说明森林景观连通性、面积优势度和景观多样性对森林碳密度影响的空间差异相对较小,也表明上述3个影响因素回归系数空间异质性较不明显。PD带宽从79升至1 204,作用尺度在扩大,意味着景观破碎化程度对森林碳密度影响的空间差异在变小。

      年份变量带宽均值标准差最小值中位数最大值正值/%负值/%
      2012 CONTAG 992 −0.107 0.001 −0.108 −0.107 −0.106 0 100
      PD 79 −0.045 0.129 −0.322 −0.077 0.493 23.84 76.16
      LPI 1 204 −0.016 0.067 −0.212 −0.021 0.206 38.04 61.96
      LSI 44 −0.019 0.054 −0.198 −0.017 0.139 27.74 72.26
      SHDI 1 204 −0.069 0.001 −0.071 −0.069 −0.068 0 100
      PREP 44 −0.013 0.573 −1.661 −0.010 1.793 48.59 51.41
      TEMP 44 −0.619 1.335 −7.906 −0.704 1.557 37.54 62.46
      ELEV 44 0.150 0.133 −0.126 0.132 0.554 90.28 9.72
      常数项 44 0.683 0.393 −0.063 0.629 1.990 99.58 0.42
      局部R2 0.916 0.774 0.116 0.178 0.792 0.959
      Adj-R2 0.898
      AICc 968.668
      残差平方和 101.026
      有效参数数量 218.323
      残差Global Moran’ I 0.019 3 (P = 0.092)
      2019 CONTAG 1 204 −0.047 0.001 −0.049 −0.047 −0.045 0 100
      PD 1 204 −0.092 0.099 −0.465 −0.095 0.135 16.69 83.31
      LPI 1 204 −0.004 0.082 −0.190 −0.013 0.309 43.02 56.98
      LSI 44 0.041 0.023 0.007 0.041 0.079 100 0
      SHDI 1 204 −0.055 0.006 −0.066 −0.055 −0.045 0 100
      PREP 44 0.113 0.618 −1.400 0.011 1.376 51.41 48.59
      TEMP 44 0.196 0.550 −1.636 0.210 2.421 65.95 34.05
      ELEV 44 0.152 0.129 −0.162 0.154 0.517 86.88 13.12
      常数项 44 −0.256 0.444 −1.122 −0.196 0.692 34.88 65.12
      局部R2 0.911 0.783 0.116 0.221 0.810 0.966
      Adj-R2 0.892
      AICc 1 018.145
      残差平方和 107.759
      有效参数数量 208.759
      残差Global Moran’ I 0.048 8 (P= 0.002)
        说明:SHDI为香农多样性指数;LPI为最大斑块指数;PD为斑块密度;CONTAG为蔓延度指数;LSI为景观形状指数;PREP为年平均降水量;TEMP为年平均气温;ELEV为海拔。

      Table 4.  MGWR model performance and descriptive statistics for regression parameters
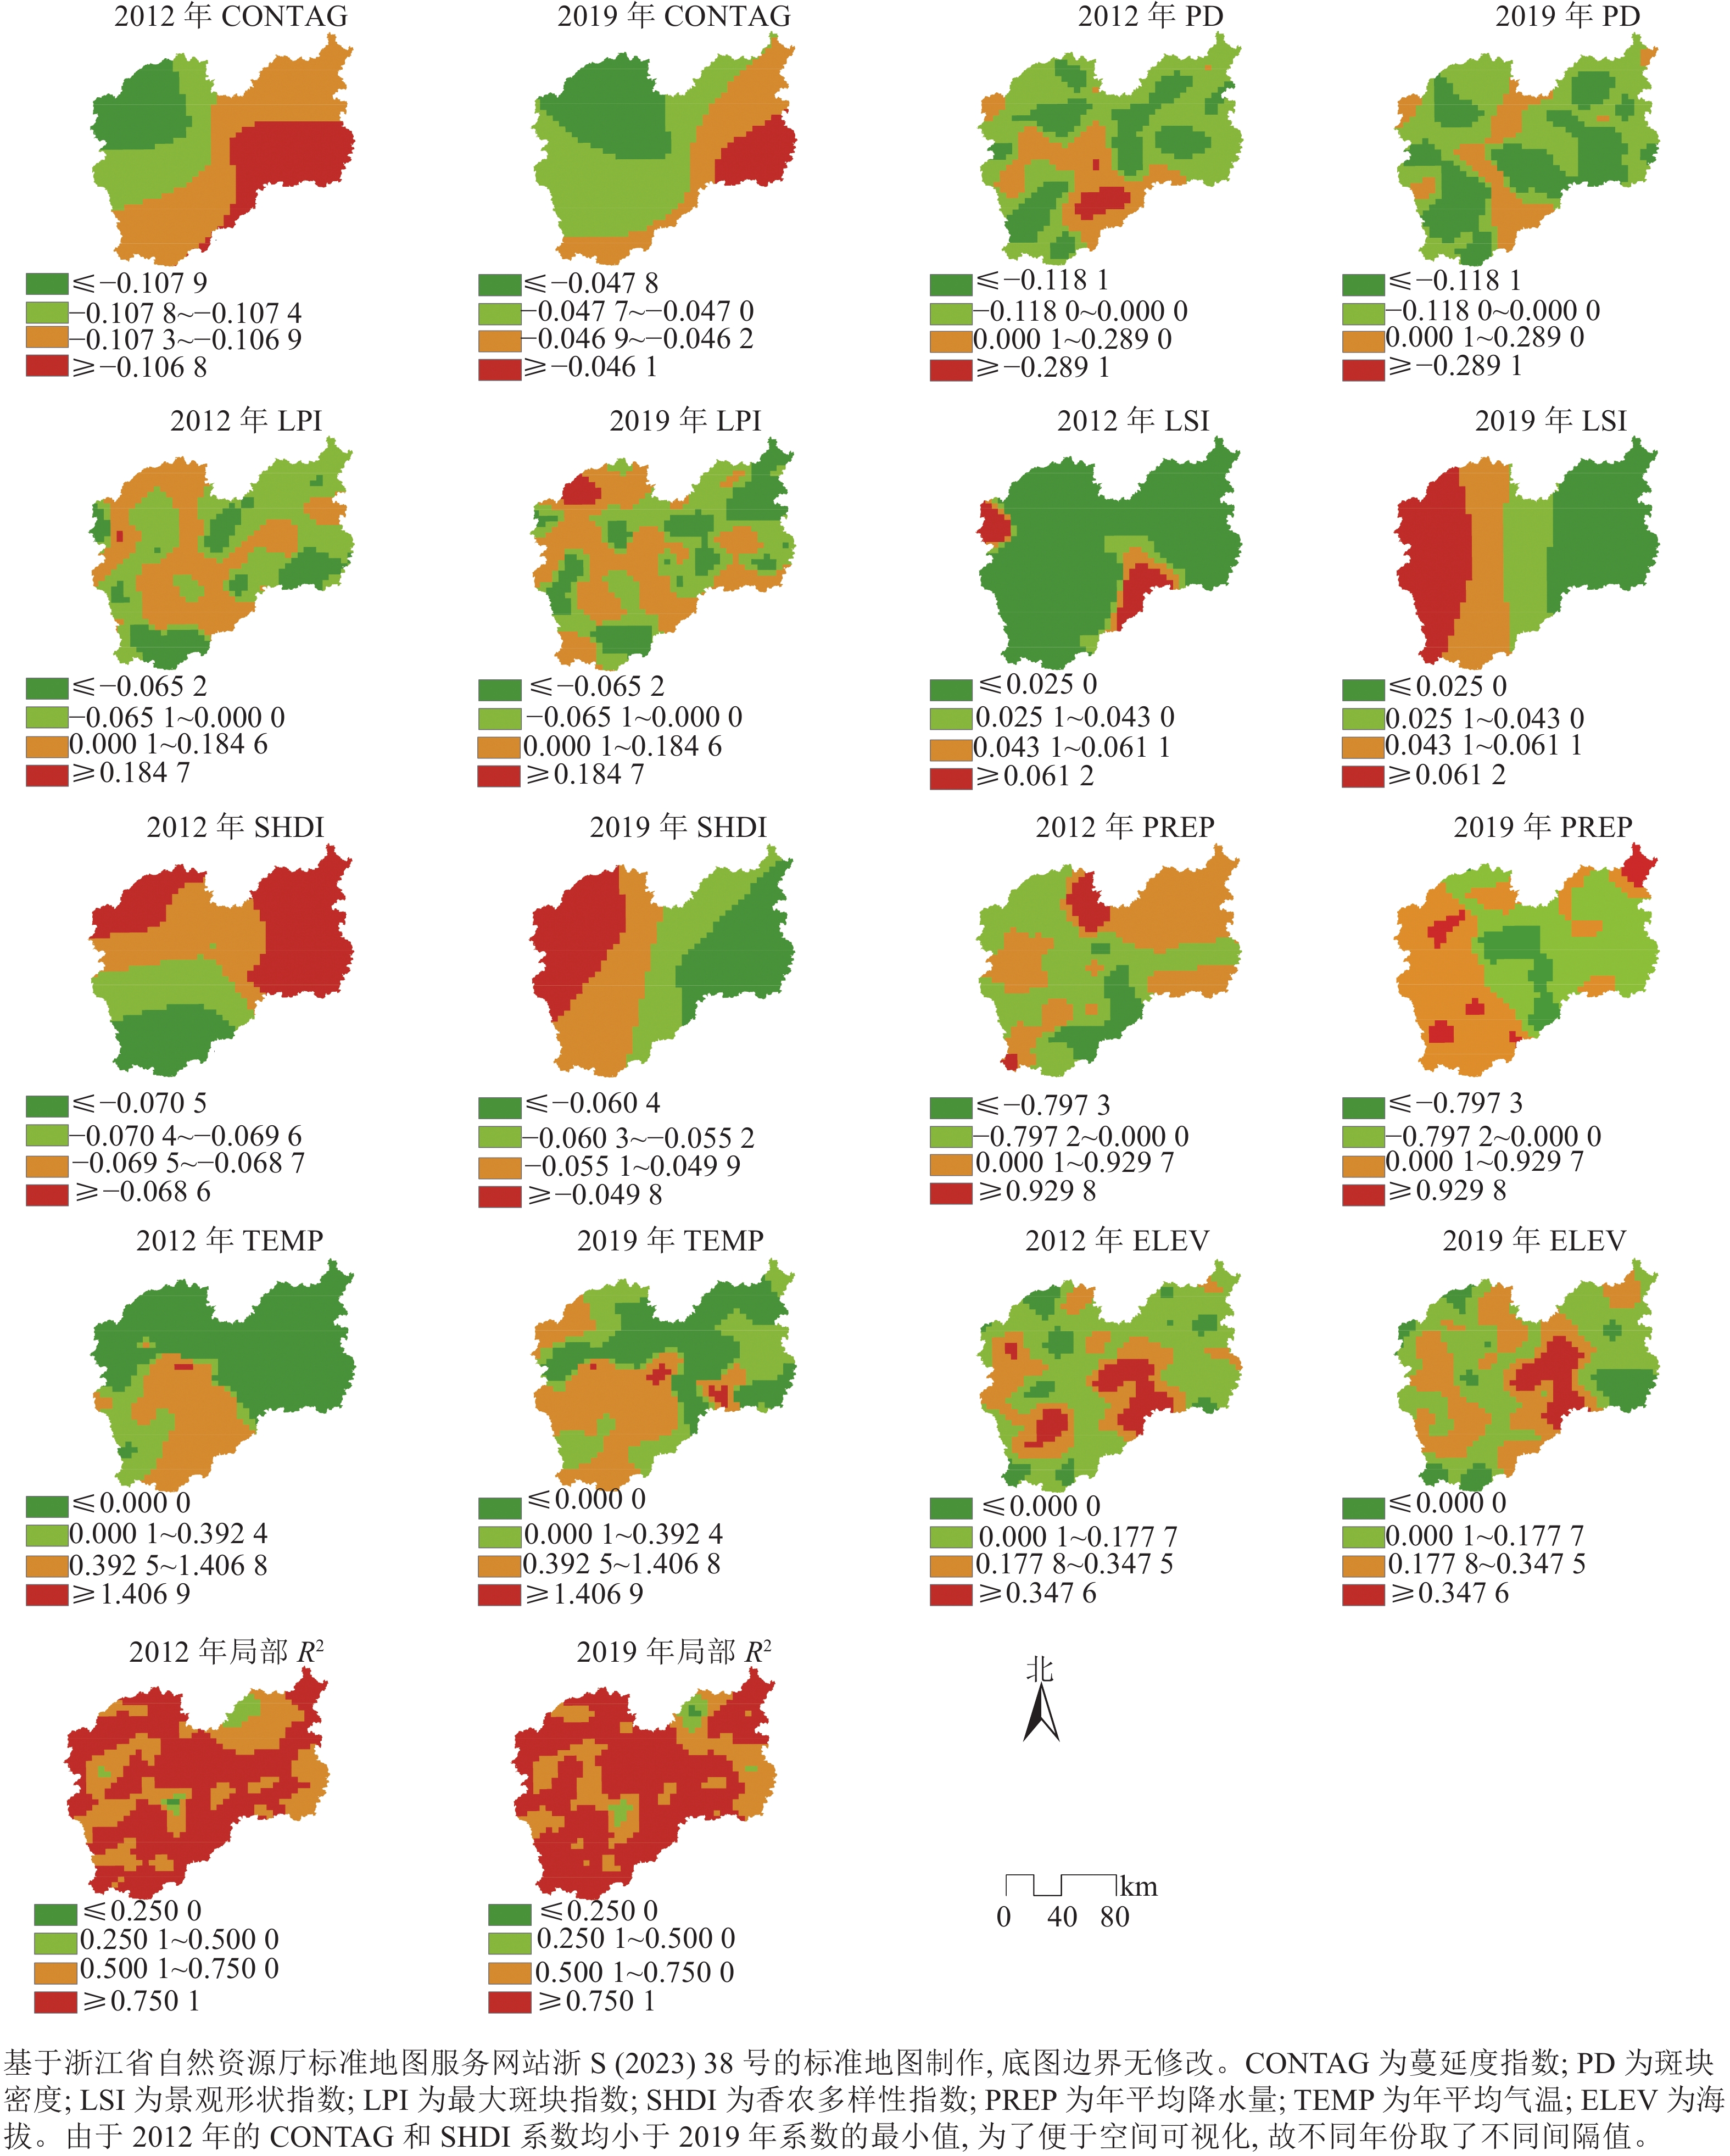
    • 表4可见:从景观格局指标的回归参数2期均值的绝对值看, CONTAG对森林碳密度影响最大,其次是SHDI和PD,LPI和LSI相对影响较小。从图2的局部R2看,研究区大部分区域拟合优度较高,模型可以揭示研究区2012年森林碳密度总变化的17.8%~95.9%和2019年的22.1%~96.6%。从各影响因素beta系数的正负值占比看,除CONTAG和SHDI外,其余景观格局的参数估计值正负情况都存在,即对森林碳密度表现不同效应影响,说明MGWR模型能将系数的局部特征呈现出来。

    • 图3可见:2012和2019年,CONTAG对森林碳密度的负向影响均从研究区的西北向东南下降,但对森林碳密度的负向驱动力在研究期间逐渐减弱。这可能是因为西北部包含了松古平原,同时遂昌县境内分布有若干小盆地,斜坡平缓,茶叶等经济林种植面积广,应当通过加强农田林网建设和平原绿化增加片状森林面积,降低经济树种的景观连通度,提高区域森林碳密度。PD系数在研究区范围内以负值为主,并且负值区域在逐渐增多,说明降低森林破碎化程度一定程度上可减少对森林碳密度的负向影响。LPI系数以负值为主,意味着大部分区域需要减少人为干扰,维持植被自然生长状态。从2012年到 2019年,LPI系数正值区域有所增加,在西北部和中西部等区域与森林碳密度呈正相关关系,说明这些地方通过适当增加森林抚育、补植造林等措施,能够对提高森林碳密度产生积极影响。从2012年到2019年,LSI对森林碳密度的驱动力逐渐增强。说明在一定程度上,随着斑块形状的复杂度增加,森林碳密度也会随之增加。2019年,LSI对森林碳密度的正向影响由西向东下降,这表明相对于研究区东部,西部森林斑块复杂程度的增加对森林碳密度的正向影响更大。这可能是因为森林景观斑块形状复杂,能够促进斑块边缘的植被形成高效率的能量共生网络[40],增强森林的边缘效应,而斑块边缘通常具有较高的初级生产力[41]。从2012年至2019年,SHDI对森林碳密度的负向驱动力逐渐减弱,形成负向影响由西向东增加的格局,说明研究区的林分种类分布比较均匀。年平均降水量系数总体上呈现由东部大于西部转变为西部大于东部的趋势,但2期正向与负向影响区域的数量差异较小。年平均气温对森林碳密度的正向影响区域逐渐增多,而海拔系数空间分布差异不大。2019年,年平均降水量主要在西部和西南部与森林碳密度呈正相关关系,其余区域主要呈负相关关系。年平均气温系数空间分布与年平均降水量有一定相似,主要在西南部和西北部与森林碳密度呈正相关关系。研究区的绝大部分区域的海拔与森林碳密度呈正相关关系,并且中部区域的正相关关系更强。年平均降水量、年平均气温系数正值分布区域包含了钱江源-百山祖国家公园百山祖园区、九龙山国家级自然保护区、括苍山省级森林公园,充分利用丰富的水热资源,加强自然保护地内森林生态系统保护修复,有助于提高森林碳密度。

      Figure 3.  Spatial pattern of MGWR model coefficient and local R2

    • 本研究发现:森林碳密度具有显著的空间自相关性,考虑影响因素的空间尺度对模型的结果会产生重大影响。MGWR模型拟合结果表明,斑块密度、最大斑块指数、年平均降水量、年平均气温和海拔等变量在不同区域的回归系数既有正值也有负值,因MGWR模型使用自适应带宽,可以更精确地探索驱动因素对森林碳密度的作用机制和空间异质性影响,并明确各驱动因素的具体影响尺度。

    • 森林景观格局对森林碳密度影响表现出不同大小的驱动力和多尺度空间特征,不同尺度需要关注的影响因素是不同的,因此林业管理者可以根据这些特征制定宏观与微观的政策。在市级层面,林业管理者需要加强农田林网和生态廊道建设,降低纯林的景观连通度,同时对生态保护修复进行全区域尺度的管理,将森林恢复和减少森林破碎化战略纳入空间规划中,减少山区森林生态系统中人为干扰和森林破碎化,以提高森林碳密度的整体水平。在县级尺度上,通过合理配置森林景观组成可以有效增强森林固碳量[42],并发挥森林组成成分间相互作用效能,发挥森林边缘效应优势。

    • 区域森林碳密度计算是一项复杂的研究任务且有多种计算方法,如采用CASA模型计算植被净初级生产力(NPP),再将其转换为固碳量,或采用InVEST模型计算固碳量。森林碳密度受各种因素的影响,本研究是在系统布设的固定样地计算结果基础上,采用空间插值形成区域森林碳密度,计算方法在某些方面可能仍需改进。由于缺少灌木林实测数据,本研究未测算样地内的灌木林碳储量。随着尺度增加,森林碳密度的影响因素也愈加复杂,由于景观格局具有尺度依赖性,MGWR模型作为线性回归模型,对愈加复杂的影响因素解释能力需进一步探讨。此外,本研究使用边长4 km正方形的网格尺度来创建景观格局指标,并探究其与森林碳密度的关系,这个尺度可能更适用于建模,对实际森林管理会有不便。在未来研究中可以以乡镇、村级行政单位为建模单元,进一步增强模型结果的实际应用性。鉴于森林碳密度的空间自相关性,可以考虑使用空间计量模型进一步探究森林碳密度对森林经营管理和经济社会发展的响应机制。

    • 本研究以浙江省丽水市为研究区,使用MGWR模型探讨了森林景观格局对森林碳密度的影响。 2012和2019年,森林碳密度的空间自相关度分别为0.889和0.891,呈显著的空间自相关性。森林景观格局对森林碳密度的影响在空间上存在非平稳性,CONTAG和SHDI存在负向影响,PD、LPI、LSI在空间上正向和负向影响并存。森林景观格局也表现出不同尺度效应,CONTAG、LPI、SHDI的作用尺度较大,LSI作用尺度较小。基于研究结果,建议进一步重视森林经营管理的空间决策支持,因地制宜实施自然演替和人工干预相结合的森林生态系统保护修复措施,促进森林生态系统碳汇功能提升。

Reference (42)

Catalog

    /

    DownLoad:  Full-Size Img  PowerPoint
    Return
    Return