Volume 42 Issue 1
Jan.  2025
Turn off MathJax
Article Contents

LI Keyu, CHEN Rong, LIU Lian, et al. Genetic variation of seed traits and SSR markers in female Torreya grandis[J]. Journal of Zhejiang A&F University, 2025, 42(1): 94−102 doi:  10.11833/j.issn.2095-0756.20240254
Citation: LI Keyu, CHEN Rong, LIU Lian, et al. Genetic variation of seed traits and SSR markers in female Torreya grandis[J]. Journal of Zhejiang A&F University, 2025, 42(1): 94−102 doi:  10.11833/j.issn.2095-0756.20240254

Genetic variation of seed traits and SSR markers in female Torreya grandis

DOI: 10.11833/j.issn.2095-0756.20240254
  • Received Date: 2024-03-22
  • Accepted Date: 2024-05-28
  • Rev Recd Date: 2024-05-14
  • Available Online: 2025-01-20
  • Publish Date: 2025-02-20
  •   Objective  This study is to investigate the seed traits of female Torreya grandis, analyze the genetic variation of the population based on SSR primers, and compare the differences in seed phenotype, quality, and genetic diversity between and within populations of T. grandis.   Method  Female T. grandis from Fuyang, Shengzhou, Lin’an, Jiande in Zhejiang Province and Mount Huangshan in Anhui Province were used as materials to compare the phenotypic traits of T. grandis leaves and seeds through variance analysis and principal component analysis. The genetic diversity of T. grandis was compared by SSR molecular markers using female T. grandis from Fuyang, Shengzhou, Lin’an, Chun’an and Mount Huangshan as raw materials.   Result  Analysis of seed traits revealed that there were significant individual differences (P<0.01) in 8 indicators: leaf quality, leaf shape index, seed mass, seed shape index, seed weight, kernel shape index, seed coat thickness, and shell thickness between and within populations. The relative fat content and soluble sugar content also showed extremely significant differences among populations (P<0.01), with fat content ranging from 29.36% to 42.35%, indicating rich variation in T. grandis seed appearance and kernel quality. SSR primer analysis showed that the mean Nei’s genetic diversity index (H) was 0.400, the mean Shannon’s information index (I) was 0.650, and the mean polymorphic information content (PIC) was 0.400. Chun’an population exhibited the highest genetic diversity (H=0.410, I=0.658), while Shengzhou population showed the lowest (H=0.369, I=0.565). 92% of the total genetic variation existed within the population.   Conclusion  There are genetic variations in the phenotype and quality of T. grandis between and within populations. The genetic diversity of Chun’an population is the highest, and the genetic variation within the population is greater than that between populations. [Ch, 2 fig. 11 tab. 26 ref.]
  • [1] YAN Shu, WEI Ruping, WANG Runhui, HUANG Rong, ZHENG Huiquan.  Variation and selection of half-sib families of Falcataria falcata during seedling stage . Journal of Zhejiang A&F University, 2024, 41(2): 306-313. doi: 10.11833/j.issn.2095-0756.20230371
    [2] ZHENG Liuhui, ZHAN Liyun, HOU Yu, YU Weiwu, ZENG Yanru, DAI Wensheng.  SSR analysis of genetic diversity of male Torreya grandis . Journal of Zhejiang A&F University, 2022, 39(2): 329-337. doi: 10.11833/j.issn.2095-0756.20210279
    [3] YUAN Ya’nan, LI Zhengcai, WANG Bin, ZHANG Yujie, HUANG Shengyi.  Stoichiometric characteristics of soil C, N and P in Torreya grandis stands of different ages . Journal of Zhejiang A&F University, 2021, 38(5): 1050-1057. doi: 10.11833/j.issn.2095-0756.20200761
    [4] YAN Yanbing, PAN Huixin.  Genetic variation and selection of seedling traits in hybrid progeny of Populus deltoides . Journal of Zhejiang A&F University, 2021, 38(6): 1144-1152. doi: 10.11833/j.issn.2095-0756.20200803
    [5] ZHAN Liyun, LIU Lian, ZENG Yanru, YU Weiwu, DAI Wensheng.  Phenotypic diversity of male cones and the selection of superior plants among male populations in Torreya grandis . Journal of Zhejiang A&F University, 2020, 37(6): 1120-1127. doi: 10.11833/j.issn.2095-0756.20190676
    [6] YIN Huanhuan, LIU Qinghua, ZHOU Zhichun, WAN Xueqin, YU Qixin, FENG Zhongping.  Genetic variation of wood basic density and fiber morphology and selection of Pinus massoniana . Journal of Zhejiang A&F University, 2020, 37(6): 1186-1192. doi: 10.11833/j.issn.2095-0756.20190720
    [7] YE Shuyuan, DONG Leiming, DONG Ang, YU Weiwu, DAI Wensheng, ZENG Yanru.  Estimation of genetic parameters for juvenile growth of half-sib seedlings of Torreya grandis . Journal of Zhejiang A&F University, 2020, 37(4): 817-822. doi: 10.11833/j.issn.2095-0756.20190542
    [8] DONG Leiming, ZENG Yanru, WU Yufen, HUANG Yinzhi, WU Dong, DAI Wensheng.  Variations in phenotypic traits and chemical compositions of seeds from a natural population in Torreya grandis . Journal of Zhejiang A&F University, 2014, 31(2): 224-230. doi: 10.11833/j.issn.2095-0756.2014.02.010
    [9] DONG Lei-ming, SHEN Deng-feng, YU Wei-wu, ZENG Yan-ru, WU Zhi-min, DAI Wen-sheng.  Trait variations of male Torreya grandis trees . Journal of Zhejiang A&F University, 2012, 29(5): 715-721. doi: 10.11833/j.issn.2095-0756.2012.05.013
    [10] ZHANG Xiao-fei, LI Huo-gen, YOU Lu-xiang, CAO Jian.  Variation and genetic stability of two-year-old Liriodendron seedling growth for 39 mating combinations . Journal of Zhejiang A&F University, 2011, 28(1): 103-108. doi: 10.11833/j.issn.2095-0756.2011.01.016
    [11] SHEN Deng-feng, ZENG Yan-ru, YU Wei-wu, LI Zhang-ju, ZHANG Min, LI Yuan-chun, HUA Jia-qi, YU Shi-qun.  Collection of Torreya grandis germplasm and analysis of seeds’ physico-chemical characteristics . Journal of Zhejiang A&F University, 2011, 28(5): 747-752. doi: 10.11833/j.issn.2095-0756.2011.05.010
    [12] LIN Er-pei, MA Hai-quan, FAN Min-liang, LUO Wen-jian, HUANG Hua-hong, TONG Zai-kang.  An SSR reaction system for Abies beshanzuensis progeny with artificial pollination and progeny identification . Journal of Zhejiang A&F University, 2011, 28(2): 234-240. doi: 10.11833/j.issn.2095-0756.2011.02.010
    [13] HUANG Xin-jin.  Selection and variation of Cryptomeria fortunei provenances in Fujian Province . Journal of Zhejiang A&F University, 2010, 27(6): 884-889. doi: 10.11833/j.issn.2095-0756.2010.06.013
    [14] HUANG De-long.  Progeny testing of plus trees and selection of Fokienia hodginsii . Journal of Zhejiang A&F University, 2009, 26(3): 449-454.
    [15] LIANG Dan, ZHOU Qin, SHU Yan, ZENG Yan-ru, YU Wei-wu.  AFLP-based sexual identification in Torreya grandis . Journal of Zhejiang A&F University, 2009, 26(1): 63-67.
    [16] ZENG Xiao-hong, WU Jian-rong, MA Huan-cheng.  Biochemical response of drought stressed Acacia richii seedlings inoculated with rhizobia . Journal of Zhejiang A&F University, 2008, 25(2): 181-185.
    [17] ZHANG Fei, FANG Wei-min, CHEN Fa-di, ZHAO Hong-bo, JIA Wen-ke.  Genetic variability patterns and correlation analysis for cut-chrysanthemum with emphasis on inflorescence traits . Journal of Zhejiang A&F University, 2008, 25(3): 293-297.
    [18] CHENG Xiao_jian, LI Zhang_ju, YUWei-wu, DAI Wen-sheng, FUQing-gong.  Distribution and ecological characteristics of Torreya grandis in China . Journal of Zhejiang A&F University, 2007, 24(4): 383-388.
    [19] TONG Zai-kang, ZHENG Yong-ping, LUO Shi-yuan, YANG Hui-ping, SHI Hong-zheng.  Variations and heredity of paper pulpwood properties of new Aigeiros clones of southern type . Journal of Zhejiang A&F University, 2001, 18(1): 21-25.
    [20] LIN Tong-long.  Chinese fir :genetic variation and combination selection in DBH growth and wood volume weight for filial generation . Journal of Zhejiang A&F University, 2000, 17(2): 142-145.
  • [1]
    SUO Jinwei, MA Zhenmin, ZHAO Bing, et al. Metabolomics reveal changes in flavor quality and bioactive components in post-ripening Torreva grandis nuts and the underlying mechanism [J/OL]. Food Chemistry, 2023, 406: 134987[2024-03-10]. DOI: 10.1016/j.foodchem.2022.134987.
    [2]
    JIANG Qihong, LU Hongling, YAO Shiwei. Comparison of fruit characteristics and fatty acid composition of different Torreya grandis varieties [J]. Journal of Zhejiang Agricultural Sciences, 2023, 64(4): 945−948.
    [3]
    ZHONG Zaorong, WANG Jingyan, WEN Yuanli, et al. Study on resource exploitation and industrialization countermeasures of Torreya grandis in China [J]. Journal of Zhejiang Agricultural Sciences, 2023, 64(12): 3020−3025.
    [4]
    YI Guanmei, QIU Yingjun, LI Xiaohua, et al. Geographic distribution and resource survey of Torreya tree [J]. Anhui Agricultural Science, 2013, 41(19): 8200−8202.
    [5]
    ZHANG Huifang, QI Hongzhi, SUN Yan, et al. Analysis on variety character diversity of newly grown wheat from different sources in Huanghuai winter wheat region [J]. Journal of Plant Genetic Resources, 2023, 24(3): 719−731.
    [6]
    FENG Wei, WU Zhe, MENG Ran, et al. Genetic diversity evaluation of dandelion resources based on phenolic acid analysis and SSR markers[J/OL]. Molecular Plant Breeding, 2023-03-10[2024-03-12]. http://kns.cnki.net/kcms/detail/46.1068.S.20230309.1716.008.html.
    [7]
    XU Manhou, DU Rong, LI Xiaoli, et al. The mid-domain effect of mountainous plants is determined by community life form and family flora on the Loess Plateau of China [J]. Scientific Reports, 2021, 11(1): 10974−10974.
    [8]
    WANG Gang, CAO Pei, WEI Xuemin, et al. Applications of molecular markers in study of germplasm resources of medicinal plants [J]. Modern Chinese Medicine, 2019, 21(11): 1435−1444.
    [9]
    QI Yanxiang, ZHAO Hong, XIE Yixian, et al. Application of DNA molecular markers in banana (Musa L. ) germplasm resources [J]. Molecular Plant Breeding, 2024, 22(6): 1944−1950.
    [10]
    GUPTA P K, VARSHNEY R K. The development and use of microsatellite markers for genetic analysis and plant breeding with emphasis on bread wheat [J]. Euphytica, 2000, 113(3): 163−185.
    [11]
    MA Shuang, SUO Jinwei, CHENG Hao, et al. Effects of tree shape adjustment on canopy light intensity and seed quality of Torreya grandis ‘Merrillii’[J]. Journal of Zhejiang A&F University, 2024, 41(3): 467−477.
    [12]
    LIU Haokai. SRAP Marker Analysis of Genetic Diversity in Torreya Tree [D]. Hangzhou: Zhejiang A&F University, 2014.
    [13]
    CHEN LI, LIU Ning, WANG Zhibing, et al. The growth equation and element distribution of Torreya grandis in the Huangshan region of China [J/OL]. Forests, 2024, 15(1): 68[2024-03-12]. DOI: 10.3390/f15010068.
    [14]
    ZHAN Liyun, LIU Lian, ZENG Yanru, et al. Phenotypic diversity and primary selection of male adults [J]. Journal of Zhejiang A&F University, 2020, 37(6): 1120−1127.
    [15]
    ZHANG Qiang, MA Quanhui, PENG Xiaolong, et al. Eveluation on introduction effect of 17 fresh jujube varieties in southern Xinjiang [J]. Journal of Northwest A&F University (Natural Science Edition), 2024, 52(11): 1−12.
    [16]
    HU Fangming, TAN Xiaofeng. Torreya seed endosperm DNA extraction [J]. Economic Forest Research, 1999, 17(4): 5−7.
    [17]
    ZHENG Liuhui, ZHAN Liyun, HOU Yu, et al. SSR analysis of genetic diversity of male Torreya grandis [J]. Journal of Zhejiang A&F University, 2022, 39(2): 329−337.
    [18]
    WANG Ling, ZUO Shimin, ZHANG Yafang, et al. SSR analysis of the genetic structure of S. striae population in eight provinces (autonomous regions) of southern China [J]. Chinese Agricultural Science, 2015, 48(13): 2538−2548.
    [19]
    SHEN Dengfeng, ZENG Yanru, YU Weiwu, et al. Collection of Torreya tree quality resources and preliminary analysis of seed physicochemical properties [J]. Journal of Zhejiang A&F University, 2011, 28(5): 747−752.
    [20]
    DONG Leiming, ZENG Yanru, WU Yufen, et al. Analysis of variation in seed phenotypic characteristics and chemical composition in native Torreya populations [J]. Journal of Zhejiang A&F University, 2014, 31(2): 224−230.
    [21]
    MENG Xianghe, YANG Qibo, XIAO Dan, et al. Isolation of Torreya seed solpine acid and its preparation of 1, 3-glycerol [J]. Chinese Journal of Grain and Oil News, 2020, 35(7): 72−78.
    [22]
    DANUSEVIČIUS D, RAJORA O P, KAVALIAUSKAS D, et al. Stronger genetic differentiation among within-population genetic groups than among populations in Scots pine provides new insights into within-population genetic structuring[J/OL]. Scientific Reports, 2024, 14(1): 2713[2024-03-12]. DOI: 10.1038/s41598-024-52769-y.
    [23]
    WRIGHT S E. Evolution and the genetics of populations Vol-2 [J]. Review of Progress in Coloration &Related Topics, 2011, 127(6): 365−371.
    [24]
    ELLSTRAND N C, ELAM D R. Population genetic consequences of small population size: implications for plant conservation [J]. Annual Review of Ecology,Evolution,and Systematics, 1993, 24(1): 217−242.
    [25]
    CHEN Taiguo, TANG Jianmin, ZOU Rong, et al. Genetic diversity analysis of Guangxi Cycas debaoensis and C. segmentifida based on SSR markers[J/OL]. Molecular Plant Breeding, 2024-02-19[2024-03-12]. http://kns.cnki.net/kcms/detail/46.1068.S.20240219.1219.004.html.
    [26]
    LOU Heqiang, SONG Lili, LI Xiaolong, et al. The Torreya grandis genome illuminates the origin and evolution of gymnosperm-specific sciadonic acid biosynthesis [J/OL]. Nature Communications, 2023, 14(1): 1315[2024-03-12]. DOI: 10.1038/S41467-023-37038-2.
  • 加载中
通讯作者: 陈斌, bchen63@163.com
  • 1. 

    沈阳化工大学材料科学与工程学院 沈阳 110142

  1. 本站搜索
  2. 百度学术搜索
  3. 万方数据库搜索
  4. CNKI搜索

Figures(2)  / Tables(11)

Article views(199) PDF downloads(7) Cited by()

Related
Proportional views

Genetic variation of seed traits and SSR markers in female Torreya grandis

doi: 10.11833/j.issn.2095-0756.20240254

Abstract:   Objective  This study is to investigate the seed traits of female Torreya grandis, analyze the genetic variation of the population based on SSR primers, and compare the differences in seed phenotype, quality, and genetic diversity between and within populations of T. grandis.   Method  Female T. grandis from Fuyang, Shengzhou, Lin’an, Jiande in Zhejiang Province and Mount Huangshan in Anhui Province were used as materials to compare the phenotypic traits of T. grandis leaves and seeds through variance analysis and principal component analysis. The genetic diversity of T. grandis was compared by SSR molecular markers using female T. grandis from Fuyang, Shengzhou, Lin’an, Chun’an and Mount Huangshan as raw materials.   Result  Analysis of seed traits revealed that there were significant individual differences (P<0.01) in 8 indicators: leaf quality, leaf shape index, seed mass, seed shape index, seed weight, kernel shape index, seed coat thickness, and shell thickness between and within populations. The relative fat content and soluble sugar content also showed extremely significant differences among populations (P<0.01), with fat content ranging from 29.36% to 42.35%, indicating rich variation in T. grandis seed appearance and kernel quality. SSR primer analysis showed that the mean Nei’s genetic diversity index (H) was 0.400, the mean Shannon’s information index (I) was 0.650, and the mean polymorphic information content (PIC) was 0.400. Chun’an population exhibited the highest genetic diversity (H=0.410, I=0.658), while Shengzhou population showed the lowest (H=0.369, I=0.565). 92% of the total genetic variation existed within the population.   Conclusion  There are genetic variations in the phenotype and quality of T. grandis between and within populations. The genetic diversity of Chun’an population is the highest, and the genetic variation within the population is greater than that between populations. [Ch, 2 fig. 11 tab. 26 ref.]

LI Keyu, CHEN Rong, LIU Lian, et al. Genetic variation of seed traits and SSR markers in female Torreya grandis[J]. Journal of Zhejiang A&F University, 2025, 42(1): 94−102 doi:  10.11833/j.issn.2095-0756.20240254
Citation: LI Keyu, CHEN Rong, LIU Lian, et al. Genetic variation of seed traits and SSR markers in female Torreya grandis[J]. Journal of Zhejiang A&F University, 2025, 42(1): 94−102 doi:  10.11833/j.issn.2095-0756.20240254
  • 榧树Torreya grandis四季常绿,是红豆杉科Taxaceae植物中少有的集果用、油用、药用、材用、观赏于一体的植物,雌雄异株,生命周期可达上千年。榧树种子含油量高,主要含油酸和亚油酸,不饱和脂肪酸含量远超饱和脂肪酸[1]。饱和脂肪酸中主要是山俞酸和棕榈酸[2]。榧树自然分布于浙江、安徽南部、福建北部、江西东北部,零星分布于贵州松桃、江苏南部、湖南西南部等地,其中以浙江最多,近年来人类活动的干扰加剧了榧树资源的破坏,威胁到部分种群的生存[34]

    遗传多样性是生物多样性的重要组成部分。一个物种的稳定性和进化潜力依赖其遗传多样性,物种的经济和生态价值依赖其特有的基因组成。因此,保护生物多样性的最终目标就是保护遗传多样性[57]。DNA分子标记的数量极多,多态性高,受限制少,检测方法简单易掌握,结果稳定可靠,已被广泛应用于植物多样性研究[89]。简单重复序列标记(SSR)技术是以特异引物PCR为基础的分子标记技术,其特点是标记在整个基因组DNA中随机分布,多态性较高,操作简单,可通过PCR直接扩增来检测,重复性好,成本低[10]

    香榧T. grandis‘Merrillii’是榧树优良的变异类型,具有较高的经济价值[11]。自然环境中榧树结种迟,一般作为香榧嫁接的砧木,雄株因不结种被大量砍伐,使榧树遗传多样性受到影响,但榧树具有丰富的遗传多样性,产生了丰富的变异类型,形成了物种生存与进化的基础,也为资源的开发利用提供了可供选择的物质基础[12]。因此,本研究利用多重比较、方差分析等对不同种群雌性榧树叶片、种实表型、种实营养成分及遗传多样性指标的变异进行分析,以期为榧树的利用提供理论依据。

    • 基于天然榧树的分布情况以及前人的研究成果[13],于2019年10—11月榧树种实成熟期,从浙江省杭州市富阳区洞桥村(富阳)、杭州市临安区洪岭村(临安)、杭州市建德市大库村(建德)、绍兴市嵊州市榆树村(嵊州)及安徽省黄山市呈坎村(黄山)5个海拔在250~600 m的雌性榧树种群中,分别采集叶片和种实用于表型及种实营养成分的探究。基于詹利云等[14]的研究,选择富阳、临安、嵊州、黄山以及杭州市淳安县半夏村(淳安)的雌性榧树种群,分别采集叶片对榧树种群遗传多样性进行研究。样株间距大于50 m,生长状况良好。每株采集相同位置的新鲜叶片,采集至少100颗自然脱落的成熟种实,样品装入带有硅胶的塑封袋中,并利用全球卫星定位系统(GPS)定位采样点。叶片测量表型后置于−40 ℃冰箱保存,种实测完表型后置于阴凉通风处,等待假种皮自然开裂,用于后续研究。

    • 从各单株选取2个小枝相同部位的叶片共20片,用卡尺测量叶长、叶宽,并计算叶形指数(叶宽/叶长),用天平称取单片叶的质量。从各单株随机选取30颗种实,用卡尺测量单颗种实和种核的横径、纵径、假种皮厚、种壳厚,并计算种形指数(种实横径/种实纵径)、核形指数(种核横径/种核纵径),用天平称取单颗种实质量和种核质量。

    • 脂肪相对含量参照GB/T 14772—2008《食品中粗脂肪的测定》索氏抽提法测定。脂肪酸组成参照GB/T 17376—2008《食品脂肪酸含量的测定》测定。可溶性糖质量分数参照蒽酮比色法[15]测定。

    • 采用改良的十六烷基三甲基溴化铵(CTAB)法[16]提取雌性榧树叶片的DNA。参照郑刘辉等[17]的SSR反应体系,合成引物序列,进行PCR扩增。

    • 采用SPSS 23.0进行数据统计、方差分析、多重比较、主成分分析;用Genemaker软件准确读取SSR位点信息。用Popgene 1.32计算平均等位基因数、观察杂合度、多态信息含量等遗传多样性指标。使用Structure 2.3.4分析种群的遗传结构,并绘制遗传结构图,用Q值表示一种遗传组成的比率,即同一颜色所占比率最大的种群聚类为同一亚群。通过NTSYS2.10e计算Nei’s遗传相似矩阵,使用非加权组平均聚类分析法(UPGMA)分析样品的亲缘关系,并进行聚类分析。

    • 表1可见:在叶质量和叶形指数上,临安种群的变异系数最大。在种实质量上,嵊州种群的变异系数最大。种形指数和种核质量富阳种群的变异系数最大。核形指数的变异系数在富阳种群中最大,但仅为10.2%。种壳厚和假种皮厚的变异系数在嵊州种群中最大。方差分析(表2)表明:叶质量、叶形指数、种实质量、种形指数、种核质量、核形指数、假种皮厚、种壳厚8个指标在种群间和种群内个体间差异极显著(P<0.01)。

      种群叶质量叶形指数种实质量种形指数假种皮厚种核质量核形指数种壳厚
      数值/gCV/%数值CV/%数值/gCV/%数值CV/%数值/mmCV/%数值/gCV/%数值CV/%数值/mmCV/%
      富阳0.02±0.0131.10.15±0.0210.810.70±2.4222.60.78±0.079.03.53±0.3610.24.77±1.2726.50.66±0.0710.20.54±0.1119.7
      嵊州0.02±0.0129.90.16±0.0211.211.85±3.3628.30.79±0.056.53.67±0.7821.34.92±1.1823.90.68±0.068.90.72±0.2534.6
      黄山0.02±0.0119.20.16±0.0211.69.50±2.2722.90.81±0.075.52.94±0.5317.84.51±0.9319.00.71±0.075.80.91±0.1721.1
      临安0.02±0.0133.90.16±0.0215.39.50±2.2723.90.81±0.078.22.94±0.5318.14.51±0.9320.60.71±0.079.50.91±0.1719.1
      建德0.02±0.0133.80.17±0.029.511.19±2.4121.50.83±0.056.13.63±0.4612.84.58±0.9721.10.70±0.057.80.85±0.1314.7
        说明:数值为均值±标准差;CV为变异系数。

      Table 1.  Leaf and seed phenotypes of female quince populations in T. grandis

      指标变异来源平方和自由度均方F指标变异来源平方和自由度均方F
      叶质量 种群间0.22040.005121.000种核质量种群间358.014489.503112.981
      个体间0.028290.00121.158个体间355.3262912.25315.467
      叶形指数种群间0.18140.04550.937核形指数种群间0.60040.15064.909
      个体间0.252290.0099.779个体间1.256290.04318.755
      种实质量种群间2 530.9504632.737191.245假种皮厚种群间796.6464199.16291.175
      个体间1 612.4712955.60216.806个体间484.0262916.6917.641
      种形指数种群间0.40840.10246.454种壳厚 种群间16.01844.005116.324
      个体间1.194290.04118.764个体间10.813290.37310.831
        说明:所有指标P=0.000。

      Table 2.  Variance analysis of phenotypic parameters of the leaf and seeds in T. grandis

    • 表3可见:5个种群的脂肪相对含量从大到小依次为嵊州、黄山、临安、建德、富阳,变异系数为7.7%~21.6%。多重分析发现各种群间脂肪相对含量差异显著(P<0.05)。

      种群脂肪相对含量/%CV/%
      最大值最小值平均值±标准差
      富阳47.7918.2529.36±6.34 d21.6
      嵊州48.1430.6242.35±3.77 a8.9
      黄山46.8133.6140.93±3.19 ab7.8
      临安44.9032.1939.82±3.07 b7.7
      建德40.5216.1933.96±4.66 c13.7
        说明:不同字母表示不同种群间差异显著(P<0.05)。CV为变异系数。

      Table 3.  Lipid content of the kernel among 5 T. grandis populations

      榧树种子脂肪酸组成(表4)分析发现:不饱和脂肪酸的相对含量远远高于饱和脂肪酸,且前者是后者的2倍多;脂肪酸中亚油酸的相对含量最高,其次是油酸、金松酸、棕榈酸,亚麻酸相对含量最低。可见,榧树种子中主要的不饱和脂肪酸是亚油酸和油酸。5个种群间的脂肪酸组成存在不同程度的变异,其中多不饱和脂肪酸相对含量最高的是临安种群,随后依次是嵊州、建德、黄山、富阳种群;单不饱和脂肪酸相对平均含量富阳种群最高,为(29.20±6.34)%,建德种群最低,为(24.14±2.59)%;变异系数不饱和脂肪酸远小于饱和脂肪酸。从脂肪酸种类上看,变异系数最大的为花生一烯酸(13.0%~40.0%),其次是硬脂酸(18.0%~38.0%)、花生二烯酸(15.0%~27.0%)。

      种群棕榈酸/%硬脂酸/%油酸/%亚油酸/%亚麻酸/%花生一烯酸/%
      相对含量CV相对含量CV相对含量CV相对含量CV相对含量CV相对含量CV
      富阳 10.70±2.59 24.0 2.97±1.14 38.0 28.29±6.06 21.0 41.82±8.01 19.0 0.52±0.17 32.0 0.91±0.37 40.0
      嵊州 8.52±1.22 14.0 2.18±0.47 21.0 23.78±4.26 18.0 47.85±2.88 6.0 0.50±0.06 12.0 0.67±0.09 14.0
      黄山 8.06±0.98 12.0 2.97±0.54 18.0 26.21±2.87 11.0 46.81±2.35 5.0 0.47±0.05 11.0 0.65±0.08 13.0
      临安 8.47±0.88 10.0 2.15±0.46 22.0 23.63±2.40 11.0 49.00±2.45 5.0 0.57±0.00 14.0 0.59±0.09 16.0
      建德 9.58±1.83 19.0 2.80±0.92 33.0 23.47±2.63 11.0 46.49±3.67 8.0 0.48±0.07 14.0 0.67±0.10 15.0
      种群 花生二烯酸/% 金松酸/% 饱和脂肪酸/% 不饱和脂肪酸/% 单不饱和脂肪酸/% 多不饱和脂肪酸/%
      相对含量 CV 相对含量 CV 相对含量 CV 相对含量 CV 相对含量 CV 相对含量 CV
      富阳 2.42±0.63 26.0 10.76±2.14 20.0 13.68±3.45 25.0 84.71±4.39 5.0 29.20±6.34 22.0 55.52±10.16 18.0
      嵊州 2.80±0.75 27.0 12.61±2.02 16.0 10.70±1.32 12.0 88.22±2.04 2.0 24.45±4.30 18.0 63.77±4.36 7.0
      黄山 2.64±0.41 15.0 11.11±1.25 11.0 11.03±0.88 8.0 87.89±0.97 1.0 26.86±2.89 11.0 61.03±2.97 5.0
      临安 2.60±0.53 20.0 12.00±0.98 8.0 10.63±1.06 10.0 88.39±1.14 1.0 24.22±2.52 10.0 64.18±2.92 5.0
      建德 2.49±0.40 16.0 11.98±1.56 13.0 12.38±2.16 17.0 85.58±2.95 3.0 24.14±2.59 11.0 61.44±4.63 8.0
        说明:数值为平均值±标准差。CV为变异系数。

      Table 4.  Variation in fatty acid composition among 5 T. grandis populations

    • 表5可见:平均可溶性糖质量分数建德种群最高,为(50.49±9.26) mg·g−1,随后依次是黄山、嵊州、临安种群,富阳种群最低,为(40.23±4.80) mg·g−1。不同种群的变异系数为8.8%~19.3%。多重比较发现:嵊州、黄山种群间无显著差异,但与其他种群间差异显著(P<0.05)。

      种群可溶性糖质量分数/(mg·g−1)
      最大值最小值平均值±标准差CV/%
      富阳47.9132.1040.23±4.80 c11.9
      嵊州65.5629.3545.35±8.77 b19.3
      黄山60.0231.8044.38±7.56 b17.0
      临安54.3437.2447.75±4.18 ab8.8
      建德68.6834.3650.49±9.26 a18.3
        说明:不同字母表示不同种群间差异显示(P<0.05)。CV为变异系数。

      Table 5.  Soluble sugar content of the kernel among 5 T. grandis populations   

    • 20个指标通过主成分分析提取出6个指标,发现特征值均大于1.000的前6个主成分累计贡献率为75.38%,可以全面反映各个指标的信息(表6)。第1主成分贡献率为30.76%,特征值较高的为亚油酸、饱和脂肪酸、不饱和脂肪酸;第2主成分贡献率为13.09%,特征值较高的为种实质量、种核质量;第3主成分贡献率为10.92%,其大小主要由核形指数、种形指数决定;第4主成分贡献率为7.98%,特征值较高的为叶形指数、叶片质量、种皮厚度;第5主成分贡献率为6.93%,特征值较高的为叶片质量、种形指数、叶形指数;第6主成分贡献率为5.70%,其大小主要由含油率、金松酸、叶形指数决定。

      指标主成分指标主成分
      123456123456
      种实质量0.0740.856−0.0820.387−0.0070.263硬脂酸0.724−0.236−0.2170.2480.062−0.061
      种核质量0.1160.8190.0910.132−0.1870.305油酸0.731−0.431−0.2510.1570.1320.269
      种形指数0.010−0.1310.7410.3700.466−0.085亚油酸−0.9460.1420.046−0.106−0.0110.009
      核形指数−0.099−0.0970.8340.1940.3700.003亚麻酸0.239−0.0470.295−0.204−0.3140.120
      种皮厚度0.1050.498−0.3210.5290.2590.054花生一烯酸0.804−0.0460.027−0.0470.076−0.017
      种壳厚度−0.367−0.2430.3400.082−0.3330.327花生二烯酸−0.3720.114−0.1780.1520.369−0.310
      叶片质量0.2020.2890.049−0.5330.4960.190金松酸−0.6490.4240.186−0.152−0.176−0.397
      叶形指数−0.116−0.1790.0560.614−0.416−0.391饱和脂肪酸0.9430.0930.1600.000−0.124−0.106
      含油率−0.459−0.485−0.1950.3190.0180.426不饱和脂肪酸−0.927−0.113−0.194−0.0250.1310.114
      可溶性糖−0.1990.0100.4970.044−0.2070.330特征值6.1532.6182.1841.5951.3871.138
      棕榈酸0.8430.2210.296−0.111−0.181−0.105累计贡献率/%30.7643.8554.7762.7569.6875.38

      Table 6.  Principal components of leaf and plant phenotypes among 5 T. grandis populations

    • 13对引物在146个雌性榧树中共获得37个等位基因,每对引物可扩增2~5个等位基因,平均每对引物扩增出2.85个等位基因,TG55平均等位基因数最多,ZAFU-3和TG19最少;每对引物的平均有效等位基因数为1.899个;平均观测杂合度(0.429)略高于平均期望杂合度(0.404);Nei’s遗传多样性指数平均为0.400,其中GR98 (0.688)最高,TG19 (0.015)最低;Shannon’s指数为0.039~1.252,有11对引物的Shannon’s信息指数高于0.500,其中GR98 (1.252)最高,TG19 (0.039)最低,平均为0.650,说明榧树遗传多样性丰富(表7)。

      引物
      编号
      平均等位
      基因数/个
      有效等位
      基因数/个
      观测
      杂合度
      期望
      杂合度
      Nei’s遗传
      多样性指数
      Shannon’s
      指数
      引物
      编号
      平均等位
      基因数/个
      有效等位
      基因数/个
      观测
      杂合度
      期望
      杂合度
      Nei’s遗传
      多样性指数
      Shannon’s
      指数
      ZAFU-1 3.7501.6040.2250.3660.3620.661GR984.3753.2300.6970.6950.6881.252
      ZAFU-3 1.6251.1200.0300.0910.0900.164TG191.6251.0160.0000.0150.0150.039
      ZAFU-5 2.5002.0040.5500.5060.5010.709TG555.3752.7060.5840.6220.6161.112
      ZAFU-6 2.0001.4950.2890.3290.3250.504TG702.5001.9860.9120.5020.4960.698
      ZAFU-8 2.0002.0000.9970.5050.5000.693TG812.0001.0140.0000.0140.0140.041
      ZAFU-112.6251.9610.4620.4910.4860.713TG883.7502.4530.4920.5930.5871.022
      GR12  3.0002.0950.3410.5250.5190.839平均2.8561.8990.4290.4040.4000.650

      Table 7.  Genetic parameters of 13 SSR loci in T. grandis

    • 在种群水平上,Nei’s遗传多样性指数(H)与Shannon’s指数(I)在5个雌性种群间的变化趋势相似。Nei’s遗传多样性指数平均为0.390,从大到小依次为淳安、临安、黄山、富阳、嵊州;Shannon’s指数平均为0.621,从大到小依次为淳安、临安、富阳、黄山、嵊州;多态位点百分比平均为81.54%,其中富阳、黄山、嵊州3个种群的多态位点百分比相等,临安和淳安种群相等。淳安(H=0.410,I=0.658)的遗传多样性最高,嵊州(H=0.369,I=0.565)的遗传多样性最低(表8)。

      种群  平均等位基因数/个有效等位基因数/个观测杂合度期望杂合度Nei’s遗传多样性指数Shannon’s指数多态位点百分比/%
      富阳  2.6921.8480.4310.3870.3810.62584.62
      嵊州  2.1541.7910.3770.3760.3690.56584.62
      黄山  2.2311.8110.4510.3990.3920.61184.62
      临安  2.4621.9170.4640.4060.3990.64876.92
      淳安  2.4621.9540.4230.4180.4100.65876.92
      种群水平2.4001.8640.4290.3970.3900.62181.54
      物种水平3.2311.9250.4290.4060.4050.67192.31
        说明:种群水平指5个种群平均值;物种水平指5个种群中所有物种平均值。

      Table 8.  Genetic diversity among 5 T. grandis populations

      在物种水平上,5个种群榧树的平均等位基因数为3.231个,平均有效等位基因数为1.925个,期望杂合度(0.406)略小于观测杂合度(0.429),Nei’s遗传多样性指数为0.405,Shannon’s指数为0.671,多态位点百分比为92.31%(表8)。各种群在种群水平上的多态位点百分比及Shannon’s指数均低于物种水平,仅淳安种群在种群水平上的Nei’s遗传多样性指数高于物种水平。

    • 5个雌性榧树种群间的总遗传多样性平均为0.497;群体内近交系数均为负值,说明群体内杂合子过剩,纯合子缺失[18],这与榧树雌雄异株的特性相吻合,且这些供试雌株都是杂交后代;种群间近交系数变幅为0.054~0.207,平均为0.129;遗传分化指数变幅为0.153~0.218,平均为0.199,表明5个雌性榧树种群间存在的遗传分化程度不大,这与榧树风媒、花粉流动性大的特性相吻合;基因流的变幅为0.898~1.381,平均为1.029,表明种群间存在基因交流,每代交流约1个基因,基因流动相对来说不是很频繁(表9)。

      种群总遗传
      多样性
      种群内
      近交系数
      种群间
      近交系数
      遗传分
      化指数
      基因流
      富阳 0.457−0.1130.0580.1531.381
      嵊州 0.475−0.0030.2060.2090.946
      黄山 0.491−0.1320.0540.1881.082
      临安 0.527−0.1430.1200.2300.838
      淳安 0.534−0.0130.2070.2180.898
      平均值0.497−0.0810.1290.1991.029

      Table 9.  Genetic differentiation among 5 T. grandis populations

      方差分析结果(表10)表明:榧树的遗传变异集中在种群内,种群内(92%)的遗传变异远大于种群间(8%)。

      来源自由度平方和均方方差分量变异百
      分比/%
      P
      种群间467.42716.8570.41680.081
      种群内141664.2514.7114.71192
      总数 145731.6785.127100

      Table 10.  Molecular variance among 5 T. grandis populations   

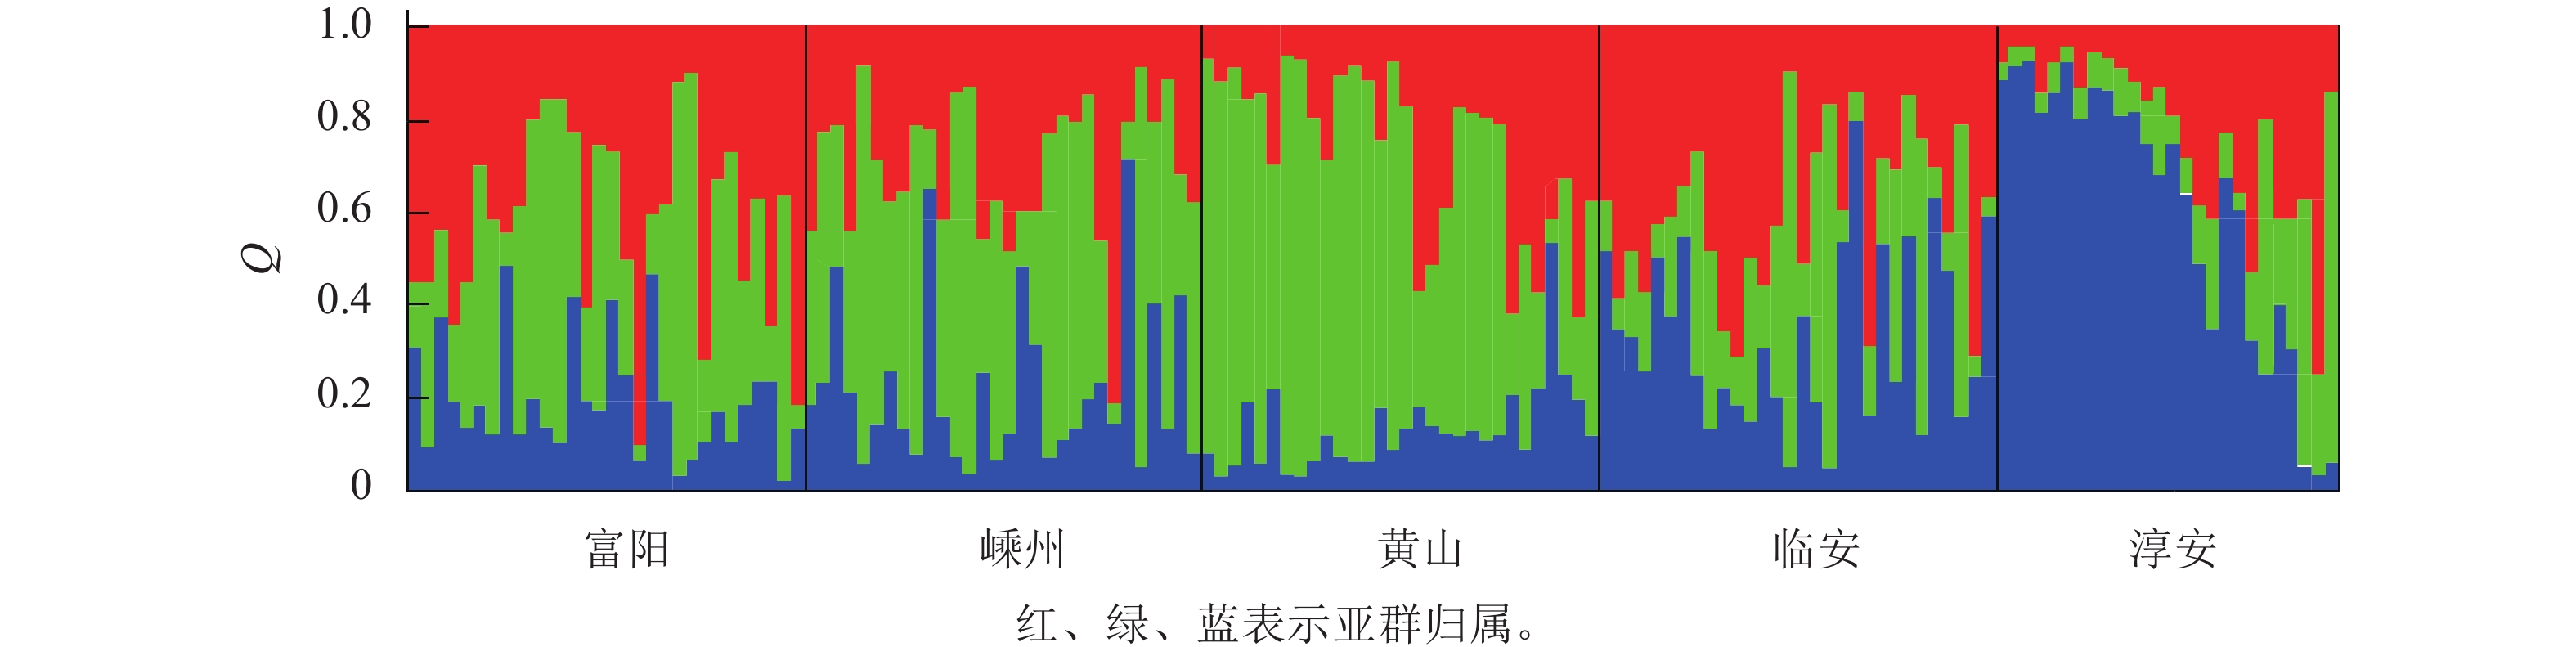
      对亚群归属分析发现:每个种群的样本基本上都有3个亚群的痕迹,只是比例不同而已(图1)。这说明榧树天然异交导致高度杂合的特性。

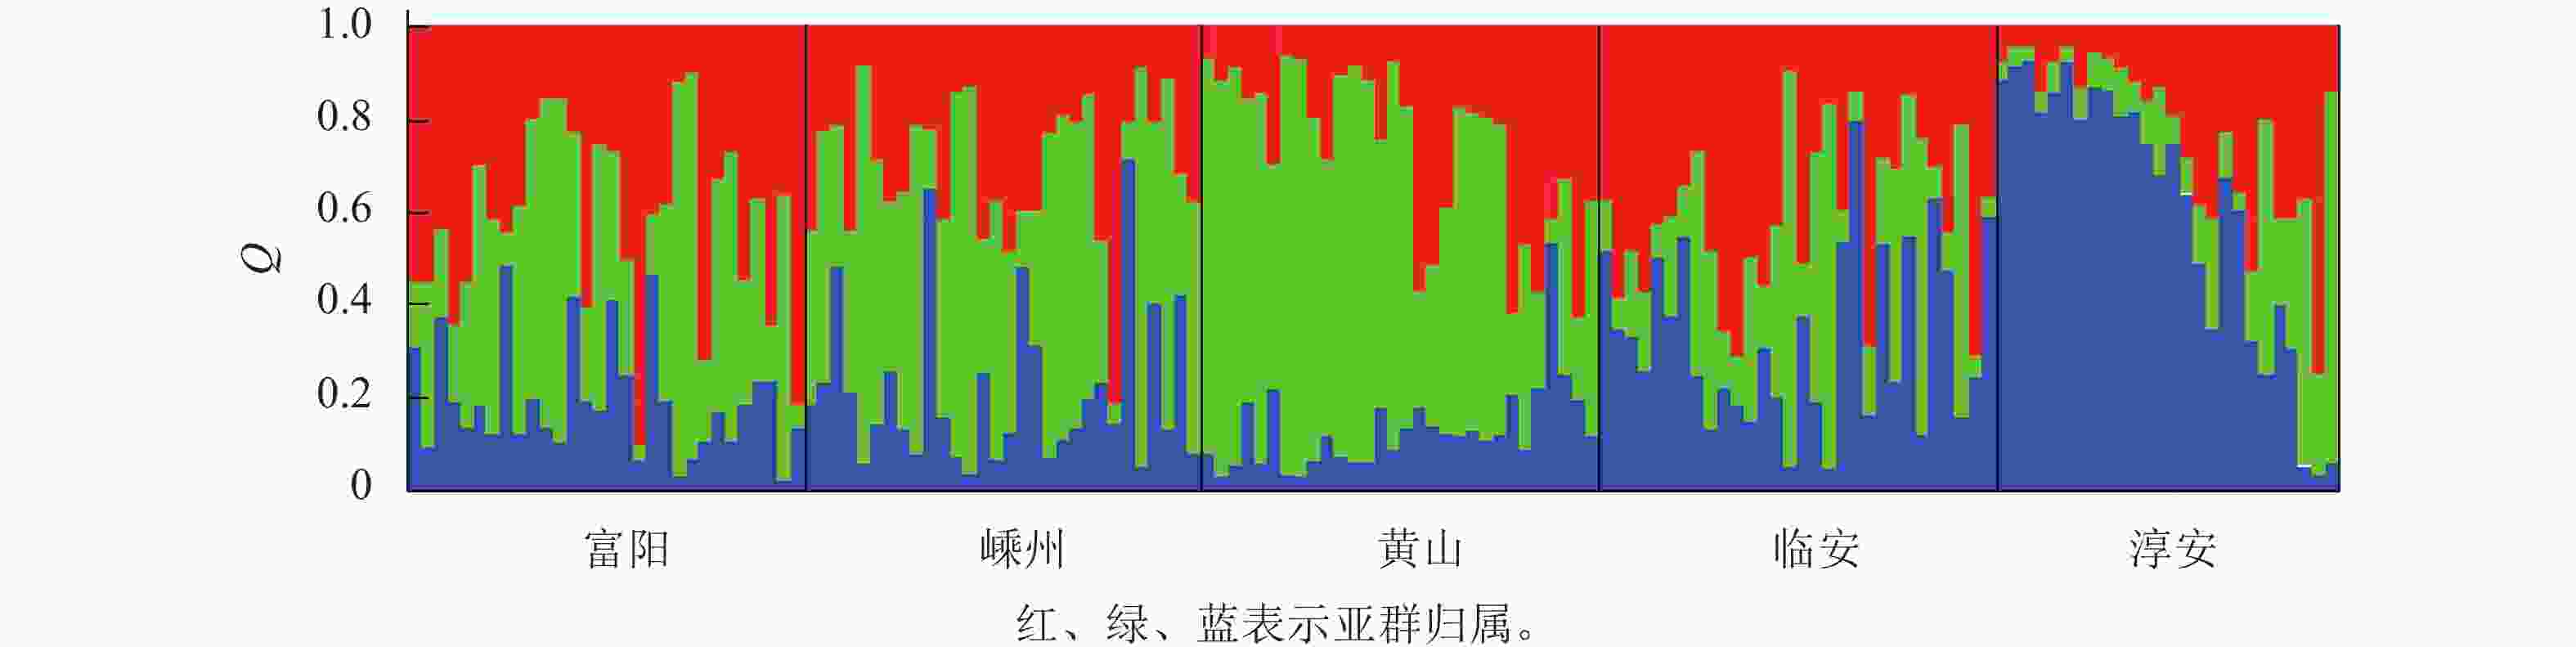
      Figure 1.  Genetic structure of 5 T. grandis populations based on structure analysis

    • 5个榧树种群的遗传相似系数平均为0.969,说明各种群间的遗传相似度很高,亲缘关系较近,存在一定程度的遗传变异(表11)。遗传距离平均为0.032,黄山与淳安种群的遗传距离最大(0.055),遗传相似度最小(0.946),富阳与黄山、临安种群的遗传距离最小(0.022),遗传相似度最大(0.977)。表明雌性榧树群体遗传相似度高,但因雌雄异株天然杂交的特性,使物种内又存在一定的变异。

      种群富阳嵊州黄山临安淳安
      富阳0.9760.9770.9770.962
      嵊州0.0240.9700.9710.957
      黄山0.0230.0310.9730.946
      临安0.0230.0300.0270.977
      淳安0.0380.0450.0550.024
        说明:对角线下方为遗传距离,对角线上方为遗传相似度。

      Table 11.  Genetic distance and genetic identity among 5 T. grandis populations

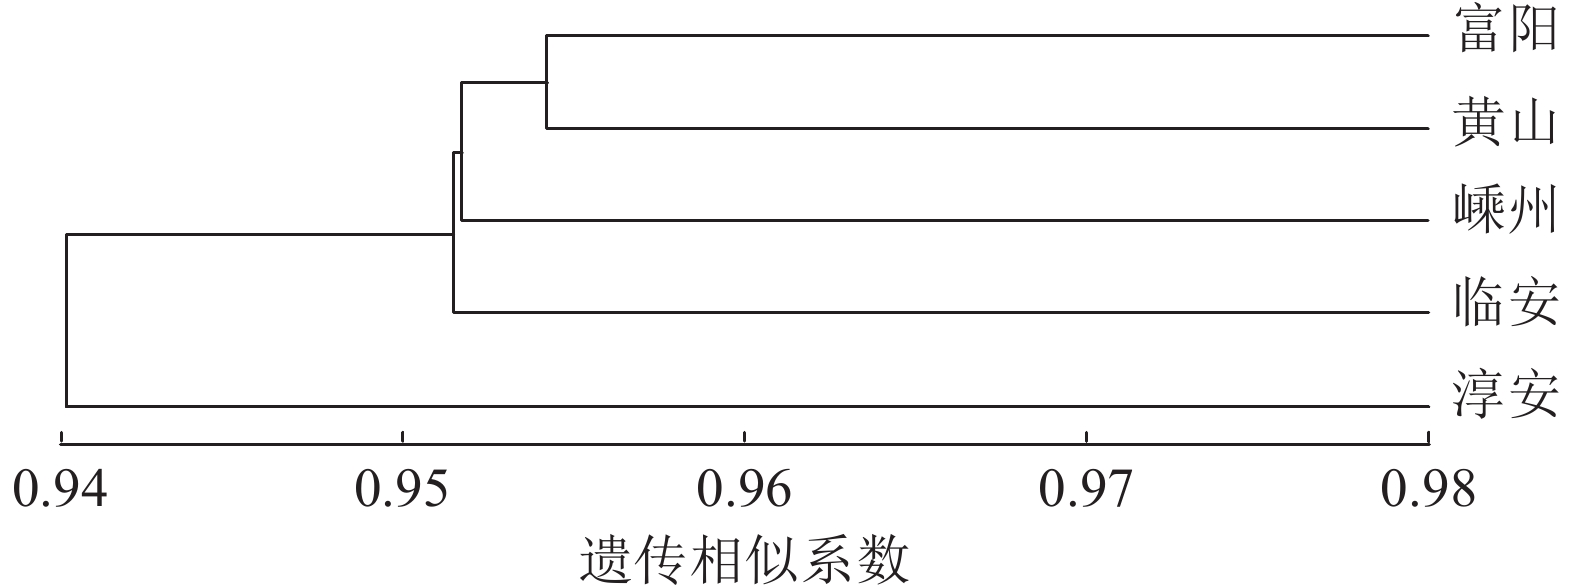
      UPGMA聚类分析发现:富阳与黄山种群相聚之后再与嵊州种群聚在一起,随后上述3个种群与临安种群聚在一起,富阳、黄山、嵊州、临安4个种群与淳安种群之间存在差异 (图2)。

      Figure 2.  UPGMA dendrograme of 5 T. grandis populations

    • 本研究表明:5个雌性榧树种群叶与种实指标在种群间及个体间均存在显著差异,这与其本身雌雄异株风媒花天然杂交的特性相符。詹利云等[14]对富阳、嵊州、黄山、临安种群雄性榧树的叶片、种实表型指标进行了研究,而本研究则对上述相同种群雌株的叶片、种实表型指标进行探究。比较发现:在种群间,雄株仅叶长这一指标存在显著差异,雌株则各指标均有差异,但种群内雌雄榧树间各指标都有显著差异;黄山种群雌株叶质量的均值要小于雄株,且变异系数雌株种群比雄株种群大;叶形指数雌雄榧树均值接近,变异系数仅嵊州(13.97%)和临安(18.27%)种群的雄株比雌株(分别为11.20%、15.30%)大。

      与沈登锋等[19]的研究结果相比,本研究的种实和种核质量与其接近,但变异系数较低,而种实相对脂肪含量两者相近。究其原因,沈登锋等[19]的研究是从种子可食性的角度收集种质,而本研究在各种群的取样则是随机的,数据更能反映自然条件下榧树种群的状况。董雷鸣等[20]对榧树黄山种群的种实进行了分析,发现与本研究在种实质量、种核质量、种形指数、核形指数上接近,而脂肪相对含量本研究的结果要高近7%。尽管研究材料取自同一种群,但榧树雌雄异株天然风媒杂交的特性决定了雄株花粉在其中所起的作用,加之研究的年份不同,气候气象条件也不同,因此研究结果有出入。本研究表明:榧树种实与种核的表型指标中,变异系数大于10%的包括种实质量、假种皮厚、种核质量及种壳厚,这些指标与种实产量有关,而各种群间相差10%以上的指标包括假种皮厚、种壳厚。

      本研究的榧树种实可食性较差,其脂肪相对含量不及香榧。金松酸作为一种特殊的不饱和脂肪酸,目前已知来源较少,得率低[21]。本研究各种群金松酸的平均相对含量为10.76%~12.61%,接近或高于香榧及日本榧Torreya nucifera的平均值,且有的单株相对含量更高,进一步说明榧树种子的利用价值。本研究发现:榧树种实脂肪相对含量的变异系数为7.70%~21.80%,而不饱和脂肪酸的变异系数较小,低于5%,脂肪中各脂肪酸组分种群间差异显著,金松酸的变异系数为8.00%~20.00%,因此不仅具有优株选择的潜力,且基于脂肪、金松酸相对含量的高低来进行优株选择理论上是可行的。

      本研究表明:天然雌性榧树的遗传变异集中在种群内,种群内(92%)的遗传变异远大于种群间(8%),这与异交风媒植物90%以上的遗传变异存在于种群内的结果相符[22],且说明榧树单株间的遗传变异更丰富,选育要基于单株性状表现来进行。以遗传多样性指标来看,仅淳安种群(H=0.410,I=0.658)的遗传多样性大于雌性榧树物种水平(H=0.405,I=0.671),而雌性物种水平的多态位点百分比(92.31%)均大于5个天然雌性榧树种群。这与刘浩凯[12]用相关系列扩增多态性(SRAP)分析天然雌性榧树种群的结果相似。

      天然榧树种群内近交系数均为负值,杂合子过剩而纯合子缺失,这也与该物种风媒传粉天然杂交的特性相吻合,说明天然雌性榧树种群没有近交衰退的现象[10]。WRIGHT[23]研究表明:遗传分化指数(Fst)可反映群体间遗传分化程度,当0<Fst≤0.05、0.05<Fst≤0.15、0.15<Fst≤0.25、Fst>0.25时,遗传分化程度分别为很弱、中等、较大分化、极大。基因流越大,遗传分化越小[24]。当基因流大于1时,说明种群间存在一定的基因交流,种群间的遗传分化不会太大[25]。在本研究中,5个雌性榧树种群的遗传分化指数为0.199,但基因流为1.029,说明种群间的遗传分化较大。

      从榧树染色体水平参考基因组,可获得更加详细和精确的基因组信息[26]。这些信息不仅包括基因的序列,还包括基因的结构、功能和调控网络等。通过深入分析这些信息,可以更准确地识别和定位SSR标记,从而提高其全面性和多态性。

    • 不同雌性榧树种群叶与种实表型指标在种群间及个体间存在显著差异。脂肪相对含量、脂肪酸相对含量及可溶性糖质量分数在种群间差异极显著,榧树种实表型和种仁品质变异丰富。基于遗传多样性指标,发现雌性榧树种群表现出一定程度的变异,淳安种群的遗传多样性最大,且雌性榧树的遗传变异种群内远大于种群间。

Reference (26)

Catalog

    /

    DownLoad:  Full-Size Img  PowerPoint
    Return
    Return