Volume 41 Issue 2
Apr.  2024
Turn off MathJax
Article Contents

RAN Jiaxuan, QI Yujiao. Height-diameter model of Pinus massoniana and Schima superba mixed forest in central Guizhou Province[J]. Journal of Zhejiang A&F University, 2024, 41(2): 343-352. doi: 10.11833/j.issn.2095-0756.20230363
Citation: RAN Jiaxuan, QI Yujiao. Height-diameter model of Pinus massoniana and Schima superba mixed forest in central Guizhou Province[J]. Journal of Zhejiang A&F University, 2024, 41(2): 343-352. doi: 10.11833/j.issn.2095-0756.20230363

Height-diameter model of Pinus massoniana and Schima superba mixed forest in central Guizhou Province

doi: 10.11833/j.issn.2095-0756.20230363
  • Received Date: 2023-06-12
  • Accepted Date: 2023-10-24
  • Rev Recd Date: 2023-10-18
  • Available Online: 2024-03-21
  • Publish Date: 2024-04-01
  •   Objective  To establish a tree height-diameter model for mixed forests of Pinus massoniana and Schima superba, introduce tree species as dummy variables into the model, and consider the spatial autocorrelation and heterogeneity of residuals of the model, in order to provide theoretical basis for the construction of the tree height-diameter model of mixed forests and the scientific management of mixed forests.  Method  Based on the survey data of 727 groups of tree height-diameter in mixed forests of P. massoniana and S. superba in Kaiyang County, Guizhou Province, we constructed ordinary least squares (OLS), generalized additive model (GAM), linear mixed model (LMM), geographically weighted regression model (GWR), and geographically weighted regression kriging (GWRK) models for tree height-diameter-whole-forest model, on the basis of which tree species was introduced as a dummy variable, and five model residuals spatial autocorrelation and spatial heterogeneity were selected for global Moran’I, local Moran’I, and intra-block variance analyses with the coefficients of determination (R2), mean squared error (MSE), and the Akaike information criterion (AIC) to evaluate the models.   Result  (1) The fitting accuracies of the whole-forest base models of P. massoniana-S. superba mixed forest were OLS<GAM<LMM<GWR<GWRK in descending order. (2) The fitting accuracies of the models were higher than those of the whole-forest base models after introducing tree species as a dummy variable into the models. (3) The global Moran’ I of the residuals of the OLS and GAM models was significant at the α=0.05 level (Z>1.96), and there were more hot spots in the local Moran’I distribution maps, which showed strong spatial autocorrelation. In contrast, the global Moran’I of the residuals of the LMM, GWR and GWRK models is insignificant at the α=0.05 level (−1.96≤Z≤1.96) and there are more cold spots in the local Moran’I distribution plot, indicating that spatial autocorrelation of the model residuals has been eliminated. (4) The intra-block variance of the residuals of the five models show a tendency to increase with the lag distance, but the GWR and GWRK models have smaller intra-block variance, which can better reduce the heterogeneity of the model residual space.   Conclusion  The OLS and GAM models do not have high fitting accuracy and cannot eliminate spatial autocorrelation and heterogeneity of model residuals, so they are not the best choices for modeling tree height-diameter. The LMM, GWR, and GWRK models perform well in improving the model fitting accuracy and decreasing the spatial autocorrelation, but the GWR and GWRK models are more significant in decreasing the spatial heterogeneity, and they are the most appropriate of the tree height-breast diameter models. [Ch, 2 fig. 3 tab. 38 ref.]
  • [1] ZHANG Yilin, LI Gongquan, LIU Ying.  Spatial distribution of endangered orchids in the Yangtze River Watershed . Journal of Zhejiang A&F University, 2022, 39(4): 750-757. doi: 10.11833/j.issn.2095-0756.20210551
    [2] HAN Zemin, LI Yuan, WANG Xiong, JIAN Yongfeng, ZHOU Jingjing, DIAN Yuanyong, HUANG Guangti.  Effects of biodiversity on biomass of Pinus massoniana plantation under different succession degrees . Journal of Zhejiang A&F University, 2021, 38(2): 246-252. doi: 10.11833/j.issn.2095-0756.20200334
    [3] ZHANG Dongyan, WANG Dongzhi, LI Xiao, GAO Yushan, LI Tianyu, CHEN Jing.  Relationship between height and diameter at breast height(DBH) in mixed coniferous and broadleaved forest based on quantile regression . Journal of Zhejiang A&F University, 2020, 37(3): 424-431. doi: 10.11833/j.issn.2095-0756.20190461
    [4] ZHANG Rong, LI Tingting, JIN Suo, YU Shunyao, WANG Yu, LI Yujiang, QI Jinqiu, HAO Jianfeng.  Effects of human disturbance on species diversity and soil physiochemical properties of Schima superba community in Mengding Mountain . Journal of Zhejiang A&F University, 2020, 37(5): 867-875. doi: 10.11833/j.issn.2095-0756.20190554
    [5] LIU Guangwu, CHEN Chen, WANG Keli.  Density index model of the Pinus massoniana plantation based on artifical neural network (ANN) . Journal of Zhejiang A&F University, 2020, 37(1): 100-104. doi: 10.11833/j.issn.2095-0756.2020.01.013
    [6] MAO Guangxian, TAN Wei, CHAI Zongzheng, ZHAO Yang, YANG Shenjun.  Diameter-height model for Pinus massoniana plantations based on BP neural network . Journal of Zhejiang A&F University, 2020, 37(4): 752-760. doi: 10.11833/j.issn.2095-0756.20190486
    [7] HUANG Jianfeng, TAN Wei, CHAI Zongzheng, CAI Zhaojun.  Spatial structure characteristics and regulation for the Pinus massoniana near-mature forest in the central Guizhou Province, China . Journal of Zhejiang A&F University, 2019, 36(4): 749-756. doi: 10.11833/j.issn.2095-0756.2019.04.015
    [8] TANG Sijia, TANG Mengping, ZHAO Saisai, DU Xiufang, SHEN Qianyong, PANG Chunmei.  Competitive spatial patterns for Moso bamboo on Mount Tianmu . Journal of Zhejiang A&F University, 2018, 35(2): 199-208. doi: 10.11833/j.issn.2095-0756.2018.02.002
    [9] LÜ Changxiao, DENG Huafeng, WANG Shaojie, CHEN Zhenxiong, WANG Xuejun.  Compatible tree volume and aboveground biomass equations for Pinus massoniana from different regions . Journal of Zhejiang A&F University, 2016, 33(5): 790-797. doi: 10.11833/j.issn.2095-0756.2016.05.010
    [10] DING Min, NI Rong-xin, MAO Xuan-ping.  Growth of Pinus massoniana and broad-leaved tree mixed forest . Journal of Zhejiang A&F University, 2012, 29(3): 463-466. doi: 10.11833/j.issn.2095-0756.2012.03.023
    [11] LI Yan-yan, FAN Hou-bao, LIN De-xi, SU Bing-qiang, LIU Chun-hua, SUN Xin.  Biomass and distribution of stands mixed Pinus massoniana with broad leaved species . Journal of Zhejiang A&F University, 2004, 21(4): 388-392.
    [12] JIANG Wen-wei, LIU Tong, DING Li-xia, WEN Guo-sheng, ZHANG Wan-rong, ZHONG Tai-lin.  Progress in spatial heterogeneity research in landscape ecology . Journal of Zhejiang A&F University, 2003, 20(3): 311-314.
    [13] WEI Xin-liang, GUO Ren-jian, ZHAO Bin.  Growth model and cutting age of masson pine natural forest in Zhejiang . Journal of Zhejiang A&F University, 2001, 18(4): 333-336.
    [14] ZHAO Ming-shui, ZHOU Zhong-hui, CHENG Xiao-yuan, YANG Feng-chun.  Function of water-retention and soil-improvement of Schima superba fire forest belts in National Nature Reserve of Mount Tianmu . Journal of Zhejiang A&F University, 2000, 17(1): 42-45.
    [15] YU Yi-wu, JIANG Zhi-biao, HU Yong-xu.  Stand characteristerics of evergreen broad-leaved forest with Schima superba in Hangzhou . Journal of Zhejiang A&F University, 1999, 16(3): 242-246.
    [16] Liu Aiqin, Ma Xiangqing, Yu Lixuan, Luo Xuemei.  Effects of different mixed model son soil fertility in plantations of Pinus massoniana . Journal of Zhejiang A&F University, 1998, 15(3): 250-255.
    [17] Ji Kongshu.  Quantitative Variation of Trace Elements inNeedles of Pinus massoniana From Different Provenances and Their Correlation With Annual Growth. . Journal of Zhejiang A&F University, 1997, 14(3): 231-236.
    [18] Ding Guijie.  Study on Standard Height Curve Model of Masson Pine Planted Forests. . Journal of Zhejiang A&F University, 1997, 14(3): 225-230.
    [19] Yu Meilin, Wang Zhiming, Liu Zhi, Tong Xiuyao, Lin Zhi, Wu Jiasheng, Chen Youquan, Jin Yuandong, Wang Baonü, Ding Yifei..  Forestation Techniques on Mixed Forest Taking Liquidambar formosana as Leading Species. . Journal of Zhejiang A&F University, 1995, 12(2): 139-143.
    [20] Lin Sizu, Huang Qingzheng, Wu Wangming.  A Computerized Simulation Test on the Effectiveness of Several Models of Chinese Fir and Masson Pine . Journal of Zhejiang A&F University, 1993, 10(2): 184-188.
  • [1]
    LEI Xiangdong, PENG Changhui, WANG Haiyan, et al. Individual height-diameter models for young black spruce (Picea mariana) and jack pine (Pinus banksiana) plantations in New Brunswick, Canada [J]. The Forestry Chronicle, 2009, 85(1): 43 − 56.
    [2]
    PATRICIO M S, DIAS C R G, NUNES L. Mixed-effects generalized height-diameter model: a tool for forestry management of young sweet chestnut stands [J/OL]. Forest Ecology and Management, 2022, 514: 120209[2023-06-05]. doi: 10.1016/j.foreco.2022.120209.
    [3]
    CHAI Zongzheng, TAN Wei, LI Yuanyuan, et al. Generalized nonlinear height-diameter models for a Cryptomeria fortunei plantation in the Pingba Region of Guizhou Province, China [J]. Web Ecology, 2018, 18(1): 29 − 35.
    [4]
    EERIKAINEN K. Predicting the height-diameter pattern of planted Pinus kesiya stands in Zambia and Zimbabwe [J]. Forest Ecology and Management, 2003, 175(1/3): 355 − 366.
    [5]
    JIA Weiwei, SUN Heming, LI Fengri. Prediction model system with dummy variables for carbon storage of larch plantation in Heilongjiang Province, China [J]. Chinese Journal of Applied Ecology, 2019, 30(3): 814 − 822.
    [6]
    SU Jun. Timber volume calculation of Illegal logging with unary linear regression equation [J]. Forestry Investigation and Planning, 2017, 42(5): 14 − 19.
    [7]
    HE Xiao, ZHOU Chaofan, LEI Xiangdong, et al. Study on carbon storage growth model of Larch larix plantation [J]. Journal of Beijing Forestry University, 2021, 43(11): 1 − 10.
    [8]
    LOU Minghua, ZHANG Huiru, LEI Xiangdong, et al. Individual diameter-height models for mixed Quercus mongolica broadleaved natural stands based on spatial autocorrelation [J]. Scientia Forestry Sinica, 2017, 53(6): 67 − 76.
    [9]
    ZHANG Lianjun, MA Zhihai, GUO Luo. Spatially assessing model errors of four regression techniques for three types of forest stands [J]. Forestry, 2008, 81(2): 209 − 225.
    [10]
    LU Junfeng, ZHANG Lianjuan. Modeling and prediction of tree height-diameter relationships using spatial autoregressive models [J]. Forest Science, 2011, 57(3): 252 − 264.
    [11]
    GUISAN A, EDWARDS T C, HASTIE T. Generalized linear and generalized additive models in studies of species distributions: setting the scene [J]. Ecological Modelling, 2002, 157(2/3): 89 − 100.
    [12]
    JIANG Lichun, ZHANG Rui, LI Fengri. Modeling branch length and branch angle with linear mixed effects for Dahurian larch [J]. Scientia Silvae Sinicae, 2012, 48(5): 53 − 60.
    [13]
    XU Chonghua, CUI Jun, HUANG Xingzhao, et al. Height-DBH model of Chinese fir based on linear mixed effects model [J]. Journal of Northwest A&F University (Natural Science Edition), 2017, 45(6): 53 − 60.
    [14]
    LI Zekun, REN Liyan, MA Renfeng, et al. Analysis of spatial-temporal pattern and driving factors of carbon emissions in Zhejiang Province based on spatial-temporal geographic weighted regression model [J]. Journal of Ningbo University (Science and Technology Edition), 2021, 34(6): 105 − 113.
    [15]
    CHEN Keyi, ZHANG Huiru, ZHANG Bo, et al. Spatial distribution of carbon storage in natural secondary forests based on geographically weighted regression expansion model [J]. Chinese Journal of Applied Ecology, 2021, 32(4): 1175 − 1183.
    [16]
    WU Zihao, LIU Yaolin, FENG Xiangyang, et al. Analysis of local influencing factors of cadmium pollution in soil by using multi-scale geographically weighted regression [J]. Journal of Geo-Information Science, 2023, 25(3): 573 − 587.
    [17]
    LI Peng, YANG Zhangqi, YAN Peidong, et al. Quality evaluation of mixed plantations of Pinus massoniana and Castanopsis hystrix based on the soil erosion characteristics and soil physical and chemical properties [J]. Journal of Central South University of Forestry and Technology, 2022, 42(4): 104 − 116.
    [18]
    LI Zhihui, LI Bohai, QI Chengjing, et al. Studies on importance of valuable wood species resources and its development strategy [J]. Journal of Central South University of Forestry &Technology, 2012, 32(11): 1 − 8.
    [19]
    CHEN Heihu. Analysis on the growth effect of masson pine and Schima superba mixed forest [J]. Anhui Agricultural Science Bulletin, 2014, 20(17): 105 − 107, 121.
    [20]
    TIAN Dongyuan, JIANG Lichun, SHAHZAD M K, et al. Climate-sensitive tree height-diameter models for mixed forests in Northeastern China [J/OL]. Agricultural and Forest Meteorology, 2022, 326: 109182[2023-06-10]. doi: 10.1016/j.agrformet.2022.109182.
    [21]
    SUN Yongkang, TANG Jingming, WANG Yi. Height-diameter model of Pinus massoniana and Cyclobalanopsis glauca mixed forest based on quantile regression [J]. Journal of Central South University of Forestry and Technology, 2021, 41(12): 18 − 25.
    [22]
    LI Fangxing, ZHANG Yimiao, YI Weidong, et al. Analysis on growth differences between mixed plantations of Pinus massoniana and Schima superba and their pure plantation [J]. Scientia Forestry Sinica of Southern China, 2016, 44(5): 17 − 20.
    [23]
    LI Fang, PAN Ping, NING Jinkui, et al. Undergrowth species composition and diversity of Pinus massoniana and Schima superba mixed stands with different proportions [J]. Journal of Northwest Forestry College, 2016, 31(6): 34 − 40.
    [24]
    YIN Sha, ZHAO Fang, OUYANG Xunzhi. A comparison on water-holding capacity of forest litter and soil of mixed forests of Pinus massoniana and Schima superba in different proportions [J]. Journal of Jiangxi Agricultural University, 2015, 37(3): 454 − 460.
    [25]
    LIU Xiaotong, HUANG Jinjin, ZHANG Yiru, et al. Analysis of influencing factors on forest soil organic matter in Guangdong Province based on GAM model [J]. Chinese Journal of Ecology, 2022, 41(11): 2278 − 2288.
    [26]
    DU Yichen, LI Mingze, FAN Wenyi, et al. Estimation of forest age based on geographically weighted regression model and forest fire remote sensing data [J]. Scientia Silvae Sinicae, 2019, 55(6): 184 − 194.
    [27]
    LI Yunlong, XIONG Lihua, YAN Lei. A geographically weighted regression kriging approach for Trmm-rain gauge data merging and its application in hydrological forecasting [J]. Resources and Environment in the Yangtze Basin, 2017, 26(9): 1359 − 1368.
    [28]
    LIU Chang. Spatial Distribution of Forest Carbon Storage in Heilongjiang Province [D]. Harbin: Northeast Forestry University, 2014.
    [29]
    LI Habin, WANG Zhengquan, WANG Qingcheng. Theory and method ology of spatial heterogeneity quantification [J]. Chinese Journal of Applied Ecology, 1998, 9(6): 651 − 657.
    [30]
    QI Yujiao. Estimation and Analysis of Forest above-ground Carbon Storage by Remote Sensing in Greater Hinggan Mountains[D]. Harbin: Northeast Forestry University, 2014.
    [31]
    ZHANG Lianjun, GOVE J H. Spatial assessment of model errors from four regression techniques [J]. Forest Science, 2005, 51(4): 334 − 346.
    [32]
    CHEN Hao, LUO Yang. Construction of nonlinear mixed effect height-diameter model for Pinus massoniana [J]. Journal of Forestry and Environment, 2021, 41(4): 439 − 448.
    [33]
    SUN Yusen, WANG Weifang, LI Guochun. Spatial distribution of forest carbon storage in Maoershan region, Northeast China based on geographically weighted regression kriging model [J]. Chinese Journal of Applied Ecology, 2019, 30(5): 1642 − 1650.
    [34]
    MATEU J, USO J L, MONTES F. The spatial pattern of a forest ecosystem [J]. Ecological Modelling, 1998, 108(1/3): 163 − 174.
    [35]
    QI Y J, ZHANG Y C, WANG K, et al. Application of spatial regression models for forest biomass estimation in Guizhou Province, Southwest China [J]. Applied Ecology and Environmental Research, 2020, 18(5): 7215 − 7232.
    [36]
    FOTHERINGHAM A S, BRUNSDON C, CHARLTON M. Geographically Weighted Regression: the Analysis of Spatially Varying Relationships[M]. New York: John Wiley & Sons, 2003.
    [37]
    ZHANG Lingyu, LIU Zhaogang. Regeneration and distribution of natural secondary forests in the central part of Daxing’an Mountains based on geographically weighted regression model [J]. Scientia Forestry Sinica, 2019, 55(11): 105 − 116.
    [38]
    CHEN Keyi, ZHANG Huiru, ZHANG Bo, et al. Spatial distribution simulation of recruitment trees of natural secondary forest based on geographically weighted regression [J]. Journal of Beijing Forestry University, 2021, 43(2): 1 − 9.
  • 加载中
通讯作者: 陈斌, bchen63@163.com
  • 1. 

    沈阳化工大学材料科学与工程学院 沈阳 110142

  1. 本站搜索
  2. 百度学术搜索
  3. 万方数据库搜索
  4. CNKI搜索

Figures(2)  / Tables(3)

Article views(113) PDF downloads(27) Cited by()

Related
Proportional views

Height-diameter model of Pinus massoniana and Schima superba mixed forest in central Guizhou Province

doi: 10.11833/j.issn.2095-0756.20230363

Abstract:   Objective  To establish a tree height-diameter model for mixed forests of Pinus massoniana and Schima superba, introduce tree species as dummy variables into the model, and consider the spatial autocorrelation and heterogeneity of residuals of the model, in order to provide theoretical basis for the construction of the tree height-diameter model of mixed forests and the scientific management of mixed forests.  Method  Based on the survey data of 727 groups of tree height-diameter in mixed forests of P. massoniana and S. superba in Kaiyang County, Guizhou Province, we constructed ordinary least squares (OLS), generalized additive model (GAM), linear mixed model (LMM), geographically weighted regression model (GWR), and geographically weighted regression kriging (GWRK) models for tree height-diameter-whole-forest model, on the basis of which tree species was introduced as a dummy variable, and five model residuals spatial autocorrelation and spatial heterogeneity were selected for global Moran’I, local Moran’I, and intra-block variance analyses with the coefficients of determination (R2), mean squared error (MSE), and the Akaike information criterion (AIC) to evaluate the models.   Result  (1) The fitting accuracies of the whole-forest base models of P. massoniana-S. superba mixed forest were OLS<GAM<LMM<GWR<GWRK in descending order. (2) The fitting accuracies of the models were higher than those of the whole-forest base models after introducing tree species as a dummy variable into the models. (3) The global Moran’ I of the residuals of the OLS and GAM models was significant at the α=0.05 level (Z>1.96), and there were more hot spots in the local Moran’I distribution maps, which showed strong spatial autocorrelation. In contrast, the global Moran’I of the residuals of the LMM, GWR and GWRK models is insignificant at the α=0.05 level (−1.96≤Z≤1.96) and there are more cold spots in the local Moran’I distribution plot, indicating that spatial autocorrelation of the model residuals has been eliminated. (4) The intra-block variance of the residuals of the five models show a tendency to increase with the lag distance, but the GWR and GWRK models have smaller intra-block variance, which can better reduce the heterogeneity of the model residual space.   Conclusion  The OLS and GAM models do not have high fitting accuracy and cannot eliminate spatial autocorrelation and heterogeneity of model residuals, so they are not the best choices for modeling tree height-diameter. The LMM, GWR, and GWRK models perform well in improving the model fitting accuracy and decreasing the spatial autocorrelation, but the GWR and GWRK models are more significant in decreasing the spatial heterogeneity, and they are the most appropriate of the tree height-breast diameter models. [Ch, 2 fig. 3 tab. 38 ref.]

RAN Jiaxuan, QI Yujiao. Height-diameter model of Pinus massoniana and Schima superba mixed forest in central Guizhou Province[J]. Journal of Zhejiang A&F University, 2024, 41(2): 343-352. doi: 10.11833/j.issn.2095-0756.20230363
Citation: RAN Jiaxuan, QI Yujiao. Height-diameter model of Pinus massoniana and Schima superba mixed forest in central Guizhou Province[J]. Journal of Zhejiang A&F University, 2024, 41(2): 343-352. doi: 10.11833/j.issn.2095-0756.20230363
  • 树高和胸径是森林连续清查和管理中的2个重要因子,相较于胸径的测量,树高的测量具有耗时、成本高且误差大等缺点[1]。因此,研究者将树高-胸径模型作为一种常见、快速、便捷的方法预测林木高度[2],估算森林的生长与产量[3]、生物量和碳储量[45]、林木材积[6]和立地指数[7]等。普通最小二乘法(ordinary least squares,OLS)常被学者作为基础模型预测树高,但该模型在拟合具有空间分布特征的变量时,消除空间自相关的能力较弱[810]。广义可加模型(generalized additive model,GAM)属于数据驱动模型,采用链接函数建立响应变量和解释变量的平滑函数之间的关系,优势在于能够处理响应变量和解释变量之间高度非线性和非单调的关系[11]。线性混合模型(linear mixed model,LMM)由固定效应和随机效应两部分组成,可以同时反映整体变化规律和不同个体在整体中的变化,方差协方差结构还能反映数据之间的自相关和异质性[12]。因此,与传统模型OLS相比,GAM和LMM模型能提高模型拟合精度[9, 13]。地理加权回归模型(geographically weighted regression,GWR)作为能够显著消除模型空间自相关性的局域模型,研究对象位置不同导致权函数不同,进而使每个位置上参数随着空间的变化而变化,产生的结果更加精确,该模型已被运用于很多研究领域。近年来,学者们从各方面对GWR模型进行拓展,如李泽坤等[14]将时间维度引入GWR模型回归参数部分拓展出时空地理加权回归模型(geographically and temporally weighted regression,GTWR)分析了浙江省各影响因素对碳排放总量影响的时空异质性,陈科屹等[15]对模型残差进行普通克里格插值,拓展出地理加权回归克里格模型(geographically weighted regression kriging,GWRK)对吉林省汪清林业局浪溪林场天然次生林碳储量空间分布进行了研究,吴子豪等[16]从解决自变量差异化方面拓展出多尺度地理加权回归模型(multi-scale geographic weighted regression model,MGWR),探明了湖北省武汉市黄陂区土壤镉在不同空间位置的影响因子和污染来源等。

    马尾松Pinus massoniana作为中国南方主要先锋造林树种,具有速生、丰产、适应性强等特点,但马尾松纯林存在结构简单、生态系统不稳定,容易造成土壤退化,引发水土流失等问题[17]。因此,常把马尾松与其他树种进行混交造林,提高林分稳定性。木荷Schima superba因为其材质优良,适应能力强,能在酸性土壤和贫瘠山地等不利的条件下生长,被列入国家珍贵用材发展名录[18]。有研究发现:马尾松-木荷混交林在提高林地生产力,改善林地生态环境,促进林木生长[19]等方面优于马尾松纯林,但与纯林相比,混交林的复杂性和多样性使得建立树高-胸径模型更为复杂。目前,许多学者做了关于混交林树高-胸径模型的研究[2021]。但对于马尾松-木荷混交林研究主要在不同混交比例对林分生长的影响[22]、林下植被物种组成及多样性[23]、凋落物和水土保持性能[24]等方面,对树高-胸径模型鲜有研究。因此,本研究以贵州省开阳县马尾松-木荷混交林为研究对象,对比分析OLS、GAM、LMM、GWR和GWRK树高-胸径回归哑变量模型拟合效果及降低模型残差空间自相关和异质性的程度,为开阳县马尾松-木荷混交林科学经营管理提供理论依据。

    • 研究区位于贵州省贵阳市开阳县,该县西连安顺市与毕节市,东与南连接黔南布依族苗族自治州,北接遵义。位置为26°11′~27°22′N,106°07′~107°16′E,地势南北高、中间低、平均海拔为1 200 m,地形以山地、丘陵为主、喀斯特地貌分布广泛,占全区面积的71.8%。气候类型为亚热带高原季风湿润性气候,年均气温为15.3 ℃,年均降水量为1 196.9 mm。所选研究区森林类型为天然马尾松-木荷混交林,林内树种有马尾松、木荷、水青冈Fagus longipetiolata、光叶海桐Pittosporum glabratum、云贵鹅耳枥Carpinus pubescens和杉木Cunninghamia lanceolata等。

      2017年8月,在研究区马尾松-木荷混交林内,根据CTFS(Centre for Tropical Forest Science)样地建设标准方法设置40 m×50 m的固定样地,并将样地划分为20个10 m×10 m的小样方,对每个样方内所有胸径≥1 cm的树木进行每木检尺,即记录树种名称,测量胸径、树高、冠幅、坐标等因子。样地内林木调查因子描述性统计见表1

      树种胸径/cm树高/m密度/(株·hm−2)胸高断面积/(m2·hm−2)
      全林木 7.3±7.9 7.2±5.8 3 635 6.580 0
      马尾松Pinus massoniana 27.9±12.8 22.2±6.9 225 3.320 0
      木荷Schima superba 6.6±4.2 6.3±2.8 1 545 1.510 0
      水青冈Fagus longipetiolata 8.3±7.6 9.5±6.2 290 0.580 0
      杉木Cunninghamia lanceolata 8.1±6.4 8.0±5.6 235 0.390 0
      枫香Liquidambar formosana 12.0±10.7 12.3±8.5 45 0.180 0
      云贵鹅耳枥Carpinus pubescens 4.8±3.3 5.8±2.8 290 0.150 0
      山樱花Cerasus serrulata 18.2±10.5 19.5±6.1 15 0.100 0
      光叶海桐Pittosporum glabratum 2.8±1.5 2.4±0.3 330 0.050 0
      光皮桦Betula luminifera 10.7±4.3 14.6±1.5 25 0.050 0
      白栎Quercus fabri 3.6±4.5 4.9±3.9 95 0.050 0
      老鼠矢Symplocos stellaris 3.6±2.7 4.2±2.5 145 0.040 0
      响叶杨Populus adenopoda 14.4±8.1 15.4±4.1 10 0.040 0
      虎皮楠Daphniphyllum oldhamii 7.7±1.7 6.9±2.1 55 0.020 0
      Castanopsis fargesii 3.1±1.6 4.9±2.7 110 0.020 0
      山胡椒Lindera glauca 2.4±0.9 5.2±2.6 65 0.006 0
      穗序鹅掌柴Heptapleurum delavayi 3.3±1.1 3.1±1.7 30 0.005 0
      栓皮栎Quercus variabilis 5.2±0.3 8.7±0.0 10 0.004 0
      川榛Corylus heterophylla var. sutchuenensis 2.4±0.9 5.8±2.6 35 0.003 0
      山矾Symplocos sumuntia 2.3±1.2 2.7±0.8 25 0.002 0
      象鼻藤Dalbergia mimosoides 2.7±0.6 8.4±1.1 10 0.001 0
      灰毛大青Clerodendrum canescens 1.6±0.3 4.6±0.6 15 0.000 6
        说明:胸径和树高数值为平均值±标准差。

      Table 1.  Descriptive statistics of forest survey factors in sample plots

    • 根据调查数据(表1)可知林内主要树种为马尾松和木荷。因此,将树种作为哑变量引入OLS、GAM、LMM、GWR和GWRK模型中,分别构建马尾松,木荷和其他树种树高-胸径模型。树种分类用定性代码0和1表示,第i个树种表示为Si,定性数据Si转换为(0, 1)形式;Si为0或1,当x是第i个树种时为1,否者为0。其中i=1、2、3;S1S2S3分别是马尾松、木荷和其他树种的定性代码。将没有引入哑变量的模型作为全林木基础模型。

    • 采用幂函数(Y=aXb)的对数变换形式(lnY=a+blnX)作为本研究的基础模型。其模型表达式如下:

      式(1)中,Ht为树高(m),DBH为胸径(cm),ab为模型参数,$ \varepsilon $为模型误差。

    • 增加样方水平的单水平随机效应,在模型参数ab的位置上分别增加随机参数$ {\mu }_{1}{\mathrm{和}\mu }_{2} $,如式(2)所示:

      式(2)中,ab为模型参数,$ {\mu }_{1} $和$ {\mu }_{2} $为随机参数,$ \varepsilon $为模型随机误差。

    • GAM是广义线性模型的半参数拓展,唯一的基本假设是平滑函数是可加的[25]。将lnDBH作为解释变量,lnHt作为响应变量,平滑回归项采用平滑样条函数构建GAM,其表达式:

      式(3)中,s为平滑样条函数,$ \varepsilon $为模型误差,$ \alpha $为截距。

    • GWR模型作为传统回归方法的拓展,将样本点的地理位置信息加入建模,使得模型既能描述响应变量与解释变量间的关系,又能消除模型残差的空间自相关[26]。使用Gauss函数作为权函数,构建开阳县马尾松-木荷混交林树高-胸径模型。

      式(4)中,$ \mathrm{l}\mathrm{n}{H}_{t} $为响应变量,$ \left({u}_{i},{v}_{i}\right) $为第i个样本点的坐标,β0为第i个样本点的常数估计值,Xki为第k个自变量在第i样本点的值,$ {\beta }_{k}\left({u}_{i},{v}_{i}\right) $为第i个样本点上的第k个回归参数,是关于地理位置的函数,p为用于建模的林木总数,$ \varepsilon $为模型误差。

    • GWRK模型是GWR模型的延伸与拓展,将GWR与克里格插值相结合的模型,通过GWR回归残差进行空间插值,然后将插值结果和GWR回归估计值相加,从而获得GWRK估计值[27]

    • 分别采用全局与局域莫兰指数(Moran’s I)评价模型残差的空间分布[9]。全局Moran’s I是用来描述所有的空间单元在整个区域上与周边地区的平均关联程度,取值为−1~1,多数统计检验在开始时都先确定零假设,在计算全局Moran’s I时通常会给出Z值,如果Z>1.96或者<−1.96,拒绝零假设,表示空间分布可能是聚集模式或分散模式;若−1.96≤Z≤1.96,接受零假设,表示空间分布可能是随机过程产生的结果,Z能够判断n个样点内的观测值之间是否存在空间相关性[28]。而局域Moran’s I可以进一步研究局域空间聚集现象,评价模型残差是否存在局域聚集情况,分析模型残差局域空间自相关性。

    • 空间异质性作为生态系统的主要属性之一,是产生空间格局的主要原因[29]。使用模型残差组内方差评价模型残差空间异质性[28, 30]

    • 模型评价指标选用决定系数(R2)、均方误差(MSE)和赤池信息准则(AIC)进行模型比较,除了决定系数值越大越好外,其他指标均是越小越好。综合以上评价指标选择最优模型。

    • 使用R语言的minpack.lm包、mgcv包、lme4包和GWmodel包分别对OLS、GAM、LMM和GWR模型进行建模分析,随机选择581株(80%)林木作为建模数据,剩余的146株(20%)林木作为检验数据。用ArcMap 10.6对模型残差进行普通克里格插值,ROOKCASE (用VBA编写的Excel宏文件)计算全局和局域Moran’s I,作图在Excel中完成。

    • 全林木基础模型拟合结果见表2,5种模型的R2为0.63~0.80,MSE为0.08~0.16,AIC为462.77~759.23,都能很好地反映树高与胸径之间的关系。将树种作为哑变量引入后,模型拟合精度整体高于全林木基础模型,5种回归模型的R2提高了0.01~0.06,MSE和AIC也有不同程度的降低,全林木基础模型和哑变量模型的3种拟合指标从劣到优均依次为OLS、GAM、LMM、GWR、GWRK。OLS和LMM哑变量模型参数估计值均在0.001水平上显著,GWR模型的参数估计值为一个范围,能很好地表现林木间的差异(表3)。

      模型类型模型R2MSEAIC全局Moran’I (Z)
      哑变量模型   普通最小二乘法(OLS) 0.65 0.16 723.97 0.2494(26.521 0)
      线性混合模型(LMM) 0.78 0.09 506.29 −0.0065(−0.5448)
      广义可加模型(GAM) 0.66 0.15 714.54 0.2047(22.0847)
      地理加权回归模型(GWR) 0.85 0.07 271.83 −0.0125(−1.1784)
      地理加权克里格回归模型(GWRK) 0.86 0.06 260.66 −0.0095(−1.0208)
      全林木基础模型 普通最小二乘法(OLS) 0.63 0.16 759.23 0.2878(30.1583)
      线性混合模型(LMM) 0.77 0.10 522.88 −0.0071(−0.6050)
      广义可加模型(GAM) 0.65 0.15 723.95 0.2797(29.6680)
      地理加权回归模型(GWR) 0.79 0.09 488.08 −0.0144(−1.3773)
      地理加权克里格回归模型(GWRK) 0.80 0.08 462.77 −0.0122(−0.4704)
        说明:R2为决定系数,MSE为均方误差,AIC为赤池信息准则,全局Moran’I (Z)为空间自相关性评价指标。

      Table 2.  Model fitting statistics and Global Moran’s I (Z-value) for five regression models

      模型类型拟合参数估计值标准误P
      普通最小二乘法
      (OLS)
      a  1.200 7 0.087 6 <0.001
      b  0.581 5 0.020 5 <0.001
      木荷 −0.440 0 0.069 7 <0.001
      其他 −0.398 2 0.073 0 <0.001
      线性混合模型
      (LMM)
      a  0.969 6 0.093 1 <0.001
      b  0.637 6 0.017 8 <0.001
      木荷 −0.282 8 0.060 2 <0.001
      其他 −0.249 7 0.062 2 <0.001
      地理加权回归模型
      (GWR)
      a  −1.003 4~2.401 6
      b  0.285 9~1.314 6
      木荷 −1.241 3~0.842 6
      其他 −1.245 5~1.368 1
        说明:ab为模型拟合参数;P表示拟合参数的显著性,其中P<0.001表示在0.001水平上显著。GAM模型为非参数模型;GWRK模型是将基础模型残差进行普通克里格插值,也没有参数估计值。

      Table 3.  OLS, LMM and GWR dummy variable model parameter estimation
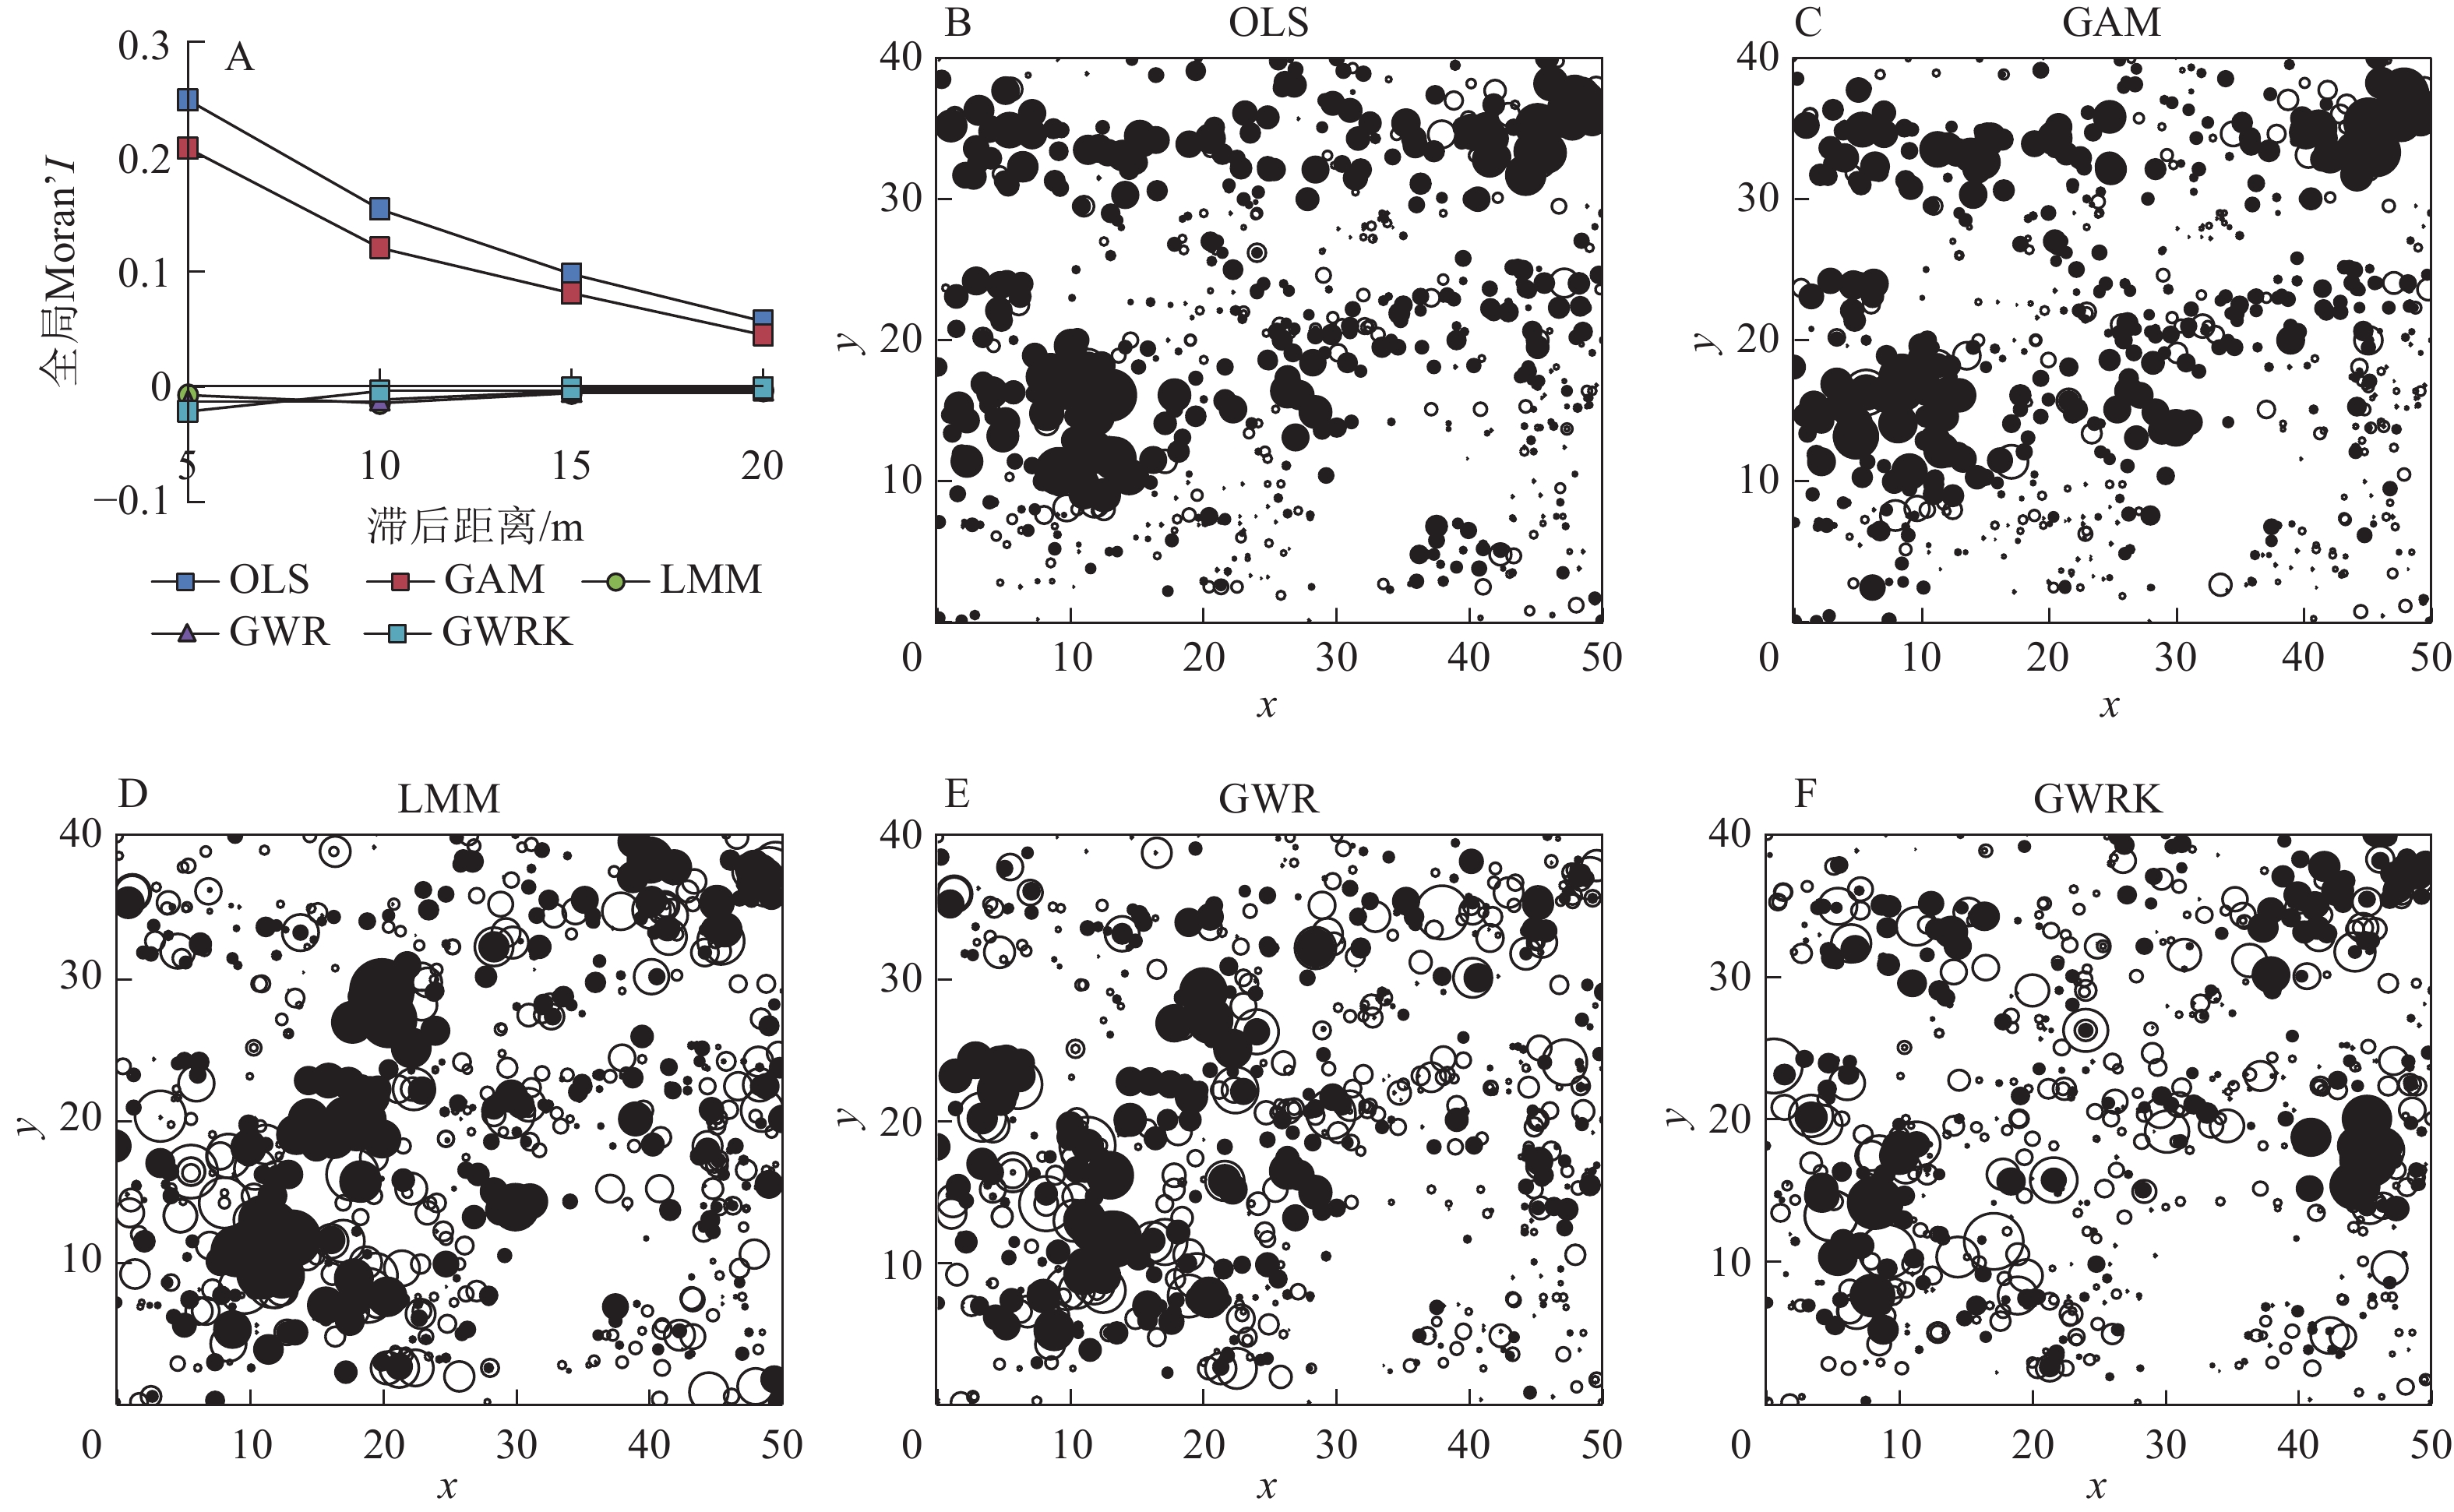
    • 表2可知:OLS和GAM模型残差全局Moran’s Iα=0.05的显著水平下,Z>1.96,存在显著的空间自相关性。而LMM、GWR和GWRK模型残差具有更低的全局Moran’s I,且在α=0.05条件下,模型残差全局Moran’s IZ在−1.96~1.96范围,模型残差空间自相关性不显著。以5 m为间隔,计算5~20 m滞后距离内模型残差全局Moran’s I (图1)。OLS和GAM模型残差全局Moran’s I随着滞后距离增加不断降低,而LMM、GWR和GWRK模型残差全局Moran’s I在各滞后距离处在0上下小幅度波动,且值相接近。

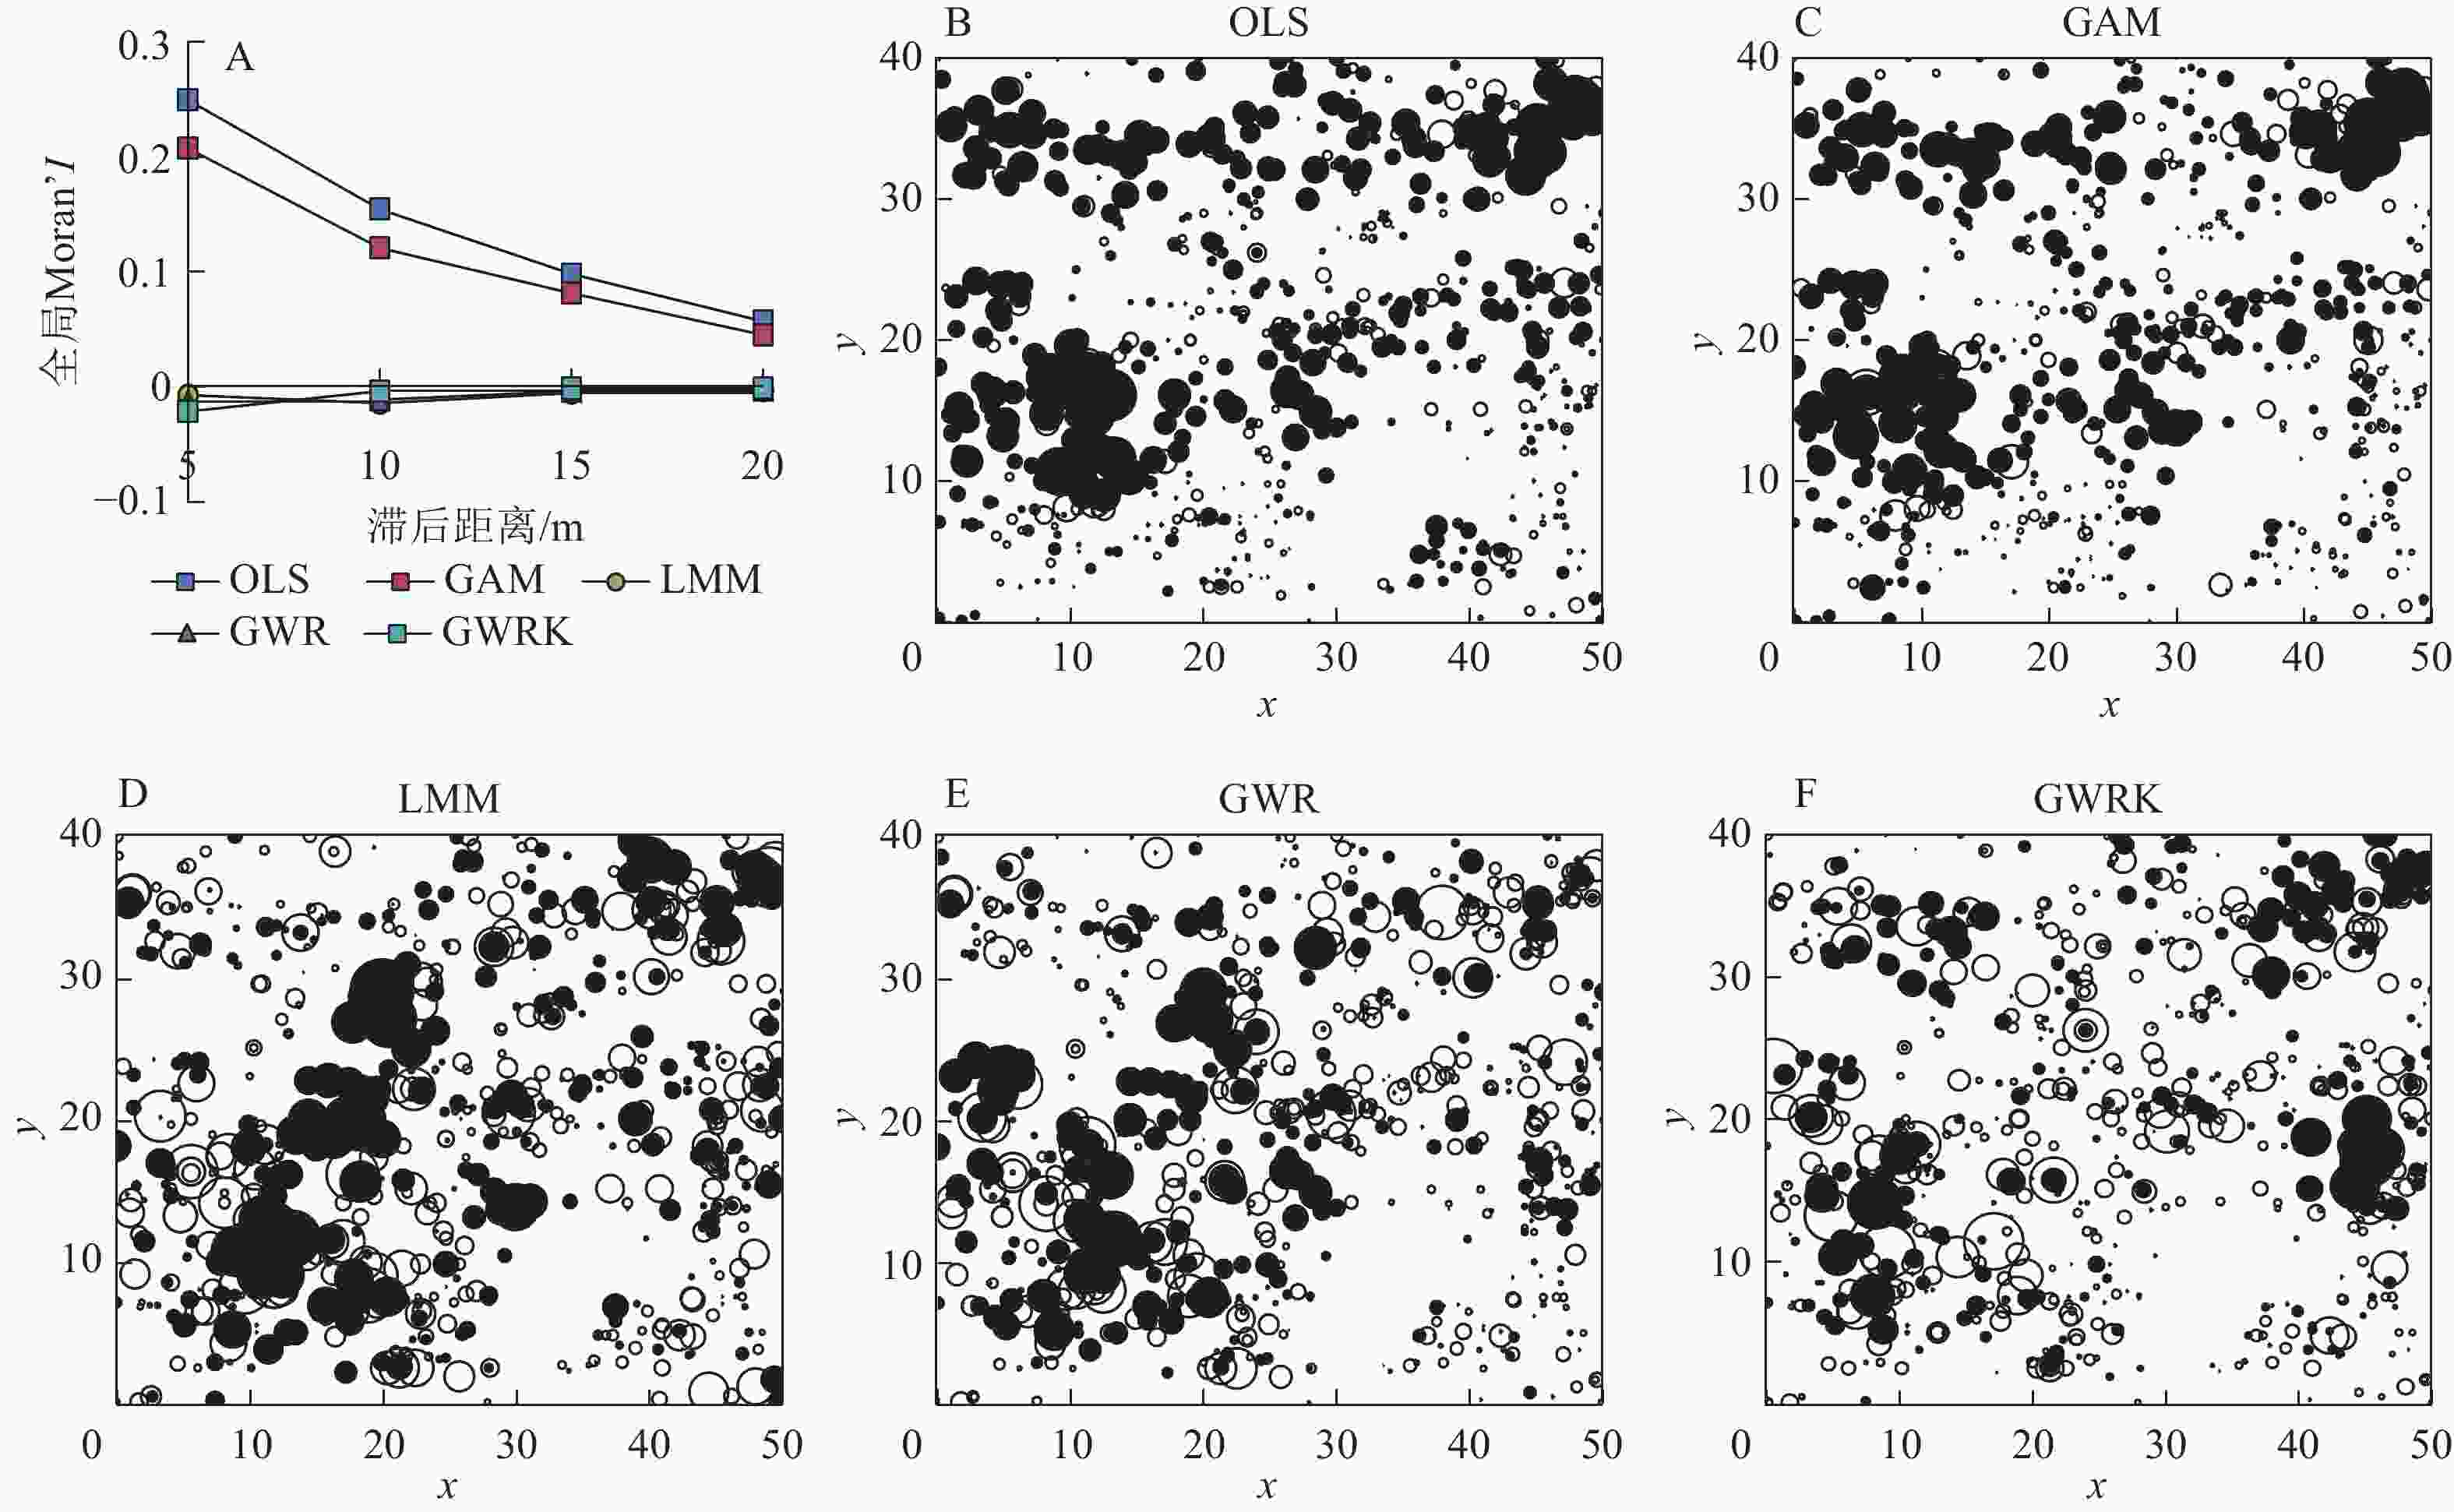
      Figure 1.  Spatial correlation and local distribution of Moran’s I values of the five models’ residuals

      OLS和GAM模型残差的局域Moran’s I整体分布不均匀且存在大而多的黑色气泡(正局域Moran’s I)(图1B~F),说明这2种模型对热点的预测不足或过度。相比之下,LMM、GWR和GWRK模型残差产生更少的热点,局域Moran’s I多为负值,相邻点之间表现为相反特征。

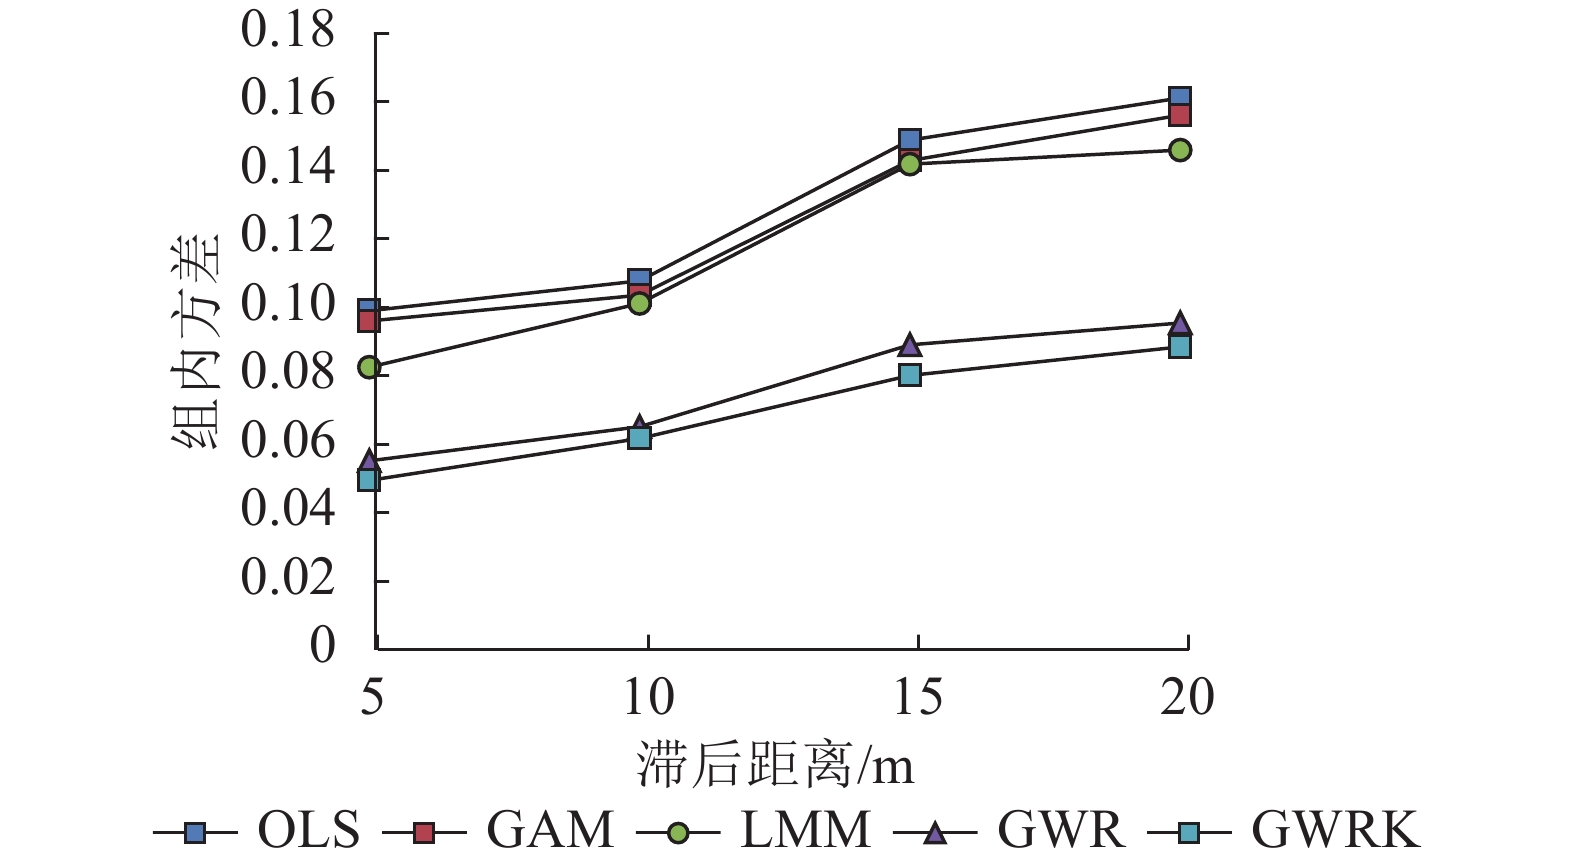
    • 图2为5~20 m滞后距离内各模型残差的组内方差。在该范围内,5种模型残差组内方差在5 m处最小,并随着滞后距离的增加而增加。GWR和GWRK模型残差组内方差在各滞后距离处均显著小于OLS、GAM和LMM模型残差组内方差。5种模型残差在各滞后距离处的组内方差从小到大排序为GWRK、GWR、LMM、GAM、OLS。

      Figure 2.  Intra-block variance of residuals of five models

    • 在全林木基础模型中,模型拟合精度由高到低排序为GWRK、GWR、LMM、GAM、OLS。OLS模型是对数据进行全局拟合,不考虑样本点之间空间自相关性的全局模型,即所得到的模型参数估计与数据的地理位置无关,估计结果是该点的最优无偏估计的同时也是研究区内所有样本点的最优无偏估计[28]。GAM模型作为数据驱动模型,使用链接函数建立响应变量和解释变量的平滑函数之间的关系,为响应变量提供比OLS模型更好的预测[31]。LMM模型拟合效果同样优于OLS模型,本研究通过增加样方水平的随机效应,将参数ab同时作为随机效应参数,发现将样方作为随机效应可以消除样方差异对模型的影响[32],在拟合过程中展现出更好的效果。但在实际研究中,不同地理位置之间具有空间非平稳性,OLS、GAM和LMM模型属于全局模型,没有考虑样本点位置不同会造成不同参数预测值的问题,导致模型拟合效果不佳。GWR和GWRK模型作为一种加入空间权重函数的局域空间回归模型,考虑了不同地理位置之间的差异性,反映了局域参数的变化,比OLS模型拟合精度更高。GWRK模型对GWR模型残差进行普通克里格插值后,消除了残差空间相关对模型拟合的影响[33],模型拟合精度比GWR显著提高。将树种作为哑变量引入模型后,模型拟合精度比全林木基础模型均有提升,原因在于哑变量模型通常能更加精确地反映树木生长受到本身遗传性质的影响,即将不同树种存在的差异考虑进模型。娄明华等[8]使用树种作为哑变量构建混交林林木树高-胸径模型时,同样发现哑变量模型拟合精度高于基础模型。有研究发现:不同树种所拟合的树高-胸径模型曲线不同[20],本研究构建的马尾松、木荷以及其他树种树高-胸径模型具有不同模型参数预测值,同样也说明了遗传特征是混交林树木生长的决定因素之一。整体而言,局域模型拟合效果优于全局模型,哑变量模型拟合精度高于全林木基础模型。

    • 考虑模型残差空间自相关时,LMM、GWR和GWRK模型比OLS和GAM模型得到显著改进。5种模型残差全局Moran’s I均表现在滞后距离为20 m时趋近于0,这表明树高之间的空间自相关性随着距离的增加逐渐减小,且当距离超过20 m时,空间相关性微弱且不显著。

      OLS模型前提假设认为林木之间是相互独立的,然而大量研究发现林木间的关系并不是相互独立的[34],因此忽略空间自相关会使OLS违背独立性假设导致对模型参数的标准误差的偏见估计[9],导致犯第一类错误(原假设为真,假设检验拒绝了原假设)的可能性变大[8]。与OLS模型相比,GAM模型残差全局Moran’s I降低,但空间自相关性仍表现显著(Z>1.96,α=0.05),表明GAM并没有显著降低残差空间自相关,因为GAM并没有将空间自相关纳入建模过程,尽管GAM模型由于其稳健性和灵活性而改进了模型拟合并产生了更好的预测,但是该模型本质上还是非空间的[31]。同时,GAM和OLS模型残差局域Moran’s I存在较多聚集的热点,残差之间存在显著空间正相关性,即相邻点之间的表现为相同特征,造成对热点有较多过度预测或预测不足的值。然而,在α=0.05条件下,LMM、GWR和GWRK模型残差全局Moran’s I随着滞后距离的增加越来越接近于0,且−1.96≤Z≤1.96,残差空间自相关性不显著。LMM、GWR和GWRK模型残差局域Moran’s I在研究区内整体表现为较多冷点,研究区相邻点残差呈现相反的特征。LMM模型中协方差结构可以反映个体间的差异,类似GWR模型中的权函数,因此LMM模型在提高模型拟合效果的同时还能消除模型残差空间自相关性的影响[35]。GWR和GWRK模型对空间数据具有较强的分析能力,在建模过程中解释变量的回归系数随着位置的变化而变化,因此能够有效地探测空间数据的空间非平稳性[36]。张凌宇等[37]在研究大兴安岭中部天然次生林更新分布时,比较全局模型和局域模型残差空间自相关时研究发现:局域模型残差自相关明显小于全局模型,这与本研究结果相同。陈科屹等[38]利用GWR模型研究进界木空间分布,同样得到类似的结论。

      5种回归模型在5~20 m滞后距离范围内,模型残差组内方差随着距离的增加逐渐增加。与OLS模型相比,LMM和GAM模型的组内方差在各滞后距离内变化不大,而GWR和GWRK模型却存在很大程度的降低,说明全局模型不能降低模型残差空间异质性,而局域模型不仅能消除模型残差空间自相关,还在降低空间异质性方面表现出明显的优势。ZHANG等[31]对加拿大3种不同林分建立OLS、LMM和GWR树高-胸径模型,研究模型残差空间异质性时,得出结果与本研究结论相同。综上,OLS和GAM模型在模型拟合精度、降低空间自相关和空间异质性方面表现不佳,GWR和GWRK模型不仅能提高模型拟合精度,还能降低模型残差空间自相关和异质性,建议用于林木树高-胸径模型的建立。

    • 本研究以开阳县马尾松-木荷混交林为研究对象,以OLS、GAM、LMM、GWR和GWRK模型为全林木树高-胸径基础模型,将树种作为哑变量引入基础模型,并比较全林木基础模型和哑变量模型的拟合效果,同时分析哑变量模型降低空间自相关和异质性程度,发现哑变量模型拟合效果整体优于基础模型,局域模型较全局模型不仅能显著提高模型拟合效果,还能降低模型残差空间自相关性和异质性。今后研究马尾松-木荷混交林树高-胸径模型时,建议应用局域模型得到精度更高的拟合结果,若考虑区域尺度问题,可以将混交比、立地质量等因子作为哑变量引入模型,进而构建更大尺度范围的混交林树高-胸径模型。

Reference (38)

Catalog

    /

    DownLoad:  Full-Size Img  PowerPoint
    Return
    Return