-
森林地上生物量(AGB)是表征森林生产力和陆地生态碳循环的重要指标,对研究全球气候变化、人类经营活动等对森林生态系统的影响具有重要意义[1]。精确估算森林地上生物量对森林可持续发展、增加森林碳汇能力及减缓全球气候变暖具有关键作用[2]。样地调查是精确获取森林地上生物量的主要手段[3-5],但该方法耗时费力[6],难以实现大范围时空动态监测。近年来,众多研究者利用遥感变量信息(如光谱特征、植被指数、冠层结构参数、纹理等),结合样地调查构建遥感估算模型,实现了对地上生物量的时空估算。森林地上生物量遥感估算有参数和非参数模型[7-12],其中,以支持向量回归(SVR)模型为代表的非参数模型被广泛应用于森林地上生物量时空估算研究[13-15]。LI等[16]比较了不同模型(如最小二乘法模型、广义加性模型、随机森林、SVR等)在估算地上生物量上的效果后发现,SVR模型估算效果最好;FENG等[14]发现随机森林、SVR模型等非参数模型估算的地上生物量精度要高于参数模型(线性模型和乘数模型),且SVR模型估算精度最高。
竹林具有“爆发式生长”的特点。在生长和抽枝展叶期,竹林叶面积指数(LAI)逐渐增加,地上生物量快速积累[16-17]。LAI时间序列上的变化趋势能够反映森林的季节性变化,并常作为森林生态系统碳水循环和地上生物量估算等研究的重要参数之一[18-20]。相较于归一化植被指数(NDVI),增强型植被指数(EVI)对高生物量区域的敏感性更高,受土壤背景和大气效应的影响更小[21-22]。比值指数(RVI)是绿色植被的灵敏指示参数,能够反映叶干生物量和叶绿素含量的动态变化。目前,对竹林地上生物量的遥感估算研究多是基于单一时相遥感植被指数、光谱信息、纹理等特征进行,估算精度较低[23-24],且不能表征竹林快速生长过程中地上生物量快速积累的动态变化[6]。本研究以浙江省竹林资源为研究对象,以2014年浙江省中分辨率成像光谱仪(MODIS)的LAI、EVI、RVI时间序列产品为数据源,结合2014年竹林地上生物量调查数据,构建SVR模型,估算浙江省竹林地上生物量,以期为竹林碳汇遥感监测提供参考。
-
浙江省(27°06′~31°11′N,118°01′~123°10′E)位于中国东南沿海、长江三角洲南翼,是中国竹林面积最大的省份之一,竹资源十分丰富,竹产业发达,素有“世界竹子看中国,中国竹子看浙江”的美誉。目前,浙江省竹林面积为94万 hm2,其中毛竹Phyllostachys edulis林83万 hm2,竹林面积占全省森林面积约15%。
-
MODIS LAI (MOD15A2H)、地表反射率(MOD09A1)和MODIS NDVI (MOD13Q1)数据产品在美国国家航空航天局(NASA)官网下载。MODIS LAI和地表反射率的时间和空间分辨率分别为8 d和500 m,MODIS NDVI的时空分辨率分别为16 d和250 m。数据利用重投影软件MRT (MODIS Reprojection Tools)投影,采用最近邻域法将空间分辨率统一重采样为500 m×500 m。基于MODIS NDVI时间序列产品和地表反射率数据提取浙江省竹林丰度信息。首先,利用NDVI数据和最大似然法提取林地专题信息;其次,掩膜提取林地的地表反射率,并进行最小噪声变换;然后,利用影像端元法提取竹林、针叶林和阔叶林端元光谱曲线;最后,利用完全约束最小二乘混合像元分解法,得到浙江省竹林丰度图。竹林丰度提取方法参考LI等[25]和MAO等[26]。
-
调查和收集182个不同立竹密度、立地质量和经营条件的标准竹林样地(30 m×30 m)。调查因子包括胸径(DBH)和年龄(0~1年生的竹子是1度竹,2~3年生是2度竹,4~5年生是3度竹),记录样地中心坐标。基于样地竹林胸径和年龄,分别计算毛竹和雷竹Ph. praecox单竹的地上生物量[19]。
$$\begin{split} {M}_{\mathrm{毛}}=\;&747.787{{D}_{\mathrm{B}\mathrm{H}}}^{2.771}\left(\frac{0.148A}{0.028+A}\right)^{5.555}+3.772 \text{;} \\ {M}_{\mathrm{雷}}=\;&0.193\;9{{D}_{\mathrm{B}\mathrm{H}}}^{1.565\;4} 。 \end{split}$$ 其中:M毛和M雷分别表示毛竹和雷竹单竹地上生物量;DBH和A分别为胸径和竹龄。为与MODIS遥感数据匹配,本研究将样地竹林面积线性扩大为500 m×500 m [11]。
-
设置141个遥感变量,其中LAI、EVI和RVI时间序列数据各46个,各序列年均值各1个。由于MODIS产品易受大气、气溶胶、雪覆盖等因素影响,数据存在误差大、不连续等问题[20],本研究利用粒子滤波同化算法提高MODIS LAI时间序列数据的精度,主要步骤为:①利用3次样条帽盖平滑算法对MODIS LAI产品进行平滑处理[27];②将平滑的MODIS LAI输入到LAI动态模型,模拟叶面积指数;③将MODIS地表反射率的红光和近红外反射率、PROSAIL模型模拟冠层反射率、模拟LAI值输入到粒子滤波同化算法,得到叶面积指数同化结果。粒子滤波同化算法详细参考LI等[17]和MAO等[26]。增强型植被指数和比值指数利用MODIS地表反射率的第1 (red)、第2 (nir)和第3 (blue)波段分别计算。
$$ \begin{split} {I}_{\mathrm{E}\mathrm{V}\mathrm{I}}=\;&2.5\times \frac{{\rho }_{\mathrm{n}\mathrm{i}\mathrm{r}}-{\rho }_{\mathrm{r}\mathrm{e}\mathrm{d}}}{{\rho }_{\mathrm{n}\mathrm{i}\mathrm{r}}+6.0\times {\rho }_{\mathrm{r}\mathrm{e}\mathrm{d}}-7.5\times {\rho }_{\mathrm{b}\mathrm{l}\mathrm{u}\mathrm{e}}+1} \text{;}\\ {I}_{\mathrm{R}\mathrm{V}\mathrm{I}}=\;&\frac{{\rho }_{\mathrm{n}\mathrm{i}\mathrm{r}}}{{\rho }_{\mathrm{r}\mathrm{e}\mathrm{d}}} 。 \end{split}$$ 其中:IEVI、IRVI分别表示增强型植被指数(EVI)和比值指数(RVI),ρnir为近红外波段反射率,ρred为红光波段反射率,ρblue为蓝光波段反射率。利用mSG平滑算法对EVI和RVI进行处理,以减少噪声影响[28]。
-
变量数量的增加可能会导致“维数灾难”,造成运算复杂,处理速度下降[19]。为充分利用模型输入变量的特征,需要选择最优变量特征构建SVR模型。随机森林算法预测能力强,鲁棒性较好,适合处理高维数据集,计算自变量对因变量的相对重要性[29]。因此,可采用随机森林算法选择SVR模型的输入变量,即通过计算均方差增量百分数来度量和评估各变量特征对竹林地上生物量的相对重要性。随机森林参数的最优ntree值为2 000,mtry采用模型默认值,即变量个数的1/3[25]。
SVR通过选择合适的核函数将样本数据从低维空间转换到高维空间,使得低维空间内的非线性问题可在高维空间中线性处理,并保证其良好的泛化能力。本研究设置radial、linear、polynomial和sigmoid等4种核函数[30],比较分析后选择最优核函数构建竹林地上生物量估算模型。采用随机不重复抽样法从182个竹林样本中抽取50%作为训练样本,剩余的50%作为验证样本。
-
利用决定系数(R)、均方根误差(RMSE)和P (t检验)评价SVR模型模拟地上生物量的精度、误差和显著性水平,R较高且RMSE较低,说明模型估算结果较好。计算公式如下:
$$ \begin{split} \;& R=\sqrt{1-\frac{\displaystyle \sum _{i=1}^{N}({y}_{{\rm{m}}}-{y}_{{\rm{o}}}{)}_{i}^{2}}{\displaystyle \sum _{i=1}^{N}({y}_{{\rm{o}}}-{\bar{y}_{{\rm{o}}}}{)}_{i}^{2}}} \text{;}\\ \;& R_{\rm{MSE}}=\sqrt{\frac{1}{N}\sum _{i=1}^{N}{\left|{y}_{{\rm{m}}}-{y}_{{\rm{o}}}\right|}_{i}^{2}} 。 \end{split}$$ 其中:N为样本个数,i=1, 2
$, \;\cdots , $ N;ym表示模型模拟值,yo表示实测值;$ {\bar{y}}_{{\rm{o}}} $ 为N个实测值的平均值。 -
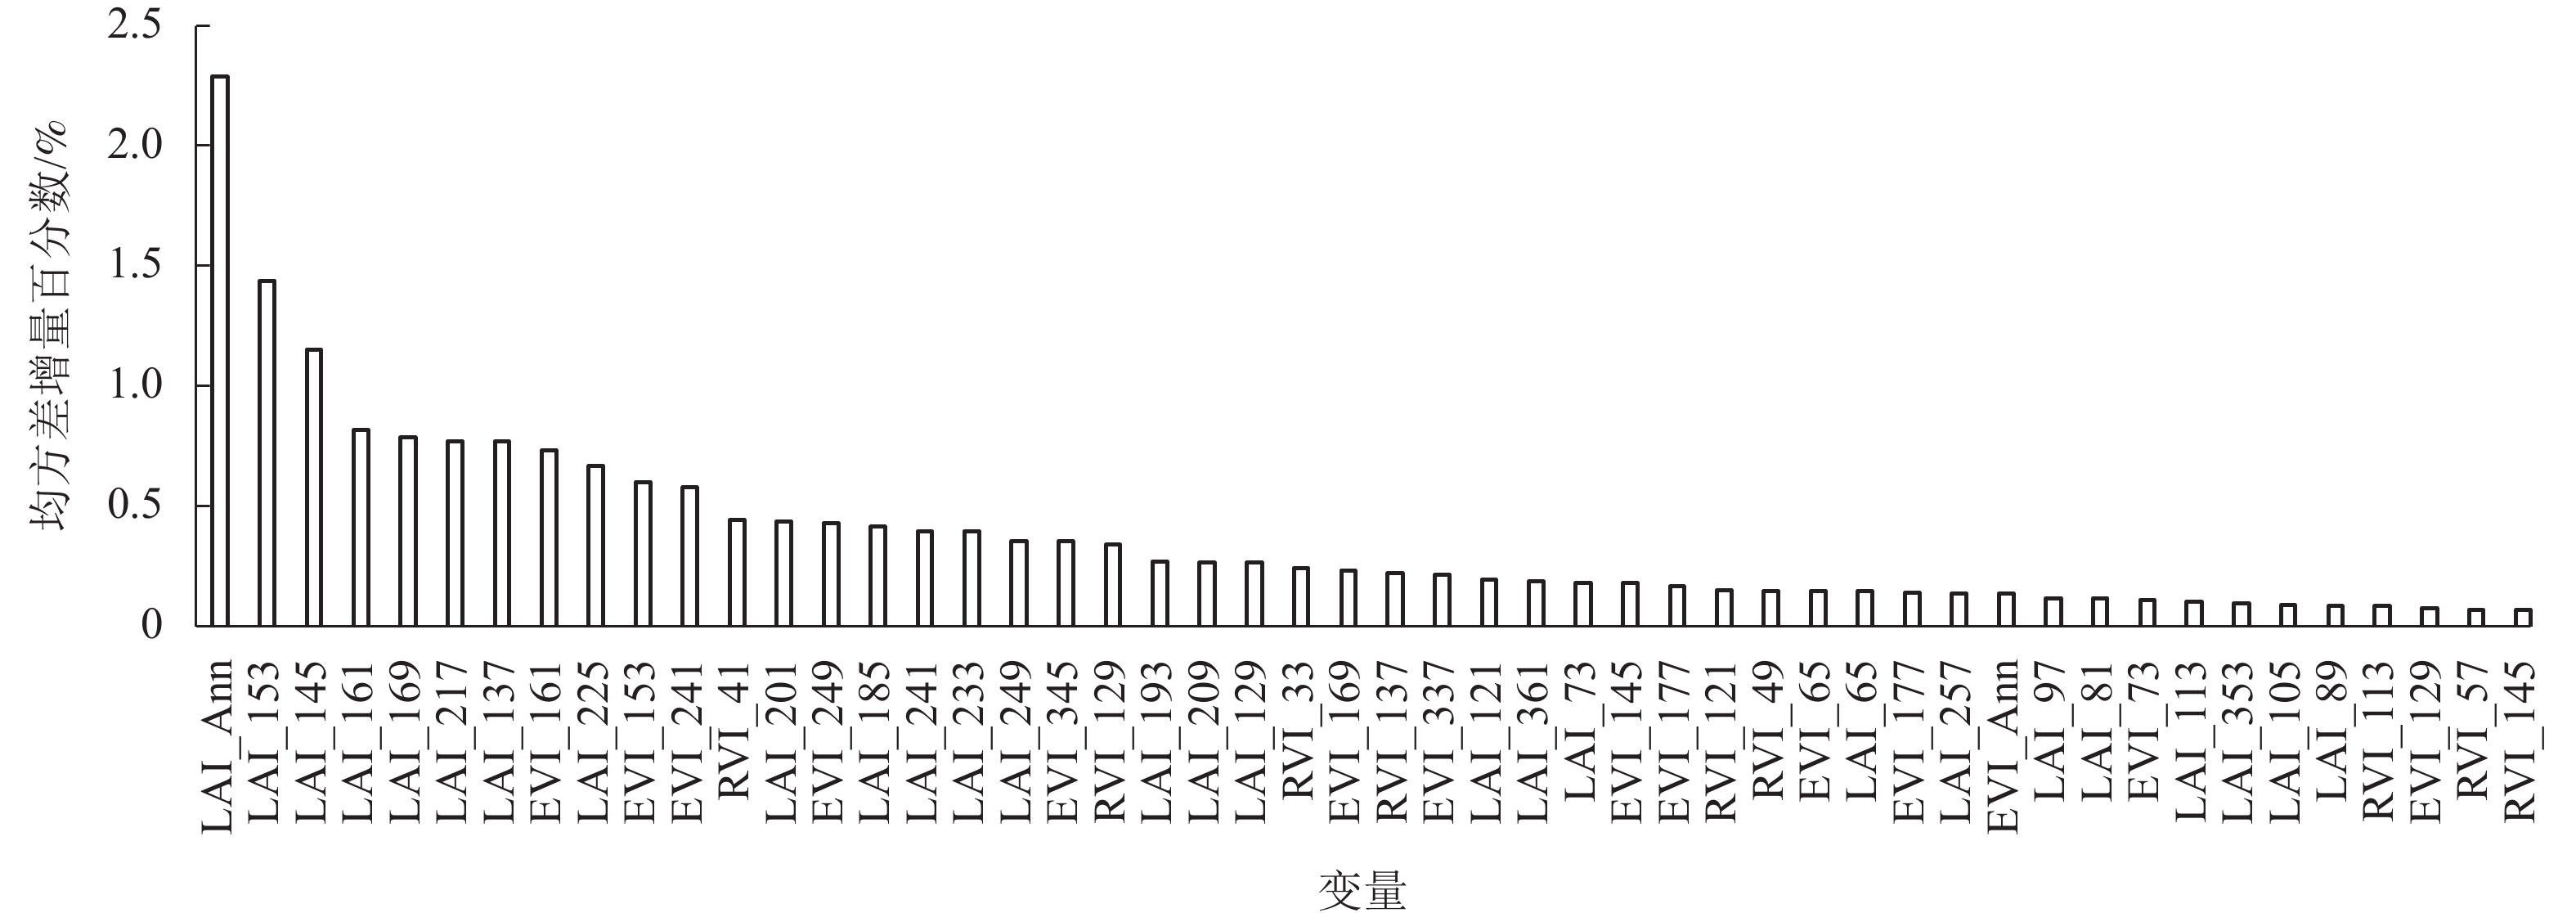
基于随机森林算法得到EVI、RVI、LAI等141个输入变量对竹林AGB影响的重要性得分,由图1可知:不同时间的叶面积指数、增强型植被指数和比值指数对竹林地上生物量影响存在较大的差异,其中LAI时间序列变量占比最大,RVI变量占比最小。在前50个影响较大的变量中,有43个对竹林地上生物量影响的重要性得分大于0.10%,LAI年均值(LAI_Ann)重要性得分最大(2.29%),LAI时间序列变量中,LAI_153(第153天LAI值)最大,为1.44%,LAI_113最小,为0.10%。因此选取变量重要性得分大于0.10%的43个变量作为SVR模型输入变量,构建竹林地上生物量估算模型。
-
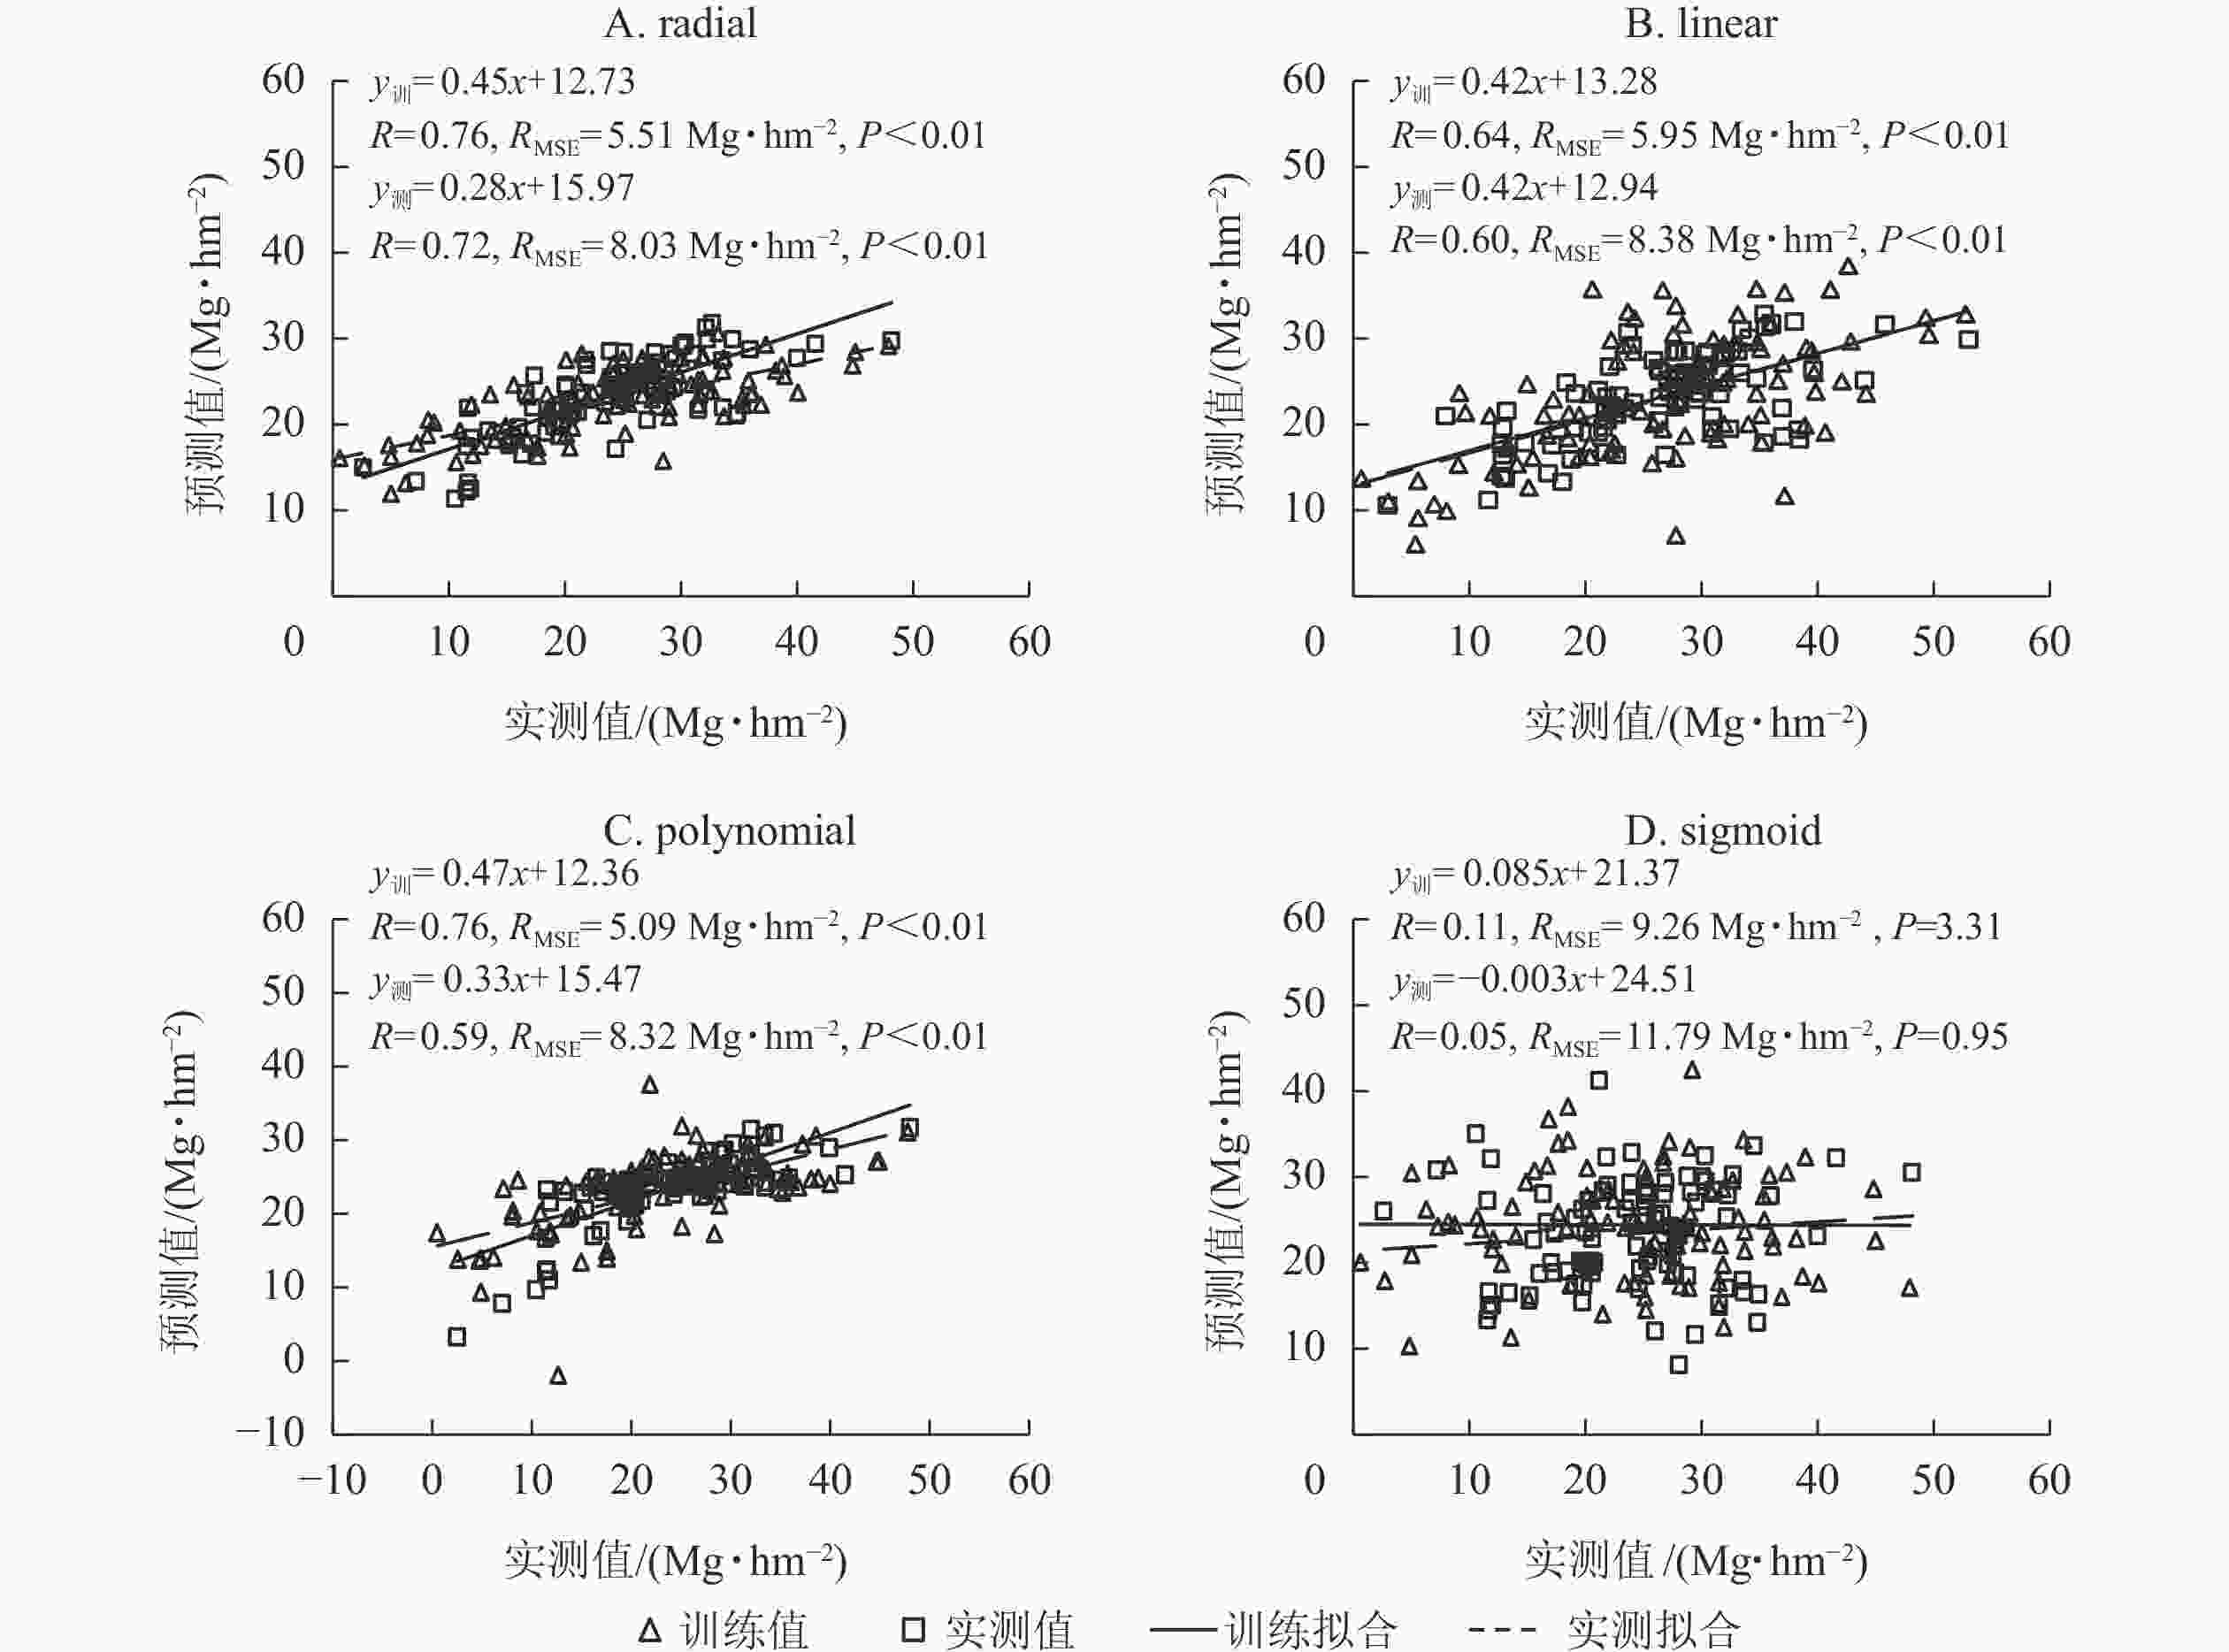
利用筛选的变量,分别以radial、linear、polynomial和sigmoid等4种核函数构建竹林地上生物量估算模型。由图2可知:基于radial函数的SVR模型的训练和测试精度(R)均最高,RMSE最低,估算地上生物量和实测地上生物量的精度(R)分别为0.76和0.72,RMSE分别为5.15和8.03 Mg·hm−2;其次是linear函数,训练和测试精度(R)分别为0.64和0.60,RMSE分别为5.95和8.38 Mg·hm−2;sigmoid函数训练和测试精度(R)最低,均<0.15,RMSE最大,均>9 Mg·hm−2。polynomial函数构建的SVR模型在估算竹林地上生物量的训练和测试精度均较高,但测试样本中估算地上生物量时出现负值,因此本研究选择基于radial核函数构建的SVR模型估算浙江省竹林地上生物量。

图 2 不同核函数构建的SVR模型估算竹林地上生物量的精度
Figure 2. Estimating accuracy of 4 kernel functions in SVR model for aboveground biomass of bamboo forest
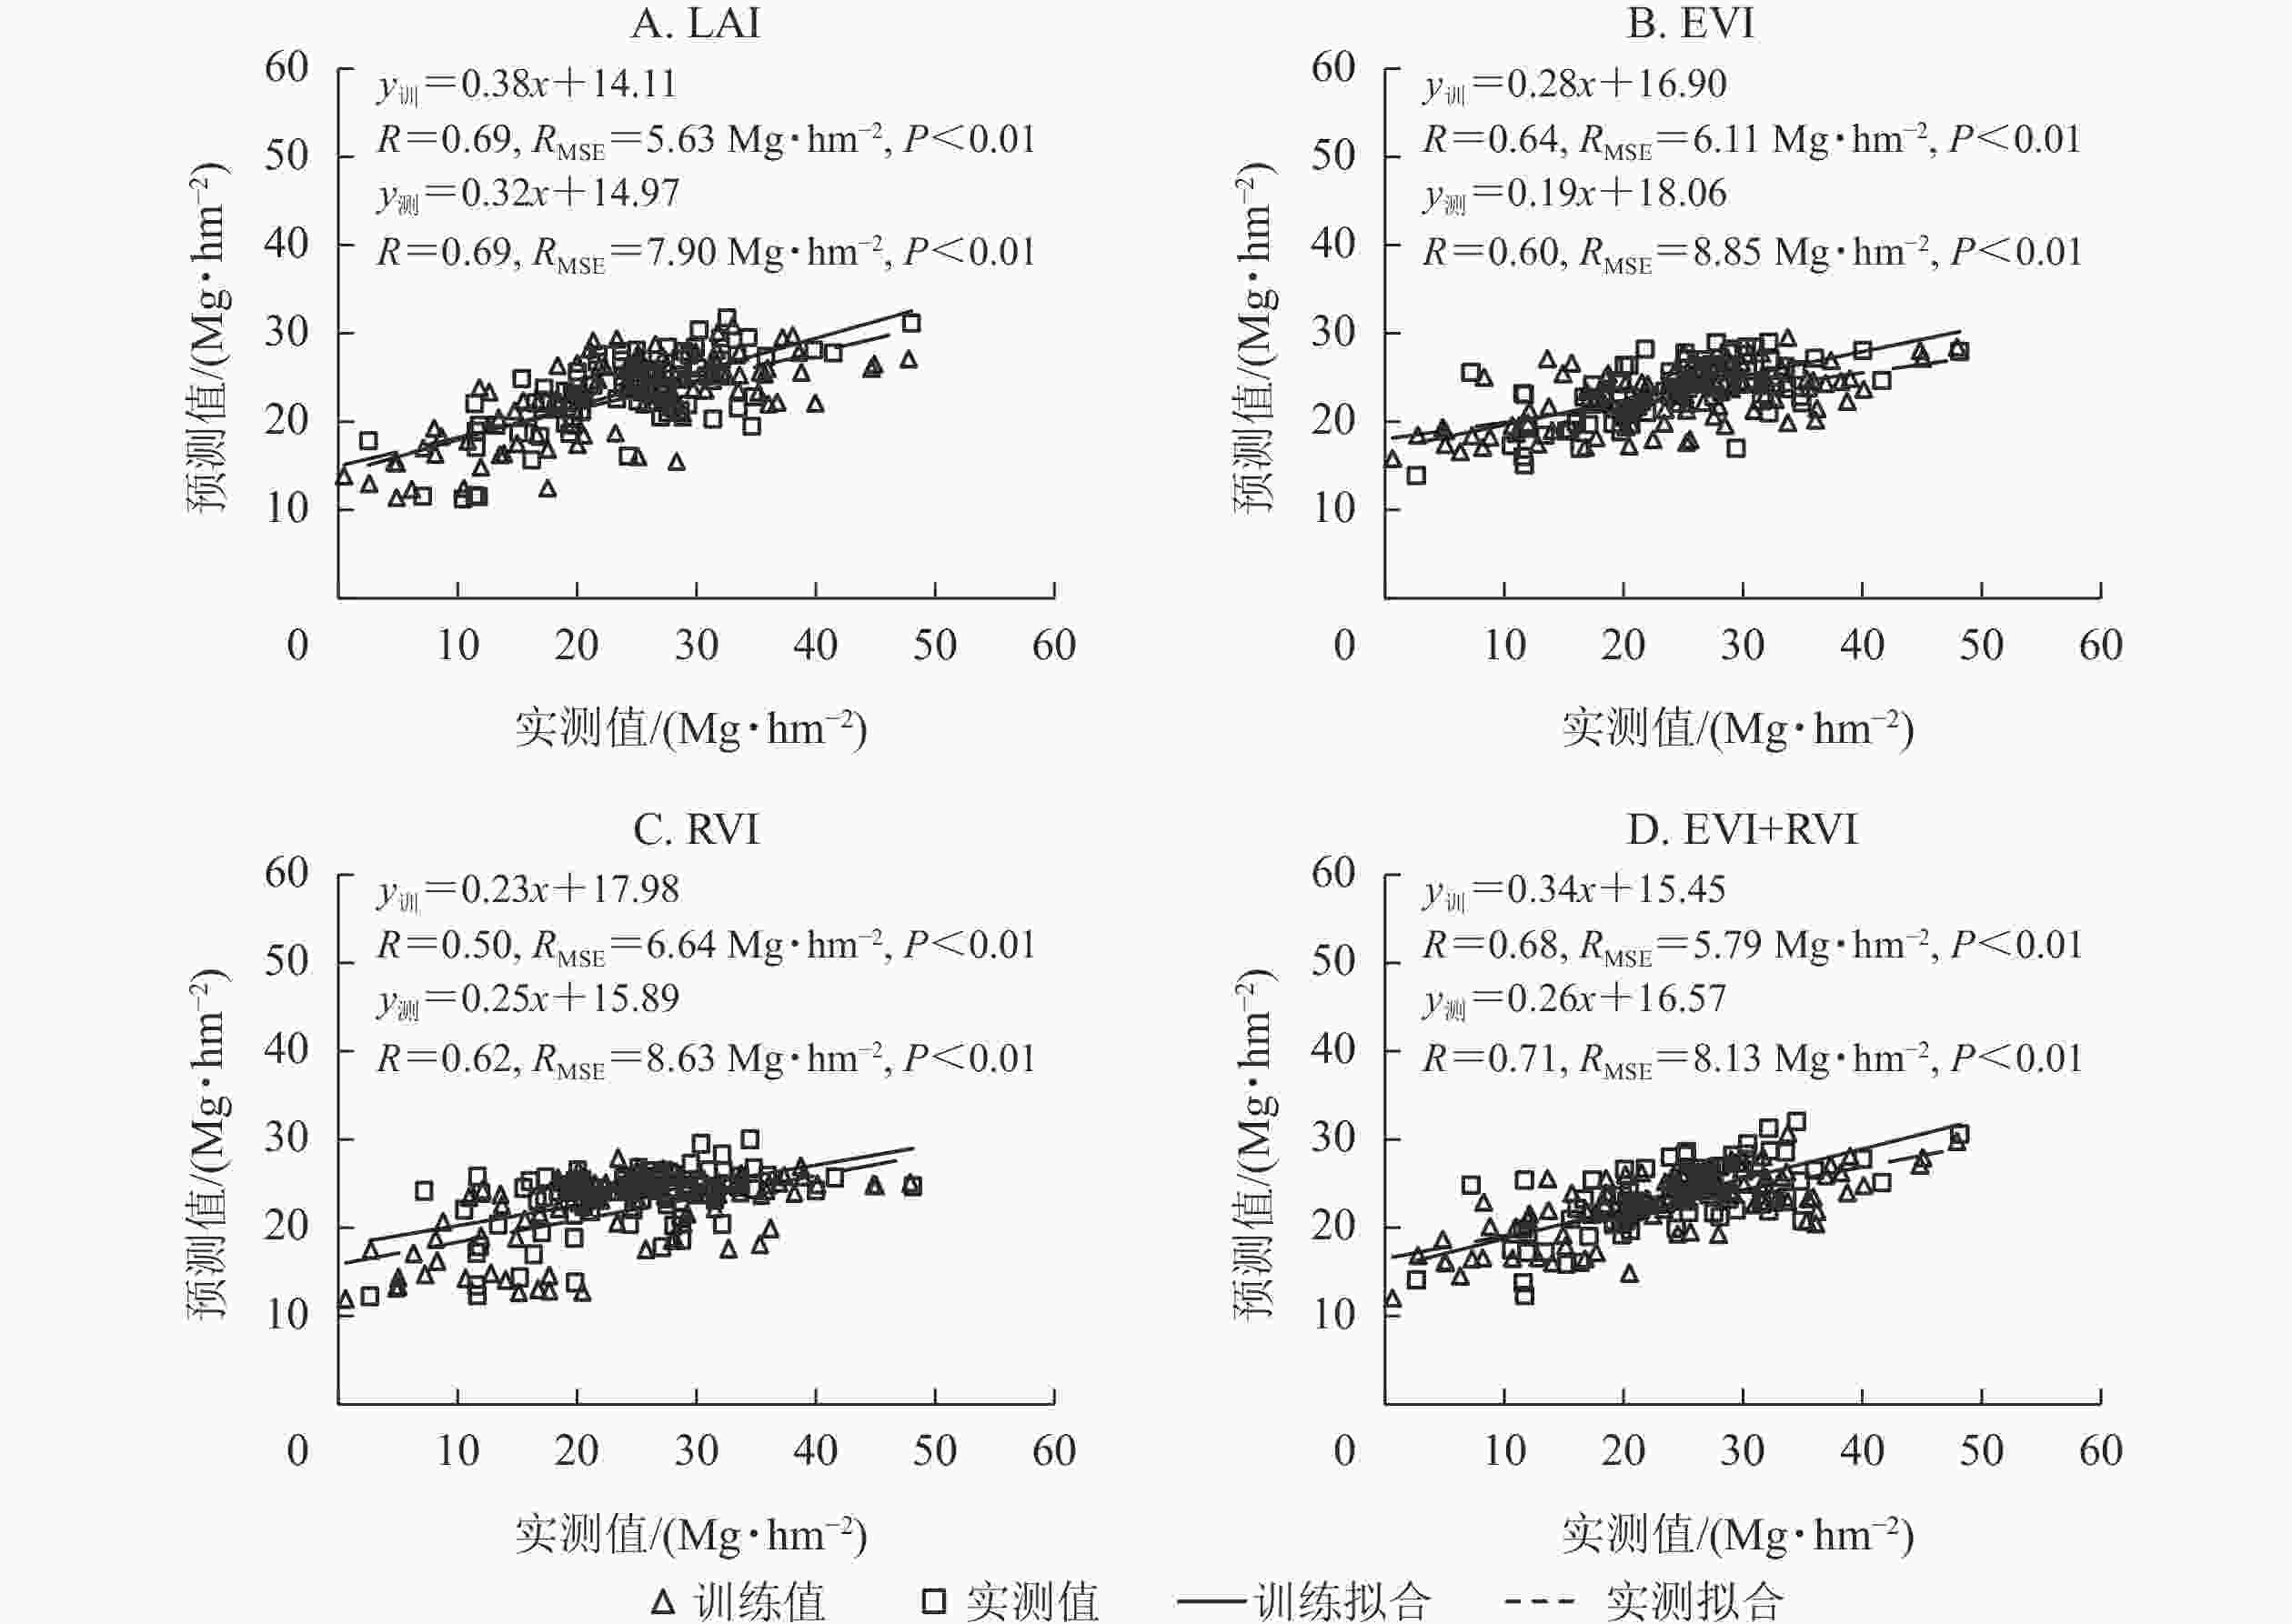
基于radial核函数构建SVR模型,分别利用单一变量时间序列数据和植被指数组合(EVI+RVI)测试模型精度。由图3可见:利用单一变量(EVI或RVI)时间序列数据构建的SVR模型估算竹林地上生物量,精度较低(R<0.65),RMSE较大;利用单一变量LAI时间序列数据和植被指数组合(EVI+RVI)模拟的AGB的精度(R>0.65)较高,RMSE较小。结合图2A可知:基于radial核函数的SVR模型,利用LAI、EVI和RVI时间序列数据估算竹林地上生物量,训练精度和测试精度均最高,误差均最低。即利用LAI、EVI、RVI时间序列数据,基于radial核函数构建SVR模型,可有效模拟竹林地上生物量的时空分布。
-
基于radial核函数构建的SVR模型,结合竹林丰度信息,估算得到浙江省竹林地上生物量统计变化值,由表1可知:浙江省全省竹林地上生物量均值为7.85 Mg·hm−2,总地上生物量为3.31×10⁷ Mg;浙江省竹林地上生物量在各市具有明显的差异性,其中:湖州市、杭州市、金华市、绍兴市和宁波市的竹林地上生物量均值均大于全省均值;湖州市竹林地上生物量均值最大为13.56 Mg·hm−2,总地上生物量为2.13×10⁶ Mg,占全省总地上生物量的6.44%,但其竹林面积仅占3.73%;杭州市地上生物量均值为9.86 Mg·hm−2,总地上生物量为8.48×10⁶ Mg,占全省总地上生物量的25.42%,竹林面积占20.24%;舟山市地上生物量均值最低,为5.72 Mg·hm−2,总地上生物量为6.89×10⁴ Mg,占全省总地上生物量的0.21%,竹林面积占0.29%。
表 1 基于SVR模型模拟的浙江省竹林地上生物量统计值
Table 1. Statistical values of aboveground biomass of bamboo forest in Zhejiang Province based on SVR model
区域 地上生物量/(Mg·hm−2) 总地上生物量/Mg 竹林面积占比/% 总地上生物量占比/% 最小值 最大值 均值 标准差 全省 0.001 30.39 7.85 5.04 3.31×10⁷ 丽水市 0.001 26.29 6.52 4.14 6.18×10⁶ 22.46 18.66 杭州市 0.001 28.45 9.86 5.63 8.42×10⁶ 20.24 25.42 金华市 0.003 27.26 8.10 4.39 4.04×10⁶ 11.82 12.20 温州市 0.001 27.54 6.13 3.83 3.06×10⁶ 11.81 9.23 衢州市 0.001 30.06 6.89 5.05 2.66×10⁶ 9.15 8.03 台州市 0.004 25.19 6.84 4.06 2.44×10⁶ 8.45 7.36 绍兴市 0.003 30.39 8.18 5.09 2.11×10⁶ 6.10 6.36 宁波市 0.006 25.63 8.08 4.81 2.02×10⁶ 5.91 6.09 湖州市 0.027 29.80 13.56 6.31 2.13×10⁶ 3.73 6.44 舟山市 0.051 14.19 5.72 3.38 6.89×10⁴ 0.29 0.21 嘉兴市 0.260 11.75 7.14 2.51 9.64×10³ 0.03 0.03 -
本研究基于叶面积指数、增强型植被指数和比值指数等多变量,构建并优选SVR模型,实现浙江省竹林地上生物量较高精度的估算。SVR模型耦合LAI、EVI、RVI时间序列数据估算竹林地上生物量与实测值间仍存在一定的误差。当实测值较小时(<20 Mg·hm−2),估算值高于实测值,即低值高估;而实测值较高时(>30 Mg·hm−2),估算的地上生物量低于实测数据,即高值低估。可见本研究构建的SVR模型并不能完全消除地上生物量估算的饱和现象。
本研究发现:基于单一变量的SVR模型模拟竹林地上生物量效果较差,而多变量的参与尤其是LAI的参与有效提高了模型预测精度。本研究中,植被指数(EVI+RVI)构建的SVR模型模拟竹林地上生物量的精度分别为0.68和0.71,RMSE分别为5.79和8.13 Mg·hm−2,而加入LAI后,R分别提高了11.76%和1.41%,而RMSE分别降低了11.05%和1.23%,模型预测能力明显增加。一方面,叶面积指数是反映植被固碳能力的重要参数,能够体现竹林观测结构及时间动态;另一方面,本研究采用粒子滤波同化算法对MODIS LAI时间序列数据进行同化[17, 26],使得叶面积指数年际动态变化趋势与竹林生长特征相吻合[31],减弱了信号饱和对地上生物量估算的影响。
已有研究[7, 11]认为:调查样地与遥感影像尺度匹配的差异会加大SVR模型的估算误差。为与MODIS数据匹配,本研究将30 m×30 m竹林样地进行了线性转换,但由于没有考虑混合像元的影响,样地尺度转换出现误差,并由此加大了模型估算误差。相关研究[6, 25]表明:在大尺度森林地上生物量估算中利用森林丰度数据能够减少估算的不确定性。因此,本研究采用混合像元分解方法提取了竹林丰度信息,并乘以模型模拟的竹林地上生物量,进而得到浙江省竹林地上生物量时空分布,尽可能地降低了混合像元对生物量空间估算的影响。
-
本研究基于MODIS LAI、EVI、RVI时间序列数据,采用支持向量回归模型结合随机森林算法,在变量筛选和模型优选的基础上,实现了浙江省竹林地上生物量较高精度的估算。结果表明:①基于随机森林模型筛选出43个对竹林地上生物量影响最大的变量,其中LAI时间序列数据的贡献最大;②基于radial核函数耦合LAI、EVI、RVI时间序列数据,构建的SVR模型训练和测试精度均最高(R分别为0.76和0.72),均方根误差均最低(分别为5.15和8.03 Mg·hm−2);③由SVR模型估算得到浙江省竹林地上生物量,全省竹林地上生物量均值为7.85 Mg·hm−2,总地上生物量为3.31×10⁷ Mg;浙江省竹林地上生物量在各市具有明显的差异性,其中,湖州市、杭州市、金华市、绍兴市和宁波市的竹林地上生物量均值均大于全省均值,表明其竹林经营效果相对较好。研究结果为大范围竹林碳汇遥感精准监测提供了较好的方法。
Estimating bamboo forest aboveground biomass based on MODIS time series data
-
摘要:
目的 基于浙江省中分辨率成像光谱仪(MODIS)时间序列数据,对浙江省竹林地上生物量进行估算,为竹林碳汇遥感监测提供参考。 方法 以MODIS叶面积指数(LAI)、增强型植被指数(EVI)和比值指数(RVI)时间序列数据为变量,利用随机森林模型筛选变量,采用支持向量回归(SVR)模型估算研究区竹林地上生物量。 结果 随机森林模型共筛选出43个对竹林地上生物量影响最大的变量;基于43个变量,采用radial核函数构建的SVR模型预测能力最强,模型训练精度和测试精度分别为0.76和0.72,均方根误差分别为5.15和8.03 Mg·hm−2。浙江省全省竹林地上生物量均值为7.85 Mg·hm−2,总地上生物量为3.31×10⁷ Mg;浙江省竹林地上生物量在各市具有明显的差异性,其中,湖州市、杭州市、金华市、绍兴市和宁波市的竹林地上生物量均值均大于全省均值,湖州市竹林地上生物量均值最大,为13.56 Mg·hm−2,舟山市地上生物量均值最小,为5.72 Mg·hm−2。 结论 耦合了MODIS LAI、EVI、RVI时间序列数据的SVR模型可实现浙江省竹林地上生物量较高精度的估算。图3表1参31 Abstract:Objective This study, based on the time series data of moderate resolution imaging spectrometer (MODIS) in Zhejiang Province, is aimed to estimate the aboveground biomass (AGB) of bamboo forest in Zhejiang Province to provide reference for remote sensing monitoring of bamboo carbon sink. Method The time series data of MODIS leaf area index (LAI), enhanced vegetation index (EVI) and ratio vegetation index (RVI) were taken as variables before they were screened by random forest model, and then the AGB of bamboo forest in the study area was estimated employing support vector regression (SVR) model. Result Of all the variables screened by random forest model, 43 had the greatest impact on bamboo forest AGB, and the SVR model constructed by radial kernel function based on them has the strongest prediction ability with its training accuracy and test accuracy being 0.76 and 0.72 while the root mean squared error (RMSE) being 5.15 and 8.03 Mg·hm−2 respectively. The average aboveground biomass of bamboo forest in Zhejiang Province was 7.85 Mg·hm−2 whereas the total aboveground biomass was 3.31×10⁷ Mg. There was an evident diversity in the aboveground biomass of bamboo forest among the cities across Zhejiang Province among which the average aboveground biomass of bamboo forest in Huzhou City, Hangzhou City, Jinhua City, Shaoxing City and Ningbo City was greater than the provincial average value, with that of Huzhou City being the largest (13.56 Mg·hm−2) while that of Zhoushan City being the smallest (5.72 Mg·hm−2). Conclusion The SVR Model coupled with MODIS LAI, EVI, RVI time series data could serve to realize the high-precision estimation of bamboo forest AGB in Zhejiang Province. [Ch, 3 fig. 1 tab. 31 ref.] -
Key words:
- bamboo forest /
- aboveground biomass (AGB) /
- SVR model /
- Random Forest Model /
- MODIS dataset
-
表 1 基于SVR模型模拟的浙江省竹林地上生物量统计值
Table 1. Statistical values of aboveground biomass of bamboo forest in Zhejiang Province based on SVR model
区域 地上生物量/(Mg·hm−2) 总地上生物量/Mg 竹林面积占比/% 总地上生物量占比/% 最小值 最大值 均值 标准差 全省 0.001 30.39 7.85 5.04 3.31×10⁷ 丽水市 0.001 26.29 6.52 4.14 6.18×10⁶ 22.46 18.66 杭州市 0.001 28.45 9.86 5.63 8.42×10⁶ 20.24 25.42 金华市 0.003 27.26 8.10 4.39 4.04×10⁶ 11.82 12.20 温州市 0.001 27.54 6.13 3.83 3.06×10⁶ 11.81 9.23 衢州市 0.001 30.06 6.89 5.05 2.66×10⁶ 9.15 8.03 台州市 0.004 25.19 6.84 4.06 2.44×10⁶ 8.45 7.36 绍兴市 0.003 30.39 8.18 5.09 2.11×10⁶ 6.10 6.36 宁波市 0.006 25.63 8.08 4.81 2.02×10⁶ 5.91 6.09 湖州市 0.027 29.80 13.56 6.31 2.13×10⁶ 3.73 6.44 舟山市 0.051 14.19 5.72 3.38 6.89×10⁴ 0.29 0.21 嘉兴市 0.260 11.75 7.14 2.51 9.64×10³ 0.03 0.03 -
[1] HU Huifeng, WANG G G. Changes in forest biomass carbon storage in the South Carolina Piedmont between 1936 and 2005 [J]. For Ecol Manage, 2008, 255: 1400 − 1408. [2] HAN Ning, DU Huaqiang, ZHOU Guomo, et al. Spatiotemporal heterogeneity of Moso bamboo aboveground carbon storage with Landsat Thematic Mapper images: a case study from Anji County, China [J]. Int J Remote Sensing, 2013, 34(14): 4917 − 4932. [3] FANG Jingyun, CHEN Anping, PENG Changhui, et al. Changes in forest biomass carbon storage in China between 1949 and 1998 [J]. Science, 2001, 292(5525): 2320 − 2322. [4] 黄兴召, 王泽夫, 徐小牛. 生物量转换因子连续函数的拟合方法比较[J]. 浙江农林大学学报, 2017, 34(5): 775 − 781. HUANG Xingzhao, WANG Zefu, XU Xiaoniu. Comparison of fitting approaches with biomass expansion factor equations [J]. J Zhejiang A&F Univ, 2017, 34(5): 775 − 781. [5] 续珊珊, 姚顺波. 基于生物量转换因子法的我国森林碳储量区域差异分析[J]. 北京林业大学学报(社会科学版), 2009, 8(3): 109 − 114. XU Shanshan, YAO Shunbo. Analysis on regional differences of forest carbon storage in China based on biomass expansion factor [J]. J Beijing For Univ Soc Sci, 2009, 8(3): 109 − 114. [6] ZHU Xiaolin, LIU Desheng. Improving forest aboveground biomass estimation using seasonal Landsat NDVI time-series [J]. ISPRS J Photogramm Remote Sensing, 2015, 102: 222 − 231. [7] DONG Taifeng, LIU Jiangui, QIAN Budong, et al. Estimating winter wheat biomass by assimilating leaf area index derived from fusion of Landsat-8 and MODIS data [J]. Int J Appl Earth Obs Geoinf, 2016, 49: 63 − 74. [8] DU Huaqiang, ZHOU Guomo, GE Hongli, et al. Satellite-based carbon stock estimation for bamboo forest with a non-linear partial least square regression technique [J]. Int J Remote Sensing, 2012, 33(6): 1917 − 1933. [9] LU Dengsheng. The potential and challenge of remote sensing-based biomass estimation [J]. Int J Remote Sensing, 2006, 27(7): 1297 − 1328. [10] PHAM L T H, BRABYN L. Monitoring mangrove biomass change in Vietnam using SPOT images and an object-based approach combined with machine learning algorithms [J]. ISPRS J Photogramm Remote Sensing, 2017, 128: 86 − 97. [11] SHANG Zhenzhen, ZHOU Guomo, DU Huaqiang, et al. Moso bamboo forest extraction and aboveground carbon storage estimation based on multi-source remotely sensed images [J]. Int J Remote Sensing, 2013, 34(15): 5351 − 5368. [12] YAN Feng, WU Bo, WANG Yanjiao. Estimating spatiotemporal patterns of aboveground biomass using Landsat TM and MODIS images in the Mu Us Sandy Land, China [J]. Agric For Meteorol, 2015, 200: 119 − 128. [13] TIAN Xin, LI Zengyuan, SU Zhongbo, et al. Estimating montane forest above-ground biomass in the upper reaches of the Heihe River Basin using Landsat-TM data [J]. Int J Remote Sensing, 2014, 35(21): 7339 − 7362. [14] FENG Yunyun, LU Dengsheng, CHEN Qi, et al. Examining effective use of data sources and modeling algorithms for improving biomass estimation in a moist tropical forest of the Brazilian Amazon [J]. Int J Digit Earth, 2017, 10(10): 996 − 1016. [15] 丁志丹, 孙玉军, 孙钊. 基于GF-2的乔木生物量估测模型研究[J]. 北京师范大学学报(自然科学版), 2021, 57(1): 135 − 141. DING Zhidan, SUN Yujun, SUN Zhao. Estimation of tree biomass with GF-2 [J]. J Beijing Norm Univ Nat Sci, 2021, 57(1): 135 − 141. [16] LI Manqi, IM J, QUACKENBUSH L J, et al. Forest biomass and carbon stock quantification using Airborne LiDAR data: a case study over Huntington Wildlife Forest in the Adirondack Park [J]. IEEE J Sel Topics Appl Earth Obs Remote Sensing, 2017, 7(7): 3143 − 3156. [17] LI Xuejian, DU Huaqiang, ZHOU Guomo, et al. Phenology estimation of subtropical bamboo forests based on assimilated MODIS LAI time series data [J]. ISPRS J Photogramm Remote Sensing, 2021, 173(6): 262 − 277. [18] MAO Fangjie, DU Huaqiang, ZHOU Guomo, et al. Coupled LAI assimilation and BEPS model for analyzing the spatiotemporal pattern and heterogeneity of carbon fluxes of the bamboo forest in Zhejiang Province, China [J]. Agric For Meteorol, 2017, 242: 96 − 108. [19] DU Huaqiang, MAO Fangjie, ZHOU Guomo, et al. Estimating and analyzing the spatiotemporal pattern of aboveground carbon in bamboo forest by combining remote sensing data and improved BIOME-BGC Model [J]. IEEE J Sel Topics Appl Earth Obs Remote Sensing, 2018, 11(7): 2282 − 2295. [20] 李喜佳, 肖志强, 王锦地, 等. 双集合卡尔曼滤波估算时间序列LAI[J]. 遥感学报, 2014, 18(1): 27 − 44. LI Xijia, XIAO Zhiqiang, WANG Jindi, et al. Dual ensemble kalman filter assimilation method for estimating time series LAI [J]. J Remote Sensing, 2014, 18(1): 27 − 44. [21] HE Binbin, LI Xing, QUAN Xingwen, et al. Estimating the aboveground dry biomass of grass by assimilation of retrieved LAI into a crop growth model [J]. IEEE J Sel Topics Appl Earth Obs Remote Sensing, 2015, 8(2): 550 − 561. [22] JONCKHEERE I, FLECK S, NACKAERTS K, et al. Review of methods for in situ leaf area index determination: Part Ⅰ. theories, sensors and hemispherical photography [J]. Agric For Meteorol, 2004, 121(1/2): 19 − 35. [23] LI Yangguang, HAN Ning, LI Xuejian, et al. Spatiotemporal estimation of bamboo forest aboveground carbon storagebased on landsat data in Zhejiang, China [J/OL]. Remote Sensing, 2018, 10(6): 898[2021-06-15]. doi: 10.3390/rs10060898. [24] SARKER L R, NICHOL J E. Improved forest biomass estimates using ALOS AVNIR-2 texture indices [J]. Remote Sensing Environ, 2011, 115(4): 968 − 977. [25] LI Xuejian, DU Huaqiang, MAO Fangjie, et al. Estimating bamboo forest aboveground biomass using EnKF-assimilated MODIS LAI spatiotemporal data and machine learning algorithms [J]. Agric For Meteorol, 2018, 256/257: 445 − 457. [26] MAO Fangjie, LI Xuejian, DU Huaqiang, et al. Comparison of two data assimilation methods for improving MODIS LAItime series for bamboo forests [J/OL]. Remote Sensing, 2017, 9(5): 401[2021-06-12]. doi: 10.3390/rs9050401. [27] CHEN Jingming, DENG Feng, CHEN Mingzhen. Locally adjusted cubic-spline capping for reconstructing seasonal trajectories of a satellite-derived surface parameter [J]. IEEE Trans Geosci Remote Sensing, 2006, 44(8): 2230 − 2238. [28] CHEN Jin, JÖNSSON P, TAMURA M, et al. A simple method for reconstructing a high-quality NDVI time-series data set based on the Savitzky-Golay filter [J]. Remote Sensing Environ, 2004, 91(3/4): 332 − 344. [29] BREIMAN L. Random forests [J]. Mach Learn, 2001, 45: 5 − 32. [30] FAN R E, CHEN P H, LIN C J. Working set selection using second order information for training Support Vector Machine [J]. J Mach Learn Res, 2005, 6: 1889 − 1918. [31] 陆国富, 杜华强, 周国模, 等. 毛竹笋快速生长过程中冠层参数动态及其与光合有效辐射的关系[J]. 浙江农林大学学报, 2012, 29(6): 844 − 850. LU Guofu, DU Huaqiang, ZHOU Guomo, et al. Dynamic change of Phyllostachys edulis forest canopy parameters and their relationships with photosynthetic active radiation in the bamboo shooting growth phase [J]. J Zhejiang A&F Univ, 2012, 29(6): 844 − 850. -

-
链接本文:
https://zlxb.zafu.edu.cn/article/doi/10.11833/j.issn.2095-0756.20210431


 下载:
下载:


