


-
国有林区是中国重要的生态安全屏障,在国民经济建设和生态文明建设中发挥着不可替代的重要作用。长期以来,国有林区管理体制不完善,森林资源过度开发,职工生活贫困,民生问题较为突出。1998年,国家启动天然林保护工程后,国有林区职工家庭人均收入水平虽然有所提高,但仅为同期城镇居民人均收入水平的44%[1]。为了摆脱困境,东北、内蒙古重点国有林区(以下简称重点国有林区)涌现出各种改革创新,诸如森林资源承包管护责任制,市场化手段组织林业生产,加工企业转制等。这些改革能否促进职工家庭人均收入增长,解决生活贫困问题,对于未来国有林区改革方案的制定具有现实意义。天然林保护工程扭转了国家在国有林区长期重取轻予的局面。对重点国有林区给予重金扶持,一定程度上缓解了林区积存的矛盾,给国有林区提供了一个喘息之机[2]。国有林区职工收入水平显著提高,收入结构变化明显。对于出现这些变化的原因被归结为,国有林区加工企业改制使许多企业扭亏为盈,提高了职工工资水平;产业结构调整、多种经营等改革创新推动新的劳动力要素市场形成和发育,使林区职工收入来源日益多元化 [1, 3-4]。虽然以上研究均表明重点国有林区在实施各项改革以后,职工收入水平不断提高,收入结构变化明显,但是在经济系统中同时还存在其他影响职工收入的因素。如果不控制这些因素的影响,那就会夸大改革对职工收入的影响。另外,从政策支持的角度出发,还需要回答不同改革创新的收入增长效应,以便提出更加有针对性的改革方向,已有的研究并没有给出明确的答案。鉴于此,本研究基于重点国有林区职工家庭跟踪调查数据,运用计量经济学研究方法,实证分析重点国有林区各项改革对职工家庭人均收入的影响。具体来说,本研究尝试回答以下2个问题:第一,重点国有林区职工家庭人均收入水平和收入结构变化情况;第二,考察重点国有林区各项改革对职工家庭人均收入的影响。本研究旨在评价已经开展的重点国有林区各项改革对林区职工家庭人均收入的影响,并为下一步重点国有林区改革方案的制定提供有价值的启示。
-
本研究使用的数据是北京大学国家发展研究院环境经济学研究小组在黑龙江、吉林、内蒙古重点国有林区进行的跟踪调查数据。数据库包括了1997年、2004年和2008年3个截面,跨越12 a周期,历时较长,涉及了3个重点国有林区的7个林业管理局中的24个林业局、206家加工企业和1 454户职工家庭,2009 年进行回访时有部分样本丢失,因此,1997年和2004年的样本数为1 454户,2008年的样本数为1 084 户(表 1)。按照调查方案,调查在林业局、加工企业和职工家庭3个层面展开,其中,林业局层面主要调查林业局各类资源、社会经济状况、经营情况和各种改革创新情况;加工企业层面主要调查企业转制、收益、管理等情况;职工层面主要是入户调查,调查内容包括家庭基本信息、生产就业情况、生活消费情况、各项收入情况、资产变化情况以及社会关系等方面。在对职工家庭收入进行调查时,每户家庭都详细调查了家庭成员的就业状况、家庭农业、林业、畜牧业生产情况以及其他收入情况。为保证数据在时间和空间上的可比性,将1997年、2004年收入数据采用居民消费者价格指数调整为2008年水平。
表 1 抽样样本点分布情况
Table 1. Sample distribution
省区 林业管理局 所辖林业局数 /个 样本林业局 户数 /户 回访户 /户 黑龙江 牡丹江 8 大海林 、 东京城 、 海林 180 141 合江 7 双鸭山 、 鹤北 、 清河 180 167 松花江 8 方正 、 绥棱 、 沾河 180 142 伊春 16 乌马河 、 金山屯 、 朗乡 、 双丰 、 汤旺河、 五营 371 270 吉林 吉林森工 8 临江 、 湾沟 、 松江河 183 146 延边 10 敦化 、 八家子 、 天桥岭 180 109 内蒙古 牙克石 17 尔山 、 库都尔 、 根河 180 109 小计 7 74 24 1 454 1 084 -
从实地调查来看,重点国有林区的基层林业局及加工企业自发进行的改革非常普遍。这些改革大致开始于20世纪80年代,1998年天然林保护工程之后大量兴起,改革的模式可以从4个方面加以归纳:
第1种改革是通过市场化手段组织林业生产。具体是指:在分配营林造林、苗圃经营、采伐作业、运输作业等林业生产任务时,采用招标等市场化方式,允许各种人员和组织参与竞标,获得经营权利。营林与采伐长期以来是重点国有林区计划管理的主要领域,生产作业一般是由林业局一个生产车间或者工队集体完成。实地调查发现,市场机制已经在重点国有林区各个层面逐渐深入,人们思维方式和经营理念也发生了变化,一些林业局已不再保留专业化的采伐和运输生产工队,探索使用市场手段进行林业生产,如内蒙古根河林业局、吉林松江河林业局等,这种方式避免了职工偷懒和搭便车的行为,改变了由企业统分任务统分薪水的局面,降低了生产成本,提高了工作效率,提升了经营效果,预期会提高林业局职工的收入水平。
第2种改革是森林资源承包管护责任制。这项改革实质是对森林资源产权的调整,是排他性经营管理森林的一种实践,在所有权属于国家保持不变的前提下,管护权和经营权下放,承包职工获得林地资源的接近权、排他权和收益权。此项改革改变了计划经济时期单纯依靠行政命令管理职工行为的模式,对保护森林资源和发展林区经济有显著作用 [5-6];同时,也有研究指出:此项改革并没有给职工生活带来较大改善[7]。通过实地调查发现,截至2008年,所有样本林业局均开展了这项改革,并对职工家庭人均收入产生了影响,主要体现在收入来源方面。首先,职工可以获得固定的管护费,同时,可以适度开发利用林下资源,东北、内蒙古重点国有林区跨寒带和温带,具有丰富和独特的野生动植物资源及非木质森林资源,非常适合发展林下多种经营活动,职工家庭从事森林药材、浆果、菌类的种植,森林禽类的养殖,预期会提高职工家庭的农业、林业、畜牧业收入。
第3种改革是加工企业转制。国有林区加工企业由于长年亏损、低产出、高消耗等原因,逐渐通过转制的方式寻找出路,主要方式是公司化、股份转移、承包租赁、抵押经营、集资等,将国有企业转变为非国有企业。实地调查发现,1997年样本区加工企业转制比例为5.83%,2004年增长为39.12%,2008年达到65.87%。企业转制以后,通过控制成本、合理分工、强化职责、开拓市场、转变营销方式使企业效益提高,扭亏为赢,预期加工企业转制会促进国有林区职工家庭人均非国有部门收入的提高。
第4种改革是一次性安置富余职工。国有林区由于计划经济时期对经济发展需要和企业生产经营需求考虑不够,造成了人员冗余问题。1998年实施天然林保护工程后,由于林业需求转变,木材停伐减产,又增加了大批富余人员。为了解决国有林区劳动力资源闲置问题,开始对富余职工进行一次性安置。此项改革对收入的影响比较复杂,一方面会降低安置职工家庭的人均林业收入和人均国有部门收入,另一方面又会提高安置职工家庭的人均非林业收入和人均非国有部门收入,而对其家庭人均收入的影响,则是以上收入增减变化之后的结果,理论上较难判定结果。
-
1997-2008年期间,重点国有林区职工家庭人均收入水平显著提高,从2 497.00元·人-1增长到8 602.62元·人-1,增长了244.52%;职工家庭收入结构也发生了明显变化,其中最显著的特征是职工家庭对林业和国有部门的依赖程度逐渐下降。
-
从表 2可以看出:1997-2008年重点国有林区职工家庭人均总收入略高于农村居民人均纯收入,但远远落后于城镇居民人均可支配收入,只相当于城镇居民人均可支配收入的一半。从收入平均增长速度来看,1997-2008年,重点国有林区职工家庭人均总收入平均增长速度最快,为11.90%,尤其是2004-2008年,在年平均增长速度均超过10%的水平上,重点国有林区职工家庭人均总收入增长速度最高,达17.49%。
表 2 家庭人均收入变化及平均增长速度
Table 2. Change in per capita income and average growth rate of per captia income of household
项目 收入 /元 收入平均增长速度 /% 1997 2004 2008 1997-2004 2004-2008 1997-2008 重点国有林区职工家庭人均总收入 2 497.00 4 515.34 8 602.62 8.83 17.49 11.90 全国城镇居民人均可支配收入 5 651.46 10 318.36 15 780.76 8.98 11.21 9.78 全国农村居民人均纯收入 2 367.72 3 193.76 4 760.62 4.37 10.49 6.56 说明 : 重点国有林职工家庭人均总收入根据调查问卷整理 , 全国城镇 、 农村居民收入源自 《中国统计年鉴》 ; 所有收入数据根据全国居民消费者价格指数调整到 2008 年水平 。 -
从收入和林业的关系来看,可以将重点国有林区职工家庭人均收入划分林业收入与非林业收入。其中,林业收入主要包括营林收入、采伐收入、管护收入、林业工业及运输收入、非木质林产品收入及林业管理等其他林业收入。非林业收入主要由农业收入、畜牧业收入、工业收入、商业收入、服务业收入及其他收入构成。从表 3可以看出,1997-2008年期间,重点国有林区职工家庭林业收入增长较快,从1997年的674.68元·人-1提高到2008年的1423.03元·人-1,年均增长7.02%以上;同期非林业收入增长更快,从1997年的1 822.32元·人-1提高到2008年的7 179.59元·人-1,平均增长速度达13.28%。从收入结构来看,林业收入占职工家庭人均收入的比例不断下降。1997年约为27.02%,2004年下降到18.73%,2008年进一步下降到16.54%。在此期间,非林业收入占职工家庭人均收入的比重则持续上升,由1997年的72.98%上升至2008年的83.46%。这在一定程度上表明,非林业收入对家庭总收入的贡献越来越大,国有林区职工家庭对林业的依赖程度下降。从林业收入的内部结构变化来看,采伐收入比例不断下降,1997年为4.32%到2008年下降至1.61%;林业工业及运输收入比例下降最为明显,从12.61%下降到1.50%。管护与林业管理的占比则呈增长趋势,这表明国有林区采伐活动大幅度减少,更多的人力被投入到管护与管理工作当中,这是天然林保护工程调减木材产量,加大森林资源管护力度的结果。
表 3 职工家庭人均收入构成变化(按行业分)
Table 3. Change in per capita income of household (divided by industry)
收入来源 职工家庭人均收入 /(元 ·人 -1) 职工家庭人均收入构成 /% 1997 2004 2008 1997 2004 2008 林业收入 674.68 845.56 1 423.03 27.02 18.73 16.54 其中 :营林收入 82.67 85.64 137.83 3.31 1.90 1.60 采伐收入 107.81 79.41 138.64 4.32 1.76 1.61 管护收入 34.63 82.32 163.43 1.39 1.82 1.90 林业工业及运输收入 314.98 296.35 129.36 12.61 6.56 1.50 林业管理等其他收入 131.11 208.87 764.15 5.25 4.63 8.88 非木质林产品收入 3.48 92.97 89.62 0.14 2.06 1.04 非林业收入 1 822.32 3 669.78 7 179.59 72.98 81.27 83.46 其中 :农业收入 177.21 714.70 769.53 7.10 15.83 8.95 畜牧业收入 19.65 212.55 131.96 0.79 4.71 1.53 工业收入 261.11 247.88 345.21 10.46 5.49 4.01 商业收入 47.40 131.71 538.24 1.90 2.92 6.26 服务业收入 440.14 795.26 1 547.86 17.63 17.61 17.99 其他收入 876.81 1 567.68 3 846.79 35.11 34.72 44.72 总计 2 497.00 4 515.34 8 602.62 100.00 100.00 100.00 说明:根据调查问卷整理 。 -
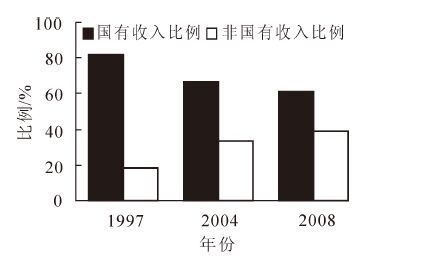
1997-2008年期间,重点国有林区职工家庭来自国有部门的收入比例下降了21.2个百分点。同期,来自非国有部门的收入比例则从17.9%上升至39.1%(图 1)。这一变化和重点国有林区职工的就业渠道不断增加相关,很多林区职工走出林业局,开始在本省、外省甚至国外工作。以样本区职工家庭户主的工作地点为例,1997年在林业局工作的比例达到95.0%,2008年下降至77.5%,下降了近18个百分点。在本省及外省工作的比例不断攀升,2008年在本省工作比例达到14.6%,在外省为7.8%。有一部分职工工作地点仍在林业局,但已不在国有部门工作(表 4)。1997年,工作地点为林业局但在非国有部门工作的职工占10.6%,2004年占20.7%,2008年占12.2%。工作地点的变化进一步说明国有林区职工家庭对国有部门的依赖程度在下降。

图 1 国有收入与非国有收入占总收入比例 变化图
Figure 1. The Proportion of household income from state- owned sector and non-state-owned sector
表 4 职工家庭户主工作地点的变化
Table 4. Change in employment location of householder
地点 户主工作地点百分比 /% 1997 2004 2008 林业局 95.0 91.5 77.5 其中 : 在国有部门工作 89.4 79.3 87.8 在非国有部门工作 10.6 20.7 12.2 林业局外 5.0 8.5 22.5 其中 : 在本省 4.1 6.1 14.6 在外省 0.8 2.1 7.8 在国外 0.1 0.3 0.1 说明 : 根据调查问卷整理 。 国有林区职工家庭人均收入按照来源还可分为工资性收入、转移性收入、经营性收入、财产性收入和其他收入(表 5)。工资性收入占家庭总收入的比例呈下降趋势,从66.1%降至43.5%,表明国有林区职工家庭不再主要依靠工资生活。转移性收入增长较为明显,从22.3%先后升至26.1%和37.6%,这与天然林保护工程的专项拨款资助有关。财产性收入及其他收入略有增长。表 5中,工资性收入的下降和经营性收入的上涨,进一步说明重点国有林区职工家庭对国有部门的依赖程度在下降。天然林保护工程开始以后,重点国有林区职工开始开展多种经营,包括发展种植业、畜牧业及渔业,在调查中有的家庭靠养殖林蛙Rana amurensis而致富,有的家庭靠采集非木质林产品(木耳Auricularia auricula-judae,蘑菇Agricus campestris等)而大大增加了收益。
表 5 职工家庭人均收入构成变化(按性质分)
Table 5. Change in per capita income of household (divided by nature)
收入构成 人均收入构成 /% 1997 2004 2008 工资性收入 66.1 48.1 43.5 转移性收入 22.3 26.1 37.6 其中退休金 17.3 19.2 25.3 经营性收入 10.0 23.1 15.6 财产性收入 0.9 0.7 1.4 其他收入 0.7 2.0 1.9 说明 : 根据调查问卷整理 。 -
为了考察重点国有林区各项改革对职工家庭人均收入的影响,本研究参考MINCER[8],高梦滔等[9]的方法,设定如下收入决定模型:
$${{y}_{ijt}}={{\beta }_{0}}+{{\beta }_{1}}{{x}_{ijt}}+{{\beta }_{2}}{{D}_{ijt}}+{{\varepsilon }_{ijt}}。$$ (1) 式(1)中:下标i代表林业局,j代表家庭样本,t代表时间;因变量yijt代表各种家庭人均收入(家庭人均非国有部门收入占家庭人均收入比例,家庭人均非林业收入占家庭人均收入比例),β表示回归系数,Dijt表示改革变量,是本研究关注的主要解释变量,εijt为误差项。xijt为其他控制变量,包括以下4类:第一,家庭特征变量。本研究主要采用家庭劳动力占家庭人口的比例。第二,人力资本变量。本研究使用劳动力平均年龄、劳动力平均教育年限以及职工平均工龄。按照通常的做法[10],本研究使用劳动力平均受教育年限作为人力资本的衡量指标;而职工平均工龄被作为收入决定方程衡量经验的指标。调查样本中,劳动力的受教育程度以小学和初中为主,合计占总样本的67.9%。第三,社会资本变量。采用职工家庭成员中是否有党员或林业部门干部衡量。已有研究认为,政治身份、社会地位对收入有一定影响 [11-12]。在国有林区,党员与干部通常社会关系更广,了解行业信息更多,更具备获得多种收入的能力,这里作为控制变量放入计量分析中。第四,资源禀赋变量。采用家庭是否承包农地和承包林地衡量。国有林区职工家庭与普通城镇居民家庭不同,他们更接近森林资源,可以承包经营农地,承包管护林地,在不破坏地表植被,不降低森林生态功能,不影响林木生长的前提下,允许开展林下经济,开展种植业、养殖业、菌类的采集等。这些都会影响职工家庭人均收入,因此有必要考虑农地、林地特征变量。表 6列出了经济计量中各变量的定义及描述性统计结果。
表 6 变量定义与描述性统计
Table 6. Statistics for variables
改革变量 变量 变量解释 1997 年 2004 年 2008 年 市场手段林业生产 市场化手段组织营林 、 采伐 、 运输作业 (实施年数 ) 3.23(5.19) 6.51(7.85) 8.85(9.34) 森林资源承包管护 森林资源承包管护责任制 /% 0.28(1.35) 10.20(9.13) 10.25(8.10) 加工企业转制 加工企业转制比例 /% 5.83(11.51) 39.12(33.48) 65.87(32.47) 一次性安置职工 一次性安置富余职工比例 /% 0.00(0.00) 7.15(2.57) 16.38(16.66) 家庭特征 劳动力占比 劳动力占家庭总人口比例 /% 0.66(0.31) 0.64(0.38) 0.66(0.39) 年龄 劳动力平均年龄 /a 31.04(13.54) 29.89(16.98) 30.10(17.71) 人力资本 教育程度 劳动力平均教育年限 /a 6.95(2.61) 7.77(2.88) 8.19(2.89) 工龄 国有职工平均工龄 /a 9.85(6.25) 12.78(7.56) 14.28(8.35) 社会资本 党员或林业 家庭成员中有无党员或林场 、林业 0.32(0.46) 0.36(0.48) 0.35(0.47) 部门干部 局干部 (1 为有 , 0 为无 ) 资源禀赋 农地 家庭是否承包农地 (1 为有 , 0 为无 ) 0.17(0.37) 0.17(0.38) 0.18(0.39) 林地 家庭是否承包林地 (1 为有 , 0 为无 ) 0.06(0.25) 0.07(0.25) 0.07(0.26) 样本量 1 454 1 454 1 084 说明 : 括号内为标准差 。 -
2009年进行回访调查时,由于搬家、外出打工、出差、旅游、拒绝访问、生病、去世等原因有370个样本损耗,为了提高估计的一致性,需要对数据进行处理。常用的解决面板数据损耗的方法有2种,一种认为样本的损耗是源于不可观测的变量,属于“样本自选择”,处理方法可采用基于选择偏误模型 [13-14];另一种认为样本的损耗是源于可观测的变量,需要控制这些变量来解决面板数据损耗偏误[15-16]。
本研究使用的调查数据包括3期,样本损耗只发生在第3期,不存在损耗样本再重新加入面板数据的情况,满足Wooldridge处理一般线性面板数据样本损耗的方法的假设条件。因此,可采用第2种处理样本损耗的方法,使用逆概率加权法(IPW),即假设第1期是全样本,之后每一期都可能有样本丢失,但丢失的样本之后不会再回来,选择标示变量sit表示每一个时期样本的状态,当sit=1时表示样本是可观测的,sit=0表示该样本在t期丢失,sit受上一期指示变量wit的影响。考虑到重点国有林区职工家庭迁移受外出就业影响会较大,虽然外出就业本身并不会导致重点国有林区职工家庭迁移,但因东北、内蒙古重点国有林区多数地处边远山区,远离城市,如果家庭成员中有人外出就业,可获得更多的就业机会和就业信息,并且因对外地的了解熟悉程度而减少迁移成本。因此,选择上一期的“外地就业比例”作为控制变量。第1步,利用Probit模型对每一期选择方程进行估计,得出拟合概率 $\hat{\lambda }$ it;第2步,对回访到的子样本进行 $1/\hat{\lambda }$ it加权,再利用最小二乘法或极大似然估计法估计式(1),得到各项系数的一致估计,样本损耗偏误检验结果见表 7。
表 7 样本损耗偏误检验结果
Table 7. Test result of sample attrition bias
选择标示变量 改革 其他特征 常数项 样本量 R2 945.600*** (4.00) 控制 控制 589.318 (1.34) 2 908 0.138 说明 : 括号内为统计量 t 值 , *** 表示在 1%水平上显著 。 -
计量回归结果见表 8所示。其中,第1列是第1阶段的Probit估计结果,家庭成员外出就业人数越多,回访到样本的机率越小。第2列至第4列是第2阶段极大似然估计结果,第2列的因变量是取对数的职工家庭人均收入,第3列的因变量是职工家庭人均非国有部门收入占家庭人均收入的比例,第4列的因变量是职工家庭人均非林业收入占家庭人均收入的比例。总体来看,估计结果与前文的理论分析基本一致。
表 8 极大似然估计法回归结果
Table 8. Regression result of maximum likelihood estimation
项目 第 1 阶段 Probit 估计结果 第2 阶段Mle 估计结果 家庭人均收入 家庭人均收入 人均非国有部门收入占家庭人均收入 人均非林业收入占家庭人均收入 市场手段林业生产 -0.021***(-2.97) 0.014***(7.76) 0.136**(-2.10) 0.060(-0.80) 森林资源承包管护 -0.009***(-4.80) 0.002***(3.25) 0.037*(1.70) -0.026(-1.06) 加工企业转制 0.002(0.65) 0.004***(9.96) 0.080***(5.93) 0.066(1.63) 一次性安置职工 0.036***(2.96) 0.007***(6.65) 0.019(0.53) 0.091**(2.24) 劳动力占比 -0.001(-0.40) -0.000(-0.23) 0.067***(4.75) -0.006(-0.38) 年龄 -0.007(-1.61) 0.000(0.44) -0.013(-0.47) 0.229***(7.55) 教育程度 -0.012(0.69) 0.029***(6.93) 0.686***(4.59) -0.551***(-3.24) 工龄 -0.008(-1.02) 0.021***(12.79) 0.364***(-6.11) 0.088(1.31) 党员或林业部门干部 0.115(1.40) 0.152***(6.13) 3.445***(-3.92) -1.581(-1.58) 农地 0.264***(2.59) 0.211***(7.29) -3.473***(-3.38) -2.720**(-2.31) 林地 0.296*(1.88) 0.301***(7.01) -4.062***(-2.65) -8.853***(-5.03) 外出就业人数 -0.237*(-1.87) - - - 常数项 0.440***(3.98) 7.126***(190.87) 9.979***(7.52) 67.060***(44.80) δu - 0.393***(24.42) 13.831***(24.63) 16.683***(26.37) δe - 0.630***(69.00) 22.498***(69.71) 25.058***(69.20) 样本量 1 454 4362 4362 4 362 伪 R2(pseudo R2) 0.029 0.172 0.006 0.007 说明 : 括号内为统计量 t 值 , ***, **, * 分别表示在 1%, 5%, 10%水平上显著 。 市场化手段组织林业生产显著增加了职工家庭人均收入。在其他条件不变的前提下,增幅可达1.4%;对于职工家庭收入结构产生显著影响,非国有部门收入占家庭人均收入的比例显著减少,下降了13.6%。
森林资源职工承包管护责任制对职工家庭人均收入和收入结构均有显著影响,显著地促进了职工家庭人均收入的增加。在其他条件不变的前提下,实施森林资源承包管护责任制可以使家庭人均收入增加0.2%;非国有部门收入占家庭人均收入的比例增加了3.7个百分点。 国有林区加工企业转制后提高了效率,在其他条件不变的前提下,促使职工家庭人均收入增幅达0.4%;对职工家庭收入结构有显著影响,非国有部门收入占家庭人均收入的比例有所增加。
一次性安置富余职工增加了职工家庭人均收入,对职工家庭收入结构也有显著影响。在其他条件不变的前提下,一次性安置职工使非林业收入占家庭人均收入的比例上升了9.1个百分点。
劳动力占家庭人口比例只在回归3中显著,说明劳动力比例越高,非国有部门收入占职工家庭人均收入的比例越高,说明由于家庭劳动力的增加,主要依靠劳动力在行业和区域之间的流动来消化,存在着活跃的劳动力市场。人力资本方面,国有企业职工平均工龄对职工家庭人均收入有显著影响,表明工龄越高,家庭人均收入越高。家庭承包农地使家庭平均收入增加21.0%,家庭承包林地使收入提高30.0%。
-
为了验证上文的分析,利用最小二乘法进行了稳健性检验,第1阶段Probit估计结果不变,第2阶段的回归结果见表 9,与表 8结果较为相似。
表 9 最小二乘法回归结果
Table 9. Regression result of OLS
项目 家庭人均收入 人均非国有部门收入占家庭人均收入 人均非林业收入占家庭人均收入 市场手段林业生产 0.012***(7.82) -0.213***(-3.82) -0.143(-1.65) 森林资源承包管护 0.002***(2.77) 0.047(1.01) -0.002(-0.07) 加工企业转制 0.003***(7.27) 0.059***(4.31) 0.045(1.21) 一次性安置职工 0.008***(7.75) 0.020(0.52) 0.098**(2.18) 劳动力占比 -0.001(-0.55) 0.088***(6.21) -0.027*(-1.68) 年龄-0.001(-1.14) 0.013(0.52) 0.303***(10.20) 教育程度 0.035***(8.61) 0.694***(4.84) -0.457***(-2.80) 工龄 0.024***(14.63) -0.453***(-7.81) 0.059(0.90) 党员或林业部门干部 0.178***(7.92) -3.776***(-4.70) -1.760*(-1.93) 农地 0.248***(9.40) -4.056***(-4.32) -3.705***(-3.47) 林地 0.323***(7.97) -5.308***(-3.67) -12.793***(-7.77) 常数项 7.190***(185.46) 9.700***(7.02) 66.675***(42.39) 样本量 4 362 4 362 4 362 R2 0.346 0.073 0.099 调整 R2 0.344 0.071 0.097 说明 : 括号内为统计量 t 值 , ***, **, * 分别表示在 1%, 5%, 10%水平上显著 。 -
本研究通过实地调查发现,1997-2008年期间,重点国有林区职工家庭人均收入水平显著提高;与此同时,职工家庭收入结构也发生了明显变化,人均非林业收入、非国有部门收入占家庭人均收入的比例上升,职工家庭对国有部门和林业的依赖程度下降。 通过实证分析进一步发现,国有林区内部推行的各类改革创新取得了积极的效果,特别是对职工家庭人均收入变化产生了显著影响。其中,以市场化手段组织林业生产和以家庭为主的森林资源管理方式显著增加了职工家庭人均收入;加工企业转制,改变生产经营思路,采用现代化企业管理制度,减员增效,则促使国有林区职工家庭非国有部门收入显著增加;一次性安置富余职工对职工家庭人均收入和收入结构均有显著影响。
根据以上研究结果,并结合重点国有林区的实际,可以得出如下政策启示:一是重点国有林区推行的各项改革既缓解了林区“资源危机、经济危困”,也为国有林区的进一步改革提供了直接经验。未来就是要在充分借鉴这些基层实践经验的基础上,设计出更加科学的国有林区改革方案。二是国有林区的各项改革也使国有林区职工对国有部门和林业的依赖程度下降,从而使改革的阻力和成本明显降低,深入推动改革的时机已经到来。三是国有林区应继续利用市场化手段扩大林区就业,同时为这些市场化手段的发挥提供更加宽松的条件,从而为林区职工收入改善做出更大的贡献。
Impact of reform on household income in the key state-owned forest areas
-
摘要:
利用重点国有林区3省24个林业局1454户职工家庭微观调查数据,考察重点国有林区开展的各项改革创新对职工家庭人均收入的影响,旨在为国有林区改革方案的制定提供有价值的实证支持。在采用逆概率加权法控制样本损耗偏误的基础上,通过极大似然估计法和最小二乘法估计重点国有林区各项改革对职工家庭人均收入的影响。研究发现:重点国有林区职工家庭人均非林业收入、非国有部门收入占家庭人均收入的比例持续上升,职工家庭对林业和国有部门的依赖程度逐渐下降。重点国有林区实施的市场化改革和森林资源承包管护责任制显著增加了职工家庭人均收入;加工企业转制和一次性安置富余职工则对职工家庭收入结构的变化有显著影响。重点国有林区推行的各项改革为完善改革方案提供了直接经验,同时现有改革也使改革的阻力和成本明显降低,深化改革的时机已经到来。
Abstract:Based on the survey data of 1454 households in 24 forestry bureaus of 3 provinces, this research used both MEL and OLS methods to evaluate the impact of the reform on household's per-capita income in the key state-owned forest areas. The study found that the proportion of both non-forestry income and income from non-state-owned sector in households' income was on the rise, which indicated that the households' dependence on the forestry and state-owned sector was declining. In particular, the market-oriented reform, forest management and protection reform had significantly increased households' per-capita income. The reform of both forest enterprise restructuring and permanent settlements of surplus employees had a significant effect on households' income structure. The findings of this paper implied that the performance of current reform would help improve policy design and thus decrease the implementation costs of the further reform in the future.
-
Key words:
- forest economics /
- key state-owned forest area /
- reform /
- employee's household income
-
图 1 国有收入与非国有收入占总收入比例 变化图
Figure 1 The Proportion of household income from state- owned sector and non-state-owned sector
表 1 抽样样本点分布情况
Table 1. Sample distribution
省区 林业管理局 所辖林业局数 /个 样本林业局 户数 /户 回访户 /户 黑龙江 牡丹江 8 大海林 、 东京城 、 海林 180 141 合江 7 双鸭山 、 鹤北 、 清河 180 167 松花江 8 方正 、 绥棱 、 沾河 180 142 伊春 16 乌马河 、 金山屯 、 朗乡 、 双丰 、 汤旺河、 五营 371 270 吉林 吉林森工 8 临江 、 湾沟 、 松江河 183 146 延边 10 敦化 、 八家子 、 天桥岭 180 109 内蒙古 牙克石 17 尔山 、 库都尔 、 根河 180 109 小计 7 74 24 1 454 1 084  下载: 导出CSV
表 2 家庭人均收入变化及平均增长速度
Table 2. Change in per capita income and average growth rate of per captia income of household
项目 收入 /元 收入平均增长速度 /% 1997 2004 2008 1997-2004 2004-2008 1997-2008 重点国有林区职工家庭人均总收入 2 497.00 4 515.34 8 602.62 8.83 17.49 11.90 全国城镇居民人均可支配收入 5 651.46 10 318.36 15 780.76 8.98 11.21 9.78 全国农村居民人均纯收入 2 367.72 3 193.76 4 760.62 4.37 10.49 6.56 说明 : 重点国有林职工家庭人均总收入根据调查问卷整理 , 全国城镇 、 农村居民收入源自 《中国统计年鉴》 ; 所有收入数据根据全国居民消费者价格指数调整到 2008 年水平 。
下载: 导出CSV
表 3 职工家庭人均收入构成变化(按行业分)
Table 3. Change in per capita income of household (divided by industry)
收入来源 职工家庭人均收入 /(元 ·人 -1) 职工家庭人均收入构成 /% 1997 2004 2008 1997 2004 2008 林业收入 674.68 845.56 1 423.03 27.02 18.73 16.54 其中 :营林收入 82.67 85.64 137.83 3.31 1.90 1.60 采伐收入 107.81 79.41 138.64 4.32 1.76 1.61 管护收入 34.63 82.32 163.43 1.39 1.82 1.90 林业工业及运输收入 314.98 296.35 129.36 12.61 6.56 1.50 林业管理等其他收入 131.11 208.87 764.15 5.25 4.63 8.88 非木质林产品收入 3.48 92.97 89.62 0.14 2.06 1.04 非林业收入 1 822.32 3 669.78 7 179.59 72.98 81.27 83.46 其中 :农业收入 177.21 714.70 769.53 7.10 15.83 8.95 畜牧业收入 19.65 212.55 131.96 0.79 4.71 1.53 工业收入 261.11 247.88 345.21 10.46 5.49 4.01 商业收入 47.40 131.71 538.24 1.90 2.92 6.26 服务业收入 440.14 795.26 1 547.86 17.63 17.61 17.99 其他收入 876.81 1 567.68 3 846.79 35.11 34.72 44.72 总计 2 497.00 4 515.34 8 602.62 100.00 100.00 100.00 说明:根据调查问卷整理 。
下载: 导出CSV
表 4 职工家庭户主工作地点的变化
Table 4. Change in employment location of householder
地点 户主工作地点百分比 /% 1997 2004 2008 林业局 95.0 91.5 77.5 其中 : 在国有部门工作 89.4 79.3 87.8 在非国有部门工作 10.6 20.7 12.2 林业局外 5.0 8.5 22.5 其中 : 在本省 4.1 6.1 14.6 在外省 0.8 2.1 7.8 在国外 0.1 0.3 0.1 说明 : 根据调查问卷整理 。
下载: 导出CSV
表 5 职工家庭人均收入构成变化(按性质分)
Table 5. Change in per capita income of household (divided by nature)
收入构成 人均收入构成 /% 1997 2004 2008 工资性收入 66.1 48.1 43.5 转移性收入 22.3 26.1 37.6 其中退休金 17.3 19.2 25.3 经营性收入 10.0 23.1 15.6 财产性收入 0.9 0.7 1.4 其他收入 0.7 2.0 1.9 说明 : 根据调查问卷整理 。
下载: 导出CSV
表 6 变量定义与描述性统计
Table 6. Statistics for variables
改革变量 变量 变量解释 1997 年 2004 年 2008 年 市场手段林业生产 市场化手段组织营林 、 采伐 、 运输作业 (实施年数 ) 3.23(5.19) 6.51(7.85) 8.85(9.34) 森林资源承包管护 森林资源承包管护责任制 /% 0.28(1.35) 10.20(9.13) 10.25(8.10) 加工企业转制 加工企业转制比例 /% 5.83(11.51) 39.12(33.48) 65.87(32.47) 一次性安置职工 一次性安置富余职工比例 /% 0.00(0.00) 7.15(2.57) 16.38(16.66) 家庭特征 劳动力占比 劳动力占家庭总人口比例 /% 0.66(0.31) 0.64(0.38) 0.66(0.39) 年龄 劳动力平均年龄 /a 31.04(13.54) 29.89(16.98) 30.10(17.71) 人力资本 教育程度 劳动力平均教育年限 /a 6.95(2.61) 7.77(2.88) 8.19(2.89) 工龄 国有职工平均工龄 /a 9.85(6.25) 12.78(7.56) 14.28(8.35) 社会资本 党员或林业 家庭成员中有无党员或林场 、林业 0.32(0.46) 0.36(0.48) 0.35(0.47) 部门干部 局干部 (1 为有 , 0 为无 ) 资源禀赋 农地 家庭是否承包农地 (1 为有 , 0 为无 ) 0.17(0.37) 0.17(0.38) 0.18(0.39) 林地 家庭是否承包林地 (1 为有 , 0 为无 ) 0.06(0.25) 0.07(0.25) 0.07(0.26) 样本量 1 454 1 454 1 084 说明 : 括号内为标准差 。
下载: 导出CSV
表 7 样本损耗偏误检验结果
Table 7. Test result of sample attrition bias
选择标示变量 改革 其他特征 常数项 样本量 R2 945.600*** (4.00) 控制 控制 589.318 (1.34) 2 908 0.138 说明 : 括号内为统计量 t 值 , *** 表示在 1%水平上显著 。
下载: 导出CSV
表 8 极大似然估计法回归结果
Table 8. Regression result of maximum likelihood estimation
项目 第 1 阶段 Probit 估计结果 第2 阶段Mle 估计结果 家庭人均收入 家庭人均收入 人均非国有部门收入占家庭人均收入 人均非林业收入占家庭人均收入 市场手段林业生产 -0.021***(-2.97) 0.014***(7.76) 0.136**(-2.10) 0.060(-0.80) 森林资源承包管护 -0.009***(-4.80) 0.002***(3.25) 0.037*(1.70) -0.026(-1.06) 加工企业转制 0.002(0.65) 0.004***(9.96) 0.080***(5.93) 0.066(1.63) 一次性安置职工 0.036***(2.96) 0.007***(6.65) 0.019(0.53) 0.091**(2.24) 劳动力占比 -0.001(-0.40) -0.000(-0.23) 0.067***(4.75) -0.006(-0.38) 年龄 -0.007(-1.61) 0.000(0.44) -0.013(-0.47) 0.229***(7.55) 教育程度 -0.012(0.69) 0.029***(6.93) 0.686***(4.59) -0.551***(-3.24) 工龄 -0.008(-1.02) 0.021***(12.79) 0.364***(-6.11) 0.088(1.31) 党员或林业部门干部 0.115(1.40) 0.152***(6.13) 3.445***(-3.92) -1.581(-1.58) 农地 0.264***(2.59) 0.211***(7.29) -3.473***(-3.38) -2.720**(-2.31) 林地 0.296*(1.88) 0.301***(7.01) -4.062***(-2.65) -8.853***(-5.03) 外出就业人数 -0.237*(-1.87) - - - 常数项 0.440***(3.98) 7.126***(190.87) 9.979***(7.52) 67.060***(44.80) δu - 0.393***(24.42) 13.831***(24.63) 16.683***(26.37) δe - 0.630***(69.00) 22.498***(69.71) 25.058***(69.20) 样本量 1 454 4362 4362 4 362 伪 R2(pseudo R2) 0.029 0.172 0.006 0.007 说明 : 括号内为统计量 t 值 , ***, **, * 分别表示在 1%, 5%, 10%水平上显著 。
下载: 导出CSV
表 9 最小二乘法回归结果
Table 9. Regression result of OLS
项目 家庭人均收入 人均非国有部门收入占家庭人均收入 人均非林业收入占家庭人均收入 市场手段林业生产 0.012***(7.82) -0.213***(-3.82) -0.143(-1.65) 森林资源承包管护 0.002***(2.77) 0.047(1.01) -0.002(-0.07) 加工企业转制 0.003***(7.27) 0.059***(4.31) 0.045(1.21) 一次性安置职工 0.008***(7.75) 0.020(0.52) 0.098**(2.18) 劳动力占比 -0.001(-0.55) 0.088***(6.21) -0.027*(-1.68) 年龄-0.001(-1.14) 0.013(0.52) 0.303***(10.20) 教育程度 0.035***(8.61) 0.694***(4.84) -0.457***(-2.80) 工龄 0.024***(14.63) -0.453***(-7.81) 0.059(0.90) 党员或林业部门干部 0.178***(7.92) -3.776***(-4.70) -1.760*(-1.93) 农地 0.248***(9.40) -4.056***(-4.32) -3.705***(-3.47) 林地 0.323***(7.97) -5.308***(-3.67) -12.793***(-7.77) 常数项 7.190***(185.46) 9.700***(7.02) 66.675***(42.39) 样本量 4 362 4 362 4 362 R2 0.346 0.073 0.099 调整 R2 0.344 0.071 0.097 说明 : 括号内为统计量 t 值 , ***, **, * 分别表示在 1%, 5%, 10%水平上显著 。
下载: 导出CSV
-
[1] 姜雪梅,徐晋涛. 东北内蒙古重点国有林区职工收入变化分析[J]. 林业经济,2011(1):25-29. JIANG Xuemei,XU Jintao. Analysis on the income change of workers in the key state-owned forest region of Northeast and Inner Mongolia[J]. For Econ, 2011(1):25-29. [2] 徐晋涛,姜雪梅,季永杰. 重点国有林区改革与发展趋势的实证分析[J]. 林业经济,2006(1):10-15. XU Jintao,JIANG Xuemei,JI Yongjie. Empirical study of reform and development in the key state-owned forest area[J]. For Econ, 2006(1):10-15. [3] BENNETT M T, JIANG Xuemei, XU Jintao. Household income growth, diversification and the implicit costs of reform:the case of China’s state forest sector[R/OL].(2008-01-31)[2015-08-20].
BENNETT M T, JIANG Xuemei, XU Jintao. Household income growth, diversification and the implicit costs of reform:the case of China’s state forest sector[R/OL].(2008-01-31)[2015-08-20].
[4] 张海鹏. 重点国有林区职工家庭收入差距及其变化实证分析[J]. 林业经济,2013(6):90-94. ZHANG Haipeng. The empirically analyses of the gaps and their variance to the staff households' incomes in the state-owned forest districts[J]. For Econ, 2013(6):90-94. [5] 王前进,穆志明. 深化国有森工企业改革的序曲:黑龙江省实行森林资源管护经营责任制试点情况的调查报告[J]. 林业经济,1999(5):7-15. WANG Qianjin,MU Zhiming. The preliminary stage of state forestry enterprises reform:the report of household responsibility system in forestry management and protection in Heilongjiang Province[J]. For Econ, 1999(5):7-15. [6] JIANG Xuemei, GONG Peichen, BOSTEDT G, et al. Impacts of policy measures on the development of state-owned forests in northeast China:theoretical results and empirical evidence[J]. Environ Dev Econ, 2014, 19(1):74-91. [7] 刘青,董桓维,张瑾瑾,等. 基于林区职工家庭视角的黑龙江省森林管护制度研究[J]. 林业资源管理,2013(4):23-26,32. LIU Qing,DONG Hengwei,ZHANG Jinjin,et al. Study on forest management and protection system of Heilongjiang Province based on the perspective of forest farmer households[J]. For Resour Manage, 2013(4):23-26,32. [8] MINCER J. Investment in human capital and personal income distribution[J]. J Pol Econ, 1958, 66(4):281-302. [9] 高梦滔,姚洋. 健康风险冲击对农户收入的影响[J]. 经济研究,2005(12):15-25. GAO Mengtao,YAO Yang. Health shocks and farmers' income capabilities[J]. Econ Res J, 2005(12):15-25. [10] BARRO R J, LEE J W. International measure of schooling years and schooling quality[J]. Am Econ Rev, 1996, 86(2):218-223. [11] 严善平. 人力资本、制度与工资差别:对大城市二元劳动力市场的实证分析[J]. 管理世界, 2007(6):4-13. YAN Shanping. Human capital, systems and differences in wages:a case study on the dual labor-markets in large cities[J]. Manage World, 2007(6):4-13. [12] 朱洪革, 李海玲, 石小亮. 山上山下职工家庭收入特征及影响因素分析:基于黑龙江省重点国有林区的调查数据[J]. 林业经济, 2014(5):20-25. ZHU Hongge, LI Hailing, SHI Xiaoliang. Income characteristic and determinants of worker households living on mountain and living under mountain in key national forest areas[J]. For Econ, 2014(5):20-25. [13] HECKMAN J J. Sample selection bias as a specification error[J]. Appl Econ, 2013, 31(1):129-137. [14] HAUSMAN J A, WISE D A. Attrition bias in experimental and panel data:the gary income maintenance experiment[J]. Econometrica, 1979, 47(2):455-473. [15] WOOLDRIDGE J M. Selection corrections for panel data models under conditional mean independence assumptions[J]. J Econ, 1995, 68(1):115-132. [16] MOFFIT R, FITZGERALD J, GOTTSCHALK P. Sample attrition in panel data:The role of selection on observables[J]. Annales dEconomie et de Statistique, 1999, 55(55/56):129-152. -

-
链接本文:
https://zlxb.zafu.edu.cn/article/doi/10.11833/j.issn.2095-0756.2016.04.018
 点击查看大图
计量
- 文章访问数: 3701
- HTML全文浏览量: 848
- PDF下载量: 281
- 被引次数: 0
