-
北京西郊林场总面积为60.59 km2,包含多个风景名胜点和森林公园,周边环绕着多处党政军民单位,特殊的地理位置决定了护林防火是林场森林资源管护工作的重中之重。每年防火期林场需要投入大量人财物力,布设巡航路线、火源检查卡点、火灾监测点以预防和监控林火发生。过去管理者主要通过经验安排防火监测点,大部分监测是由人工巡视、瞭望完成,监测效率低。随着经济发展和智慧林业的兴起,林场拟建立全天候的林火监测体系,以提高林区监测的效率。基于瞭望塔的林火监测网是智慧林业“地网”感知层的重要基础设施[1],对生态保护、防火救灾、森林公园的区域安全都具有重要意义[2-5]。建立林区瞭望塔监测体系已成为当前研究热点[6-7]。受地理空间环境与投资总成本约束,林区瞭望塔应合理布局、统一规划,从而实现监测覆盖面积最大化。为满足林区瞭望塔建设空间可视性的最大化[8],需借助地理信息系统(GIS)构建选址模型,设计相应的算法,优化瞭望塔的布局。受林区瞭望塔建设耗时且具有明显阶段性和动态性的制约,应进一步研究近似最优布局中各瞭望塔建设时序,以优化监测网的阶段效益。除监测(可视)面积外,交通、坡度、已有建筑等也影响瞭望塔建设时序的合理性。即时序优化问题是典型的多属性排序问题,常用层次分析法、模糊综合评判法求解[9-13]。本研究收集林场的1∶10 000等高线地形图、防火公路图、含风景点的建筑设施图等数据,以顶点法提取瞭望塔备选点集,根据备选点集建立最大监测面积模型(maximum monitoring area model,Max-MAM),利用启发算法中复杂度较低且便于与GIS结合的Greedy算法,快速求解近似最优布局方案,以优化监测网整体监测效率;利用熵权法建立动态多属性建设时序模型(dynamic multi-attribute construction time sequencing model,DMACTSM),对瞭望塔建设时序进行动态优化布局,以提高瞭望塔建设效益。
-
最大监测面积模型(Max-MAM)可表述为从备选点集P中选择n个点,使得n个点构成监测网络的监测(可视)面积最大。设选择n个点建成的监测网为
$ {\overline{P}}_{n} $ ={p1,p2,$\cdots $ ,pn}。其中,pn为第n个备选点选建的瞭望塔;Sn(p1,p2,$\cdots $ ,pn)为$ {\overline{P}}_{n} $ 的监测面积。则最大监测面积模型为:$$ S_{n}^*(p_1^*,p_2^*, \cdots ,p_{n}^*) = {\rm{Max}}\;{S_{\!\!n}}({p_1},{p_2}, \cdots ,{p_n})\text{。} $$ (1) 由式(1)可得
$ {\overline{{P}}}_{{n}}^* $ ={$ {p}_{1}^{*} $ ,$ {p}_{2}^{*} $ ,$\cdots $ ,$ {p}_{n}^{*} $ }即为最优布局,此时n值为根据约束(如投资)或监测网预设目标确定的待建瞭望塔数;$ {p}_{i}^{*} $ 为第i次选建时的最优瞭望塔;$ {{S}}_{{n}}^* $ 为$ {\overline{P}}_{n} $ 的最大监测面积。Greedy算法结合GIS视域分析工具可实现Max-MAM的快速近似求解。记Pi={
$ {p}^{i}_{j} $ ,j=1,$\cdots $ ,i,$ {p}^{i}_{j} $ ∈P}为第i次迭代时备选点集;$ {\overline{P}}_{i} $ ={$ {{p}^{i}_{j}}^{*} $ ,j=1,…,N−i,$ {{p}^{i}_{j}}^{*} $ ∈P}为第i次迭代时已选瞭望塔集,满足式(2)关系,其中0≤i≤n≤N。$$ {P_0} = P,\;{\overline P _0} = {\text{Ø}} ,\;{P_i} \cup {\overline P _i}{\rm{ = }}P{\text{且}}{P_i} \cap {\overline P _i} = {\text{Ø}} \text{。} $$ (2) 根据上述定义,Greedy算法第i次迭代选择的最优备选点
$ {{p}_{i}^{i}}^{*} $ 可表示为:$$ S_i^*({{p_1^i}^*},{{p_2^i}^*}, \cdots ,{{p_{i - 1}^i}^*},{{p_i^i}^*}) = {\rm{Max}}\;{S_i}({{p_1^{i - 1}}^*},{{p_2^{i - 1}}^*}, \cdots ,{{p_{i - 1}^{i - 1}}^*},p_i^i),\;{\text{其中}}p_i^i \in {\rm{P}}\text{。} $$ (3) 式(3)中,
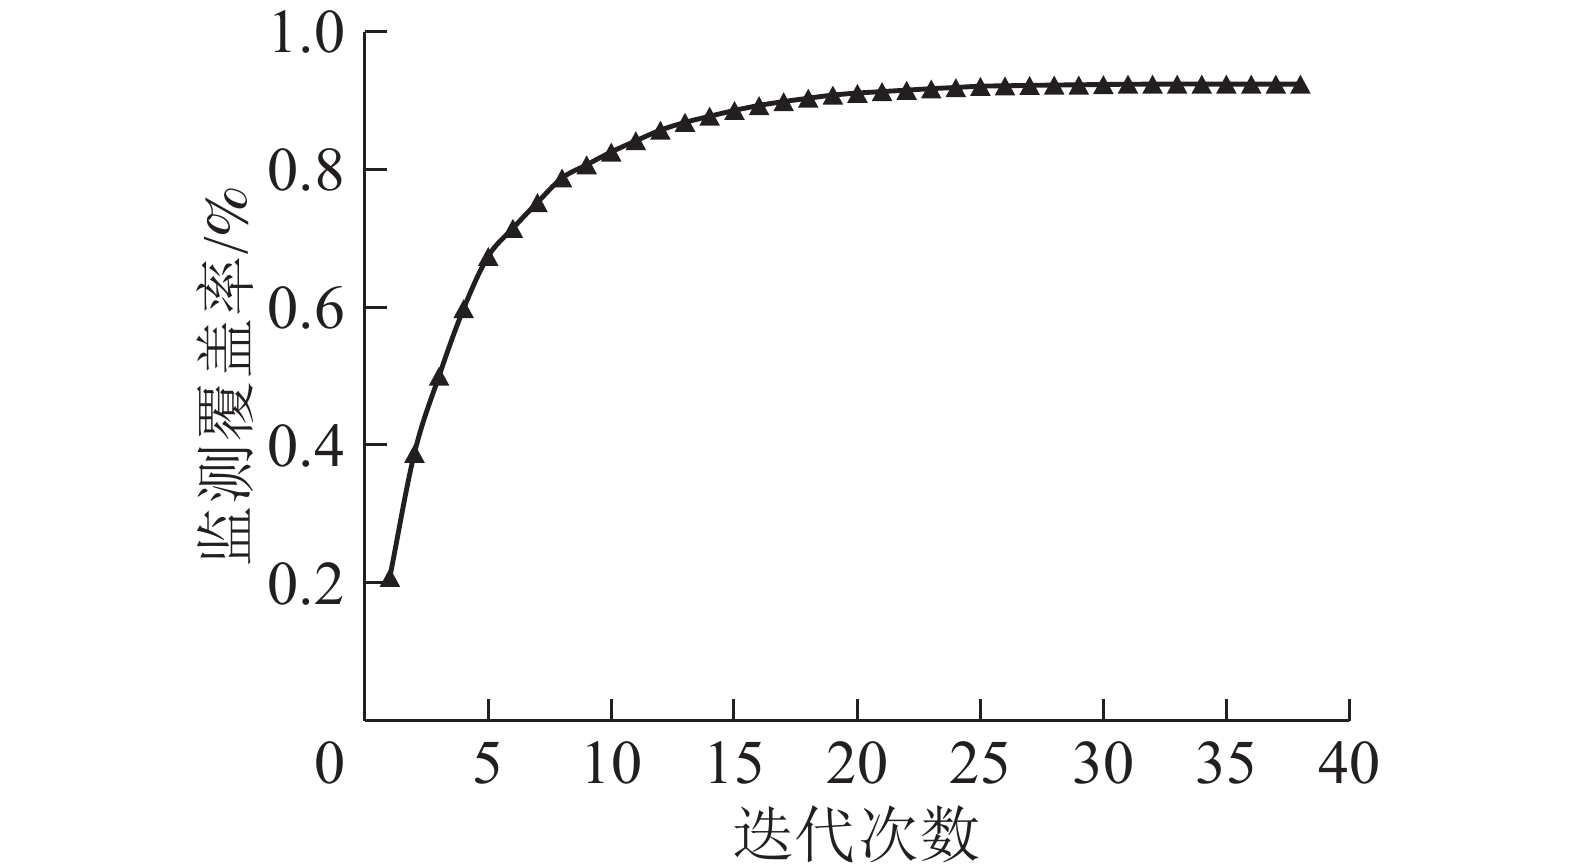
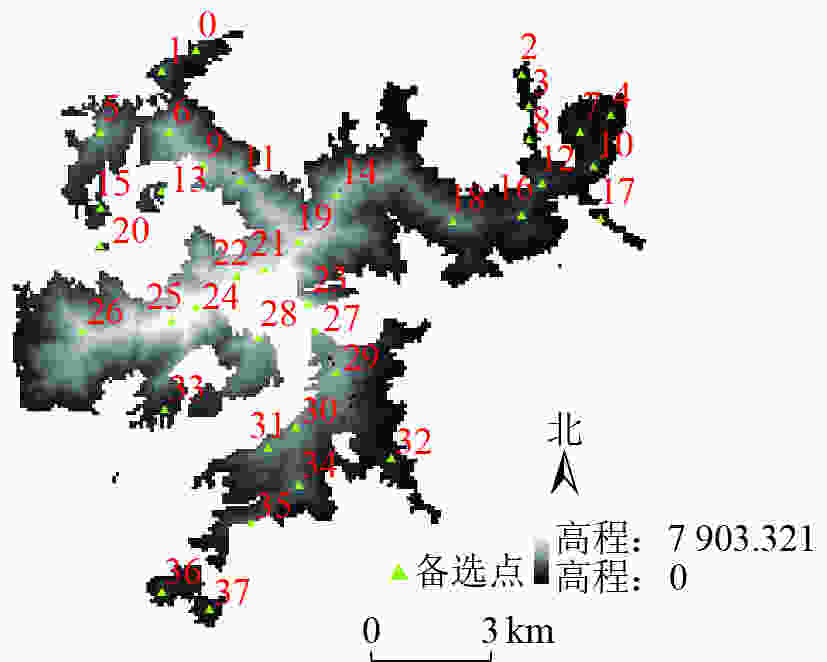
$ {S}_{i} $ (p1,p2,…,pi)是监测网$ {\overline{P}}_{i} $ 的监测面积(可视域面积),由GIS视域分析工具统计$ {\overline{P}}_{i} $ 可视域栅格数$ \left|{V}_{\rm{i}}\right| $ 得到。结合ArcPy中的visibility_3d函数运行上述Greedy算法迭代计算可得最大监测面积$ {S}_{i}^{*} $ ($ {{p}_{1}^{i}}^{*} $ ,$ {{p}_{2}^{i}}^{*} $ ,…,$ {{p}_{i}^{i}}^{*} $ )。Greedy算法应用于W林场38个瞭望塔备选点,监测覆盖率随迭代次数变化如图2所示。表1列出了Greedy算法前6次迭代得到的瞭望塔优化布局方案,当i=5时,优化布局方案
$ {\overline{{P}}}_{{6}} $ ={$ {{p}}_1^* $ ,…,$ {{p}}_{{6}}^* $ } ={a6,a29,a36,a12,a26,a18},结合图1可知,$ {\overline{{P}}}_{{6}} $ 的监测覆盖率达71.47%,近似实现了设计最少的瞭望塔数目及空间布局、以获得最大监测覆盖面积的整体优化目标。表 1 布局方案与可视栅格总数变化
Table 1. Layout scheme and the change of the total number of visible grids
i $ {\overline{{P}}}_{{i}} $ ${\left|{{V}}_{{i}}\right| }$ 0 6 1 972 1 6,29 3 677 2 6,29,36 4 737 3 6,29,36,12 5 664 4 6,29,36,12,26 6 384 5 6,29,36,12,26,18 6 767 -
为进一步提升瞭望塔网络建设过程的阶段性效益,建立DMACTSM模型,通过动态计算布局方案中各瞭望塔的综合属性值,对
$ {\overline{P}}_{n} $ 中各瞭望塔的建设时序进行优化分析。设$ {u}_{i}^{k} $ 为第k次迭代计算瞭望塔$ {p}_{i}^{k} $ 的综合属性值,则第k次迭代得到优先建设的瞭望塔$ {{p}_{i}^{k}}^{*} $ 满足如下最大化问题:$$ {{u}_{i}^{k}}^* = \max \{{u}_{i}^{k}\}\text{。} $$ (4) 式(4)中:
$ {{p}_{i}^{k}}^* $ ,$ {p}_{i}^{k} $ ∈$ {\overline{P}}_{n} $ (k=0,1,$\cdots $ ,n−2),则监测网$ {\overline{P}}_{n} $ 的最优建设时序为$ {{p}_{i}^{0}}^{*} $ 、$ {{p}_{i}^{1}}^{*} $ 、$\cdots $ 、$ {{p}_{i}^{n-1}}^{*} $ 。MACTSM对建设时序的优化包括3步。 -
新建塔要求交通便利,地势平坦,尽量依附已有建筑建设[7]。表2给出了MACTSM的4个属性,增长监测面积、交通情况、坡度与依附建筑情况。记pi的增长监测面积为yi1,指加入
$ {p}_{i} $ 后$ {\overline{P}}_{i-1} $ 增加的监测面积,即pi对监测网$ {\overline{P}}_{i} $ 的单独监测面积[8]。 yi1是正向属性,反映新增瞭望塔对监测网总监测面积的贡献,随监测网变化而变化,满足$ {y}_{i1}{=}\left(\left|{{\rm{V}}}_{{i}}\right|{=}\left|{{\rm{V}}}_{{i}{-}{1}}\right|\right){×}{s} $ ,其中,$ \left|{V}_{i}\right| $ 是监测网$ {\overline{P}}_{i} $ 可视域栅格数,s是单位栅格面积。设交通情况指瞭望塔所处位置距离道路的远近,即瞭望塔到最近道路的垂线长度(m),对林区防火公路图进行近邻分析求得。坡度指林区地面的陡峭程度(°),对DEM进行坡度分析求得。依附建筑情况指瞭望塔与已有建筑的贴近程度,即瞭望塔距最近已有建筑的直线距离(m),对林区含风景点的建筑设施图进行近邻分析求得。该决策矩阵可记为Y=(yij)n×4,其中,j为属性编号,yi=(yi1,$\cdots $ ,yi4)为瞭望塔$ {p}_{i}^{*} $ 的属性向量,i=1,2,$\cdots $ ,n。表 2 属性集
Table 2. Attribute set
属性 属性名称 属性类型 yi1 增长监测面积 正向、收益、动态 yi2 交通情况 反向、成本、静态 yi3 坡度 反向、成本、静态 yi4 依附建筑情况 反向、成本、静态 根据式(5)对正向属性yi1消除量纲,对反向属性yi2、yi3、yi4进行极差标准化,再进行归一化,得到决策矩阵Z=(Zij)n×4。
$$ \left\{ {\begin{aligned} & {y_j^* = {{\max }_{1 \leqslant i \leqslant n}}{y^{}_{ij}}},\\ & {y_j^0 = {{\min }_{1 \leqslant i \leqslant n}}{y^{}_{ij}}},\\ & {{x^{}_{ij}} = \frac{{{y^{}_{ij}} - y_j^0}}{{y_j^* - y_j^0}}}; \end{aligned}} \right.\;\;\left\{ {\begin{aligned} & {y_j^0 = {{\max }_{1 \leqslant i \leqslant n}}{y^{}_{ij}}},\\& {y_j^* = {{\min }_{1 \leqslant i \leqslant n}}{y^{}_{ij}}},\\& {{x^{}_{ij}} = \frac{{y_j^0 - {y^{}_{ij}}}}{{y_j^0 - y_j^*}}}; \end{aligned}} \right. \;\; {{Z}}^{}_{{ij}}{=}\frac{{{x}}^{}_{{ij}}}{\sum\limits _{{i}{=1}}^{n}{{x}}_{{ij}}}\text{。}$$ (5) -
对归一化矩阵Z采用熵权法确定权重。熵权法不依赖于专家经验,可通过数据间差异客观确定属性权重[16]。根据式(6)分3步进行确权:先计算各属性熵值ej;然后计算各属性差异系数gj;最后计算各属性权重ωj。
$$ {{e}}^{}_{{j}}{=}{-}{k}\sum _{{i}{=}{1}}^{{n}}{{Z}}_{{ij}}{\ln}{{Z}}_{{ij}}{,}\;{\text{其中}},\;k=\frac{1}{{\ln}\;n}{\text{。}}{{g}}^{}_{{j}}{=}{1}{-}{{e}}^{}_{{j}} {\text{。}}\omega_{{j}}{=}\frac{{{g}}^{}_{{j}}}{\displaystyle\sum\limits _{{j}{=}{1}}^{{4}}{{g}}^{}_{{j}}}\text{。} $$ (6) 若各属性已有主观权重时,则可采用式(7)修正。建设前期注重增长监测面积可以将yi1权值提高,当yi1权值为1,表示不关心其他属性,排序结果与Greedy算法一致。
$$ \omega_{{j}}^{{0}}{=}\frac{\lambda_{{j}}\omega_{{j}}}{\displaystyle\sum\limits _{{j}{=}{1}}^{{4}}\lambda_{{j}}\omega_{{j}}}\text{。} $$ (7) -
根据式(8)对各属性线性加权,得瞭望塔pi综合属性值。
$$ {{u}}_{{i}}{=}\sum _{{j}{=}{1}}^{{4}}\omega_{{j}}{{x}}_{{ij}}\text{。} $$ (8) 以林场优化布局方案
$ {\overline{P}}_{6} $ =$ \{{p}_{1}^*,\dots ,{p}_{6}^*\} $ ={a6,a29,a36,a12,a26,a18}为例。当k=0时,对林区DEM数据、防火公路图、建筑设施(含风景点)图等数据进行领域分析计算,6个瞭望塔4个属性的初始决策矩阵Z0。$$ {{{Z}}^0} = \left[\!\!\! {\begin{array}{*{20}{l}} {0.43}&{0.28}&{0}&{0}\\ {0.27}&{0.22}&{0.32}&{0.22}\\ {0.05}&{0.28}&{0.02}&{0.22}\\ {0.22}&{0.19}&{0.11}&{0.10}\\ {0.03}&{0}&{0.25}&{0.25}\\ {0}&{0.03}&{0.29}&{0.20} \end{array}} \!\!\!\right]\text{。} $$ 计算可知:6个瞭望塔的综合属性值向量u0=(0.67,0.76,0.35,0.50,0.30,0.29)。
$ {{u}}_2^{{0}} $ =max{$ {{u}}_{{i}}^{{0}} $ }=0.76,$ {{p}}_2^* $ (即$ {{a}}_{{29}} $ 瞭望塔)率先被加入建设序列。同理,当k=1时,对余下5个瞭望塔重新计算增长监测面积属性值,得到归一化决策矩阵Z1,计算可知:第2个被加入建设序列的瞭望塔为
$ {{a}}_{{26}} $ ;依此类推,DMACTSM迭代5次,得到各阶段被优先建立的瞭望塔及最终建设时序优化结果,如表3所示。表 3 基于DMACTSM迭代计算的综合属性值、选优和最终排序
Table 3. DMACTSM iterative computation
迭代次数 综合属性值 max(ui) 优建瞭望塔 a29 a26 a12 a6 a36 a18 0 0.76 0.30 0.50 0.68 0.35 0.29 0.76 $ {{a}}_{{29}} $ 1 0.56 0.45 0.55 0.47 0.44 0.56 $ {{a}}_{{26}} $ 2 0.54 0.51 0.36 0.50 0.54 $ {{a}}_{{12}} $ 3 0.54 0.33 0.48 0.54 $ {{a}}_{{6}} $ 4 0.53 0.47 0.53 $ {{a}}_{{36}} $ 林场瞭望塔网络优化布局及建设时序效果,如图3所示。对比图4、图5可得:监测覆盖面积增长最快的建设时序为a6、a29、a36、a12、a26、a18,DMACTSM调整后建设时序为a29、a26、a12、a6、a36、a18,不仅保证瞭望塔网络总体效益最优,也实现了各阶段建设效益的优化,说明DMACTSM对瞭望塔建设过程优化有实际意义。
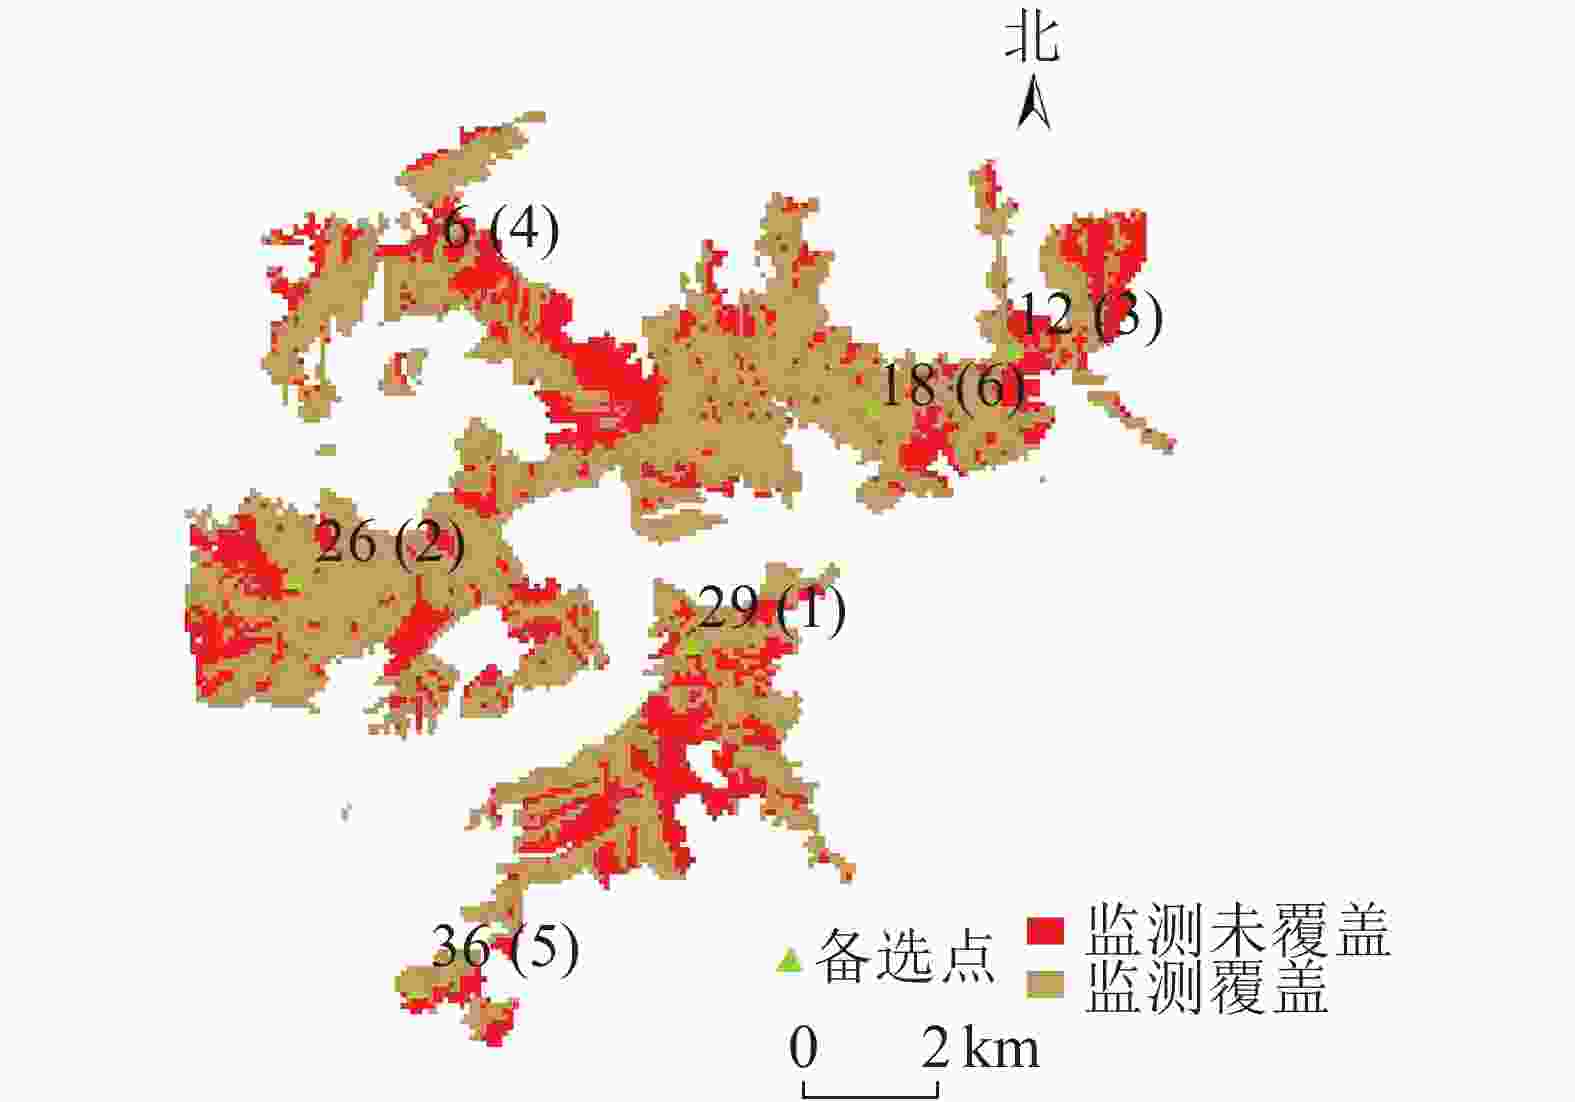
图 3 W林场瞭望塔网络优化设计(最优布局及建设时序)
Figure 3. Optimal design of watchtower network in W (optimal layout and construction sequence)
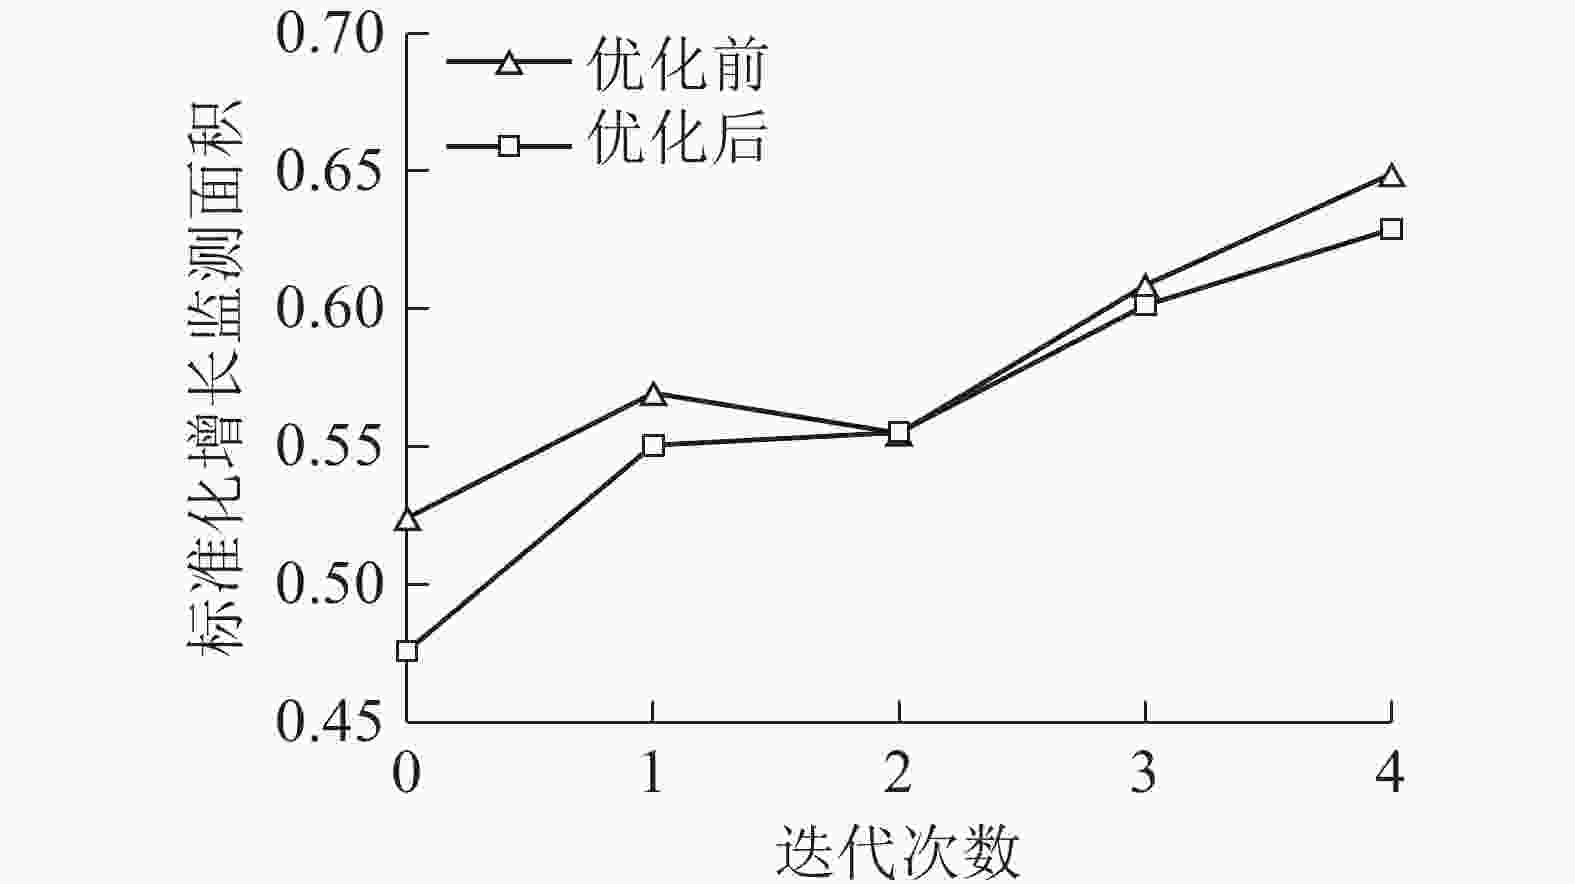
图 4 优化前后标准化增长监测面积对比
Figure 4. Comparison of standardized growth monitoring area before and after optimization
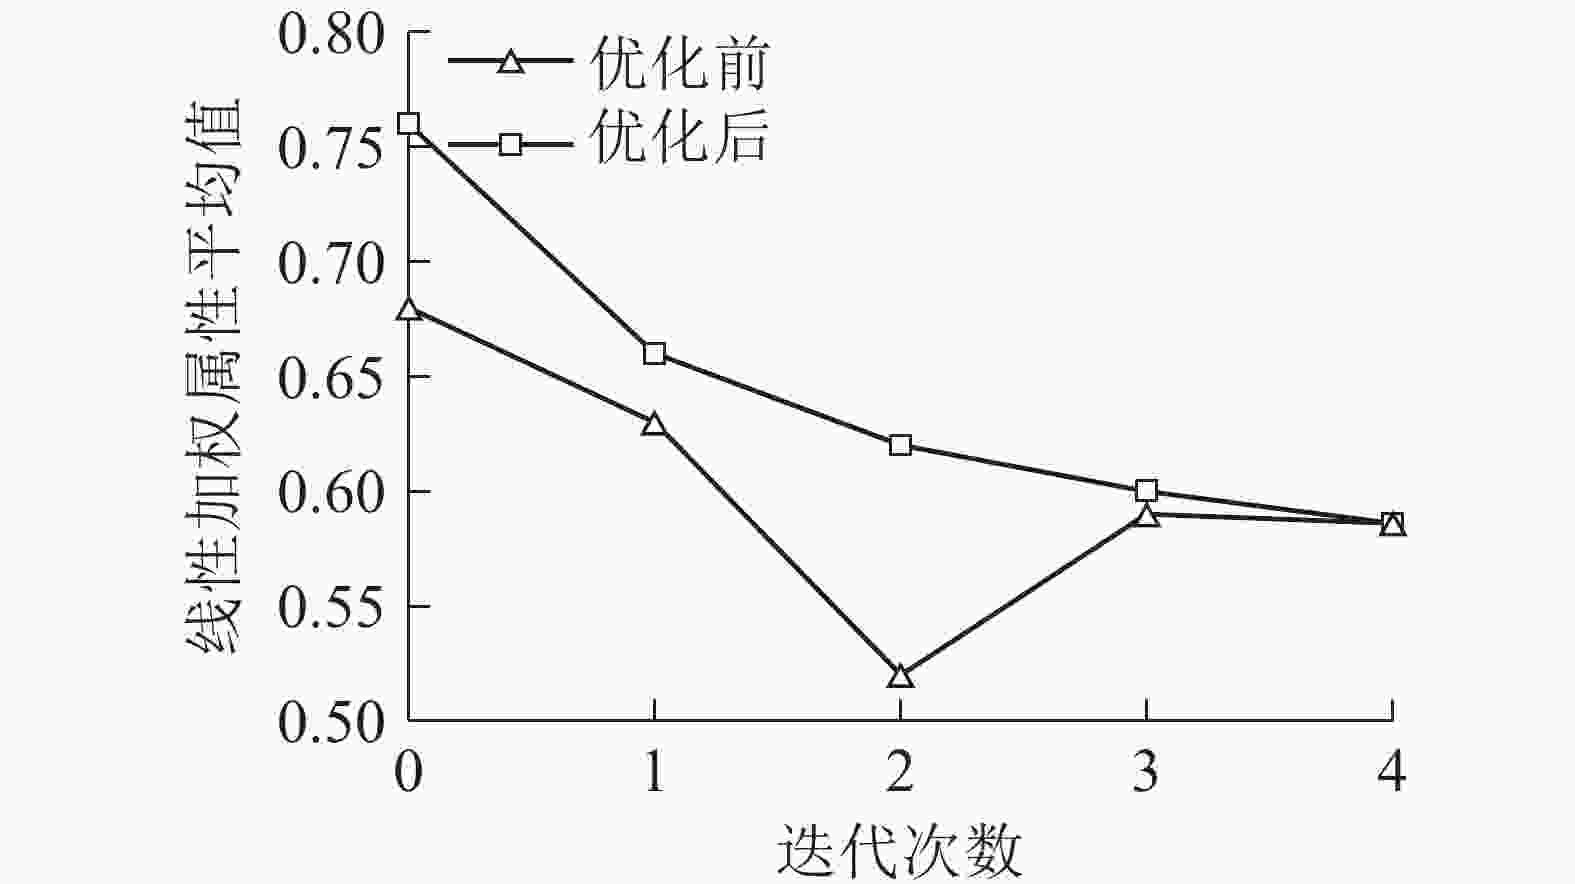
图 5 优化前后综合属性值对比
Figure 5. Comparison of comprehensive attribute values before and after optimization
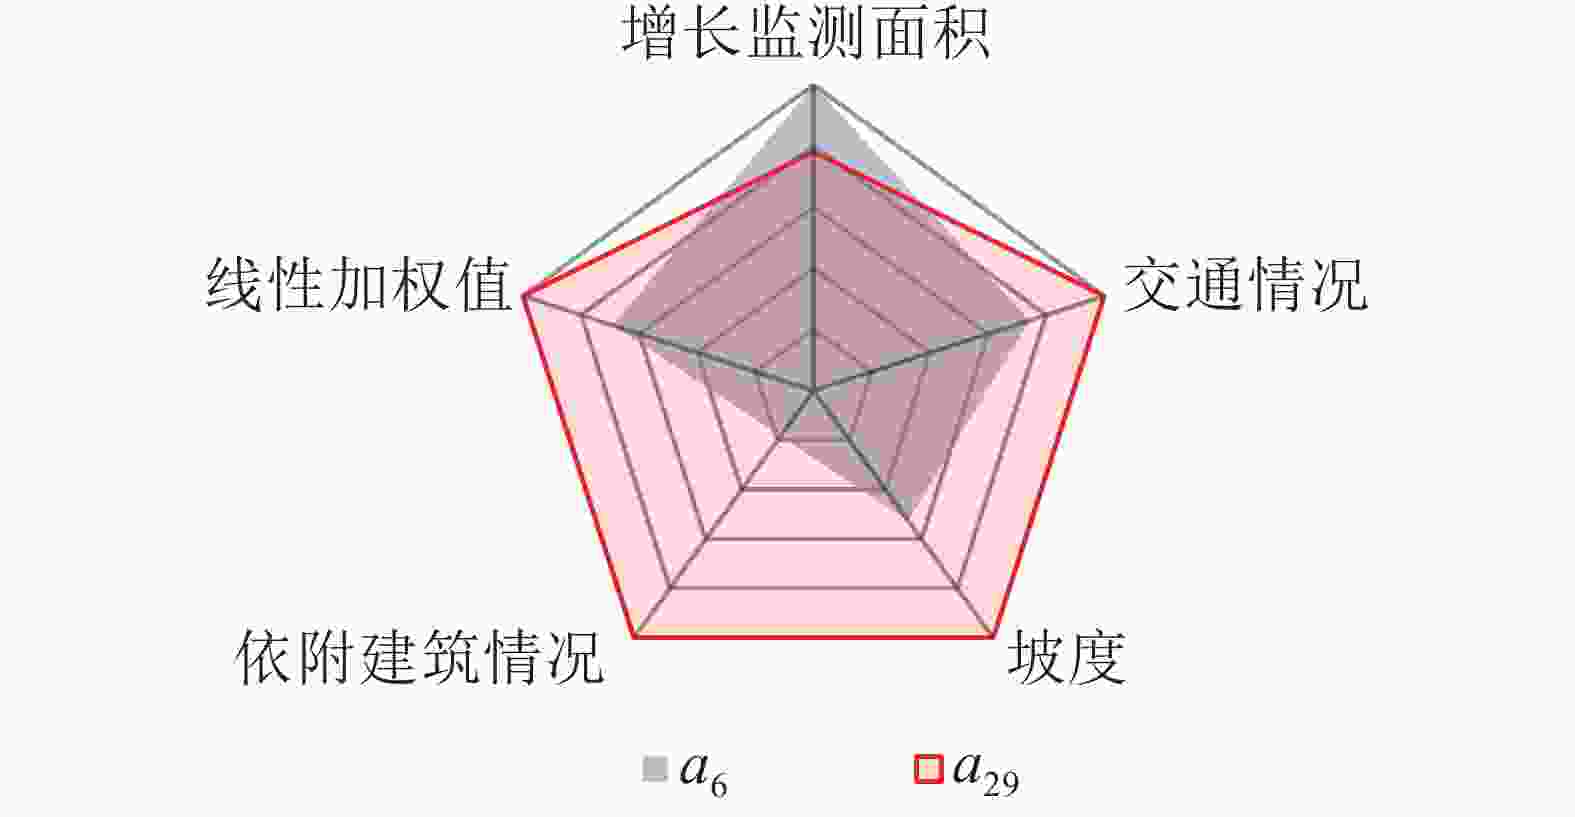
雷达图可对比优化前后首建瞭望塔的效益(图6)。首建
$ {{a}}_{{6}} $ 增长监测面积最大,在其他成本属性和综合值上均不如率先建立$ {{a}}_{{29}} $ 。 -
林区瞭望塔网络建设具有明显的空间性、阶段性和动态性。本研究结合林场实际,将林区瞭望塔网络建设规划问题转换为瞭望塔布局与时序优化问题,建立了最大监测面积模型(Max-MAM)和动态多属性建设时序模型(DMACTSM),并利用GIS工具设计实现了求解模型的方法。计算和实际验证表明:Max-MAM及Greedy算法可得到满意的优化布局方案;DMACTSM兼顾收益与多个成本属性,在瞭望塔建设时序的综合优化中兼顾了瞭望塔建设的整体与阶段效益的优化,且计算方法实用可行,为林区瞭望塔网络建设规划提供科学依据。
研究发现:顶点法提取备选点集是优化的基础,其关键是确定提取窗口的尺寸[15]。本研究采用11×11栅格大小的窗口提取备选点集,窗口尺寸可通过试验计算进一步优化提高顶点提取的效度。监测覆盖率最大与瞭望塔数最小问题互为对偶,当预设约束不是瞭望塔数n,而是监测覆盖率时,求解Max-MAM同样可得近似最优方案。本研究选取了面积较小的林场作为方法研究实验区,所提出的时空优化设计方法与研究对象的面积大小无关。在实践中,对于面积大的林区,甚至是1个县、1个州市的林区,更能体现时空优化设计带来的经济效益。
Layout and optimal design of watchtowers in forest regions
-
摘要:
目的 为优化林区瞭望塔布局与建设时序,提高瞭望塔网络建设效率。 方法 以北京郊区某林场为实验点,针对瞭望塔网络建设的空间性、阶段性和动态性等特点,设计基于顶点法的最大监测面积模型(Max-MAM),利用Greedy算法求解近似最优布局方案;设计基于熵权法的动态多属性建设时序模型(DMACTSM),求解近似最优布局方案下的综合最优建设时序。 结果 顶点法共提取到38个备选点;用Max-MAM优选出最优布局方案 $ {\overline P_6} = \left\{ {{a_6},{a_{29}},{a_{36}},{a_{12}},{a_{26}},{a_{18}}} \right\}$ ,可使瞭望塔网络的监测覆盖面积最大,约71.47%;用DMACTSM模型获得最优建设时序为a29、a26、a12、a6、a36和a18,可使瞭望塔网络建设过程中综合效益最优。结论 Max-MAM和DMACTSM能够调整建设时序,解决建设时序最优问题,结合地理信息系统(GIS)实现瞭望塔网络布局优化;调整后的建设时序在增长监测面积、交通、坡度、已有建筑情况等方面综合最优。图6表3参16 Abstract:Objective With the optimization of tower layout and time sequence in the process of construction, this paper is aimed at the promotion of the construction efficiency of tower networks in forest regions. Method With one forest farm in the suburbs of Beijing chosen as the testing spot and features of watchtower network construction such as spatiality, periodicity and dynamicity taken into consideration, efforts were made to figure out a near-optimal layout design built employing Greedy algorithm on the basis of Maximum monitoring area model(Max-MAM) established with the vertex method. Meanwhile, with such a design, on the basis of DAMACSTM which was built employing the dynamic multi-attribute entropy weight method, the optimal time sequence of construction was figured out. Result 38 optional points extracted adopting the vertex method, with the optimal layout achieved by Max-MAM, $ {\overline {P}_6} = \left\{ {{a_6},{a_{29}},{a_{36}},{a_{12}},{a_{26}},{a_{18}}} \right\}$ , the monitoring coverage of the watchtower network was maximized (about 71.47%) while with the optimal time sequence of construction achieved with DAMACSTM, a29>a26>a12>a6>a36>a18, the comprehensive benefits are maximized.Conclusion Two models of Max-MAM and DMACTSM proposed in this paper, can adjust and figure out the optimal time sequence of construction and when combined with GIS, are conducive to the achievement of the optimal layout of watchtower networks. And the optimal time sequence of construction helps maximize the comprehensive benefits in aspects like the increase in the monitoring area, the traffic, the slope, and existing structures. [Ch, 6 fig. 3 tab. 16 ref.] -
Key words:
- forest engineering /
- forest watchtower layout /
- Max-MAM /
- DMACTSM /
- entropy weight method /
- Greedy algorithm
-
表 1 布局方案与可视栅格总数变化
Table 1. Layout scheme and the change of the total number of visible grids
i $ {\overline{{P}}}_{{i}} $ ${\left|{{V}}_{{i}}\right| }$ 0 6 1 972 1 6,29 3 677 2 6,29,36 4 737 3 6,29,36,12 5 664 4 6,29,36,12,26 6 384 5 6,29,36,12,26,18 6 767 表 2 属性集
Table 2. Attribute set
属性 属性名称 属性类型 yi1 增长监测面积 正向、收益、动态 yi2 交通情况 反向、成本、静态 yi3 坡度 反向、成本、静态 yi4 依附建筑情况 反向、成本、静态 表 3 基于DMACTSM迭代计算的综合属性值、选优和最终排序
Table 3. DMACTSM iterative computation
迭代次数 综合属性值 max(ui) 优建瞭望塔 a29 a26 a12 a6 a36 a18 0 0.76 0.30 0.50 0.68 0.35 0.29 0.76 $ {{a}}_{{29}} $ 1 0.56 0.45 0.55 0.47 0.44 0.56 $ {{a}}_{{26}} $ 2 0.54 0.51 0.36 0.50 0.54 $ {{a}}_{{12}} $ 3 0.54 0.33 0.48 0.54 $ {{a}}_{{6}} $ 4 0.53 0.47 0.53 $ {{a}}_{{36}} $ -
[1] 国家林业和草原局. 中国智慧林业发展指导意见[EB/OL].(2013-08-21)[2020-04-11]. http://www.forestry.gov.cn/main/72/content-623867.html. [2] ZHANG Kun, HUANG Zhi, ZHANG Songlin. Using an optimization algorithm to establish a network of video surveillance for the protection of Golden Camellia [J]. Ecol Inf, 2017, 42: 32 − 37. [3] GÖLTAS M, DEMIREL T, ÇAGLAYAN I. Visibility analysis of fire watchtowers using GIS: a case study in Dalaman State Forest Enterprise [J]. Eur J For Eng, 2017, 3(2): 66 − 71. [4] 黄贝. 基于模糊层次分析的森林防火瞭望台选址模型[J]. 林业建设, 2015(1): 19 − 23. HUANG BEI. Modeling the sitting of forest fire observatory based on fuzzy analytic hierarchy [J]. For Constr, 2015(1): 19 − 23. [5] 张健, 刘毅, 韩宁, 等. 鹫峰国家森林公园林火视频监控点的选址[J]. 东北林业大学学报, 2009, 37(5): 24 − 27. ZHANG Jian, LIU Yi, HAN Ning, et al. Site selection for video monitoring spots of forest fire in Jiufeng National Forest Park, Beijing [J]. J Northeast For Univ, 2009, 37(5): 24 − 27. [6] 中华人民共和国国家发展和改革委员会发展规划司.全国森林防火规划(2016-2025年)[EB/OL]. (2017-05-18). [2019-10-25]. http://www.ndrc.go-v.cn/fzgggz/fzgh/ghwb/gjjgh/201705/t20170518_847772.html. [7] 国家林业局计财司. 森林火情瞭望监测设施工程项目建设标准[EB/OL]. (2017-07-28). [2020-04-11]. https://max.book118.com/html/2017/1215/144197192.shtm. [8] 杨超. 北京市西山试验林场防火监测点布局研究[D]. 北京: 北京林业大学, 2006. YANG Chao. Study on Distribution of Monitoring Spots for Forestry Fire Protection on Beijing Xishan Forestry Farm[D]. Beijing: Beijing Forestry University, 2006. [9] 孙伟, 曹姗姗, 唐小明. 林火视频监控空间优化布局与评价技术[J]. 自然灾害学报, 2013, 22(2): 61 − 69. SUN Wei, CAO Shanshan, TANG Xiaoming. Spatial optimal arrangement and evaluation technology of forest fire video monitoring [J]. J Natural Disasters, 2013, 22(2): 61 − 69. [10] 肖化顺, 段祝庚, 邓立斌. 林区瞭望台监测网点选址研究[J]. 中南林业科技大学学报, 2012, 32(7): 6 − 9. XIAO Huashun, DUAN Zhugeng, DENG Libin. Research on obseravtion network setting in forest area [J]. J Central South Univ For Technol, 2012, 32(7): 6 − 9. [11] 孙传皓, 李贺洋, 郭少斌. 基于层次分析-模糊综合评判法的鄂尔多斯盆地东缘上古界泥页岩储层评判[J]. 地球科学前沿, 2015, 5: 43 − 52. SUN Chuanhao, LI Heyang, GUO Shaobin. Shale reservoir evaluation of upper paleozoic in the East Ordos Basin based on AHP-FCE method [J]. Adv Geosci, 2015, 5: 43 − 52. [12] 许水燕. 基于GIS的森林防火监测系统的研究与实现[D]. 南京: 南京农业大学, 2010. XU Shuiyan. Implementation Monitoring System in Forest Fire Prevention Based on GIS[D]. Nanjing: Nanjing Agricultural University, 2010. [13] 周成林, 颜伟, 姜霞. 浅谈山区森林防火监测网优化设计与实现[J]. 贵州林业科技, 2016, 44(4): 61 − 64. ZHOU Chenglin, YAN Wei, JIANG Xia. Brief talk about optimization design and implementation of forest fire monitoring network in mountainous areas [J]. Guizhou For Sci Technol, 2016, 44(4): 61 − 64. [14] 刘淑琼, 邹时林, 邹胜武, 等. 基于规则格网DEM提取山顶点的研究[J]. 东华理工大学学报(自然科学版), 2013, 36(增刊): 93 − 95. LIU Shuqiong, ZHOU Shilin, ZHOU Shengwu, et al. Extraction mountain peak based on grid DEM [J]. J East China Ins Technol, 2013, 36(suppl): 93 − 95. [15] 陈盼盼, 张友顺, 王春, 等. 基于DEM的山顶点快速提取技术[J]. 现代测绘, 2006, 29(2): 11 − 13. CHEN Panpan, ZHANG Youshun, WANG Chun, et al. Method of extraction surface peaks based on DEM [J]. Modern Surv Mapping, 2006, 29(2): 11 − 13. [16] 汤旭, 郑洁, 冯彦, 等. 云南省县域森林生态安全评价与空间分析[J]. 浙江农林大学学报, 2018, 35(4): 684 − 694. TANG Xu, ZHENG Jie, FENG Yan, et al. County-level forest ecological security evaluation and spatial analysis in Yunnan Province [J]. J Zhejiang A&F Univ, 2018, 35(4): 684 − 694. -

-
链接本文:
https://zlxb.zafu.edu.cn/article/doi/10.11833/j.issn.2095-0756.20190622


 下载:
下载:
