-
土壤有机碳储量及碳库组分变化是全球碳循环及全球变化研究的热点问题之一。陆地生态系统中土壤碳库碳储量约为2500 Pg。土壤有机碳作为土壤碳库的重要组分,主要来源于土壤有机物在不同分解阶段产生的复杂混合物,在调节植物多样性、改变土壤理化性质和土壤肥力、减缓全球温室效应等方面发挥着极其重要的生态作用[1]。
湿地生态系统具有重要的碳汇功能,在调控全球碳平衡方面具有重要作用[2]。全球湿地面积仅占陆地的5%~8%,但湿地土壤有机碳储量却占全球土壤碳储量的20%~30%[3]。近年来,国内学者对东部沿海地区的盐城滩涂湿地[4]、西北甘肃尕海湿地[5]、中部洞庭湖湿地[3]等不同地区湿地土壤碳组分特征及影响因素进行了研究,结果表明:植被是影响湿地土壤有机碳沉积的重要因素。湿地植被类型变化能够改变凋落物分布格局[6],并导致土壤微生物、水分及其他理化性质等的一系列改变[7],进而影响到土壤碳库各组分含量的积累与分配[8]。同时,植被类型与地下水埋深之间存在复杂的相互作用和反馈机制,一方面植物会通过蒸腾作用影响地下水位,另一方面地下水位影响湿地植被生长所需要的水分和养分供给[9]。因此,揭示“植被类型—地下水埋深—土壤微生物量及理化性质—土壤有机碳储量及组分”之间的耦合关系,对于研究湿地生态功能及全球变化均具有十分重要的科学意义。
云南香格里拉纳帕海是中国典型的高原季节性湿地,孕育着丰富的生物多样性并具有显著的碳汇潜力[10]。但在自然因素与人为干扰的双重作用下,该湿地退化严重,水文条件也发生了明显改变,导致湿地植物群落与土壤环境发生改变,并影响土壤有机碳储量及各组分的积累。本研究选取不同地下水埋深的3种典型草甸群落,分析土壤有机碳储量和有机碳组分(总有机碳、微生物生物量碳、易氧化有机碳、颗粒有机碳)的变化特征,探讨湿地植物生物量、多样性及土壤性质变化对土壤有机碳储量及碳组分质量分数的影响,旨在阐明影响草甸湿地土壤有机碳储量及碳组分积累的关键影响因子。研究结果可为理解高原湿地的土壤碳循环过程提供数据支撑,同时也可为纳帕海高原湿地恢复和保护提供科学依据。
-
研究区位于云南香格里拉纳帕海湿地(27°49′~27°55′N,99°37′~99°41′E),海拔3260 m,面积3100 hm2,是在石灰岩上发育而成的喀斯特型季节性湿地[11]。该区干湿季节分明,湿地水量补给主要依靠降水,年均降水量为619 mm,其中雨季为495 mm (5—10月),旱季为124 mm (11月至翌年4月)[12]。土壤类型主要为沼泽土、沼泽化草甸土和草甸土[13]。
-
2020年11月,在纳帕海湿地依地下水埋深由高到低选取3个典型草甸群落样地,即:疏花早熟禾Poa pratensis群落(PP)、鼠曲草Gnaphalium affine群落(GA)和云雾薹草Carex nubigena群落(CN)(表1)。每个草甸群落中随机布设3个重复样地,大小50 m×10 m (间距>200 m),每个样地内再设置4个10 m×5 m的采样方,并详细记录样方内植物种类、株数和盖度等,同时采集植物标本。在固定样方内,选取50 cm×50 cm的小样方,对地上植物沿地面齐平进行刈割,去除附着土壤,立即称取植物鲜质量,随后将上述植物装入信封带回实验室,放置于105 ℃烘箱中,杀青30 min后调整温度至75 ℃,继续烘干48 h,确保植物完全烘干后称取干质量,计算植物地上生物量[14]。依据样方调查数据计算群落的Shannon-Wiener多样性指数(H)、Pielou均匀度指数(E)、Margalef丰富度指数(DMG)和Simpson优势度指数(C)[15]。
表 1 样地基本信息
Table 1. Basic information of the sampling sites
群落类型 纬度(N) 经度(E) 地下水埋深/cm 优势植物 盖度/% 土壤类型 疏花早熟禾群落(PP) 27°50′43.46″ 99°39′7.86″ −58.5±8.5 疏花早熟禾、牡蒿Artemisia japonica 90 草甸土 鼠曲草群落(GA) 27°50′43.46″ 99°38′34.60″ −112.0±6.8 鼠曲草、平车前 Plantago depressa 88 草甸土 云雾薹草群落(CN) 27°49′56.13″ 99°38′55.26″ −150.0±1.5 云雾薹草、车前P. asiatica 83 草甸土 -
在上述样方内挖掘土壤剖面,剖面深度为45~50 cm,先去除表面植物,分别采集0~20、20~40 cm土层土样,并将同层土壤混合,剔除根系和砾石等杂物,用四分法取约1.5 kg混合土样装入无菌自封袋中,贴好标签密封,放置于冰盒内带回实验室。共采集72份土壤样品。同时用环刀分层采集原状土测定土壤容重,共采集216个环刀样。使用水位计测量地下水深度。实验室内将新鲜土样做如下处理:约100 g用于测定土壤自然含水率;约400 g放入4 ℃冰箱冷藏保存,于1周内完成土壤微生物生物量碳测定;约1 000 g自然风干15 d后,分别通过1.00和0.25 mm孔筛,用于土壤总有机碳、易氧化有机碳、颗粒有机碳、pH、全氮、全磷、全钾等指标的测定。
-
土壤理化指标测定参照《土壤农业化学分析方法》[16]。土壤容重(SBD)采用环刀法测定;土壤含水量(SWC)采用烘干称量法测定;土壤pH采用电位法(水土质量比为1.0∶2.5)测定;土壤全氮(TN)采用凯氏法消煮-全自动定氮仪测定;土壤全磷(TP)采用碱熔钼锑抗比色法测定;土壤全钾(TK)采用氢氧化钠熔融-火焰光度计法测定。每个土样测定3个平行样,取其平均值。
土壤总有机碳(TOC)采用外加热重铬酸钾氧化法[16]测定;土壤微生物生物量碳(MBC)采用硫酸钾-氯仿熏蒸法[14]测定;土壤易氧化有机碳(EOC)采用高锰酸钾氧化法[17]测定;土壤颗粒有机碳(POC)采用六偏磷酸钠分散法[18]测定。每个土样测定3个平行样,取其平均值。
-
土壤有机碳储量由土层深度、土壤容重和土壤有机碳质量分数决定,计算公式参照ELLERT等[19]。
$$ M_{{\rm{SOC}}} = \sum\limits_{i = 1}^n {(d_{{\rm{BD}}i} \times M_{{\rm{SOC}}i} \times D_i \times 0.1)}。 $$ 式中:
$ M_{{\rm{SOC}}} $ 为土壤有机碳储量(t·hm−2);$d_{{\rm{BD}}i}$ 为第i层土壤容重( g·cm−3 );$M_{{\rm{SOC}}i}$ 为第i层土壤有机碳质量分数(g·kg−1);Di为第i土层厚度(cm)。 -
采用双因素方差分析法比较不同草甸群落类型及不同土层土壤总有机碳、微生物生物量碳、易氧化有机碳、颗粒有机碳质量分数的差异性;以总有机碳及其碳组分作为响应变量,以土壤理化性质(容重、含水量、pH、全氮、全磷、全钾)和地上植物(植物多样性指数、植物地上生物量)作为解释变量进行冗余分析(RDA)。通过计算Pearson相关系数(α=0.05)检验总有机碳和各有机碳组分与土壤理化指标的相关性。所有数据使用Excel 2016整理,双因素方差分析和Pearson相关系数的计算在SPSS AU中进行,绘图使用Origin 2019完成,冗余分析在Canoco 5.0中完成。
-
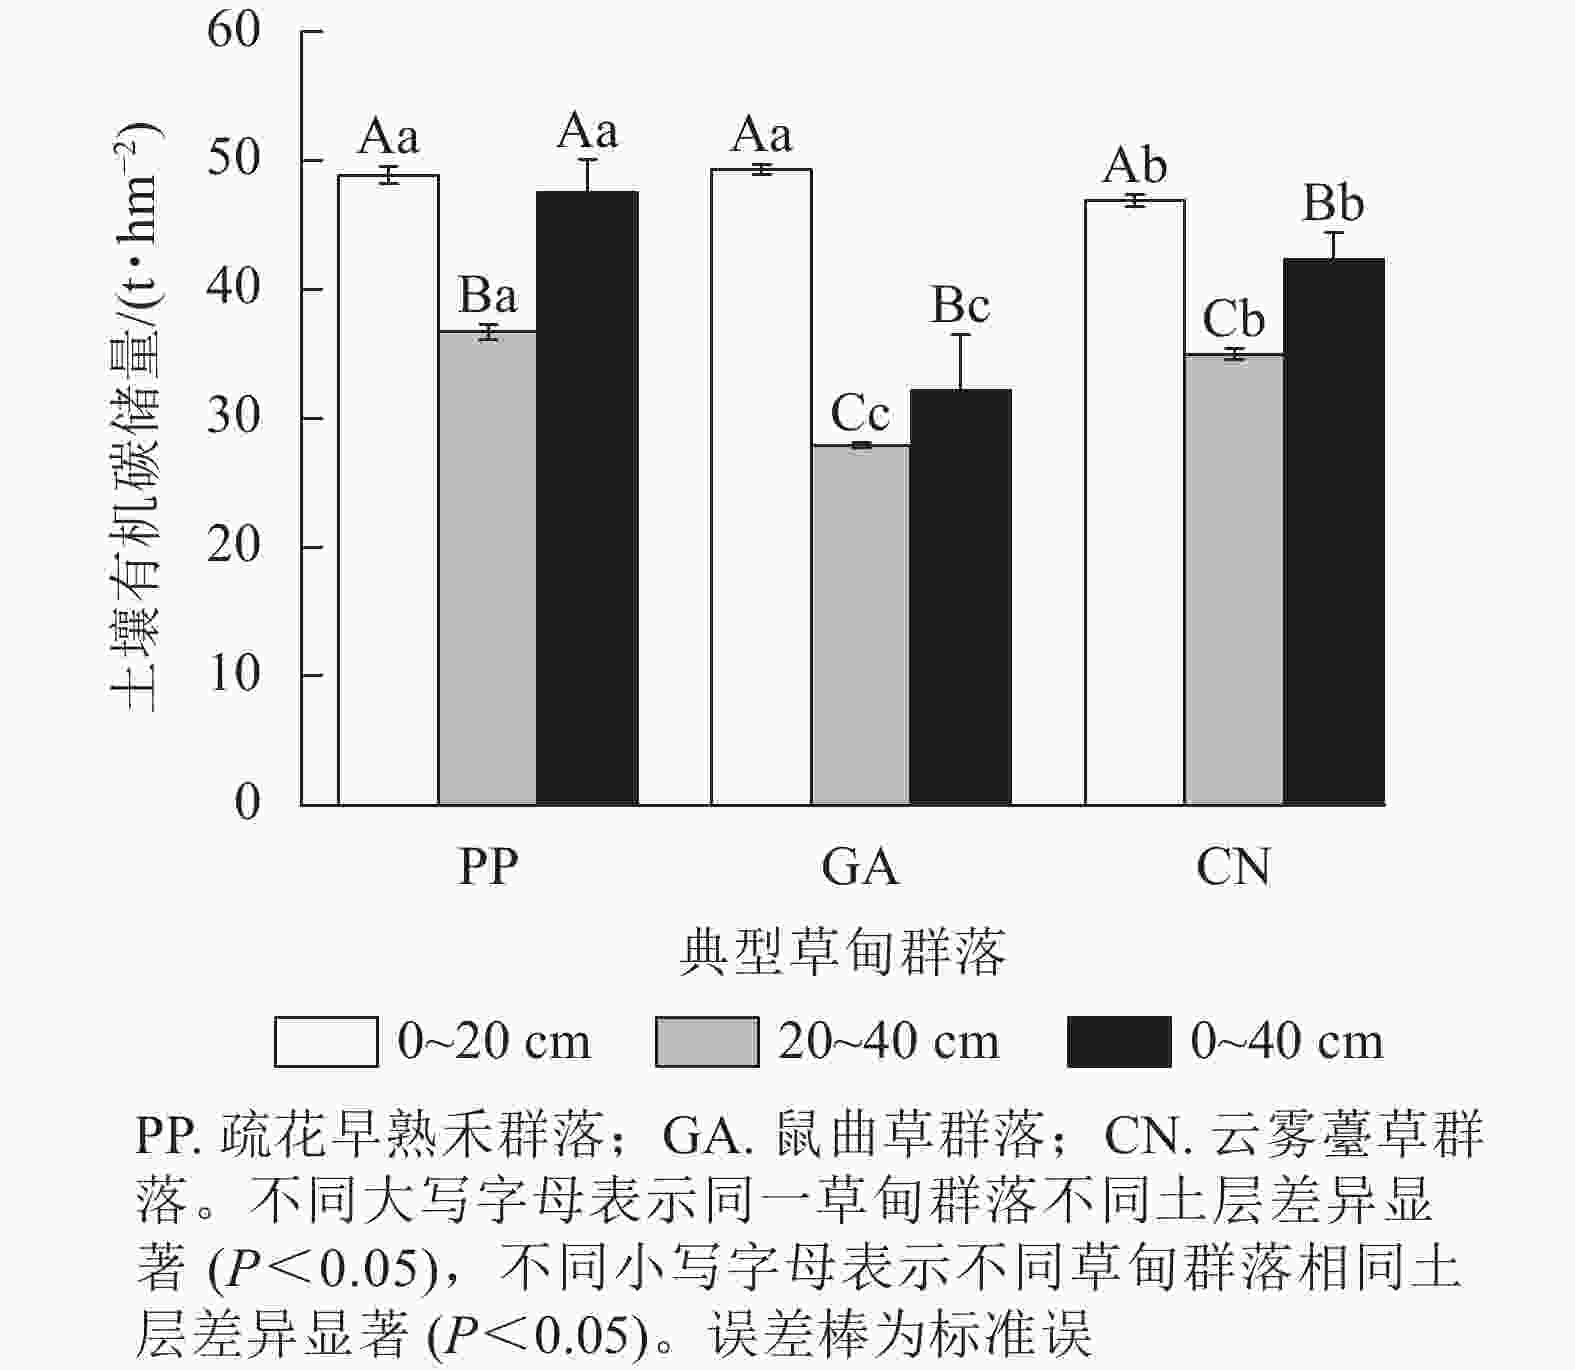
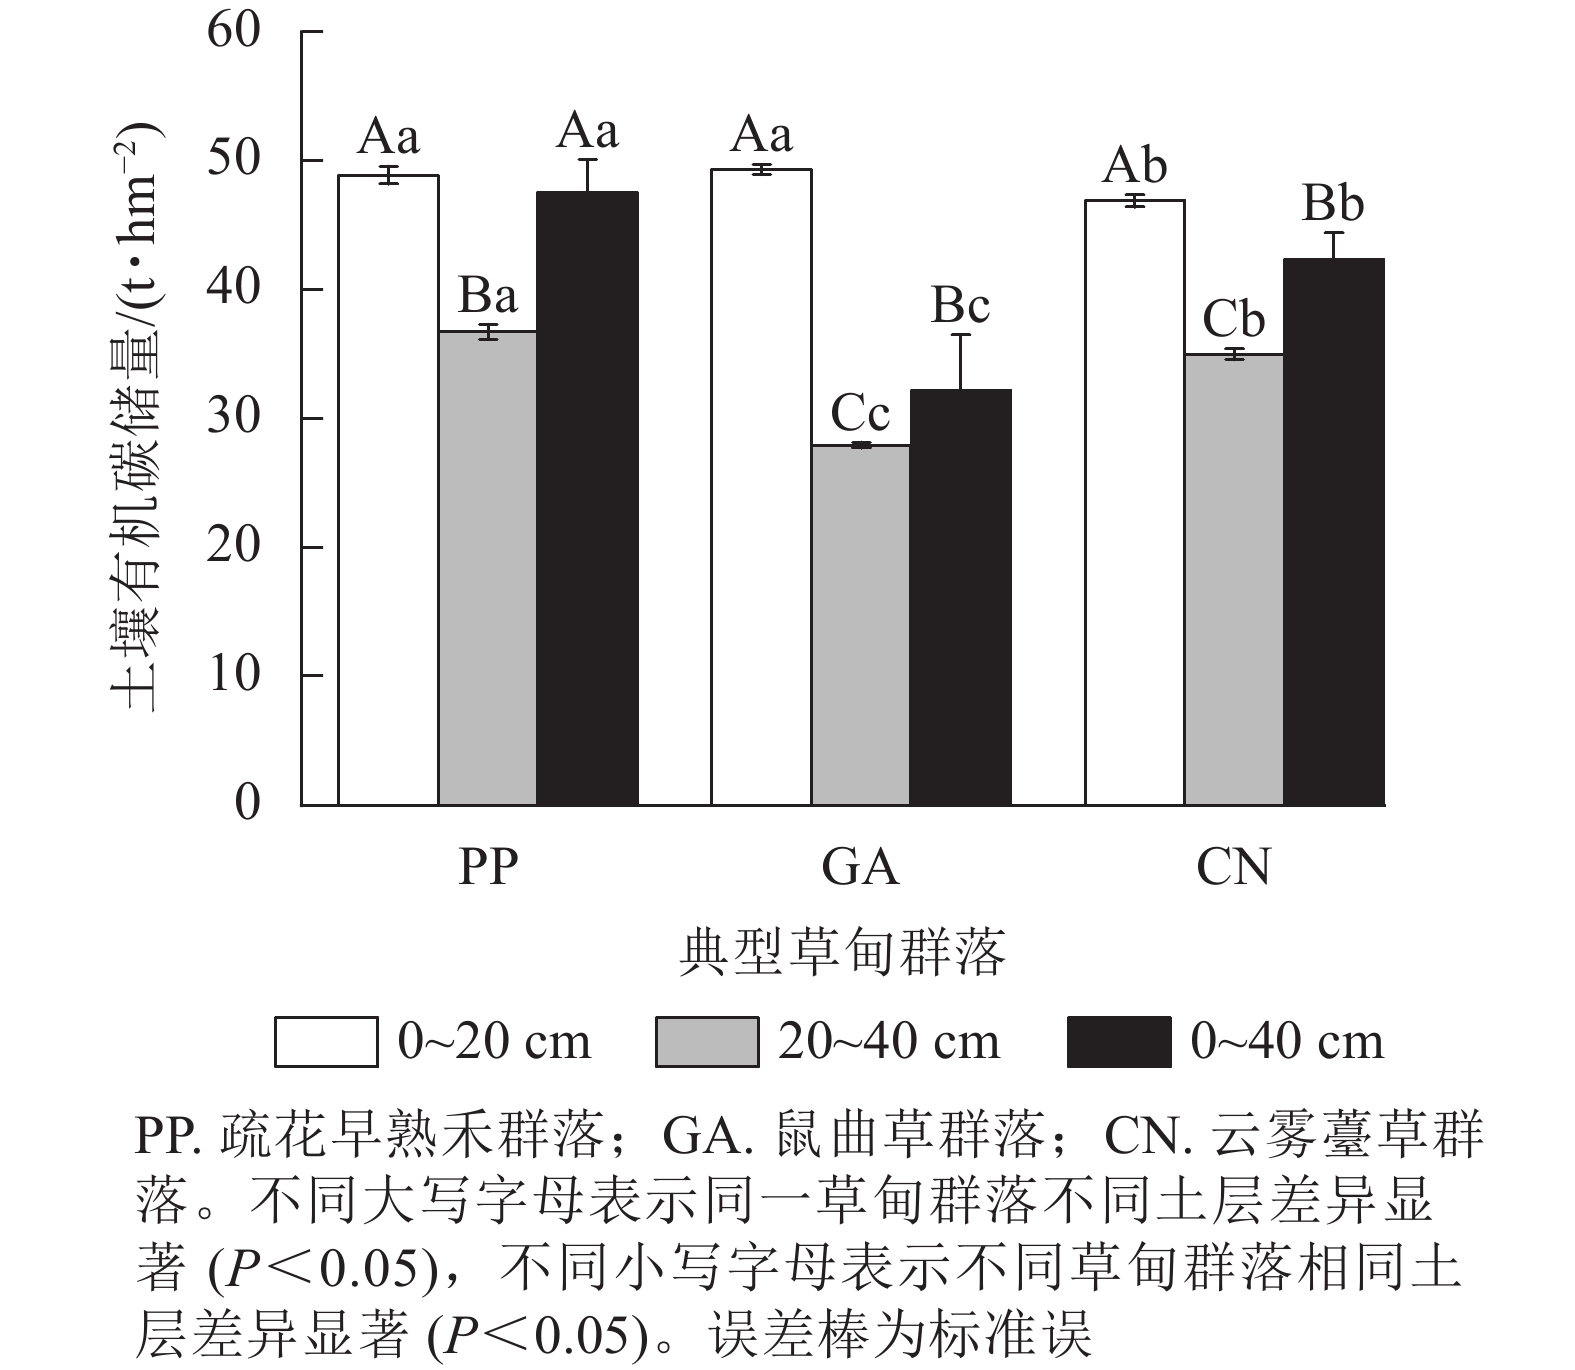
土壤有机碳储量(0~40 cm土层)在不同典型草甸群落中差异显著(图1,P<0.05),从大到小依次为疏花早熟禾群落(47.55 t·hm−2)、云雾薹草群落(42.28 t·hm−2)、鼠曲草群落(32.14 t·hm−2),其中疏花早熟禾群落是鼠曲草群落的1.5倍;土壤碳储量垂直分布均为随着土层加深而显著下降(P<0.05),其中0~20 cm土层碳储量均值占总量的57.10%~63.85%,鼠曲草群落垂直变化幅度最大,从上层到下层减小1.8倍。
-
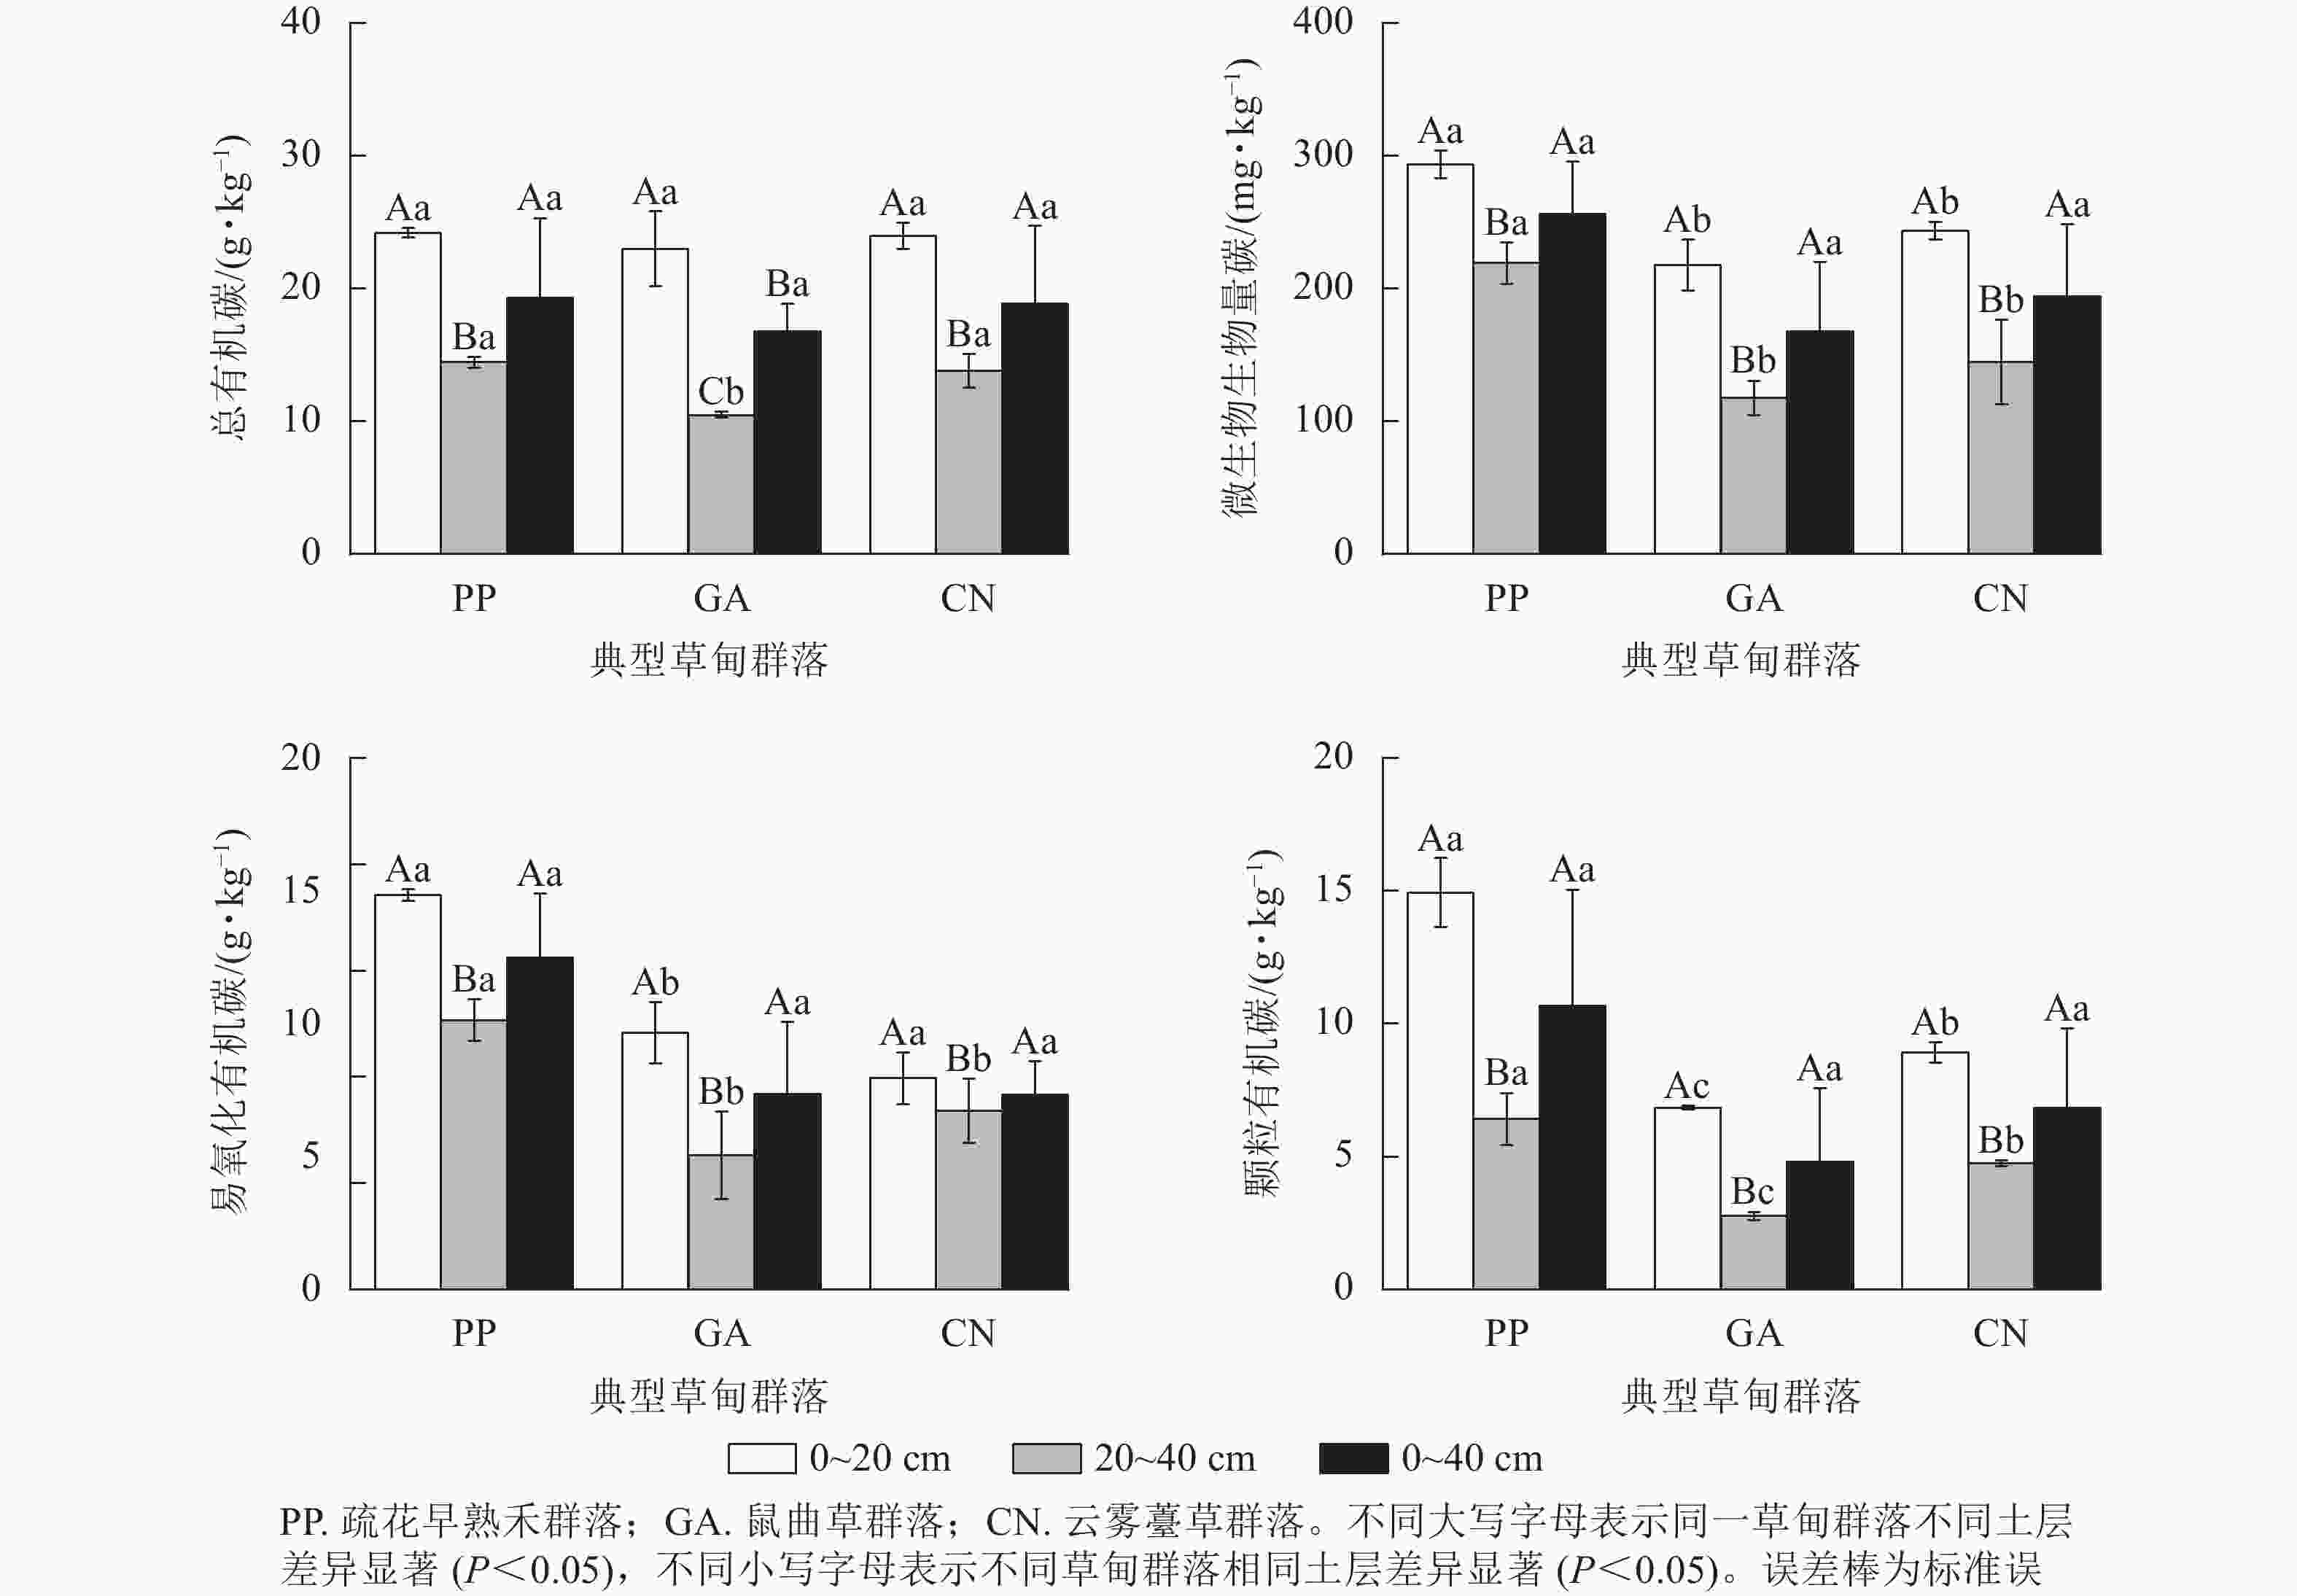
图2表明:随着地下水埋深降低, 0~40 cm土层土壤总有机碳、微生物生物量碳、易氧化有机碳和颗粒有机碳均值呈减少趋势,但差异不显著(P>0.05),最大值均出现在疏花早熟禾群落(19.33 g·kg−1、256.32 mg·kg−1、15.61 g·kg−1、10.67 g·kg−1)。垂直变化幅度上,土壤碳组分在鼠曲草群落中变化幅度最大,从上层到下层分别减小2.0、1.8、1.9、2.5倍,在云雾薹草群落变幅最小,分别为1.3、1.2、1.9倍。
-
由表2可知:不同典型草甸群落多样性差异显著(P<0.05)。随着地下水位加深,植物Shannon-Wiener多样性指数、Pielou均匀度指数、Margalef丰富度指数和Simpson优势度指数均显著增加,在疏花早熟禾群落中最大,分别是云雾薹草群落的2.3、1.6、2.5和1.5倍。
表 2 纳帕海典型草甸群落地上生物量和多样性特征
Table 2. Characteristics of above-ground biomass and diversity in typical meadow community of Napahai
样地名称 地上生物量/(g·m−2) Shannon-Wiener多样性指数 Pielou均匀度指数 Margalef丰富度指数 Simpson优势度指数 疏花早熟禾群落 646.94±69.16 a 3.71±0.02 a 0.93±0.01a 13.11±0.38 a 0.92±0.02 a 鼠曲草群落 337.45±43.66 b 2.87±0.01 b 0.87±0.06 b 9.49±0.68 b 0.86±0.01 b 云雾薹草群落 229.58±1.87 c 1.58±0.30 c 0.57±0.09 c 5.19±0.39 c 0.62±0.07 c 说明:同列不同小写字母表示不同典型草甸群落多样性差异显著(P<0.05)。数值为平均值±标准误 -
从表3可看出:不同典型草甸群落土壤理化性质差异显著(P<0.05)。土壤含水量、pH、全磷的最大值出现在疏花早熟禾群落(25.48%、8.35、0.51 g·kg−1),最小值在鼠曲草群落(21.41%、5.14、0.42 g·kg−1);土壤容重、全钾则与之相反,最大值出现在鼠曲草群落(1.28 g·cm−3、34.03 g·kg−1);土壤全氮在云雾薹草群落中最大(1.70 g·kg−1),在疏花早熟禾群落中最小(1.20 g·kg−1);土壤全磷在疏花早熟禾群落最大(0.51 g·kg−1)。垂直变化方面,各群落土壤理化性质随着土层加深呈现不同的变化规律。土壤容重和pH随着土层加深而增大。土壤含水量、全氧、全磷、全钾随着土层加深呈显著减小(P<0.05)。变化幅度上,土壤含水量变化幅度最大出现在云雾薹草群落,幅度为1.2倍,疏花早熟禾群落的土壤变化幅度最大,幅度为1.4倍,土壤全氮、全磷、全钾变幅度最大值分别为云雾薹草群落(2.0倍)、鼠曲草群落(1.2倍)和疏花早熟禾群落(1.0倍)。
表 3 纳帕海典型草甸群落土壤理化性质特征
Table 3. Characteristics of soil physicochemical properties of typical meadow communities of Napahai
植物群落 地下水位/cm 土层深度/cm 土壤含水量/% 容重/(g·cm−3) pH 全氮/(g·kg−1) 全磷/(g·kg−1) 全钾/(g·kg−1) 疏花早熟禾群落 −58.5 0~20 26.66±0.85 Aa 1.01±0.01 Cb 8.54±0.08 Aa 1.38±0.03 Ab 0.54±0.03 Aa 33.59±2.34 Ba 20~40 24.29±0.70 Ba 1.22±0.03 Ab 8.54±0.06 Aa 0.85±0.08 Ba 0.48±0.03 Ba 35.90±0.45 Aa 0~40 25.48±0.61 Aa 1.11±0.02 Bb 8.35±0.37 Aa 1.20±0.16 Ab 0.51±0.03 Aa 30.57±2.45 Ca 鼠曲草群落 −112.0 0~20 22.17±0.40 Ab 1.23±0.12 Aa 4.97±0.11 Ac 1.44±0.16 Ab 0.47±0.04 Ab 28.03±0.57 Ab 20~40 20.65±0.37 Cc 1.32±0.04 Aa 5.44±0.41 Ac 0.91±0.02 Ba 0.38±0.03 Bb 28.36±0.24 Ab 0~40 21.41±0.28 Bc 1.28±0.10 Aa 5.14±0.27 Ac 1.31±0.17 Ab 0.42±0.03 Ab 28.45±1.39 Aa 云雾薹草群落 −150.0 0~20 25.61±0.52 Aa 0.96±0.03 Cc 6.87±0.25 Ab 1.84±0.11 Aa 0.46±0.02 Ab 34.03±0.91 Aa 20~40 21.58±0.72 Bb 1.28±0.04 Aa 7.28±0.45 Ab 0.93±0.42 Ba 0.39±0.01 Cb 28.78±0.20 Cb 0~40 23.59±3.70 Aa 1.12±0.01 Bb 7.07±0.52 Ab 1.70±0.19 Aa 0.42±0.01 Bb 32.60±3.74 Ba 说明:不同大写字母表示同一典型草甸群落不同土层差异显著(P<0.05),不同小写字母表示不同典型草甸群落相同土层差异显著(P<0.05)。数值为平均值±标准误 -
从表4可知:植物多样性、地上生物量及土壤理化性质对土壤有机碳储量及碳组分的影响因子存在一定差异。其中植物多样性和地上生物量均与有机碳储量及碳组分呈极显著(P<0.01)或显著(P<0.05)正相关;土壤含水量与总有机碳呈显著正相关(P<0.05),与颗粒有机碳呈极显著正相关(P<0.01);土壤容重与总有机碳和颗粒有机碳呈极显著负相关(P<0.01),与微生物生物量碳呈显著负相关(P<0.05);全氮与有机碳储量、微生物生物量碳呈显著正相关(P<0.05),与总有机碳和颗粒有机碳呈极显著正相关(P<0.01);全磷与微生物生物量碳呈显著正相关(P<0.05),与颗粒有机碳呈极显著正相关(P<0.01);全钾仅与颗粒有机碳呈显著正相关(P<0.05)。
表 4 土壤有机碳储量及碳组分质量分数与环境因子之间的相关系数
Table 4. Correlation coefficients between the soil organic carbon components and environment factors of soil
指标 Shannon-Wiener
指数Pielou
指数Margalef
指数Simpson
指数地上生
物量土壤含
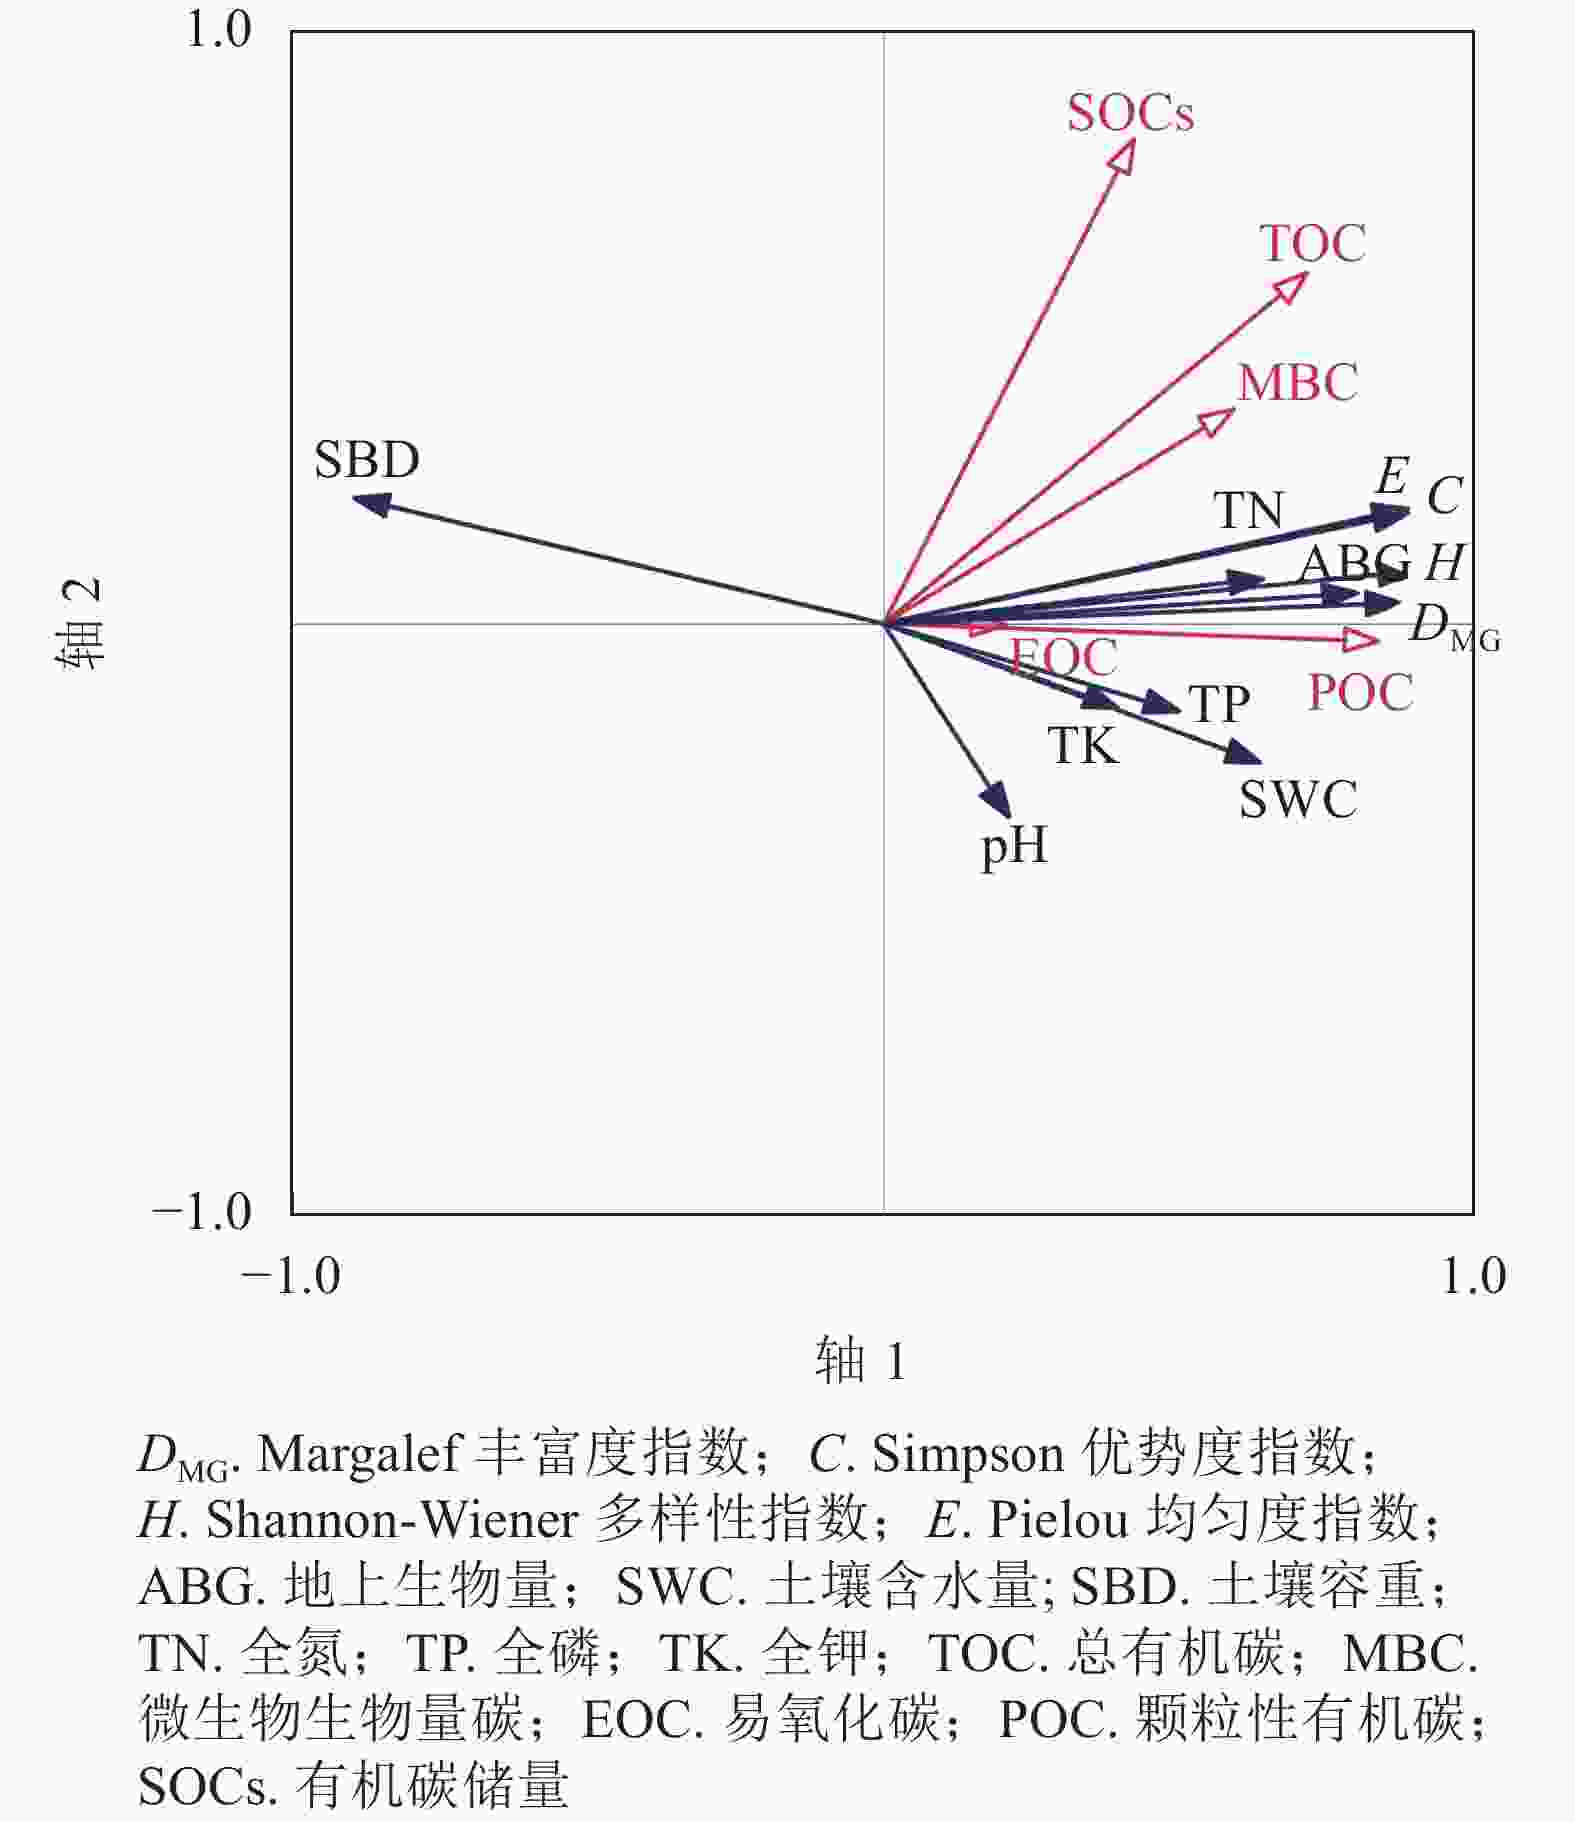
水量容重 pH 全氮 全磷 全钾 总有机碳 0.718** 0.784** 0.664** 0.791** 0.612** 0.343* −0.596** −0.100 0.585** 0.259 0.265 微生物生物量碳 0.645** 0.654** 0.616** 0.649** 0.564** 0.290 −0.372* 0.144 0.339* 0.335* 0.057 易氧化有机碳 0.204 0.169 0.272 0.176 0.448** 0.129 −0.068 0.097 −0.116 0.086 0.137 颗粒有机碳 0.773** 0.767** 0.775** 0.765** 0.859** 0.620** −0.758** 0.172 0.482** 0.439** 0.370* 有机碳储量 0.457** 0.549** 0.402* 0.558** 0.409* 0.097 −0.256 −0.250 0.381* 0.065 0.112 说明:*P<0.05; **P<0.01 以植物地上生物量、多样性指数及土壤环境因子为解释变量,土壤有机碳储量和碳组分为响应变量进行RDA分析,结果表明(图3):有机碳储量与总有机碳、微生物生物量碳夹角最小,而与Pielou均匀度指数(E)、Simpson优势度指数(C)、Margalef丰富度指数(DMG)、Shannon-Wiener多样性指数(H)、地上部生物量、全氮夹角次之,说明总有机碳与微生物生物量是土壤有机碳储量形成的主要控制者,Pielou均匀度指数、Simpson优势度指数、Margalef丰富度指数、Shannon-Wiener多样性指数、地上部生物量、全氮是土壤有机碳储量的主要影响因子。土壤碳组分与Shannon-Wiener多样性指数、Pielou均匀度指数、Margalef丰富度指数和Simpson优势度指数、全磷、土壤含水量及地上生物量的夹角最小,说明地上生物量、植物多样性、全磷、土壤含水量是促进土壤有机碳储量和碳组分的主控因子。
-
植物残体腐质化进入土壤是有机碳的主要来源,不同植被类型具有不同的物种组成与丰富度,导致地上生物量、土壤动物和微生物活性的差异,直接影响到土壤有机碳的积累与分解,由此形成不同植被类型土壤有机碳的分布格局[20]。本研究发现:疏花早熟禾群落土壤有机碳储量最大。这与李宁云等[21]的研究结果相一致,主要原因是疏花早熟禾群落植被盖度、多样性和地上生物量最大,其植物光合作用和固碳能力最强。另外,该群落地下水埋深最高,湿地土壤有机碳与水分存在相互作用[9],土壤水分增加从而减缓氧化分解速率,进一步促进土壤有机质积累,最终促进土壤碳积累,增强其碳汇能力[22]。土壤有机碳储量最小值出现在鼠曲草群落,可能与该群落位于湖泊附近,存在季节性水位变化相关。MOCHE等[23]研究认为:反复的淹水和退水会使土壤固碳能力下降。本研究中土壤碳储量的范围为64.28~95.11 t·hm−2,超过中国大部分低海拔地区的湿地[24−25],因此高原湿地碳库的重要性不言而喻。减缓纳帕海高原湿地植被退化并恢复已退化植被的工作刻不容缓。
土壤有机碳储量主要来源于地表植物和土壤养分等,并受地上生物的矿化分解、转化、累积影响[25]。本研究发现:植物多样性指数、地上生物量和土壤全氮与土壤有机碳储量均呈正相关关系,这与梁春玲[3]研究结果相似,说明植被多样性、地上生物量和土壤全氮随地下水埋深的变化,直接调控了土壤碳在不同地下水埋深处的积累。冗余分析显示:总有机碳是土壤有机碳储量的主要贡献者,且土壤容重与碳储量呈负相关,这也与已有研究一致[23]。土壤容重越大,土壤有机碳和土壤微生物生物量碳质量分数减小,进而影响土壤有机碳储量[26]。
本研究中,3种典型草甸群落类型土壤碳储量均随着土层加深而减小,这与前人研究结果一致[21, 27]。植物生长时通过“根际沉降”使有机碳积累[26],草甸植物根系集中分布在0~20 cm土层[28],有机碳难以通过根系输入到深层土壤,因此土壤碳储量随土层加深而减小,这也表明表层土壤具有重要的碳汇功能。在3种典型草甸群落中,鼠曲草群落土壤碳储量从上层到下层的下降幅度最大,这可能是因为该群落表层具有较高的植物多样性指数和地上生物量,“根际沉降”使得有机碳富集在表层土壤,但随着土层加深,土壤含水量减少,抑制了土壤微生物的繁殖,加上采样季节正处冬季,较低的土温又降低了微生物的活性[29]。
-
不同典型草甸群落地表植被覆盖及土壤环境的改变,能够引起土壤碳组分的显著变化,但由于不同土壤碳组分具有不同来源与性质,其对植被类型变化的响应具有一定的变异性[30]。土壤微生物生物量碳和易氧化有机碳是土壤活性有机碳库中最重要的组分。其中,土壤易氧化有机碳周转速率最快且最先被氧化[31],而微生物生物量碳则反映了土壤中微生物和动植物残体等的数量,能够表征土壤碳、氮、磷等养分循环状况,在调控湿地物质循环过程中具有重要作用[32]。土壤颗粒有机碳相对稳定,其多少决定了该地区碳库的稳定性[33]。
本研究中,土壤总有机碳、微生物生物量碳、易氧化有机碳、颗粒有机碳最大值均出现在疏花早熟禾群落。这可能与群落盖度、植物多样性指数、地上生物量和地下水位有关。高水位导致土壤通气状况差,抑制了微生物活性及土壤呼吸,从而抑制了有机质的分解,促进了总有机碳的积累[34]。此外,在本研究中土壤总有机碳质量分数显著高于东部滨海滩涂湿地[4]、洞庭湖湿地[3]等低海拔湿地,表明纳帕海高原湿地土壤具有较大的固碳潜力。疏花早熟禾群落具有最高的地上生物量,为微生物提供了充分的碳源,从而具有较高的微生物生物量碳。疏花早熟禾群落较高的地上生物量,输入土壤的凋落物量高于鼠曲草和云雾薹草群落,促进了土壤易氧化有机碳的积累。另外,可能由于疏花早熟禾有利于湿地土壤团聚性的形成与稳定,从而使得其颗粒有机碳质量分数大于其他2个样地[35]。
3种典型草甸群落土壤总有机碳、微生物生物量碳、易氧化有机碳、颗粒有机碳质量分数均随着土层的加深而显著减小(P<0.05)。随着地下水埋深加深,容重增大,土壤有机碳分解速率随通气性减弱而减小,深层土壤碳组分质量分数减少。在本研究中,地下水埋深的高低以及深层土壤环境的差异,导致了在不同土壤层次间碳组分的相对含量及其变化趋势因群落类型而有不同变化趋势。其中,有机碳组分在鼠曲草群落中的减小幅度最大。这可能与该群落的地下水埋深高度有关,同时,纳帕海高原湿地干湿季分明,位于湖泊附近的鼠曲草群落在反复的季节性淹水和退水的水文条件下,地下水埋深波动较大,导致土壤胶体形态、土壤结构、容重和粒径等性质的改变,使原来不能分解的有机质因团聚体的分散而分解[36]。土壤总有机碳、微生物生物量碳在疏花早熟禾群落的垂直变化幅度最小,土壤易氧化有机碳、颗粒有机碳在云雾薹草群落的降幅最小。这可能是由于疏花早熟禾群落具有最高的地上生物量,为微生物提供了充分的碳源,促进了微生物特别是厌氧微生物数量的增长。云雾薹草群落地下水埋深最低,受地下水波动影响较小,表层和深层土壤结构较为稳定,故降幅最小。
-
植物是草甸土壤有机碳输入的主要来源,地下水位埋深的变化能够引起湿地植物多样性、地上生物量和土壤理化性质的改变,进而显著影响湿地土壤碳组分的积累[37]。土壤总有机碳、微生物生物量碳、易氧化有机碳、颗粒有机碳均与植物多样性指数呈正相关关系,说明随着地下水埋深降低,地表植物多样性呈减少趋势,进而导致此4种碳组分质量分数随地下水埋深降低而呈现显著减少格局。朱丽等[37]在海流兔河研究发现:随着地下水位的降低,植物物种数显著减少,同时,水位埋深变化影响最大根系深度、根系形态特征和生理特性。这些特征又对根系向土壤的碳输入产生影响[38]。水位埋深降低导致根系栓质化,造成根系分泌物数量降低以及细根的周转期延长,最终减缓根系对土壤的碳输入[7]。
土壤pH作为湿地生态功能的重要调控因子,能够直接影响土壤微生物的活性,从而对有机碳组分产生显著影响[3]。但在本研究中,pH对土壤有机碳组分质量分数的解释率最低,这可能和地下水埋深有关,水位的高低决定了土壤酸性离子流失量。地下水埋深越高,土壤pH值越大[39]。本研究中,3种典型草甸植物群落所在样地的地下水位埋深差异显著(P<0.05),这也是各群落土壤pH差异显著的原因之一。全氮是影响土壤有机碳组分的主控因子之一,相关分析也表明:土壤有机碳组分(总有机碳、微生物生物量碳、颗粒有机碳)沿地下水埋深变化对全氮存在显著正效应(P<0.05)。这与尹鹏松等[40]研究结果相似。这可能由于土壤全氮增加可显著刺激土壤微生物多样性,从而促进土壤有机碳的固持[41]。孟妍君等[35]研究亦表明:土壤氮等底物利用率增加通过刺激土壤微生物多样性促进土壤有机碳的积累,并且土壤全氮可以直接影响土壤微生物的种类、数量及活性,从而影响土壤碳转化过程[37]。土壤全磷对土壤易氧化有机碳和颗粒有机碳存在正向效应,这与徐耀文等[42]研究结果相似。本研究中土壤全磷质量分数最大值出现在水位高埋深处。作为限制湿地植物生长的主要元素,土壤磷增加可通过刺激植物与微生物的生长影响土壤碳的输入,进而促进土壤碳组分积累[7]。
-
湿地植物群落、土壤理化性质与地下水埋深在空间尺度上存在一定的交互作用,进而导致了土壤有机碳质量分数及碳组分的空间变化。随地下水埋深的降低,3个草甸植物群落地上生物量和物种多样性指数下降1.5~2.3倍,土壤有机碳储量及碳组分质量分数降低了1.0~2.2倍,沿土层下降1.2~2.5倍。冗余分析显示:总有机碳和微生物生物量碳质量分数变化是土壤有机碳储量的主要贡献者,而植物多样性、全氮是总有机碳、微生物生物量碳的主要影响因子,植物地上生物量、土壤全磷及土壤含水量是影响颗粒有机碳和易氧化有机碳变化的主控因子。因此,探明草甸植物生物量和多样性以及水文和土壤养分供应状况的改变及其对土壤有机碳沉积的影响,是未来全球变化加剧背景下湿地土壤碳积累与分配时空格局及调控机制研究的核心内容。
本研究采样时间处于研究区的干季,今后还可对纳帕海典型草甸湿地土壤碳储量及碳组分的干湿季变化和年变化开展研究。
Changes of soil organic carbon storage and carbon components in typical meadow communities in Napahai
-
摘要:
目的 探索不同地下水位埋深引起纳帕海典型草甸湿地土壤碳组分的变化特征及其与环境因子的耦合关系,为理解高原湿地土壤碳循环过程提供数据支撑。 方法 2020年11月,在纳帕海湿地选择地下水埋深由高到低的疏花早熟禾Poa pratensis群落、鼠曲草Gnaphalium affine群落和云雾薹草Carex nubigena群落3种典型草甸群落作为研究对象,比较土壤总有机碳、微生物生物量碳、易氧化有机碳、颗粒有机碳的质量分数以及沿土层的分布特征,并分析碳组分与植物多样性和土壤理化因子之间的关系。 结果 随着地下水埋深降低,不同典型草甸群落土壤总有机碳储量(0~40 cm土层)呈减少趋势,从高到低依次为疏花早熟禾群落(47.55 t ·hm−2)、云雾薹草群落(42.28 t ·hm−2)、鼠曲草群落(32.14 t ·hm−2),并沿土层加深而降低,其中鼠曲草群落土壤总有机碳储量下降幅度最大;土壤总有机碳、微生物生物量碳、易氧化有机碳和颗粒有机碳均随地下水埋深降低而减少,变幅为1.8~3.4倍;土壤有机碳组分质量分数沿土层加深而降低,下降1.0~3.4倍;植物生物量、植物群落Shannon-Wiener多样性指数、Pielou均匀度指数、Margalef丰富度指数和Simpson优势度指数均随着地下水埋深的降低而减小,降幅达1.5~2.8倍;土壤含水量、pH、全磷同样显著减少(P<0.05);冗余分析(RDA)和相关性分析表明:植物地上生物量、土壤含水量、容重、全氮和全磷对地下水埋深变化的响应最为强烈,是影响纳帕海典型草甸群落土壤有机碳组分变化的主控因子。 结论 纳帕海湿地典型草甸土壤有机碳组分质量分数及垂直分布的特征主要取决于不同地下水埋深所引起的植物地上生物量及土壤理化状况的改变。因此,在纳帕海湿地典型草甸群落的保护过程中,建议对地下水位进行监测,防止地下水位过低对湿地碳库稳定性造成影响。图3表4参42 Abstract:Objective This study aims to explore the change characteristics of soil organic carbon (SOC) components in typical meadow wetlands of Napahai caused by different groundwater levels and their coupling relationship with environmental factors, so as to provide data support for understanding the process of soil carbon cycle in plateau wetlands. Method 3 typical meadow communities of different underground water levels were selected as the research objects in Napahai Wetland in November 2020. The concentration of soil microbial biomass carbon (MBC) and total organic carbon (TOC), easily oxidized carbon (EOC), and particle organic carbon (POC) as well as the distribution pattern of carbon pool along soil profile were compared. The relationship between carbon components, plant diversity and soil physicochemical factors was analyzed. Result The total soil carbon stocks of different meadow communities (0−40 cm soil layer) ranking from high to low were Poa pratensis community (47.55 t·hm−2), Carex nubigena community (42.28 t·hm−2), and Gnaphalium affine community (32.14 t·hm−2), which decreased along the deepening of soil layers. Soil TOC storage decreased the most in G. affine community. Soil TOC, MBC, EOC and POC decreased with the decrease of groundwater depth, ranging from1.8 to 3.4 times. SOC component decreased by 1.0−3.4 times along the deepening of soil layer in the communities of P. pratensis, C. nubigena and G. affine. Plant biomass, Shannon-Wiener diversity index of plant community, Pielou evenness index, Margalef richness index and Simpson dominance index all decreased by 1.5−2.8 times along the decrease of groundwater depth. Soil water content (SWC), pH and total phosphorus (TP) contents also significantly decreased with decreasing depth of groundwater. RDA redundancy and Pearson correlation analysis showed that aboveground biomass, SWC, soil bulk density (SBD), total nitrogen (TN), and TP had the strongest response to the change in groundwater depth, and were the controlling factors affecting changes of SOC components in typical meadow communities in Napahai. Conclusion The mass fraction and vertical distribution of SOC components in typical meadows of Napahai wetland mainly depend on the change of plant aboveground biomass and soil physicochemical properties caused by different groundwater depths. Therefore, in the process of protecting typical meadow wetlands in Napahai, it is recommended to monitor the groundwater level to prevent the impact of low groundwater level from affecting the stability of wetland carbon pool. [Ch, 3 fig. 4 tab. 42 ref.] -
表 1 样地基本信息
Table 1. Basic information of the sampling sites
群落类型 纬度(N) 经度(E) 地下水埋深/cm 优势植物 盖度/% 土壤类型 疏花早熟禾群落(PP) 27°50′43.46″ 99°39′7.86″ −58.5±8.5 疏花早熟禾、牡蒿Artemisia japonica 90 草甸土 鼠曲草群落(GA) 27°50′43.46″ 99°38′34.60″ −112.0±6.8 鼠曲草、平车前 Plantago depressa 88 草甸土 云雾薹草群落(CN) 27°49′56.13″ 99°38′55.26″ −150.0±1.5 云雾薹草、车前P. asiatica 83 草甸土 表 2 纳帕海典型草甸群落地上生物量和多样性特征
Table 2. Characteristics of above-ground biomass and diversity in typical meadow community of Napahai
样地名称 地上生物量/(g·m−2) Shannon-Wiener多样性指数 Pielou均匀度指数 Margalef丰富度指数 Simpson优势度指数 疏花早熟禾群落 646.94±69.16 a 3.71±0.02 a 0.93±0.01a 13.11±0.38 a 0.92±0.02 a 鼠曲草群落 337.45±43.66 b 2.87±0.01 b 0.87±0.06 b 9.49±0.68 b 0.86±0.01 b 云雾薹草群落 229.58±1.87 c 1.58±0.30 c 0.57±0.09 c 5.19±0.39 c 0.62±0.07 c 说明:同列不同小写字母表示不同典型草甸群落多样性差异显著(P<0.05)。数值为平均值±标准误 表 3 纳帕海典型草甸群落土壤理化性质特征
Table 3. Characteristics of soil physicochemical properties of typical meadow communities of Napahai
植物群落 地下水位/cm 土层深度/cm 土壤含水量/% 容重/(g·cm−3) pH 全氮/(g·kg−1) 全磷/(g·kg−1) 全钾/(g·kg−1) 疏花早熟禾群落 −58.5 0~20 26.66±0.85 Aa 1.01±0.01 Cb 8.54±0.08 Aa 1.38±0.03 Ab 0.54±0.03 Aa 33.59±2.34 Ba 20~40 24.29±0.70 Ba 1.22±0.03 Ab 8.54±0.06 Aa 0.85±0.08 Ba 0.48±0.03 Ba 35.90±0.45 Aa 0~40 25.48±0.61 Aa 1.11±0.02 Bb 8.35±0.37 Aa 1.20±0.16 Ab 0.51±0.03 Aa 30.57±2.45 Ca 鼠曲草群落 −112.0 0~20 22.17±0.40 Ab 1.23±0.12 Aa 4.97±0.11 Ac 1.44±0.16 Ab 0.47±0.04 Ab 28.03±0.57 Ab 20~40 20.65±0.37 Cc 1.32±0.04 Aa 5.44±0.41 Ac 0.91±0.02 Ba 0.38±0.03 Bb 28.36±0.24 Ab 0~40 21.41±0.28 Bc 1.28±0.10 Aa 5.14±0.27 Ac 1.31±0.17 Ab 0.42±0.03 Ab 28.45±1.39 Aa 云雾薹草群落 −150.0 0~20 25.61±0.52 Aa 0.96±0.03 Cc 6.87±0.25 Ab 1.84±0.11 Aa 0.46±0.02 Ab 34.03±0.91 Aa 20~40 21.58±0.72 Bb 1.28±0.04 Aa 7.28±0.45 Ab 0.93±0.42 Ba 0.39±0.01 Cb 28.78±0.20 Cb 0~40 23.59±3.70 Aa 1.12±0.01 Bb 7.07±0.52 Ab 1.70±0.19 Aa 0.42±0.01 Bb 32.60±3.74 Ba 说明:不同大写字母表示同一典型草甸群落不同土层差异显著(P<0.05),不同小写字母表示不同典型草甸群落相同土层差异显著(P<0.05)。数值为平均值±标准误 表 4 土壤有机碳储量及碳组分质量分数与环境因子之间的相关系数
Table 4. Correlation coefficients between the soil organic carbon components and environment factors of soil
指标 Shannon-Wiener
指数Pielou
指数Margalef
指数Simpson
指数地上生
物量土壤含
水量容重 pH 全氮 全磷 全钾 总有机碳 0.718** 0.784** 0.664** 0.791** 0.612** 0.343* −0.596** −0.100 0.585** 0.259 0.265 微生物生物量碳 0.645** 0.654** 0.616** 0.649** 0.564** 0.290 −0.372* 0.144 0.339* 0.335* 0.057 易氧化有机碳 0.204 0.169 0.272 0.176 0.448** 0.129 −0.068 0.097 −0.116 0.086 0.137 颗粒有机碳 0.773** 0.767** 0.775** 0.765** 0.859** 0.620** −0.758** 0.172 0.482** 0.439** 0.370* 有机碳储量 0.457** 0.549** 0.402* 0.558** 0.409* 0.097 −0.256 −0.250 0.381* 0.065 0.112 说明:*P<0.05; **P<0.01 -
[1] 陈晓侠, 梁爱珍, 张晓平. 土壤团聚体固碳的研究方法[J]. 应用生态学报, 2012, 23(7): 1999 − 2006. CHEN Xiaoxia, LIANG Aizhen, ZHANG Xiaoping. Research methods of carbon sequestration by soil aggregates: a review [J]. Chinese Journal of Applied Ecology, 2012, 23(7): 1999 − 2006. [2] 陈雅文, 韩广轩, 蔡延江. 氮输入影响滨海湿地碳循环过程的模拟研究: 进展与展望[J]. 浙江农林大学学报, 2021, 38(5): 883 − 895. CHEN Yawen, HAN Guangxuan, CAI Yanjiang. Simulation research on the effects of nitrogen input on carbon cycle process in a coastal wetland: review and prospects [J]. Journal of Zhejiang A&F University, 2021, 38(5): 883 − 895. [3] 梁春玲. 洞庭湖湿地植物群落多样性及土壤有机碳储量研究[J]. 水土保持研究, 2020, 27(6): 66 − 71. LIANG Chunling. Study on plant community diversity and soil organic carbon storage in Dongting Lake wetland [J]. Research of Soil and Water Conservation, 2020, 27(6): 66 − 71. [4] 习盼, 董倩, 张亚楠, 等. 盐城滩涂湿地典型植物群落土壤活性有机碳组分分布特征[J]. 生态学杂志, 2020, 39(11): 3623 − 3632. XI Pan, DONG Qian, ZHANG Ya’ nan, et al. Distribution characteristics of active components in soil organic carbon across typical plant communities in Yancheng coastal wetlands [J]. Chinese Journal of Ecology, 2020, 39(11): 3623 − 3632. [5] 唐艳梅, 马维伟, 李广, 等. 尕海湿地退化演替过程中土壤有机氮组分的变化特征[J]. 应用生态学报, 2021, 32(11): 4077 − 4084. TANG Yanmei, MA Weiwei, LI Guang, et al. Variations of soil organic nitrogen fractions during degradation succession in the Gahai wetland, northwest China [J]. Chinese Journal of Applied Ecology, 2021, 32(11): 4077 − 4084. [6] 马维伟, 李广, 石万里, 等. 甘肃尕海湿地退化过程中植物生物量及物种多样性变化动态[J]. 草地学报, 2016, 24(5): 960 − 966. MA Weiwei, LI Guang, SHI Wangli, et al. Changes of plant biomass and species diversity in degradation process of Gahai wetland in Gansu Province [J]. Acta Agrestia Sinica, 2016, 24(5): 960 − 966. [7] 王经波, 郑利林, 郭宇菲, 等. 鄱阳湖湿地土壤有机碳空间分布及其影响因素[J]. 长江流域资源与环境, 2022, 31(4): 915 − 926. WANG Jingbo, ZHENG Lilin, GUO Yufei, et al. Spatial distribution of soil organic carbon and its influencing factors in Poyang Lake wetland [J]. Resources Environment in the Yangtze Basin, 2022, 31(4): 915 − 926. [8] 陈冠光. 疏勒河下游地下水埋深与土壤理化性质变化对植物群落的影响[D]. 兰州: 兰州大学, 2020. CHEN Guanguang. Effects of Changes in Groundwater Depth and Soil Physicochemical Properties on Plant Communities in the Lower Shule River[D]. Lanzhou: Lanzhou University, 2020. [9] HUPET F, VANCLOOSTER M. Intraseasonal dynamics of soil moisture variability within a small agricultural maize cropped field [J]. Journal of Hydrology, 2002, 261(1/4): 86 − 101. [10] 肖德荣, 田昆, 袁华, 等. 滇西北高原典型退化湿地纳帕海植物群落景观多样性[J]. 生态学杂志, 2007, 26(8): 1171 − 1176. XIAO Derong, TIAN Kun, YUAN Hua, et al. Land scape diversity of Napahai wetland plant community in northwest Yunnan of China [J]. Chinese Journal of Ecology, 2007, 26(8): 1171 − 1176. [11] 唐明艳, 杨永兴. 不同人为干扰下纳帕海湖滨湿地植被及土壤退化特征[J]. 生态学报, 2013, 33(20): 6681 − 6693. TANG Mingyan, YANG Yongxing. Analysis of vegetation and soil degradation characteristics under different human disturbance in lakeside wetland, Napahai [J]. Acta Ecologica Sinica, 2013, 33(20): 6681 − 6693. [12] 陆梅, 孙向阳, 田昆, 等. 纳帕海高原湿地不同退化阶段土壤真菌群落结构特征[J]. 北京林业大学学报, 2018, 40(3): 55 − 65. LU Mei, SUN Xiangyang, TIAN Kun, et al. Characteristics of soil fungal community structure at different degraded stages in Napahai Plateau wetland of northwestern China [J]. Journal of Beijing Forestry University, 2018, 40(3): 55 − 65. [13] 陈剑, 缪福俊, 杨文忠, 等. 海拔对纳帕海季节性湿地植被分布格局影响初探[J]. 湖泊科学, 2015, 27(3): 392 − 400. CHEN Jian, MIAO Fujun, YANG Wenzhong, et al. A preliminary study on impacts of the elevation on plants’ distribution patterns in seasonal wetland of Lake Napahai [J]. Journal of Lake Sciences, 2015, 27(3): 392 − 400. [14] 胡婵娟, 刘国华, 吴雅琼. 土壤微生物生物量及多样性测定方法评述[J]. 生态环境学报, 2011, 20(6/7): 1161 − 1167. HU Chanjuan, LIU Guohua, WU Yaqiong. A review of soil microbial biomass and diversity measurements [J]. Ecology &Environmental Sciences, 2011, 20(6/7): 1161 − 1167. [15] 卢涛, 马克明, 倪红伟, 等. 三江平原不同强度干扰下湿地植物群落的物种组成和多样性变化[J]. 生态学报, 2008, 28(5): 1893 − 1900. LU Tao, MA Keming, NI Hongwei, et al. Variation in species composition and diversity of wetland communities under different disturbance intensity in the Sanjiang Plain [J]. Acta Ecologica Sinica, 2008, 28(5): 1893 − 1900. [16] 鲁如坤. 土壤农业化学分析方法[M]. 北京: 中国农业科技出版社, 2000. LU Rukun. The Analysis Method of Soil Agricultural Chemistry[M]. Beijing: China Agricultural Science and Technology Press, 2000. [17] BLAIR G, LEFROY R, LISLE L. Soil carbon fractions based on their degree of oxidation, and the development of a carbon management index for agricultural systems [J]. Australian Journal of Agricultural Research, 1995, 46(7): 393 − 406. [18] 陈小梅, 刘菊秀, 邓琦, 等. 降水变率对森林土壤有机碳组分与分布格局的影响[J]. 应用生态学报, 2010, 21(5): 1210 − 1216. CHEN Xiaomei, LIU Juxiu, DENG Qi, et al. Effects of precipitation intensity on soil organic carbon fractions and their distribution under subtropical forests of south China [J]. Chinese Journal of Applied Ecology, 2010, 21(5): 1210 − 1216. [19] ELLERT B H, JANZEN H H, VANDENBYGAART A J, et al. Measuring Change in Soil Organic Carbon Storage[M]. Boca Raton: CRC Press, 2007: 25 − 38. [20] ESLAMDOUST J, SOHRABI H. Carbon storage in biomasslitter, and soil of different native and introduced fast-growing tree plantations in the South Caspian Sea [J]. Journal of Forestry Research, 2018, 29(2): 444 − 452. [21] 李宁云, 袁华, 田昆, 等. 滇西北纳帕海湿地景观格局变化及其对土壤碳库的影响[J]. 生态学报, 2011, 31(24): 7388 − 7396. LI Ningyun, YUAN Hua, TIAN Kun, et al. Landscape pattern change and its influence on soil carbon pool in Napahai wetland of northwestern Yunnan [J]. Acta Ecologica Sinica, 2011, 31(24): 7388 − 7396. [22] 吴江琪, 马维伟, 李广, 等. 尕海沼泽化草甸湿地不同地下水位土壤理化特征的比较分析[J]. 草地学报, 2018, 26(2): 341 − 347. WU Jiangqi, MA Weiwei, LI Guang, et al. Comparative analysis of physicochemical property of soil with different groundwater level in Gahai swamp meadow wetland [J]. Acta Agrestia Sinica, 2018, 26(2): 341 − 347. [23] MOCHE M, GUTKNECHT J, SCHULZ E, et al. Monthly dynamics of microbial community structure and their controlling factors in three floodplain soils [J]. Soil Biology and Biochemistry, 2015, 90: 169 − 178. [24] 许振, 左平, 王俊杰, 等. 6个时期盐城滨海湿地植物碳储量变化[J]. 湿地科学, 2014, 12(6): 709 − 713. XU Zhen, ZUO Ping, WANG Junjie, et al. Changes of vegetation carbon storage in Yancheng coastal wetlands for six periods [J]. Wetland Science, 2014, 12(6): 709 − 713. [25] 肖烨, 黄志刚, 武海涛, 等. 三江平原典型湿地类型土壤微生物特征与土壤养分的研究[J]. 环境科学, 2015, 36(5): 1842 − 1848. XIAO Ye, HUANG Zhigang, WU Haitao, et al. Soil microorganism characteristics and soil nutrients of different wetlands in Sanjinag Plain, northeast China [J]. Environmental Science, 2015, 36(5): 1842 − 1848. [26] KUZYAKOV Y, SCHNECKENBERGER K. Review of estimation of plant rhizodeposition and their contribution to soil organic matter formation [J]. Archives of Agronomy &Soil Science, 2004, 50: 115 − 132. [27] 王泉泉, 王行, 张卫国, 等. 滇西北高原湿地景观变化与人为、自然因子的相关性[J]. 生态学报, 2019, 39(2): 726 − 738. WANG Quanquan, WANG Hang, ZHANG Weiguo, et al. The correlations between wetland landscape and social-natural factors on northwestern Yunnan Plateau [J]. Acta Ecologica Sinica, 2019, 39(2): 726 − 738. [28] GIORGI F, WIDMANN M. Climate change 2001: the scientific basis (IPCC WG1 third assessment report) [J]. Netherlands Journal of Geosciences, 2002, 87(3): 197 − 199. [29] 赖建东, 田昆, 郭雪莲, 等. 纳帕海湿地土壤有机碳和微生物生物量碳研究[J]. 湿地科学, 2014, 12(1): 49 − 54. LAI Jiandong, TIAN Kun, GUO Xuelian, et al. Organic carbon and microbial biomass carbon in soil in Napahai wetlands [J]. Wetland Science, 2014, 12(1): 49 − 54. [30] 邹锋, 李金前, 韩丽丽, 等. 鄱阳湖湿地土壤微生物活性对年际水文变化的响应[J]. 湖泊科学, 2019, 31(2): 551 − 559. ZOU Feng, LI Jinqian, HAN Lili, et al. Response of soil microbial functional traits to annually hydrological changes in Lake Poyang wetlands [J]. Journal of Lake Sciences, 2019, 31(2): 551 − 559. [31] BRUNNER I, HERZOG C, DAWES M A, et al. How tree roots respond to drought[J/OL]. Frontiers in Plant Science, 2015, 6: 547[2022-05-05]. doi: 10.3389/fpls.2015.00547. [32] 刘晓君, 高盼, 潘俊, 等. 红壤区植被恢复团聚体POC变化归因分析[J]. 水土保持学报, 2021, 35(2): 217 − 224, 234. LIU Xiaojun, GAO Pan, PAN Jun, et al. Factor analysis of particulate organic carbon changes in soil aggregates with vegetation resstoration in degraded red soil regions [J]. Journal Soil and Water Conservation, 2021, 35(2): 217 − 224, 234. [33] 苏天燕, 刘文杰, 杨秋, 等. 土壤碳循环对地下水位的响应研究进展[J]. 中国沙漠, 2020, 40(5): 180 − 189. SU Tianyan, LIU Wenjie, YANG Qiu, et al. Review on response of soil carbon cycle to groundwater level change [J]. Journal of Desert Research, 2020, 40(5): 180 − 189. [34] 李菡, 袁红, 宋洪福, 等. 不同利用方式土壤有机碳及其组分研究进展[J]. 江西农业学报, 2020, 32(8): 57 − 63. LI Han, YUAN Hong, SONG Hongfu, et al. Research advance in soil organic carbon and its components by different utilization modes [J]. Acta Agricultrae Jiangxi, 2020, 32(8): 57 − 63. [35] 孟妍君, 秦鹏. 珠江三角洲滨海湿地土壤微生物群落多样性与养分的耦合关系[J]. 水土保持研究, 2020, 27(6): 77 − 84. MENG Yanjun, QIN Peng. Coupling relationship between microbial community diversity and soil nutrients in different wetlands in coastal area of Pearl Rive Delta [J]. Research of Soil and Water Conservation, 2020, 27(6): 77 − 84. [36] 李丽, 高俊琴, 雷光春, 等. 若尔盖不同地下水位泥炭湿地土壤有机碳和全氮分布规律[J]. 生态学杂志, 2011, 30(11): 2449 − 2455. LI Li, GAO Junqin, LEI Guangchun, et al. Distribution patterns of soil organic carbon and total nitrogen in Zoige peat land with different ground water table [J]. Chinese Journal of Ecology, 2011, 30(11): 2449 − 2455. [37] 朱丽, 徐贵青, 李彦, 等. 物种多样性及生物量与地下水位的关系——以海流兔河流域为例[J]. 生态学报, 2017, 37(6): 1912 − 1921. ZHU Li, XU Guiqing, LI Yan, et al. Relationships among plant species diversity, biomass, and the groundwater table in the Hailiutu River basin [J]. Acta Ecologica Sinica, 2017, 37(6): 1912 − 1921. [38] PIERRET A, MAEGHT J, CLEMENT C, et al. Understanding deep roots and their functions in ecosystems: an advocacy for more unconventional research [J]. Annals of Botany, 2016, 118(4): 621 − 635. [39] 脱云飞, 沈方圆, 杨翠萍, 等. 滇中高原降雨对不同地类土壤磷素、有机质和pH变化的影响[J]. 生态环境学报, 2020, 29(5): 942 − 950. TUO Yunfei, SHEN Fangyuan, YANG Cuiping, et al. Effects of rainfall on phosphorus, organic matter and pH in different land use types in middle Yunnan Plateau [J]. Ecology and Environment Science, 2020, 29(5): 942 − 950. [40] 尹鹏松. 青藏高原高寒沼泽草甸土壤酶活性与有机碳分布特征对增温与施氮的响应[D]. 兰州: 兰州交通大学, 2020. YIN Pengsong. Responses of Soil Enzyme Activity and Organic Carbon Distribution Characteristics to Warming and Nitrogen Application in Alpine Swamp Meadow on the Tibetan Plateau[D]. Lanzhou: Lanzhou Jiaotong University, 2020. [41] 曾嘉, 陈槐, 刘建亮, 等. 青藏高原泥炭地水位下降引起土壤酚类物质及植被生物量的增加促进土壤碳积累[J]. 生态学报, 2022, 42(2): 1 − 10. ZENG Jia, CHEN Huai, LIU Jianliang, et al. The decrease of peatland water table on the Qinghai-Tibet Plateau caused the increase of soil phenolic substances and vegetation biomass which promated the accumulation of soil carbon [J]. Acta Ecologica Sinica, 2022, 42(2): 1 − 10. [42] 徐耀文, 姜仲茂, 武锋, 等. 翠亨湿地无瓣海桑人工林土壤有机碳分布特征及与土壤理化指标相关性[J]. 林业科学研究, 2020, 33(1): 62 − 68. XU Yaowen, JIANG Zhongmao, WU Feng, et al. Soil organic carbon distribution and its correlation with soil physical and chemical indexes of Sonneratia apetala plantation at Cuiheng wetland [J]. Forest Research, 2020, 33(1): 62 − 68. -

-
链接本文:
https://zlxb.zafu.edu.cn/article/doi/10.11833/j.issn.2095-0756.20220377


 下载:
下载:


