


-
立地质量评价一直是森林可持续经营的一个主要议题。生产实践中,评价立地质量、预测林分生产力对于树种选择、林分经营决策至关重要[1]。同龄林中,立地指数早已作为立地质量评价的一个指标得到全球公认,且作为立地指数基本产量表的关键变量得以应用[2-3]。在小范围、局域尺度开展立地质量评价时,国内外学者们常采用导向曲线法研制立地指数表或者立地指数曲线,用以评价林木生长状况以及林分生产力[4-7]。西南桦Betula alnoides是中国热带、南亚热带地区的一个珍贵乡土用材树种,生长迅速,适应性强,木材纹理细致,质地均匀,密度适中,不翘不裂,加工性能优良,已广泛应用于木地板和家具制作以及房屋装饰[8-9],树皮提取物具有消炎、减肥及降血脂作用[10-11]。近年来,中国西南桦迅猛发展,云南、广西、贵州、广东、福建等地均有栽培,其人工林面积已逾15万hm2[9]。然而,在西南桦人工林快速发展过程中,局部地区因未能适地适树,盲目造林,出现林木生长不良、林分生产力低下等现象[12],严重影响西南桦人工林规模发展和可持续经营。广西大青山是中国西南桦栽培历史最早的地区,自20世纪70年代末即开始西南桦驯化栽培研究,并逐步推广应用,具有从幼龄至成熟龄各个阶段的西南桦林分。西南桦立地指数研究是掌握其立地生产力的基础,对其人工林可持续经营具有重要意义。然而,至今尚未见有关西南桦人工林立地指数表的报道。因此,本研究以广西大青山西南桦人工林为对象,基于样地调查与优势木树干解析,应用导向曲线法编制立地指数表,为该地区及类似地区西南桦人工林立地质量评价、生产力预估提供科学依据。
HTML
-
研究地位于广西大青山林区中国林业科学研究院热带林业实验中心(21°57′~22°19′N,106°39′~106°59′E),属南亚热带季风气候,年均气温为20~22 ℃,年均降水量约1 500 mm,主要集中在4-10月,年均日照1 260 h。研究地海拔为130~1 045 m,地形地貌复杂,自然条件优越,是开展热带南亚热带地区珍贵阔叶树种试验示范的理想场所。
-
考虑西南桦林分的立地因子、林分密度等特征,于热带林业实验中心的伏波、青山和白云实验场设置49块临时样地,每样地面积为600 m2。对各样地进行常规立地调查和生长观测,每样地选取5株干形完整、树高最大的树作为优势木,计算优势木平均树高为优势高,并选取1株树高最接近优势高的优势木进行树干解析。
对解析数据按年龄进行整理(表 1),共有825对树高-年龄数据,计算平均高及标准差。因有些样木存在不规则生长时期,剔除超出平均值±3倍标准差范围的异常数据,对剩余的816对数据重新整理、统计,用于编制立地指数表[13]。
年龄/a 样本数/个 平均优势高/m 最小值/m 最大值/m 标准差 1 46* 1.81 0.78 3.35 0.77 2 46* 3.26 1.50 5.88 1.08 3 47* 5.07 1.87 8.72 1.43 4 47* 6.92 3.21 11.70 1.67 5 48* 8.68 4.43 14.23 1.93 6 49 10.35 5.92 15.84 2.07 7 49 11.87 8.18 17.65 2.09 8 49 13.14 9.79 17.52 2.15 9 49 14.26 10.87 18.92 2.28 10 49 15.33 11.34 20.80 2.37 11 48 16.21 12.29 22.27 2.36 12 47 17.21 13.07 24.14 2.49 13 45 18.12 13.53 25.49 2.64 14 40 18.94 14.50 26.95 2.75 15 31 19.13 15.19 27.20 2.68 16 28 19.33 15.78 24.38 2.19 17 21 20.00 16.20 25.25 2.48 18 21 20.42 16.74 25.65 2.45 19 18 20.83 17.20 26.00 2.61 20 10 21.13 18.77 25.02 2.02 21 10 21.46 19.01 25.06 2.03 22 7 21.79 19.06 25.15 2.33 23 4 22.41 19.24 25.47 3.43 24 4 22.84 19.68 26.38 3.04 25 4 22.98 20.32 26.90 3.47 26 3 23.33 20.60 26.30 3.10 27 3 23.54 20.70 26.75 3.33 28 2 25.01 23.02 27.01 2.82 说明:*优势木在树干解析过程中1~5 a的部分数据缺失 Table 1. Data description of stem analysis for 49 dominant trees of Betula alnoides
-
采用常用的9个模型对树高-年龄数据进行拟合,应用决定系数(R2),平均绝对误差(EAMR),平均相对误差(ERMR)和均方根误差(ERMSE)等4个指标对各模型拟合质量进行评价[14-15],选择最优曲线作为导向曲线。计算上述统计指标时,将对数双曲线式和对数曲线式方程进行变换,保证所有模型的因变量统一为树高(H)。
其中:$ H_{i}, \hat{H}_{i}, \overline{H}$分别表示树高的第i个观测值、估计值、平均观测值;n为观测值数目;p为模型参数的数目。
-
通过优势高平均生长量和连年生长量变化趋势以及优势高龄阶变动系数分析确定西南桦人工林基准年龄[5]。根据基准年龄时的优势高变幅确定指数级距。应用标准差调整法[13]编制立地指数表。
-
应用落点检验[16]、拟合显著性和预测精度检验[16-17]对所编立地指数表的精确性和适用性进行检验。运用Excel和R软件(3.3.2版)进行数据整理分析。
2.1. 样地调查及解析木数据整理
2.2. 导向曲线拟合与选择
2.3. 基准年龄与指数级距确定
2.4. 立地指数表检验
-
由表 2可知:9个方程中,对数曲线式的R2最小,其EAMR,ERMR和ERMSE均最大,说明其拟合效果最差;其他8个方程中,Richards和Weibull方程表现几乎一致,以Richards方程的R2最大,EAMR,ERMR和ERMSE最小,拟合效果最好。因此,选择Richards方程作为最优导向曲线方程。其方程表达式为:H=24.25(1-e-0.118t)1.278。其中:H为优势高,t为年龄。
方程 表达式 a b c R2 EAMR ERMR ERMSE 对数双曲线式 lgH=a+b/t 1.286 7 -1.267 1 0.886 5 1.68 0.19 2.14 对数曲线式 lgH=a+blgt 0.281 8 0.862 9 0.869 9 1.74 0.23 2.29 广义单分子式 lgH=a+bexp(-ct) 25.585 8 -26.809 9 0.094 1 0.896 9 1.54 0.15 2.04 Richards H=a[1-exp(-bt)]c 24.253 3 0.118 5 1.278 0 0.897 6 1.53 0.14 2.03 Weibull H=a[1-exp(-bt)c] 23.748 8 0.068 2 1.175 8 0.897 5 1.53 0.15 2.04 Korf H=aexp(-b/tc) 45.608 5 4.007 5 0.559 7 0.895 7 1.56 0.16 2.06 Logistic H=a/[1+exp(b-ct)] 21.116 1 1.998 7 0.300 3 0.886 2 1.65 0.21 2.15 Gompertz H=aexp[-bexp(-ct)] 22.161 8 2.670 6 0.198 8 0.894 4 1.57 0.17 2.07 Schumacher H=aexp(-b/t) 27.757 8 5.748 0 0.886 5 1.68 0.19 2.14 说明:H优势高,t年龄;a,b和c为模型参数;R2,EAMR,ERMR和ERMSE分别为决定系数、平均绝对误差、平均相对误差以及均方根误差 Table 2. Nine equations and their fitting results
-
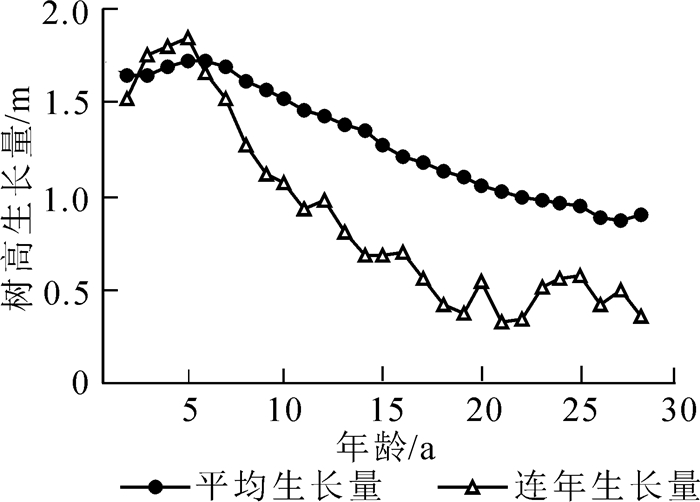
由图 1可知:5 a左右时,优势高连年和平均生长量达到高峰,6 a时两者相交,15 a后优势高连年生长量大致趋于稳定;优势高变异系数的变动幅度在15 a后也基本稳定。因此将西南桦人工林基准年龄确定为15 a。

Figure 1. Curve of dominant height growth in Betula alnoides plantations at Daqing Mountain, Guangxi
中国多以1.0~2.0 m作为指数级距[13]。以15 a作为基准年龄时,优势高为15.2~25.8 m,其绝对变幅为10.6 m,西南桦较为速生,确定其指数级距为2.0 m。可划分为6个指数级(16.0,18.0,20.0,22.0,24.0和26.0 m)。
-
应用标准差调整法编制西南桦人工林立地指数表,结果见表 3。森林经营中,调查获取林分优势高及年龄,可查此表获得所属立地指数级,进行立地质量评价。
年龄/a 立地指数/m 16.0 18.0 20.0 22.0 24.0 26.0 3 2.9~4.0 4.0~5.1 5.1~6.3 6.3~7.4 7.4~8.5 8.5~9.7 4 4.4~5.7 5.7~6.9 6.9~8.2 8.2~9.4 9.4~10.7 10.7~11.9 5 5.9~7.3 7.3~8.6 8.6~10.0 10.0~11.4 11.4~12.7 12.7~14.1 6 7.2~8.7 8.7~10.1 10.1~11.6 11.6~13.0 13.0~14.5 14.5~15.9 7 8.6~10.1 10.1~11.6 11.6~13.2 13.2~14.7 14.7~16.2 16.2~17.7 8 9.7~11.3 11.3~12.9 12.9~14.5 14.5~16.1 16.1~17.7 17.7~19.3 9 10.7~12.3 12.3~14.0 14.0~15.7 15.7~17.4 17.4~19.0 19.0~20.7 10 11.7~13.4 13.4~15.1 15.1~16.8 16.8~18.6 18.6~20.3 20.3~22.0 11 12.5~14.3 14.3~16.1 16.1~17.9 17.9~19.7 19.7~21.5 21.5~23.3 12 13.2~15.1 15.1~16.9 16.9~18.8 18.8~20.6 20.6~22.5 22.5~24.3 13 13.9~15.8 15.8~17.7 17.7~19.6 19.6~21.5 21.5~23.4 23.4~25.3 14 14.5~16.5 16.5~18.4 18.4~20.4 20.4~22.3 22.3~24.3 24.3~26.2 15 15.0~17.0 17.0~19.0 19.0~21.0 21.0~23.0 23.0~25.0 25.0~27.0 16 15.5~17.5 17.5~19.6 19.6~21.6 21.6~23.7 23.7~25.7 25.7~27.8 17 15.9~18.0 18.0~20.1 20.1~22.2 22.2~24.3 24.3~26.4 26.4~28.5 18 16.2~18.4 18.4~20.5 20.5~22.6 22.6~24.8 24.8~26.9 26.9~29.1 19 16.5~18.7 18.7~20.9 20.9~23.1 23.1~25.3 25.3~27.4 27.4~29.6 20 16.9~19.1 19.1~21.3 21.3~23.5 23.5~25.7 25.7~28.0 28.0~30.2 21 17.1~19.3 19.3~21.6 21.6~23.9 23.9~26.1 26.1~28.4 28.4~30.6 22 17.3~19.6 19.6~21.9 21.9~24.2 24.2~26.5 26.5~28.8 28.8~31.0 23 17.4~19.8 19.8~22.1 22.1~24.4 24.4~26.7 26.7~29.1 29.1~31.4 24 17.7~20.0 20.0~22.4 22.4~24.7 24.7~27.1 27.1~29.5 29.5~31.8 25 17.8~20.2 20.2~22.6 22.6~25.0 25.0~27.4 27.4~29.8 29.8~32.2 26 17.8~20.3 20.3~22.7 22.7~25.1 25.1~27.5 27.5~30.0 30.0~32.4 27 17.9~20.4 20.4~22.9 22.9~25.3 25.3~27.8 27.8~30.3 30.3~32.8 28 18.0~20.5 20.5~23.0 23.0~25.5 25.5~28.0 28.0~30.5 30.5~33.0 说明:基准年龄为15 a,级距为20 m;表中数据为上限排外 Table 3. Site index table of Betula alnoides at Daqing Mountain, Guangxi
-
将编表所用49株优势木树高值作散点图,绘制于立地指数曲线簇上(图 2)。由图 2可以看出:3个点落在立地指数曲线簇外,即所编表能解释93.8%的优势木的生长状况,落点检验合格。

Figure 2. Test of falling point for site index curves of Betula alnoides plantations
-
利用卡方(χ2)检验进行显著性检验。本研究中立地指数定为16~26,从建模数据中随机抽取3株年龄大于基准年龄的解析木,其立地指数分别为16,20和24 m,χ2计算结果见表 4。查χ2临界值表分别为30.14,22.36和30.14。通过对比分析可知:其χ2值远小于其相应临界值,说明经标准差调整后立地指数曲线与优势木树高生长趋势之间无显著差异。
年龄/a m=16.0 m=20.0 m=24.0 Si Hi16 Ho16 Hi20 Ho20 Hi24 Ho24 3 5.6 19.8 4.7 18.2 6.7 21.7 1.36 4 7.7 20.3 6.4 18.1 8.7 21.9 1.55 5 9.0 19.5 7.8 17.8 11.0 22.4 1.05 6 10.2 19.1 9.2 17.8 14.2 24.7 1.19 7 11.6 19.0 10.4 17.3 15.6 24.3 1.10 8 12.5 18.5 11.8 17.6 16.9 24.0 0.74 9 13.0 17.8 13.2 18.0 18.1 23.9 0.50 10 13.2 16.8 14.2 17.9 19.4 23.9 0.82 11 13.7 16.3 15.4 18.2 20.3 23.6 0.97 12 14.6 16.5 16.5 18.5 21.2 23.6 0.87 13 15.3 16.5 17.4 18.7 21.7 23.2 0.84 14 15.7 16.3 18.3 18.9 22.6 23.3 0.99 15 16.6 16.6 19.3 19.3 23.2 23.2 0.95 16 17.2 16.7 19.9 19.3 23.8 23.1 0.90 17 18.3 17.3 24.5 23.2 0.43 18 19.3 17.9 25.0 23.2 0.07 19 20.0 18.2 25.0 22.8 0.30 20 21.1 18.8 25.0 22.4 0.81 21 21.2 18.7 25.1 22.1 0.91 22 21.3 18.5 25.1 21.8 1.01 Hom 17.9 18.3 23.1 χ2 1.71 0.26 0.59 - Sz 1.27 0.61 0.85 - 说明:Him为第i龄阶第m指数级的树高;Hom为基准年龄时第m指数级的树高值(即立地指数);Si为立地指数估计误差 Table 4. Significance and prediction accuracy of site index table
-
不同年龄的立地指数估计误差(Si)和不同立地指数级的估计误差(Sz)计算结果见表 4。由表 4可知:各年龄的估计误差为0.07~1.55 m。3~7 a的估计误差在1.00 m以上,以3和4 a的估计误差为最大;而大于7 a后,各年龄的估计误差基本上小于1.00 m,表明此立地指数表对较大年龄的预报精度高。各立地指数级之间比较,立地指数级为20.0和24.0时估计误差均小于1.00 m,而立地指数级为16.0时略大于1.00 m。由此可见,所编立地指数表整体上预报精度较高。
3.1. 导向曲线筛选
3.2. 基准年龄及指数级距
3.3. 立地指数表
3.4. 立地指数表检验
3.4.1. 落点检验

3.4.2. 显著性检验
3.4.3. 预报精度检验
-
利用导向曲线法编制立地指数表,曲线的选取至关重要。导向曲线既要满足对数据的高质量拟合,又要符合树种的优势高生长规律。大多数树种的高生长过程为慢—快—慢,表现为“S”形;速生树种的高生长常表现为早期生长快,此后生长逐渐减缓并趋于生长停止,即“快—慢”的“肩形”曲线。学者们常用Richards,Weibull等具上渐近线的方程拟合树高生长过程[18-19],且Richards方程具有很强的可塑性,通过引入形状参数c而使Richards方程对树木生长具有广泛的适应能力。西南桦为速生珍贵树种,本研究中Richards和Weibull方程的拟合效果均较好,以Richards方程表现略优,最终选择Richards方程作为导向曲线方程。
西南桦为喜阳树种,大量营林实践及科学研究证实,林龄5~8 a内树高生长迅速且波动性大,而林分优势高的平均和连年生长量则在此后均开始下降且波动性逐渐变小[20-21]。本研究中,6 a左右时西南桦人工林优势高生长达最大值,此后逐渐下降(图 1),其波动性也开始减弱,不同年龄时方程拟合误差亦表现出随着树高生长波动性减弱而降低的趋势,因而7 a以上林龄的立地指数估计误差小于7 a内各年龄。
数据源同样会影响模型拟合质量的高低[22],应用各龄阶平均年龄和平均优势高进行模型拟合,虽然能够显著提高模型的决定系数,但是极大地降低了模型的自由度[6]。本研究针对西南桦树高生长快的生物学特性,以1 a为一个龄阶,用解析木原始数据进行模型拟合,提高了模型自由度,其决定系数约0.90。当然,应用林分优势木的解析数据编表常会造成某些年龄阶段优势高生长的有偏估计,主要是由于林分生长是一个动态过程,临时样地中选取的优势木很难保证其真正一直处于林分优势木地位[23],从本研究中西南桦优势高生长的波动性规律亦可见一斑。
-
本研究以广西大青山林区西南桦人工林为对象,通过样地调查选取49株平均优势木进行树干解析,获得816对优势高-年龄数据,应用9个常见数学模型进行拟合,筛选出Richards方程作为导向曲线。依据优势高连年生长量和各年龄优势高变异系数的变化趋势,确定西南桦基准年龄为15 a;根据15 a时优势高变动幅度确定以2.0 m为指数级距;应用标准差调整法编制了立地指数表。拟合显著性和预报精度检验表明:立地指数表所反映的优势高生长过程与实际的优势高生长曲线一致,所编立地指数表预报精度较高,尤其是7 a以上林分的预测误差小于1.00 m,此表可用于广西大青山及类似地区西南桦人工林立地质量评价和生长潜力预估。
 DownLoad: