Volume 40 Issue 3
May  2023
Turn off MathJax
Article Contents

ZHANG Shiwen, LI Chengrong, WANG Yan, WU Yang. Evaluation and evolution characteristics of ecological quality in Yunnan based on long-time series satellite remote sensing[J]. Journal of Zhejiang A&F University, 2023, 40(3): 579-588. doi: 10.11833/j.issn.2095-0756.20220439
Citation: ZHANG Shiwen, LI Chengrong, WANG Yan, WU Yang. Evaluation and evolution characteristics of ecological quality in Yunnan based on long-time series satellite remote sensing[J]. Journal of Zhejiang A&F University, 2023, 40(3): 579-588. doi: 10.11833/j.issn.2095-0756.20220439

Evaluation and evolution characteristics of ecological quality in Yunnan based on long-time series satellite remote sensing

doi: 10.11833/j.issn.2095-0756.20220439
  • Received Date: 2022-07-04
  • Rev Recd Date: 2022-12-25
  • Available Online: 2023-05-22
  • Publish Date: 2023-05-20
  •   Objective  This study, with an analysis of the changes of ecological quality in Yunnan Province since the 1990s, is aimed to provide support for the further protection, restoration and promotion of ecological security barriers in Southwest China.   Method  Remote Sensing based Ecological Index (IRSEI) and spatial auto-correlation analysis were employed to study the regularities and characteristics of ecological quality from two dimensions (time and space).   Result  (1) In terms of time scale, the overall change of IRSEI in Yunnan Province from 1990 to 2020 is featured with the “W” type, showing a trend of first decreasing, then decreasing after a slight rise, and continuously increasing finally, falling to the lowest level twice in 2000 and 2010 with a general decrease of 0.038 in 30 years and an overall slope of linear fitting of −0.008. (2) In terms of spatial scale, the overall variation of the seven regions’ IRSEI in Yunnan Province is relatively small in 1995 and 2005, with generally stable and minor variation grades but a relatively large fluctuation in 2000 and 2010 and the volatility of Western and Northwestern Yunnan where the coefficient of variation is 0.115 and 0.171 respectively is larger than that of other regions in 1990. (3) At the county scale, the spatial auto-correlation degree of IRSEI in Yunnan Province from 1990 to 2020 shows a tendency of decreasing and gradually slowing down. At the same time, high-high cluster shifts from Northeastern, Southeastern and Southern Yunnan to Western, Northwestern and Southwestern Yunnan, while low-low cluster shifts to Northeastern, Southeastern, Southern and Central Yunnan, especially where rocky desertification is distributed.   Conclusion  The overall ecological quality of Yunnan Province enjoys a gradual improvement, especially after 2010, of which more attention should be paid to the impact of karst rocky desertification and meteorological disaster on the ecological quality. [Ch, 4 fig. 1 tab. 39 ref.]
  • [1] RAN Jiaxuan, QI Yujiao.  Height-diameter model of Pinus massoniana and Schima superba mixed forest in central Guizhou Province . Journal of Zhejiang A&F University, 2024, 41(2): 343-352. doi: 10.11833/j.issn.2095-0756.20230363
    [2] CHEN Jin, YOU Weibin, HE Dongjin, HU Xisheng.  Supply and demand relationship and its spatial heterogeneity of urban parks in downtown area of Fuzhou . Journal of Zhejiang A&F University, 2023, 40(6): 1300-1310. doi: 10.11833/j.issn.2095-0756.20230188
    [3] DENG Zhuo, LI Wenjing, ZHANG Yufang, DONG Ye.  Spatio-temporal evolution of ecological security pattern and its influencing factors in Tianshan-Pamir region . Journal of Zhejiang A&F University, 2023, 40(2): 398-406. doi: 10.11833/j.issn.2095-0756.20220458
    [4] PAN Ting, WANG Yixiang, LIU Xianzhao, XU Chengli, LIU Zhijun.  Land use change and its impact on ecological quality in Xiong’an New Area . Journal of Zhejiang A&F University, 2023, 40(5): 1102-1110. doi: 10.11833/j.issn.2095-0756.20220596
    [5] CHEN Qi, ZHANG Chao, TIAN Xiangyun, SHI Xiaorong, ZHANG Yuwei, WANG Yan.  Spatio-temporal evolution process of rocky desertification in Yunnan Province from 2000 to 2020 . Journal of Zhejiang A&F University, 2023, 40(2): 417-426. doi: 10.11833/j.issn.2095-0756.20210806
    [6] WANG Lu, LI Lele, LAI Mengxia, DU Changxia, FAN Huaifu.  Research progress on the causes of spatial heterogeneity of soil salinity and its effects on plants’ growth . Journal of Zhejiang A&F University, 2022, 39(6): 1369-1377. doi: 10.11833/j.issn.2095-0756.20220155
    [7] XIE Linfeng, LING Xiaoxiao, HUANG Shengyan, GAO Haozhan, WU Jiasen, CHEN Junhui, HUANG Jianqin, QIN Hua.  Spatial distribution characteristics of soil hydrolase activities and soil fertility evaluation of Carya cathayensis forests in Lin’an District . Journal of Zhejiang A&F University, 2022, 39(3): 625-634. doi: 10.11833/j.issn.2095-0756.20210417
    [8] WANG Tao, XIAO Caixia, LIU Jiao, LU Xin.  Dynamic evolution and landscape ecological risks assessment of Qilu Lake in Yunnan Plateau . Journal of Zhejiang A&F University, 2020, 37(1): 9-17. doi: 10.11833/j.issn.2095-0756.2020.01.002
    [9] MA Bingqian, XU Chengyang, LIU Jiang, CHANG Cheng, ZHAO Kai, KONG Xiangqi, LONG Jiayi.  Visual heterogeneity and visual landscape quality of urban forests as an architectural backdrop . Journal of Zhejiang A&F University, 2019, 36(2): 366-374. doi: 10.11833/j.issn.2095-0756.2019.02.019
    [10] LIU Peng, WANG Yan, LIU Zongbin, GUO Yujing, ZHANG Zixia, LI Xiangwang, YANG Bo.  Distribution and division of stony desertification on county scale . Journal of Zhejiang A&F University, 2019, 36(5): 965-973. doi: 10.11833/j.issn.2095-0756.2019.05.016
    [11] TANG Xu, ZHENG Jie, FENG Yan, LI Yankun, WANG Shijun, ZHANG Dahong.  County-level forest ecological security evaluation and spatial analysis in Yunnan Province . Journal of Zhejiang A&F University, 2018, 35(4): 684-694. doi: 10.11833/j.issn.2095-0756.2018.04.014
    [12] TANG Sijia, TANG Mengping, ZHAO Saisai, DU Xiufang, SHEN Qianyong, PANG Chunmei.  Competitive spatial patterns for Moso bamboo on Mount Tianmu . Journal of Zhejiang A&F University, 2018, 35(2): 199-208. doi: 10.11833/j.issn.2095-0756.2018.02.002
    [13] LIANG Licheng, YU Shuquan, ZHANG Chao, QIAN Li, QI Peng.  Spatial distribution and ecological risk assessment of heavy metals in Yongkang City . Journal of Zhejiang A&F University, 2017, 34(6): 972-982. doi: 10.11833/j.issn.2095-0756.2017.06.002
    [14] WEN Guojing, LIU Yungen, WANG Yan, HOU Lei, WANG Yanxia, GUO Yujing.  Temporal and spatial evolution of landscape patterns and ecological risk in the Puzhehei Lake basin . Journal of Zhejiang A&F University, 2017, 34(6): 1095-1103. doi: 10.11833/j.issn.2095-0756.2017.06.018
    [15] ZHANG Yanru, LIANG Lizhuang, NIU Shukui, HAN Hairong.  Ecological landscape quality of Taiyue Mountain in Shanxi . Journal of Zhejiang A&F University, 2016, 33(4): 599-604. doi: 10.11833/j.issn.2095-0756.2016.04.007
    [16] GUO Hanru, ZHANG Maozhen, XU Lihua, YUAN Zhenhua, CHEN Tiange.  Geographically weighted regression based on estimation of regional forest carbon storage . Journal of Zhejiang A&F University, 2015, 32(4): 497-508. doi: 10.11833/j.issn.2095-0756.2015.04.002
    [17] DU Hua-qiang, TANG Meng-ping, CUI Rui-rui.  Spatial heterogeneity of soil nutrients in an evergreen broadleaved forest of Mount Tianmu,Zhejiang . Journal of Zhejiang A&F University, 2011, 28(4): 562-568. doi: 10.11833/j.issn.2095-0756.2011.04.007
    [18] ZHAO Jing.  Status and strategic choices of forestry human capital development in Yunnan Province . Journal of Zhejiang A&F University, 2004, 21(3): 313-318.
    [19] JIANG Wen-wei, LIU Tong, DING Li-xia, WEN Guo-sheng, ZHANG Wan-rong, ZHONG Tai-lin.  Progress in spatial heterogeneity research in landscape ecology . Journal of Zhejiang A&F University, 2003, 20(3): 311-314.
    [20] QIAN Zhou-xing, ZHOU Wen-bao.  Three new species of Mecoptera from Yunnan . Journal of Zhejiang A&F University, 2001, 18(3): 297-300.
  • [1]
    LIU Yuqin. Evaluation and Analysis of Ecological Environment Quality in Harbin Based on RS and GIS [D]. Harbin: Harbin Normal University, 2021.
    [2]
    ZHENG Yong. Eco-Environment Index Extraction and Change Analysis Based on the TM Data [D]. Nanjing: Nanjing Forestry University, 2014.
    [3]
    XU Hanqiu. A remote sensing index for assessment of regional ecological changes [J]. China Environmental Science, 2013, 33(5): 889 − 897.
    [4]
    WU Keren, GAO Qi, WANG Ranghui, et al. Evaluation of ecological environment quality in Shijiazhuang based on RSEI model [J]. Progress in Geophysics, 2021, 36(3): 968 − 976.
    [5]
    YANG Jiangyan, WU Tian, PAN Xiaoyan, et al. Ecological quality assessment of Xiongan new area based on remote sensing ecological index [J]. Chinese Journal of Applied Ecology, 2019, 30(1): 277 − 284.
    [6]
    LIU Zhicai, XU Hanqiu, LI Le, et al. Ecological change in the Hangzhou area using the remote sensing based ecological index [J]. Journal of Basic Science and Engineering, 2015, 23(4): 728 − 739.
    [7]
    REN Yanni, ZHOU Tinggang, LI Hongzhong, et al. Research on the urban ecological environment pattern in the main urban area of Chongqing based on remote sensing and POI data [J]. Progress in Geophysics, 2021, 36(2): 766 − 778.
    [8]
    Pariha Helili, ZAN Mei, Alimjan Kasim. Remote sensing evaluation of ecological environment in Urumqi City and analysis of driving factors [J]. Arid Zone Research, 2021, 38(5): 1484 − 1496.
    [9]
    LI Qingyun, YANG Yongqiang, WANG Zhenxi, et al. Dynamic change analysis of remote sensing ecological index in Akst based on TM data analysis [J]. Southwest China Journal of Agricultural Sciences, 2019, 32(7): 1646 − 1651.
    [10]
    HU Xisheng, XU Hanqiu. A new remote sensing index for assessing the spatial heterogeneity in urban ecological quality: a case from Fuzhou City, China [J]. Ecological Indicators, 2018, 89: 11 − 21.
    [11]
    NONG Lanping, WANG Jinliang. Dynamic monitoring of ecological environment quality in Kunming based on RSEI model [J]. Chinese Journal of Ecology, 2020, 39(6): 2042 − 2050.
    [12]
    JIANG Chaoliang, WU Ling, LIU Dan, et al. Dynamic monitoring of eco-environmental quality in arid desert area by remote sensing: taking the Gurbantunggut desert China as an example [J]. Chinese Journal of Applied Ecology, 2019, 30(3): 877 − 883.
    [13]
    NIE Xinran, HU Zhenqi, ZHU Qi, et al. Research on temporal and spatial resolution and the driving forces of ecological environment quality in Coal Mining areas considering topographic correction [J/OL]. Remote Sensing, 2021, 13(14): 2815[2022-07-01]. doi: 10.3390/rs13142815.
    [14]
    JING Yunqing, ZHANG Fei, HE Yufeng, et al. Assessment of spatial and temporal variation of ecological environment quality in Ebinur lake wetland national nature reserve, Xinjiang, China [J/OL]. Ecological Indicators, 2020, 110: 105874[2022-07-01]. doi: 10.1016/j.ecolind.2019.105874.
    [15]
    ZHANG Hua, SONG Jinyue, LI Ming, et al. Eco-environmental quality assessment and cause analysis of Qilian Mountain national park based on GEE [J]. Chinese Journal of Ecology, 2021, 40(6): 1883 − 1894.
    [16]
    ZHU Hong, WANG Jinliang, CHENG Feng, et al. Monitoring and evaluation of eco-environmental quality of lake basin regions in central Yunnan Province, China [J]. Chinese Journal of Applied Ecology, 2020, 31(4): 1289 − 1297.
    [17]
    ZHOU Siyi, YIN Xiaojie, TANG Ruiquan, et al. Evaluation of eco-environmental quality in typical rocky desertification areas in the upper reaches of the Yangtze River [J]. Journal of Zhejiang A&F University, 2022, 39(4): 783 − 791.
    [18]
    XIONG Junnan, PENG Chao, CHENG Weiming, et al. Analysis of vegetation coverage change in Yunnan Province based on MODIS-NDVI [J]. Journal of Geo-information Science, 2018, 20(12): 1830 − 1840.
    [19]
    LI Ning, WANG Jiayao, QIN Fen. The improvement of ecological environment index model RSEI [J/OL]. Arabian Journal of Geosciences, 2020, 13: 403[2022-07-01]. doi: 10.1007/s12517-020-05414-7.
    [20]
    XU Hanqiu, DENG Wenhui. Rationality analysis of MRSEI and its difference with RSEI [J]. Remote Sensing Technology and Application, 2022, 37(1): 1 − 7.
    [21]
    WANG Jialu, LI Weijie, WANG Yong, et al. Spatial-temporal variation of NDVI and its responses to hydrothermal condition in rocky desertification area of Chongqing City from 2005 to 2014 [J]. Research of Soil and Water Conservation, 2021, 28(2): 217 − 223.
    [22]
    SHI Zhou, ZHOU Yue. Theory and Practice of Spatial Analysis [M]. Beijing: Science Press, 2020: 100 − 111.
    [23]
    XU Hanqiu, WANG Yifan, GUAN Huade, et al. Detecting ecological changes with a remote sensing based ecological index (RSEI) produced time series and change vector analysis [J]. Remote Sensing, 2019, 11(20): 2345[2022-07-01]. doi: 10.3390/rs11202345.
    [24]
    LUO Xuling, WANG Shijie, BAI Xiaoyong, et al. Analysis on the spatio-temporal evolution process of rocky desertification in southwest karst area [J]. Acta Ecologica Sinica, 2021, 41(2): 680 − 693.
    [25]
    WANG Jie, MA Jiali, XIE Feifei, et al. Improvement of remote sensing ecological index in arid regions: taking UIan Buh desert as an example [J]. Chinese Journal of Applied Ecology, 2020, 31(11): 3795 − 3804.
    [26]
    CHENG Linlin, WANG Zhenwei, TIAN Sufeng, et al. Evaluation of eco-environmental quality in Mentougou District of Beijing based on improved remote sensing ecological index [J]. Chinese Journal of Ecology, 2021, 40(4): 1177 − 1185.
    [27]
    ZHANG Liwei, ZHANG Yun, HUANG Chen. Remote sensing index analysis on ecological environment changes in the recent 20 years of city belt in Wanjiang [J]. Resources and Environment in the Yangtze Basin, 2018, 27(5): 1061 − 1070.
    [28]
    CHENG Zhifeng, HE Qisheng. Remote sensing evaluation of the ecological environment of Su-Xi-Chang city group based on remote sensing ecological index (RSEI) [J]. Remote Sensing Technology and Application, 2019, 34(3): 531 − 539.
    [29]
    LIU Xiaoying. Spatial Heterogeneity Assessment of Urban Ecological Quality Based on Remote Sensing Index and Geographic Spatial Analysis [D]. Xiamen: Xiamen University of Technology, 2021.
    [30]
    GU Lei, YUE Cairong, ZHAO Xun, et al. Analysis of vegetation coverage change in Yunnan Province from 1999−2018 based on Google Earth Engine [J]. Journal of West China Forestry Science, 2020, 49(5): 74 − 80.
    [31]
    XU Hongfeng, WANG Yan, SU Qian, et al. Evolution of rock desertification and driving factors in typical karst areas of Yunnan Province [J]. Journal of Arid Land Resources and Environment, 2022, 36(5): 94 − 101.
    [32]
    WU Yueyuan, XU Tianshu, YUE Cairong. Dynamic monitoring and analysis of vegetation in Yunnan Province in recent ten years based on MODIS/NDVI [J]. Journal of Green Science and Technology, 2013(10): 134 − 135.
    [33]
    ZHAO Cui’e, DING Wenrong. Dynamic analysis of ecological footprint during 2000−2010 of Kunming City [J]. China Population, Resources and Environment, 2013, 23(suppl 1): 99 − 102.
    [34]
    JIANG Mao, LIN Yi, CHAN Tingon, et al. Geologic factors leadingly drawing the macroecological pattern of rocky desertification in Southwest China [J/OL]. Scientific Reports, 2020, 10: 1440[2022-07-02]. doi: 10.1038/s41598-020-58550-1.
    [35]
    GENG Hong. Water Resource Exploration in Karstic Areas of Yunnan [M]. Kunming: Yunnan Science and Technology Press, 2002: 54 − 85.
    [36]
    ZHOU Qiuwen, WEI Xiaocha, XU Youxia, et al. Temporal and spatial characteristics of land use change in Qingshui River Basin from 1978 to 2010 [J]. Engineering of Surveying and Mapping, 2016, 25(11): 12 − 17.
    [37]
    YUAN Daoxian. Scientific innovation in karst resources and environment research field of China [J]. Carsologica Sinica, 2015, 34(2): 98 − 100.
    [38]
    YU Meng, LI Yangbing, LUO Guangjie. Evolution trend of rocky desertification in karst mountainous areas in southwest China [J]. Acta Ecologica Sinica, 2022, 42(10): 4267 − 4283.
    [39]
    WU Ning, LI Shicheng, REN Xiaodong, et al. Rocky Desertification in Yunnan [M]. Beijing: China Forestry Press, 2020: 78 − 84.
  • 加载中
通讯作者: 陈斌, bchen63@163.com
  • 1. 

    沈阳化工大学材料科学与工程学院 沈阳 110142

  1. 本站搜索
  2. 百度学术搜索
  3. 万方数据库搜索
  4. CNKI搜索

Figures(4)  / Tables(1)

Article views(441) PDF downloads(53) Cited by()

Related
Proportional views

Evaluation and evolution characteristics of ecological quality in Yunnan based on long-time series satellite remote sensing

doi: 10.11833/j.issn.2095-0756.20220439

Abstract:   Objective  This study, with an analysis of the changes of ecological quality in Yunnan Province since the 1990s, is aimed to provide support for the further protection, restoration and promotion of ecological security barriers in Southwest China.   Method  Remote Sensing based Ecological Index (IRSEI) and spatial auto-correlation analysis were employed to study the regularities and characteristics of ecological quality from two dimensions (time and space).   Result  (1) In terms of time scale, the overall change of IRSEI in Yunnan Province from 1990 to 2020 is featured with the “W” type, showing a trend of first decreasing, then decreasing after a slight rise, and continuously increasing finally, falling to the lowest level twice in 2000 and 2010 with a general decrease of 0.038 in 30 years and an overall slope of linear fitting of −0.008. (2) In terms of spatial scale, the overall variation of the seven regions’ IRSEI in Yunnan Province is relatively small in 1995 and 2005, with generally stable and minor variation grades but a relatively large fluctuation in 2000 and 2010 and the volatility of Western and Northwestern Yunnan where the coefficient of variation is 0.115 and 0.171 respectively is larger than that of other regions in 1990. (3) At the county scale, the spatial auto-correlation degree of IRSEI in Yunnan Province from 1990 to 2020 shows a tendency of decreasing and gradually slowing down. At the same time, high-high cluster shifts from Northeastern, Southeastern and Southern Yunnan to Western, Northwestern and Southwestern Yunnan, while low-low cluster shifts to Northeastern, Southeastern, Southern and Central Yunnan, especially where rocky desertification is distributed.   Conclusion  The overall ecological quality of Yunnan Province enjoys a gradual improvement, especially after 2010, of which more attention should be paid to the impact of karst rocky desertification and meteorological disaster on the ecological quality. [Ch, 4 fig. 1 tab. 39 ref.]

ZHANG Shiwen, LI Chengrong, WANG Yan, WU Yang. Evaluation and evolution characteristics of ecological quality in Yunnan based on long-time series satellite remote sensing[J]. Journal of Zhejiang A&F University, 2023, 40(3): 579-588. doi: 10.11833/j.issn.2095-0756.20220439
Citation: ZHANG Shiwen, LI Chengrong, WANG Yan, WU Yang. Evaluation and evolution characteristics of ecological quality in Yunnan based on long-time series satellite remote sensing[J]. Journal of Zhejiang A&F University, 2023, 40(3): 579-588. doi: 10.11833/j.issn.2095-0756.20220439
  • 自20世纪90年代以来,随着经济发展、城镇化进程,全球性生态问题和区域性环境问题层出不穷,全面客观评价区域生态质量,协调人类社会经济发展与生态环境平衡关系成为关注的重点和热点[12]。遥感生态指数是基于生态环境状况指数评价区域生态质量的时空局限性的一种新型遥感生态指数,可减少评价指标获取难度和评价过程的人为主观性[3]。自2013年提出以来,先后在中国北方的哈尔滨[1]、石家庄[4]、雄安新区[5],东部的义乌[2]、杭州[6],中西部的重庆[7]、乌鲁木齐[8]、阿克苏[9],南部的福州[10]、昆明[11]以及一些特殊地理单元[1215]均有很好的评价示范和应用。但上述研究空间分辨率与研究范围大多没有实现同步提升,多集中于区域中心城市,时间序列也主要在近20 a;其次分析评价也大多集中于主成分分析结果的陈述,最终集成结果遥感生态指数的分级统计、变化监测与建模预测,没有进一步结合其他分析方法深入探究遥感生态指数的空间特征和关系。本研究在农兰萍等[11]、朱泓等[16]、周斯怡等[17]的研究基础上,从云南省省域空间层面和30 a的时间尺度上定量评价生态质量的变化情况,并以莫兰指数分析其空间分布特征,旨在更大时空尺度上作出遥感生态指数的应用拓展,探析区域生态质量变化的原因,以期发挥遥感生态指数的评价效益,为支持云南省生态环境修复及生态文明建设提供服务。

    • 云南省属中国西南边境省份(21°08′~29°15′N,97°31′~106°11′E),地处青藏高原南麓与云贵高原的交界地带,高山、亚高山与河谷、盆地相间,境内气候类型丰富、干湿季节分明、垂直小气候特征明显、生物多样性丰富,兼备亚热带至高山寒温带的各种自然生态群落,属于金沙江-长江、南(北)盘江-珠江、元江-红河、澜沧江-湄公河、怒江-萨尔温江等重要国际国内河流的上游或源头。参照熊俊楠等[18]对云南省区域的划分结果,将下辖16个地州(市)分为7个区域,分别为滇东北、滇东南、滇南、滇西、滇西北、滇西南、滇中。

    • 遥感影像源于中国科学院地理空间数据云(http://www.gscloud.cn)并由美国地质勘探局(USGS)网站(https://earthexplorer.usgs.gov/)进行补充,选取1990—2020年7期Landsat系列影像,空间分辨率为30 m,选取时间在每年的2—4月,云量控制在10%以下,对于局部缺失的影像再用其余时间的影像及相邻年份的影像替代。所有影像数据通过辐射定标、大气校正、几何校正、图像镶嵌等完成预处理,并按照云南省矢量边界裁剪出所需的研究区。

    • 徐涵秋[3]基于遥感信息技术,以代表区域生态质量的4大生态要素(绿度、湿度、干度、热度),构建以植被指数、湿度分量、建筑指数、裸土指数和地表温度为遥感观测指标的新型遥感生态指数(IRSEI),即:$ {{{I}}_{{\rm{RSEI}}}} = f({{{I}}_{{\rm{NDVI}}}},\;{{{I}}_{{\rm{Wet}}}},\;{{{I}}_{{\rm{NDBSI}}}},\;{{{I}}_{{\rm{LST}}}}) $。其中:INDVI为植被归一化指数;IWet为湿度分量;INDBSI为土壤指数,即建筑指数、裸土指数的组合;ILST为地表温度。具体各分量计算公式参见文献[3, 17]。

      为避免人为加权求和所带来的主观性,遥感生态指数模型运用完全自主的主成分变换,集成IRSEI以快速监测和评价区域生态质量。其次,上述观测指标的量纲及数量级存在不统一问题,为避免其对集成结果带来的影响,在集成之前需进行正规化,使其映射到0~1,即[3]$ {{I}}_i^* = ({I_i} - {I_{\min }})/({I_{\max }} - {I_{\min }}) $。其中:$ {{I}}_i^* $为正规化后的观测指标值,Ii为观测指标在像元i处的计算值,Imax为观测指标的最大计算值,Imin为观测指标的最小计算值。

      鉴于主成分变换结果中INDVIIWet所代表的生态学意义[1920],确定主成分变换结果的第1主成分(PC1),即为初始遥感生态指数IRSEI0,再次经过正规化即可得到遥感生态指数IRSEI,即:IRSEI=(IRSEI0IRSEImin)/(IRSEImaxIRSEImin)。其中,IRSEI0为初始遥感生态指数,IRSEImax为初始遥感生态指数的最大值,IRSEImin为初始遥感生态指数的最小值。对于计算结果,可按0.2间隔成5个生态等级,即优(5级,IRSEI>0.8),良(4级,0.8≥IRSEI>0.6),中等(3级,0.6≥IRSEI>0.4),较差(2级,0.4≥IRSEI>0.2),差(1级,IRSEI≤0.2),以进一步量化统计和表征区域生态质量变化。

    • 即以一元线性回归模型分析自变量随时间的变化斜率(Islope),其计算公式参考文献[21]并划分等级标准:明显减小(Islope≤−0.005)、轻度减小(−0.005<Islope≤−0.002)、基本不变(−0.002<Islope≤0.002)、轻度增加(0.002<Islope≤0.005)、显著增加(Islope>0.005)。

    • 即以变异系数(CV)分析自变量的变化,反映数据样本的离散性和波动性,其计算公式参考文献[21],并划分等级标准:非常稳定(CV≤0.04)、稳定(0.04<CV≤0.08)、变异较小(0.08<CV≤0.12)、变异剧烈(CV>0.12)。

    • 为研究遥感生态指数在相邻空间单元上的空间关系,即空间相关性和异质性,引入莫兰指数(Moran’s I)定量评估云南省129个县生态质量的空间自相关程度,并结合P值和Z得分分析其在空间单元上的分布特征。其中,全局莫兰指数(global Moran’s I)在于描述自变量的整体分布情况,局部莫兰指数(local Moran’s I)在于测量局部空间自相关并指出冷点聚集区和热点聚集区,在空间分布上反映遥感生态指数高低值的聚类状态,具体计算公式参考文献[22]。
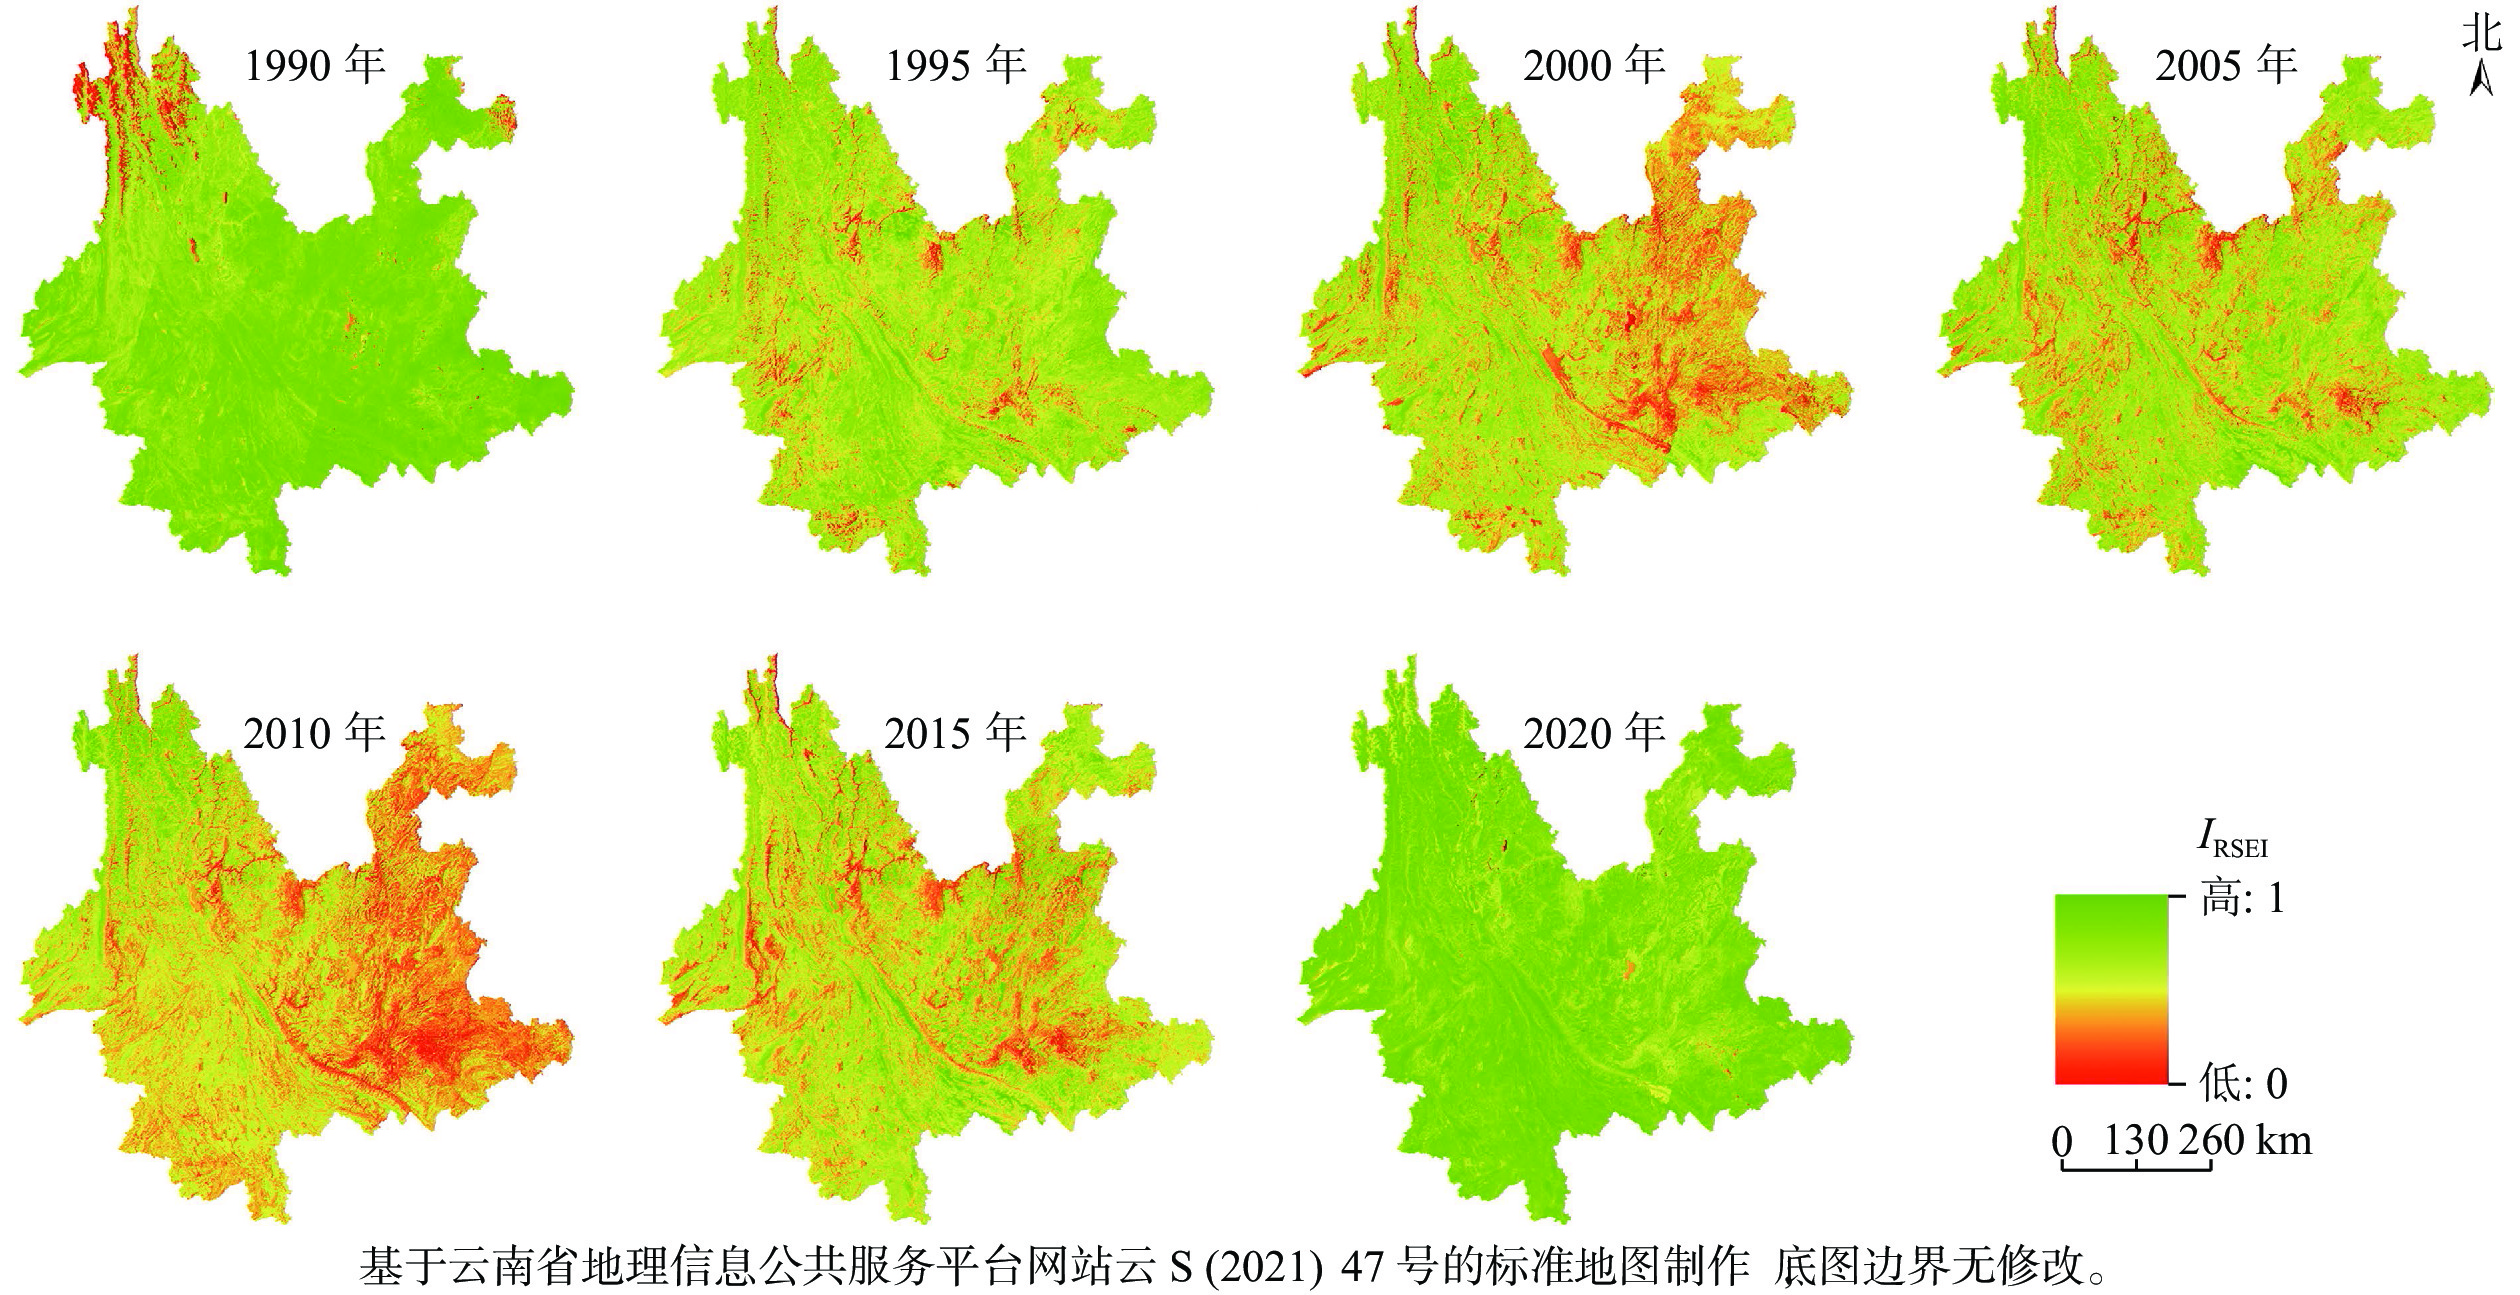
    • 图1所示:遥感生态指数的计算结果可表征云南省1990—2020年生态质量的动态演变特征。相较于IRSEI不同生态条件下已有的测算结果而言[23],城市地区IRSEI为0.450~0.590,森林或植被茂盛的地区IRSEI高于0.630,但在土壤侵蚀严重地区IRSEI低至0.180,在沙漠地区IRSEI则低至0.240,可以更好地横向比较云南省生态质量的具体情况。1990年,滇东北、滇东南、滇南、滇西南以及滇中的大部分地区生态质量均达到了优良等级,IRSEI达0.800以上,而滇西、滇西北的高寒山区明显低于省平均水平。之后,随着人口增多导使土地依附性增强,再加上陡坡开荒、过度垦殖、顺坡耕种等不合理的开垦耕作方式,能源获取以及对森林的乱砍乱伐等[24],至2000年全域生态质量普遍下降,IRSEI省均值从1990年的0.795下降到2000年的0.558。随着退耕还林还草、集体林权制度改革以及石漠化综合治理等生态工程的陆续实施[24],2005年生态质量得到初步恢复,IRSEI省均值达0.664。2009—2011年连续3 a干旱导致云南曲靖珠江源石漠化面积持续扩展,滇东北、滇东南、滇南地区生态质量普遍下降,IRSEI地区均值跌至0.400以下,其他地区也受到影响。2010年以后,随着城镇化进程及生态修复政策的实施,IRSEI省均值从2010年0.449上升到2020年的0.757,平均每年增长6.86%。

      Figure 1.  Dynamic evolution characteristics of IRSEI in Yunnan Province from 1990 to 2020
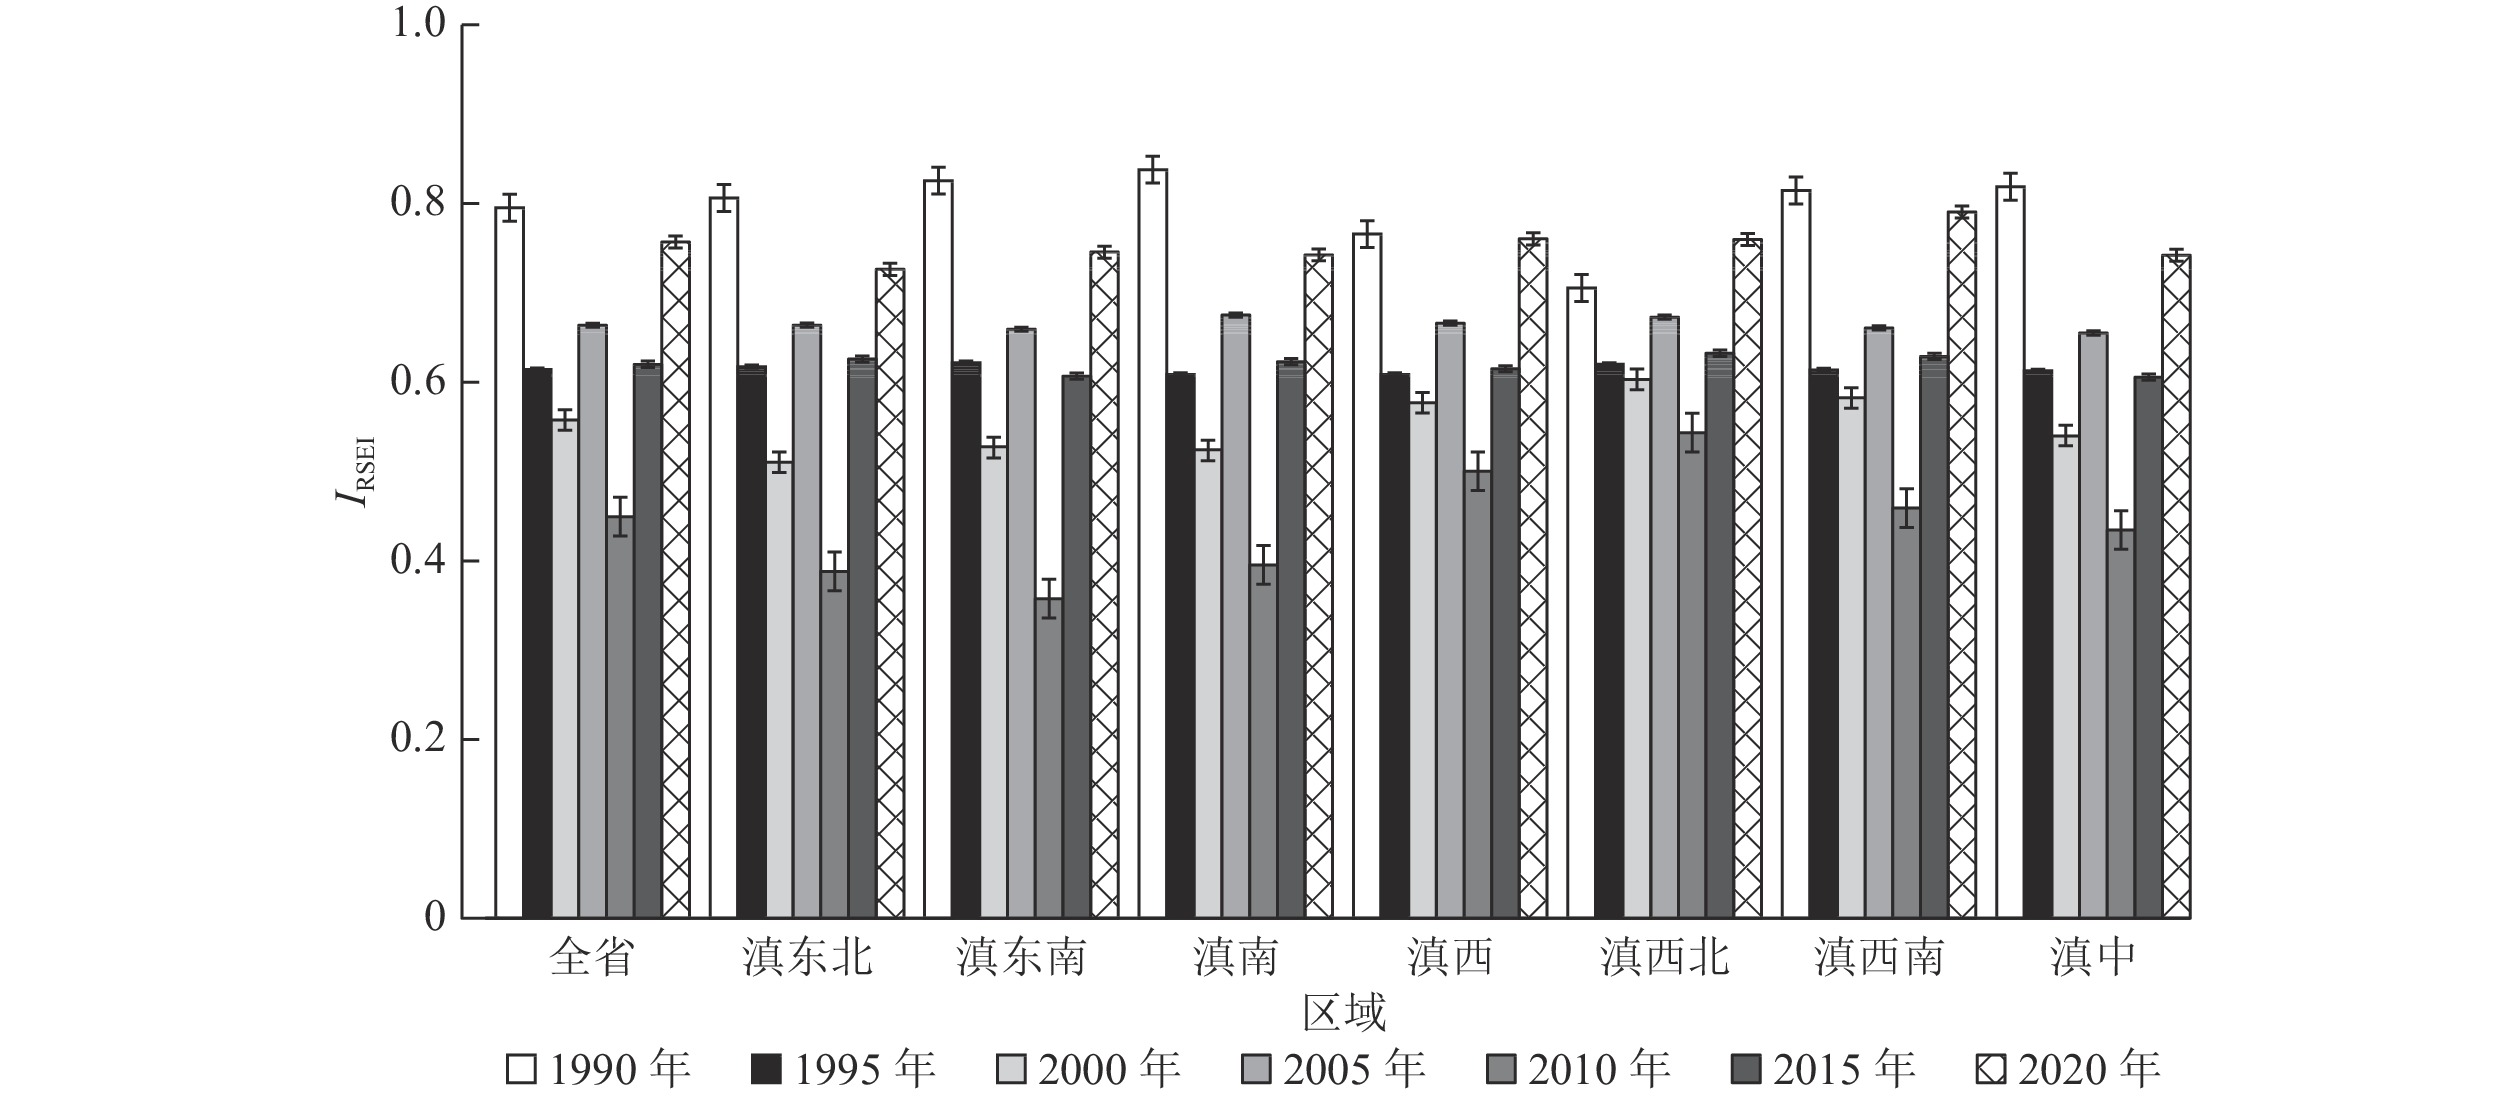
    • 图2所示:云南省1990—2020年IRSEI呈先减小、小幅回升后再减小、后又持续增加的变化趋势,并于2000和2010年2次跌至最低水平。其中,省均值2次位于良等级的高位水平,部分地区更是达到了优等级,3次位于良等级的低位水平,2次位于中等水平。从云南省IRSEI分区域统计结果来看,1995、2005、2015年地区均值差异较小,地区均值极差分别为0.013、0.020、0.027;1990年滇西、滇西北略有波动,与省均值的差值分别为0.029、0.090;而在人类活动干扰、连续干旱的影响下,2000、2010年云南省不同地区生态质量均有不同程度的恶化并呈现差异化分布,相较于前1个5 a省均值分别下降9.12%、32.38%,地区均值极差依次为0.093、0.186。

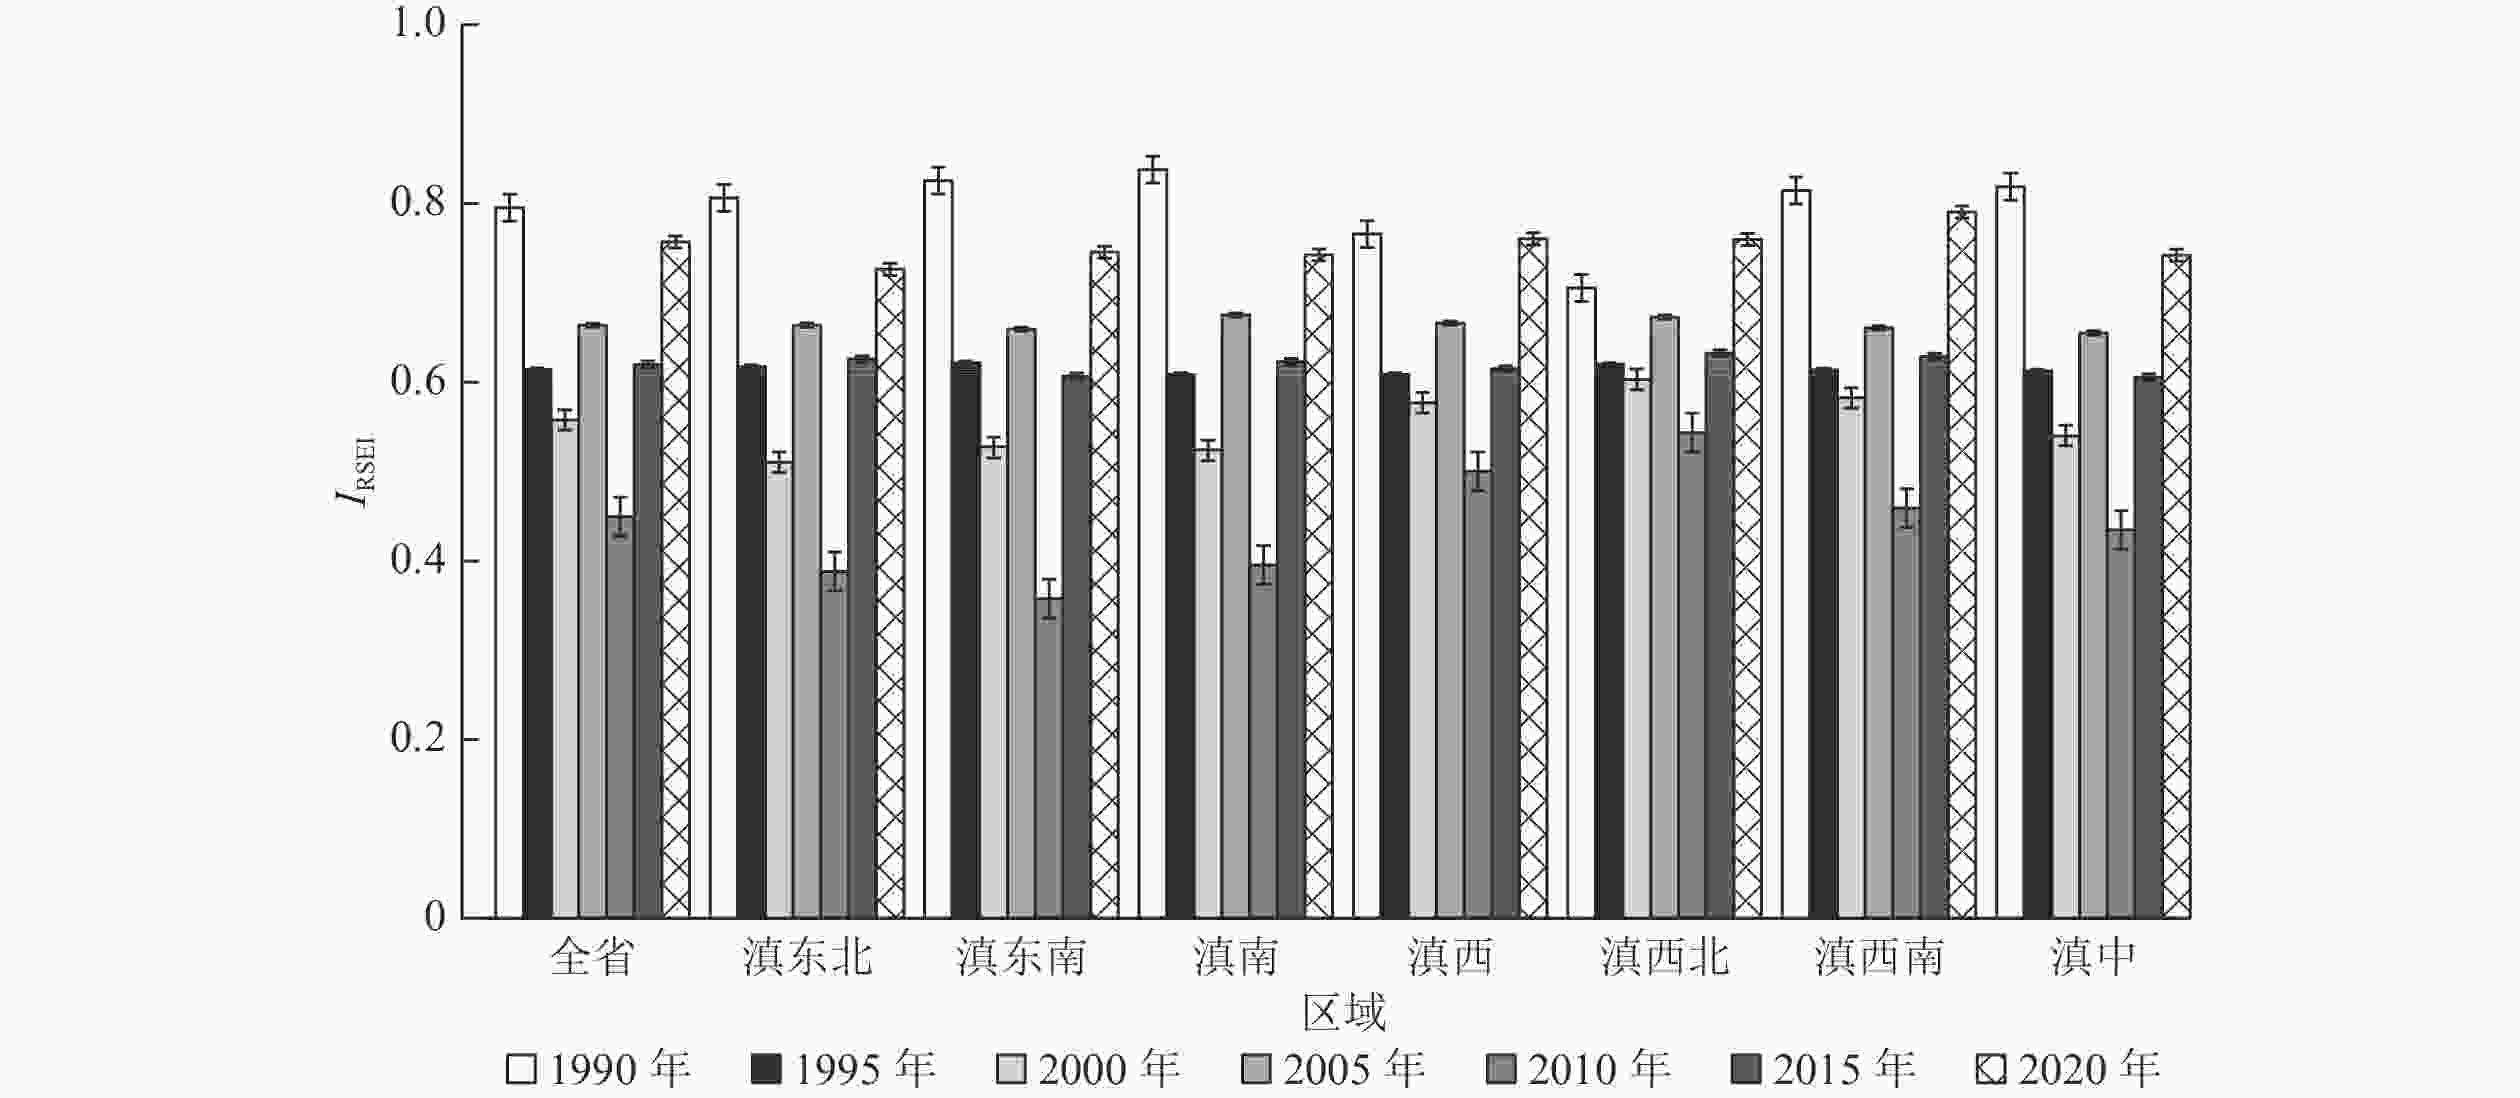
      Figure 2.  Spatial-temporal variation characteristics of IRSEI in Yunnan Province from 1990 to 2020

      从整个研究时间序列来看,云南省IRSEI整体变化为“W”型,整体拟合斜率为−0.008,属于明显减小的变化等级,其中滇西属于轻度减小的变化等级,滇西北属于轻度增加的变化等级,其余皆属于明显减小的变化等级。下降阶段主要在1990—2000年,拟合斜率为−0.119,是明显减小变化等级阈值−0.005的23.8倍,具体表现为全域范围内生态质量普遍下降。低谷阶段主要在2000—2010年,2005年小幅回升后再度下降,拟合斜率为−0.054,属于明显减小的变化等级,其中滇西、滇西北位于−0.05以上,其主要贡献来源于生物多样性的保护及森林保育,而其余地区拟合斜率均小于−0.05,滇东南在岩溶环境影响下达−0.085。恢复阶段主要在2010—2020年,拟合斜率为0.154,是显著增加变化等级阈值0.005的30.8倍,其中滇东南作为石漠分布区中的典型代表,是近10 a生态质量恢复最快的地区,拟合斜率为0.194。

      表1可见:1990—2000年属于生态质量的下降阶段,优良等级(4~5级)所占比例从1990年的95.82%下降到2000年的34.88%,平均每年下降6.09%;1~3级所占比例从1990年的4.18%上升到2000年的65.13%,生态条件变差等级下降面积为3.68×10⁵ km2。1990—2000年云南省生态质量的下降主要表现在优良生态等级的持续下跌,从1990年的4~5级(95.82%)下降到1995年的3~4级(99.97%),再到2000年的3~4级(96.49%),其中1995年以4级(68.15%)居多,而2000年以3级(61.73%)居多。

      等级1990年1995年2000年2005年2010年2015年2020年
      面积/
      km2
      百分
      比/%
      面积/
      km2
      百分
      比/%
      面积/
      km2
      百分
      比/%
      面积/
      km2
      百分
      比/%
      面积/
      km2
      百分
      比/%
      面积/
      km2
      百分
      比/%
      面积/
      km2
      百分
      比/%
      193.350.022.860.0072.830.0240.430.013 042.650.79592.760.152 823.700.73
      2453.150.1266.260.0212 979.653.38184.290.05126 806.0032.981 873.630.492 327.440.61
      315 540.204.04122 142.3431.82237 312.7061.7372 931.2918.97220 653.2057.40150 410.8239.1238 949.5910.13
      4135 083.3835.14261 597.9368.15133 616.7334.76310 307.8880.7232 746.938.52223 129.7558.04157 526.6740.98
      5233 267.8660.6840.890.01456.470.12975.640.251 190.670.318 432.582.19182 811.8547.55
        说明:5级为优(IRSEI>0.8),4级为良(0.8≥IRSEI>0.6),3级为中等(0.6≥IRSEI>0.4),2级为较差(0.4≥IRSEI>0.2),1级为差(IRSEI≤0.2)。

      Table 1.  Classification statistics of IRSEI in Yunnan Province from 1990 to 2020

      2000—2010年属于生态质量的低谷阶段,主要表现为2000年的3~4级(96.49%)且以3级居多,初步恢复到2005年3~4级(99.69%)且以4级居多,又在持续干旱因素影响下下降到2010年的2~3级(90.38%)。从空间分布上来看,2000年主要表现为滇东北、滇东南、滇南乃至滇中的局部地区不合理的开垦方式造成水土流失,毁林取薪造成植被破坏,岩溶环境背景的脆弱性进一步凸显;2010年主要表现为连续3 a干旱导致云南曲靖珠江源石漠化面积持续扩展,滇东北、滇东南生态质量均受到影响。

      2010—2020年属于生态质量的恢复阶段,主要表现为低位水平生态质量的持续恢复,从2010年的2~3级(90.38%)恢复到2015年的3~4级(97.16%),再次恢复到2020年的4~5级(88.53%);生态条件转好等级上升面积为3.75×10⁵ km2,占比为97.56%,而生态质量变差等级下降面积占比仅2.44%。

      相较于1990年的初始水平,云南省2020年生态质量整体得到不同程度的恢复,面积为1.59×10⁵ km2,但1~3级的面积占比均有上升,集中于滇东北、滇东南、滇南以及滇中局部的石漠化分布区。

    • 从横向统计结果来看:云南省7个区域IRSEI在1995、2005年区域整体变异程度较小,普遍属于稳定和变异较小的变化等级,变异系数极差分别为0.011、0.022;在2000、2010年区域整体波动性较大,变异系数极差分别为0.044、0.106,其中2010年大部分地区超过变异剧烈变化等级阈值0.120的近1倍;滇西、滇西北在1990年与省内其他地区相比波动性较大,变异系数分别为0.115、0.171。从纵向统计结果来看:云南省7个区域以及全省不同年份的IRSEI变异程度均较大,遥感生态指数极差波动范围为0.20~0.50,其中滇东南最大,为0.468,滇西最小,为0.216;变异系数极差波动范围为0.15~0.20,滇南最大,为0.206,滇西南最小,为0.094 (图2)。

      图3所示:在1990—2000年生态质量下降阶段,云南省各区域IRSEI的下降幅度从大到小依次为滇东北、滇东南、滇南、滇中、滇西、滇西南、滇西北;除滇西北(76.32%)外,其余地区生态质量变差等级下降面积占比在90%以上。在2000—2010年生态质量低谷阶段,云南省各区域IRSEI的下降幅度普遍约0.10,其中最大为滇东南(0.169),最小为滇西北(0.059),除滇西、滇西北外,其余地区生态质量变差等级下降面积占比在90%以上。在2010—2020年生态质量恢复阶段,云南省各区域IRSEI的上升幅度从大到小依次为滇东南、滇东北、滇南、滇西南、滇中、滇西、滇西北;除滇西北(93.88%)外,其余地区生态条件转好等级上升面积占比在95%以上。从整个研究时间序列看,滇西北IRSEI为上升,而其余地区皆为下降,其中以滇西下降最小(0.005),而滇南下降最大(0.095)。

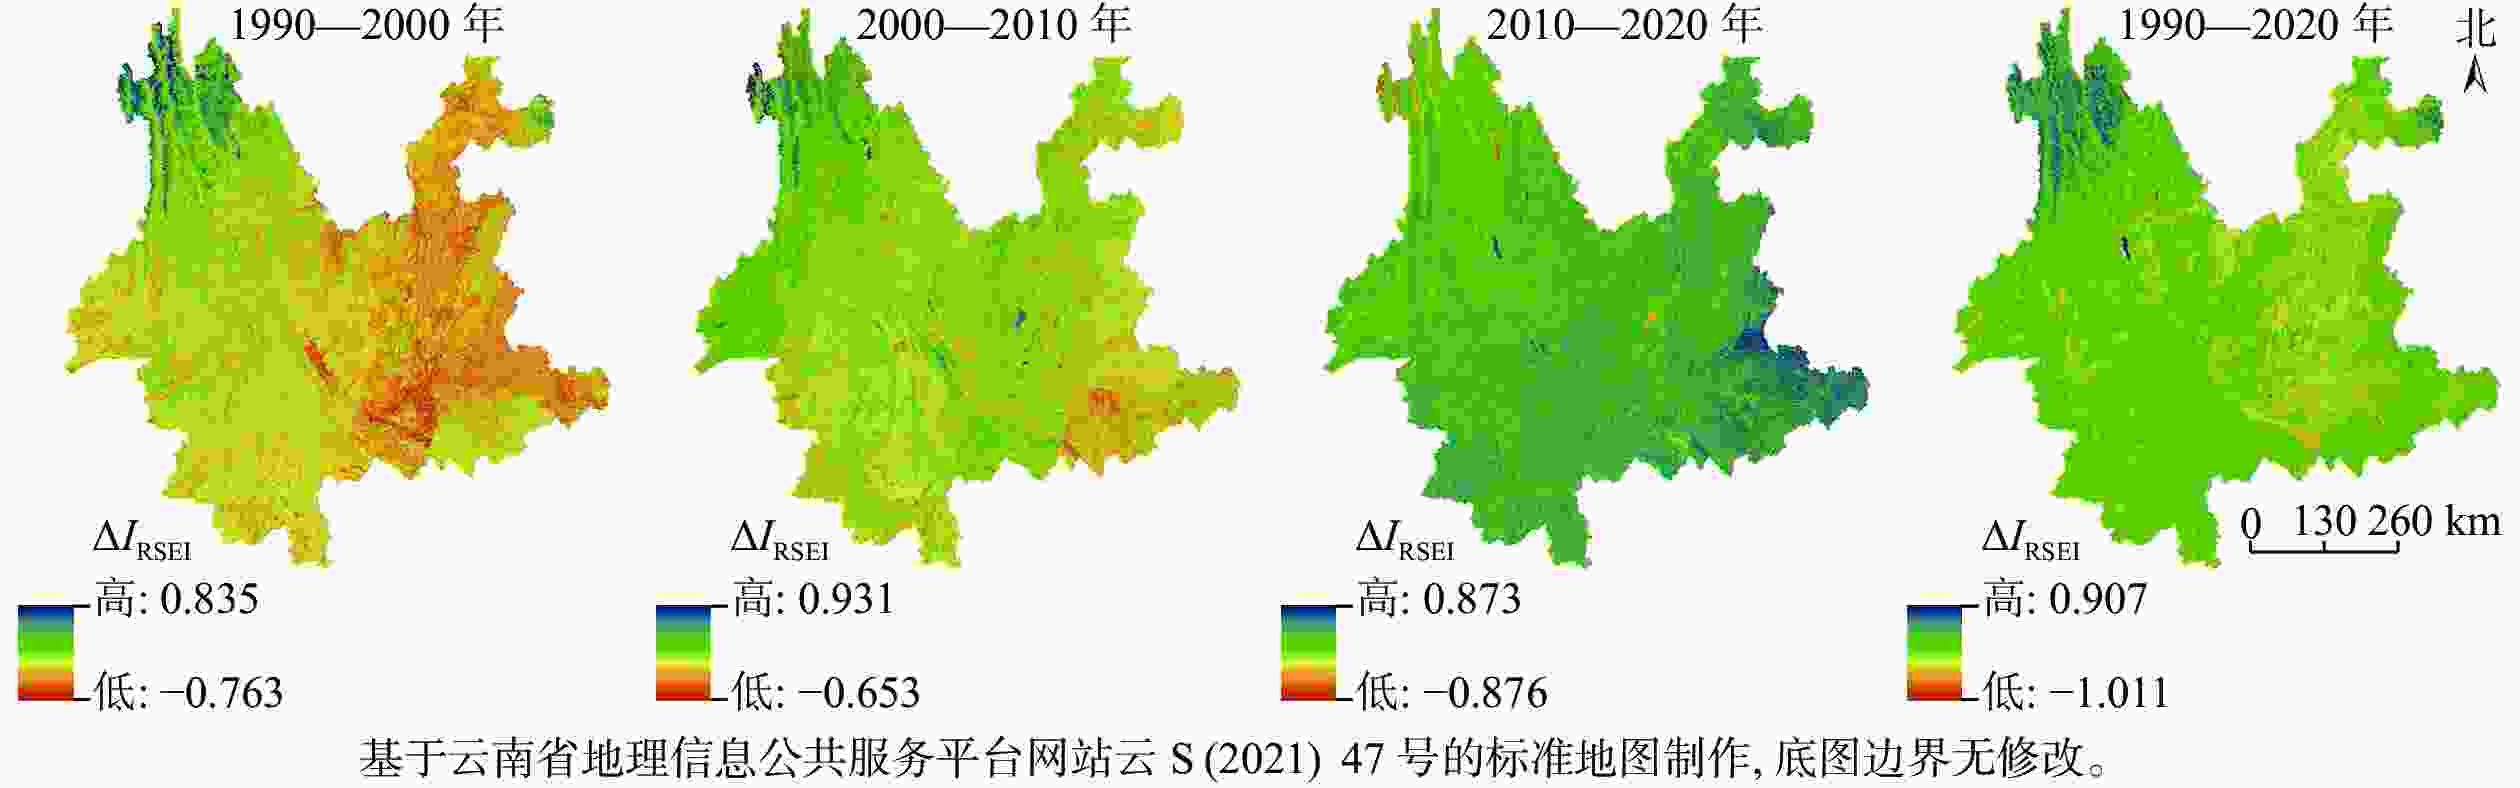
      Figure 3.  Change detection of IRSEI in Yunnan Province

    • 1990、1995、2000、2005、2010、2015、2020年,云南省129个县IRSEI的全局莫兰指数分别为0.586、0.225、0.409、0.394、0.374、0.278、0.321,并结合P值和Z得分,说明在99%置信度下IRSEI在相邻空间单元上呈现聚集状态,即区域生态质量具有空间异质性。从整个研究时间序列看,全局莫兰指数呈下降趋势并趋于平缓,说明研究区内县域间IRSEI空间自相关程度不断下降。结合云南省生态质量的动态演变特征,说明研究区内局部县域生态质量的提升使原本的生态高值(或低值)的聚集状态得到了一定程度的缓和。

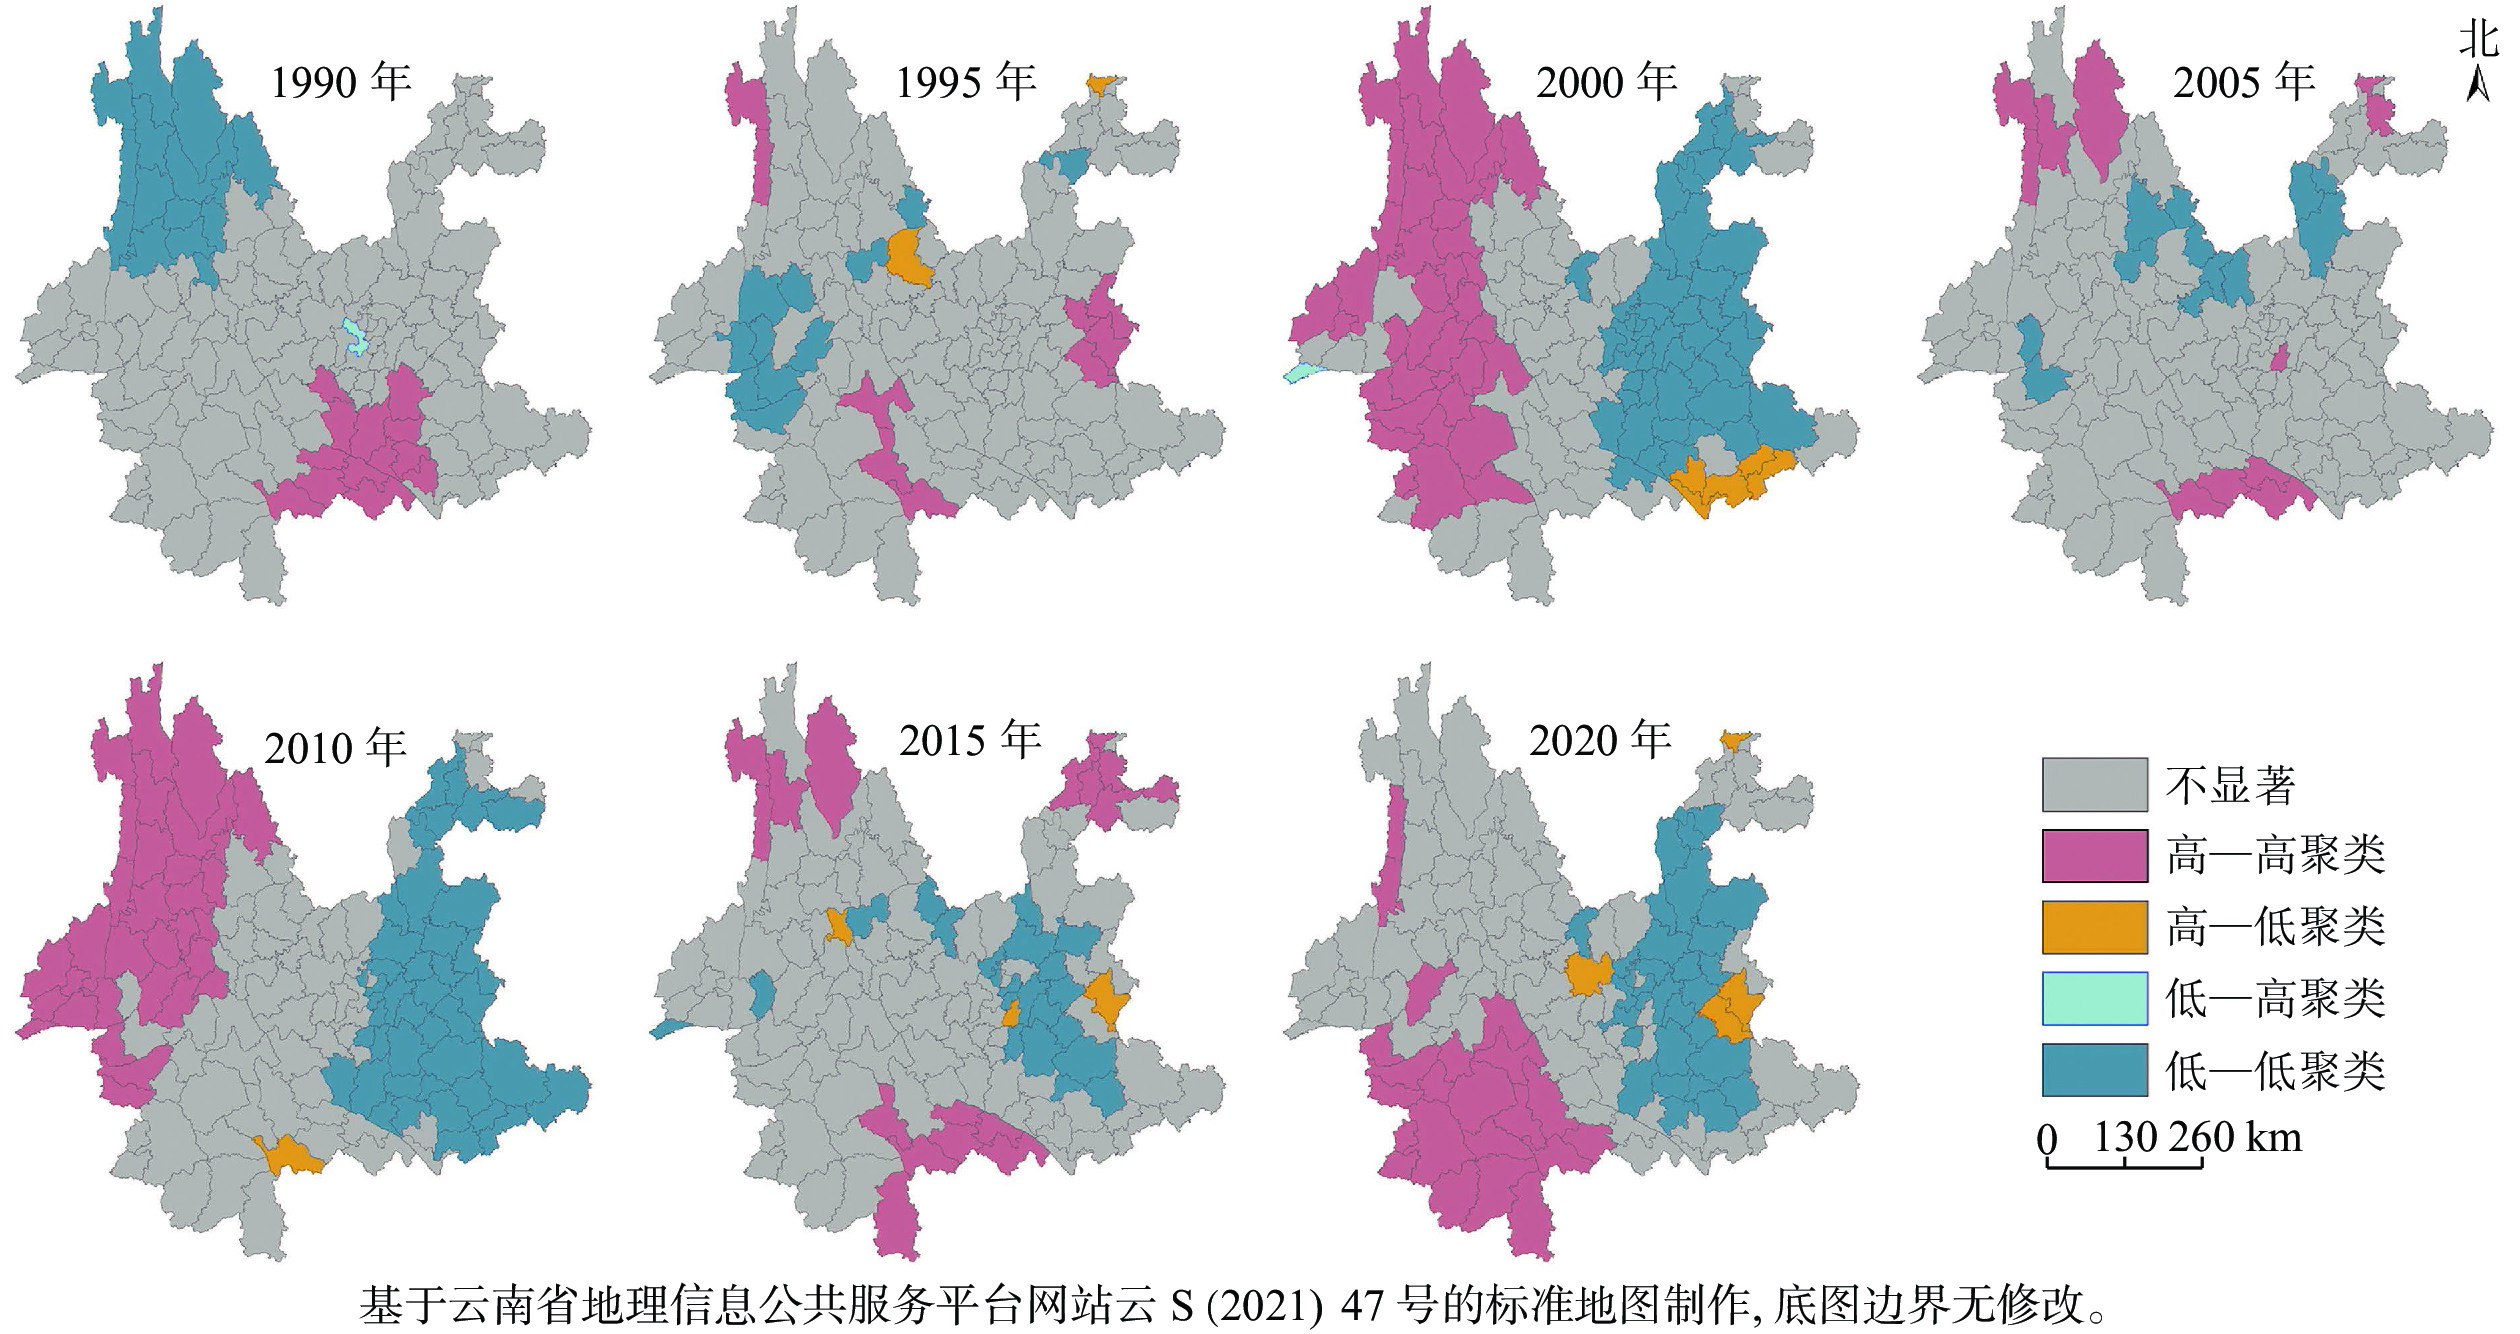
      由图4可知:20世纪90年代,云南省县域层面IRSEI的高值聚类主要分布在滇东北、滇东南以及滇南局部地区,低值聚类主要分布在滇西、滇西北以及滇西南的局部高寒山区。随着滇西、滇西北、滇西南各流域生物多样性的保护,中部哀牢山-无量山、南部热带森林的保育,IRSEI的低值聚类则逐渐转移到了滇东北、滇东南、滇南以及滇中地区,特别是石漠化分布区。在聚集特征上,IRSEI高—高聚集与低—低聚集在空间分布上一般不直接相邻且通过不显著的空间类别进行过渡,说明生态质量外在分布上一般是渐变式的,而内在呈现高值(或低值)的聚集状态。

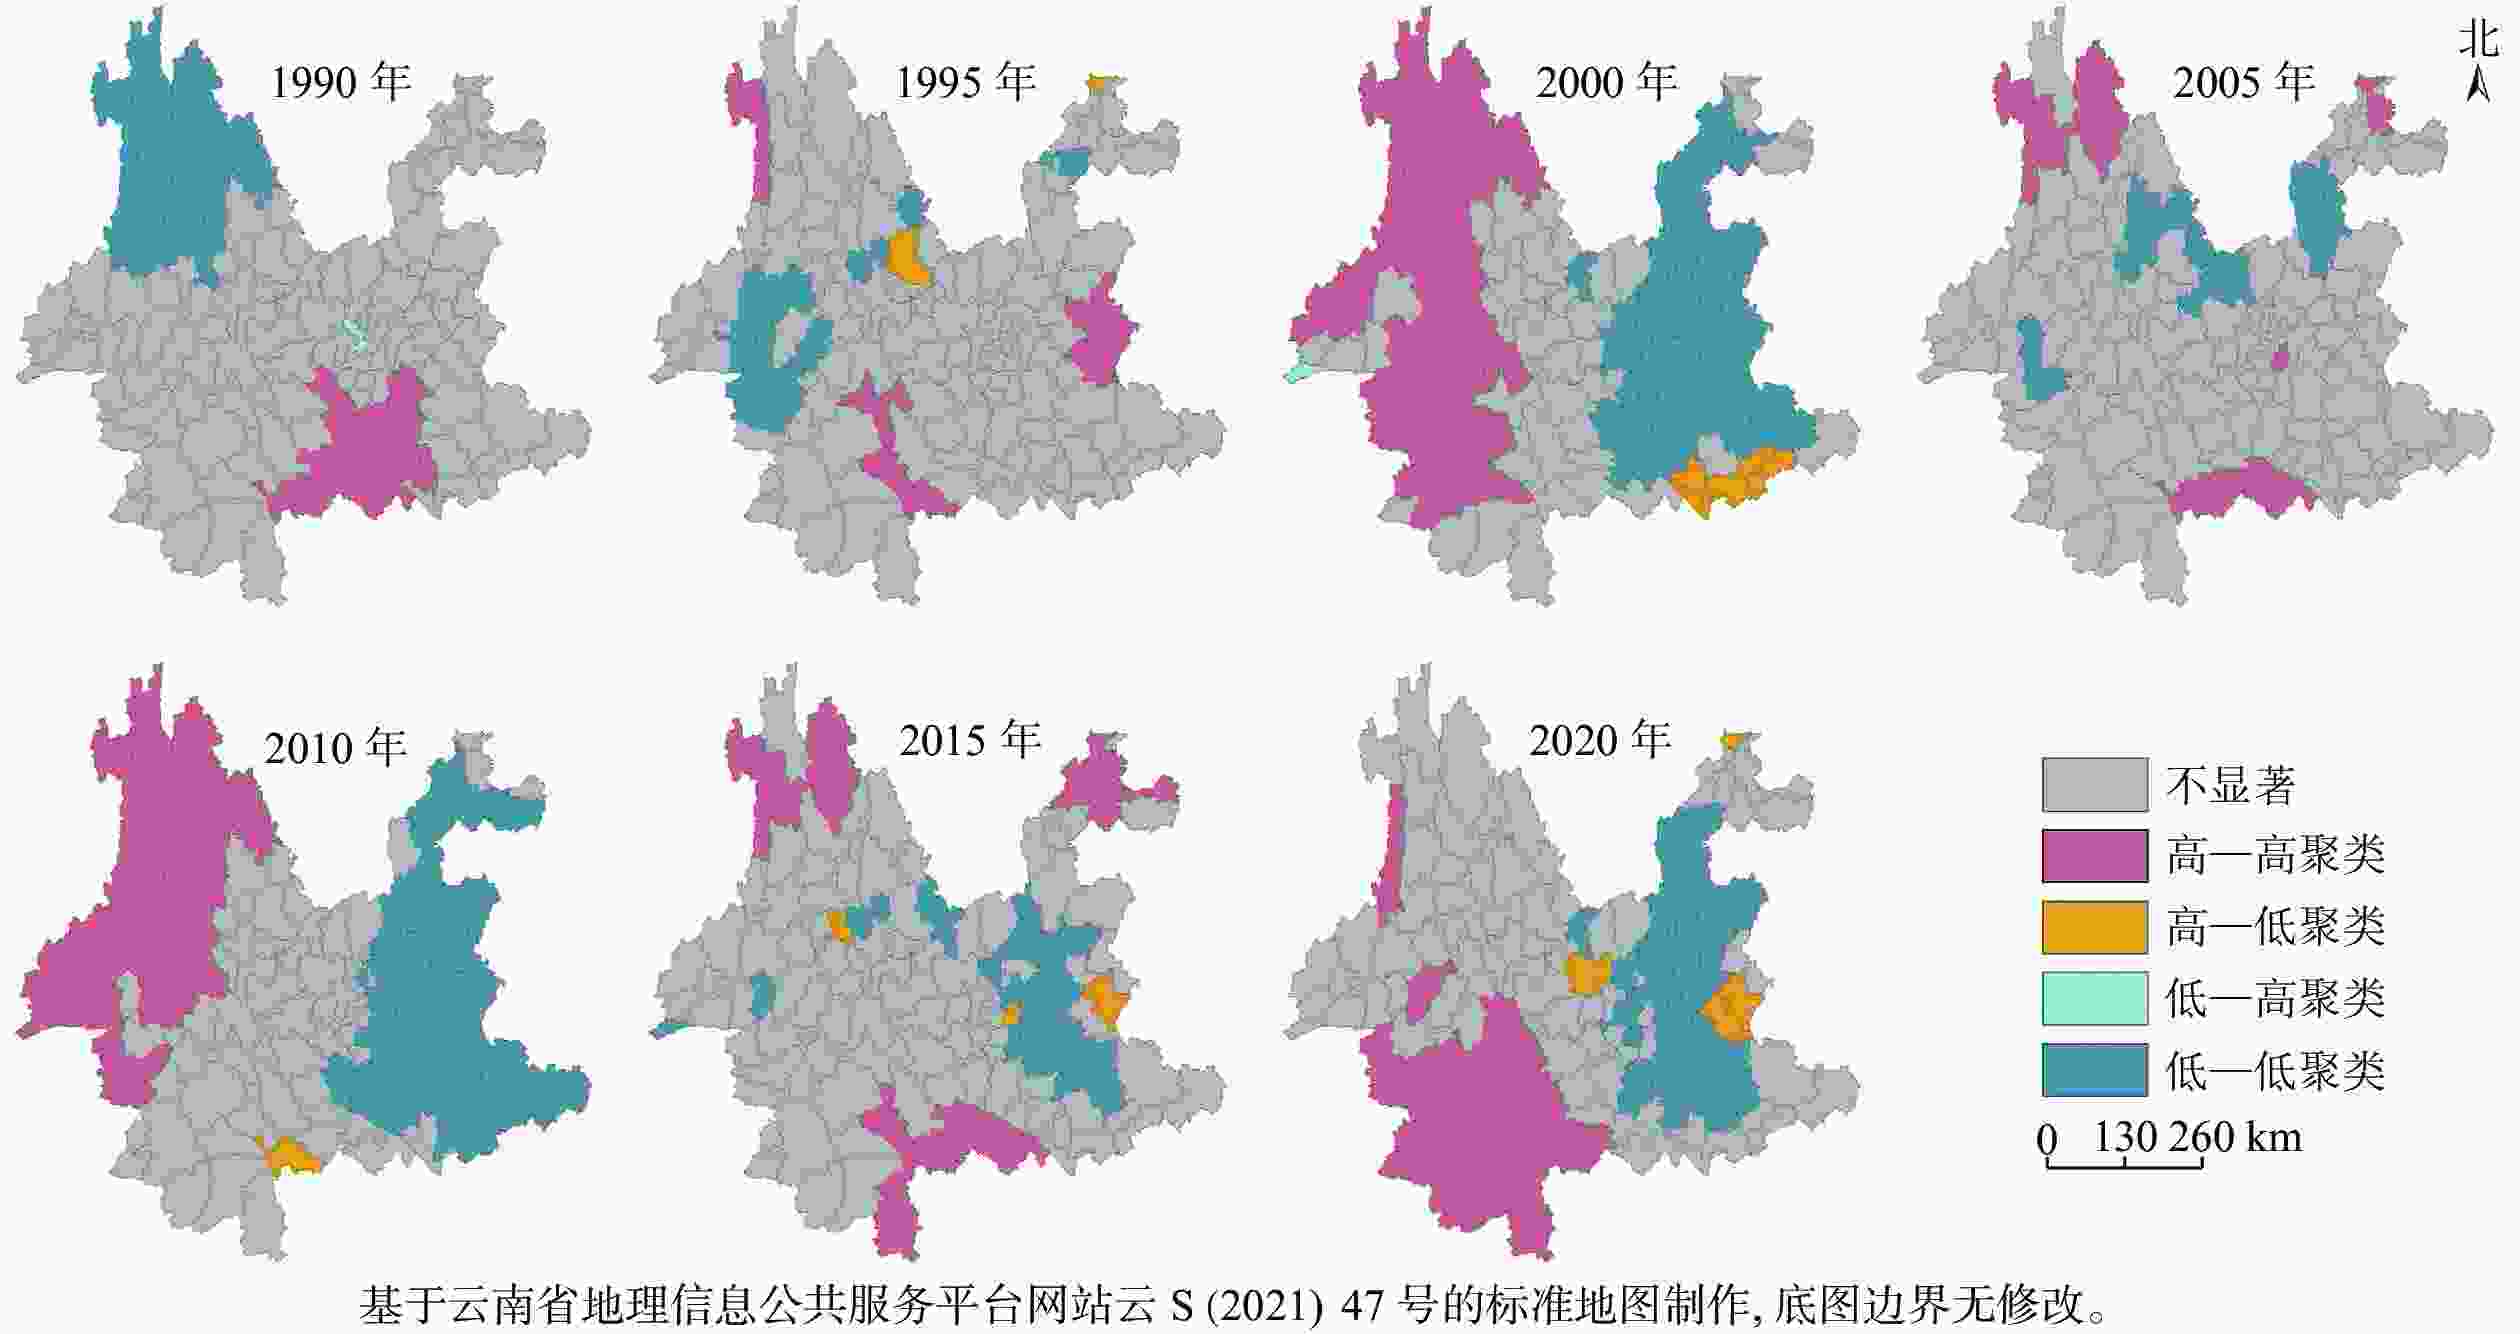
      Figure 4.  Dynamic evolution characteristics of county spatial clustering in Yunnan Province from 1990 to 2020

    • 在模型发展上,IRSEI自提出以来,已有不同学者结合研究区的特点或自身知识储备对模型进行了一定的拓展改进。王杰等[25]引入盐度指标表征土地盐碱化,构建干旱IRSEI;程琳琳等[26]采用熵权法计算权重并用指数和法计算IRSEI;张华等[15]基于谷歌地球引擎(Google Earth Engine,GEE)获取影像评价祁连山国家公园。在时空尺度上,张立伟等[27]、程志峰等[28]、XU等[23]将评价模型在皖江城市带、苏锡常(苏州-无锡-常州)城市群、福建省等更大尺度作了研究的拓展和应用。在数据分析上,也从主成分分析结果的陈述、4个观测指标的变化与影响、以及最终集成结果IRSEI的分级统计、变化监测与建模预测,拓展到利用地理空间分析IRSEI的空间关系[29]和利用地理探测器探测生态质量变化的驱动因子[78]。以上这些不同层面上的发展,均使得评价模型在客观、科学、快速、深入评价区域生态质量方面发挥更大的效益和价值。

      但其中有几点值得商榷:①GEE获取影像的时间应该得到严格的限定,以保证反演结果的准确性[20]。②应尝试与拓展在更大空间尺度上的研究或与其他分析方法或软件结合应用。③现有的时间序列多为近20 a,研究的时间周期没有进一步细化,数据的空间分辨率也没有进一步提升,对于生态质量变化的信息表达存在一定局限性。从本研究结果来看,以往对云南省生态质量方面的研究集中在植被覆盖度的变化分析[18, 30]、石漠化地区的环境变化[31]、局部地区/城市生态质量的变化[11, 20]等方面,其空间分辨率与研究范围难以实现同步提升,时间序列也主要在2000年以后,很容易遗漏20世纪90年代初云南省生态质量的高位阶段以及之后10 a的高速下降阶段。

    • 植被指数是构成遥感生态指数的关键性指标之一[20]。本研究云南省生态质量动态演变特征与熊俊楠等[18]、谷雷等[30]关于云南省植被覆盖度的空间分布特征存在一定程度的吻合,其中对于2010年由于持续干旱所造成的生态质量下降缺少较为明显的体现,但这在吴月圆等[32]关于云南省近10 a植被的动态监测图中有所体现。本研究结论与赵翠娥等[33]利用生态足迹模型分析昆明市2000—2010年生态环境与发展之间的相互关系,得出“极不安全状态”的结论相类似,与农兰萍等[11]得出昆明市2000—2018年IRSEI平均值为0.51,生态质量处于一般状态(0.4~0.6)的结论相一致。

      云南省生态质量及推动变化原因主要分为决定与改变2个层面[34]:决定因子主要指脆弱的岩溶环境背景,是决定石漠化宏观生态关系乃至区域生态质量的首要因子;而改变因子主要指促使区域生态质量发生正向变化(或负向变化)的影响因素。本研究表明:1990、1995、2000、2005、2010、2015、2020年,云南省IRSEI整体变化为“W”型,优良率分别为95.82%、68.16%、34.88%、80.97%、8.83%、60.23%、88.53%,其中生态质量恢复主要为近10 a人为支持下的持续改善,生态条件转好等级上升面积占比97.56%,优良率上升79.70%;生态质量下降分为2个阶段:1990和2010年左右,前者主要受人为因素影响,而后者在人为干扰下灾害因素(干旱)是其中的关键主导因素。

      云南省岩溶石漠区原为茂盛的湿性阔叶林、半湿性阔叶林、石灰岩山地灌丛[35],从遥感观测的角度看,1990年滇东北、滇东南、滇南以及滇中的IRSEI依次为0.806、0.825、0.838、0.819;而今的石漠化景观多为人为活动强烈影响下逐步演变形成的[35],具体而言云南省省域人口密度从1990年的93.95人·km−2上升到2020年的126.96人·km−2,其中岩溶石漠化区从100.83人·km−2上升到139.13人·km−2,远超岩溶石漠化土地的生态环境承载力。对于灾害因素,2010年云南省省域范围内出现了不同程度的生态质量下降情况,其主要原因在于2009、2010、2011年是特枯水年和偏枯水年,年平均降水量较常年分别偏少24.7%、7.3%、23.0%,且时空分布不均,致使云南曲靖珠江源石漠化面积持续扩展,较2005年净增加2.8 km2,年均扩展率为6.8%,也使其成为第2次石漠化监测重点区域中,唯一的石漠化扩展区。

      随着退耕还林、退耕还草等一系列生态工程措施和政策的陆续实施[3638],农村能源结构得到调整,生物质能源(薪柴、秸秆)10 a间从44.0%下降到37.2%,农村劳动力人口发生转移,城镇化率从2010年的34.81%上升到2020年的50.05%,以及农村产业结构的改革[39],使得原本的人为干扰得以减轻,土地承载力得以缓和,植被覆盖得以全面恢复,被破坏的生态系统逐步恢复并向着良性方向发展。

    • 云南省在1990—2020年间遥感生态指数整体下降了0.038,拟合斜率为−0.008。相较于2010年的最低水平,2020年云南省遥感生态指数的优良率从8.83%上升到88.53%,生态条件转好等级上升面积为3.75×10⁵ km2,而生态质量变差等级下降面积占比仅为2.44%。从整个研究时间序列看,1990和2010年前后受人为因素和灾害因素的影响而出现生态质量的波动情况,但后续生态质量的提升还存在很大空间,其中应重点关注岩溶石漠化及气象灾害的影响。

Reference (39)

Catalog

    /

    DownLoad:  Full-Size Img  PowerPoint
    Return
    Return