Volume 41 Issue 2
Apr.  2024
Turn off MathJax
Article Contents

XU Chenkai, WANG Ke, HUANG Lu. Water pattern changes of Tongxiang City based on multi-source remote sensing data[J]. Journal of Zhejiang A&F University, 2024, 41(2): 419-428. doi: 10.11833/j.issn.2095-0756.20230288
Citation: XU Chenkai, WANG Ke, HUANG Lu. Water pattern changes of Tongxiang City based on multi-source remote sensing data[J]. Journal of Zhejiang A&F University, 2024, 41(2): 419-428. doi: 10.11833/j.issn.2095-0756.20230288

Water pattern changes of Tongxiang City based on multi-source remote sensing data

doi: 10.11833/j.issn.2095-0756.20230288
  • Received Date: 2023-05-06
  • Rev Recd Date: 2023-09-11
  • Available Online: 2024-03-21
  • Publish Date: 2024-04-01
  •   Objective  Tongxiang City of Zhejiang Province is a typical “canal town in south of the Yangtze”. Its water system has been greatly disturbed by human activities. Assessing the changes of the water system in Tongxiang is of vital importance to optimize the water pattern and enhance the sustainable development.   Method  Based on six multi-source remote sensing images and land use survey data from 1975, 1998, 2005, 2012, 2016 and 2019, the water system data were obtained by visual interpretation method. The quantitative changes in the number, structure, shape, function, and spatial distribution of rivers and ponds in Tongxiang since 1975, were studied using river network water system indicators, landscape pattern indices, and spatial overlay analysis.   Result  (1) The length and area of rivers in Tongxiang increased before 2005, declined sharply during the period of rapid urbanization, and recovered rapidly after 2016. The length and area of Class-I rivers increased in all phases, but the tributaries changed significantly. (2) The river network density, tributary development coefficient, and fractal dimension increased first, then declined, and finally increased rapidly throughout the process. The river water surface rate continued to grow but the growth rate stagnated significantly during the period of rapid urbanization. The ring degree of river network and the actual integration degree fluctuated continuously and reached its peak in 2016. (3) The variation of river network density in suburban and exurbs was much larger than that of urban areas. Before 2005, the changes of water surface rate were larger in urban area than that in exurbs and suburbs. But during the rapid urbanization period, the changes of water surface rate were larger in urban area than that of suburbs and exurbs. The changes of tributary development index was not significant in exurbs. (4) The areas of pond experienced the same process as that of the river. It first increased, then decreased and finally increased rapidly. And the structure of the pond was constantly changing. The proliferation of farming ponds was the main factor in the change of pond area. The shape of the pond became regular during the development, and its distribution gathered, then dispersed, and finally reconnected. Large-scale aggregation of the pond occurred in in the western of exurbs.   Conclusion  The changes in the water system of Tongxiang in different periods have been greatly influenced by urban development policies, mainly including urbanization development, agricultural structure adjustment, ecological governance, and restoration, and showed obvious periodicity. The characteristics of changes in plain water network cities of the same type are similar and different. [Ch, 3 fig. 8 tab. 36 ref.]
  • [1] LIN Zhouyu, HAN Renjie, LI Jian.  Courses, characteristics and motivations of spatial and temporal evolution of national forest cities in China . Journal of Zhejiang A&F University, 2024, 41(1): 183-191. doi: 10.11833/j.issn.2095-0756.20230248
    [2] ZHANG Shiwen, LI Chengrong, WANG Yan, WU Yang.  Evaluation and evolution characteristics of ecological quality in Yunnan based on long-time series satellite remote sensing . Journal of Zhejiang A&F University, 2023, 40(3): 579-588. doi: 10.11833/j.issn.2095-0756.20220439
    [3] CHEN Qi, ZHANG Chao, TIAN Xiangyun, SHI Xiaorong, ZHANG Yuwei, WANG Yan.  Spatio-temporal evolution process of rocky desertification in Yunnan Province from 2000 to 2020 . Journal of Zhejiang A&F University, 2023, 40(2): 417-426. doi: 10.11833/j.issn.2095-0756.20210806
    [4] WU Genghong, WANG Yiru, LIU Tiedong, GONG Wenfeng, LIN Shiping, CHEN Chong.  Evaluation of landscape pattern evolution and spatial configuration of urban park green space in Haikou City based on SEDMs model . Journal of Zhejiang A&F University, 2023, 40(5): 1093-1101. doi: 10.11833/j.issn.2095-0756.20220702
    [5] LI Jiahao, LIU Yuguo, ZHAO Ziqing, ZHOU Yining, XU Zihan, CHEN Xinjun, CUI Ming.  Temporal and spatial dynamic monitoring of land desertification and landscape pattern evolution characteristics in the Xiaoluan River Basin . Journal of Zhejiang A&F University, 2023, 40(6): 1322-1332. doi: 10.11833/j.issn.2095-0756.20220731
    [6] DENG Zhuo, LI Wenjing, ZHANG Yufang, DONG Ye.  Spatio-temporal evolution of ecological security pattern and its influencing factors in Tianshan-Pamir region . Journal of Zhejiang A&F University, 2023, 40(2): 398-406. doi: 10.11833/j.issn.2095-0756.20220458
    [7] XU Hao, LI Wei, LIU Wei, WANG Chengkang.  Spatio-temporal evolution of Nanjing’s urban green space pattern and its influencing factors . Journal of Zhejiang A&F University, 2023, 40(2): 407-416. doi: 10.11833/j.issn.2095-0756.20220332
    [8] LIU Yuqing, ZHANG Huabing, SUN Xiaoxiang, LI Yufeng.  Spatial-temporal variations of landscape pattern and hot spot analysis in the Lixiahe Plain of Jiangsu Province from 1980 to 2018 . Journal of Zhejiang A&F University, 2022, 39(1): 105-114. doi: 10.11833/j.issn.2095-0756.20210178
    [9] LI Yujie, LU Juan, CHEN Sijia, FU Hui.  On the spatial-temporal patterns and differentiation characteristics of thermal landscape in Haikou City . Journal of Zhejiang A&F University, 2021, 38(4): 712-722. doi: 10.11833/j.issn.2095-0756.20200648
    [10] CAO Jiashuo, DENG Zhengyu, HU Yuandong, WU Yan.  Spatial and temporal evolution and driving forces of the landscape pattern in Shennongjia Forestry District . Journal of Zhejiang A&F University, 2021, 38(1): 155-164. doi: 10.11833/j.issn.2095-0756.20200279
    [11] YU Fei, LI Zhiyong.  Forests landscape pattern changes and driving forces in Mount Tianmu . Journal of Zhejiang A&F University, 2020, 37(3): 439-446. doi: 10.11833/j.issn.2095-0756.20190306
    [12] TIAN Di, LIU Zheng, HU Yalin.  Spatial-temporal characteristics of vegetation coverage and the relationship to topographic factors in Fuzhou City . Journal of Zhejiang A&F University, 2019, 36(6): 1158-1165. doi: 10.11833/j.issn.2095-0756.2019.06.013
    [13] GUO Yujing, WANG Yan, ZHENG Yi, LIU Yungen, WEN Guojing, ZHAN Pengfei.  Temporal and spatial evolution of landscapes in Jianhu Lake Basin of northwestern Yunnan Province . Journal of Zhejiang A&F University, 2018, 35(4): 695-704. doi: 10.11833/j.issn.2095-0756.2018.04.015
    [14] DUAN Yanbo, LEI Yakai, MA Ge, WU Baojun, TIAN Guohang.  Spatio-temporal dynamics of ecosystem service value in Zhengzhou . Journal of Zhejiang A&F University, 2017, 34(3): 511-519. doi: 10.11833/j.issn.2095-0756.2017.03.017
    [15] WEN Guojing, LIU Yungen, WANG Yan, HOU Lei, WANG Yanxia, GUO Yujing.  Temporal and spatial evolution of landscape patterns and ecological risk in the Puzhehei Lake basin . Journal of Zhejiang A&F University, 2017, 34(6): 1095-1103. doi: 10.11833/j.issn.2095-0756.2017.06.018
    [16] WANG Guoxin, YANG Xiaona, SU Fei.  Spatial-temporal distribution of mountain-climate tourism resources in Lin’an, China . Journal of Zhejiang A&F University, 2015, 32(2): 298-307. doi: 10.11833/j.issn.2095-0756.2015.02.019
    [17] YANG Zi-qing, CHEN Ping-liu, LIU Jian, YU Kun-yong, LIAO Xiao-li, YOU Hao-chen, GONG Cong-hong.  Spatio-temporal variation of distribution patterns in Cunninghamia lanceolata plantations . Journal of Zhejiang A&F University, 2012, 29(3): 374-382. doi: 10.11833/j.issn.2095-0756.2012.03.008
    [18] CHEN Chun-lei, WU Gang.  Choice of optimal scale for multi-source remote sensing images . Journal of Zhejiang A&F University, 2011, 28(1): 164-172. doi: 10.11833/j.issn.2095-0756.2011.01.027
    [19] GUO Zheng, JIANG Hong, CHEN Jian, CHENG Miao-miao, JIANG Zi-shan, YU Shu-quan, LI Tu-sheng.  Forest landscape analysis with remote sensing data for Yuhang,Zhejiang Province . Journal of Zhejiang A&F University, 2010, 27(1): 36-43. doi: 10.11833/j.issn.2095-0756.2010.01.006
    [20] XU Yong, YE Zheng-qian, JIANG Pei-kun, ZHOU Guo-mo, WU Jia-sen, YAO Fang.  Spatio-temporal variations and cause analysis of headwater quality in forest area of Taihuyuan . Journal of Zhejiang A&F University, 2009, 26(5): 607-612.
  • [1]
    LUO Yinghan, LIU Chang, TIAN Guoxing. Interaction between urban development and river network evolution: a case study in main urban area of Zhengzhou City [J]. Bulletin of Soil and Water Conservation, 2021, 41(2): 258 − 266.
    [2]
    YANG Long, TIAN Fuqiang, NIYOGI D. A need to revisit hydrologic responses to urbanization by incorporating the feedback on spatial rainfall patterns [J]. Urban Climate, 2015, 12: 128 − 140.
    [3]
    HORTON R E. Erosional development of streams and their drainage basins; hydrophysical approach to quantitative morphology [J]. Bulletin of the Geological Society of America, 1945, 56(3): 275 − 370.
    [4]
    STRAHLER A N. Quantitative analysis of watershed geomorphology [J/OL]. Transactions, American Geophysical Union, 1957, 33(6): 913[2023-04-30]. doi: 10.1029/TR038i006p00913.
    [5]
    BEVAN V, MACVICAR B, CHAPUIS M, et al. Enlargement and evolution of a semi-alluvial creek in response to urbanization [J]. Earth Surface Processes and Landforms, 2018, 43(11): 2295 − 2312.
    [6]
    JOHNSON P, ROYALL D. Evaluating the effects of urbanization age on the morphology of low-order urban streams in the US southern Piedmont [J]. Physical Geography, 2019, 40(1): 1 − 27.
    [7]
    JULIAN J P, WILGRUBER N A, de BEURS K M, et al. Long-term impacts of land cover changes on stream channel loss [J]. Science of the Total Environment, 2015, 537: 399 − 410.
    [8]
    VICENTE M L, ROMERO E N, CAMMERAAT E. Hydrological connectivity does change over 70 years of abandonment and afforestation in the Spanish Pyrenees [J]. Land Degradation &Development, 2017, 28(4): 1298 − 1310.
    [9]
    DENG Xiaojun. Correlations between water quality and the structure and connectivity of the river network in the southern Jiangsu Plain, Eeastern China [J]. Science of the Total Environment, 2019, 664: 583 − 594.
    [10]
    FU Chun, LI Yunyi, WANG Shitao. Analysis of water system structure and connectivity in the center of Nanchang under the urbanization process [J]. Resources and Environment in the Yangtze Basin, 2017, 26(7): 1042 − 1048.
    [11]
    LI Jingbao, YU Dandan, ZHANG Rui, et al. Evolution characteristics of river network of the three estuaries of southern Jing River in the past 61 years [J]. Resources and Environment in the Yangtze Basin, 2019, 28(5): 1214 − 1224.
    [12]
    LI Ziyi, XU Youpeng, HE Yuxiu, et al. Changes of plain river network and its spatial responses to urbanization [J]. Acta Ecologica Sinica, 2021, 41(22): 8953 − 8964.
    [13]
    DOU Ming, JIN Meng, NIU Xiaotai, et al. Analysis of evolution characteristics of urban water system form based on remote sensing data [J]. Engineering Journal of Wuhan University, 2016, 49(1): 16 − 21.
    [14]
    GAO Qingfeng, GUO Sheng, QUE Zhixia, et al. Analysis on evolution characteristics of structural pattern of urban water system: a case of main urban area of Harbin [J]. Water Resources and Hydropower Engineering, 2018, 49(7): 54 − 61.
    [15]
    JIANG Qi, ZHENG Bohong. The relationship between the change of water system and the urban land expansion in Changsha [J]. Journal of Natural Resources, 2019, 34(7): 1429 − 1439.
    [16]
    XU Xiaolu, HAO Li’ na, LIU Hanhu, et al. Evolution of river network system in the mountain excavation and city construction in Yan’ an New District [J]. Journal of Henan Polytechnic University (Natural Science), 2022, 41(4): 72 − 79.
    [17]
    WU Lijun, HU Kang, JI Hongyu, et al. Influence of urbanization on river network evolution in Fuzhou City [J/OL]. Journal of Hydroecology, 2022[2023-04-30]. doi:10.15928/j.1674-3075.202206090219.
    [18]
    YAN Chunjun, YANG Daqing. Analysis on change characteristics of river network of Shanghai City and its response to urbanization [J]. Yangtze River, 2014, 45(11): 40 − 43.
    [19]
    LIN Zhixin, XU Youpeng, DAI Xiaoying, et al. Effect of urbanization on the river network structure and functions: a case study in Suzhou City [J]. Journal of Lake Sciences, 2018, 30(6): 1722 − 1731.
    [20]
    LIU Haizhen, XU Youpeng, LIN Zhixin, et al. Change of river structure and hydrological connectivity in Wu-Cheng-Xi-Yu Region of the Taihu Lake Plain [J]. Resources and Environment in the Yangtze Basin, 2021, 30(5): 1069 − 1075.
    [21]
    HU Jiayu, LIU Bingjun. Analysis of river network changes based on spatial auto-regression and geographic weighted regression model [J]. Journal of China Hydrology, 2019, 39(2): 7 − 13.
    [22]
    LIU Guodong, TIAN Kun, YUAN Xingzhong, et al. Traditional Chinese ecological wisdom and its practical meaning: a case study of the river system in Lijiang Old Town [J]. Acta Ecologica Sinica, 2016, 36(2): 472 − 479.
    [23]
    WANG Min, YE Qinyan, HELD T. Riparian zones management with effective eco-services provision under the interaction of stakeholders: a case study of the Emscher River in Germany [J]. Landscape Architecture, 2017(1): 52 − 59.
    [24]
    LÜ Huihua, ZHOU Feng, LI Na, et al. Evolution characteristics of the river network in the typical area of Lixiahe Region [J]. Resources and Environment in the Yangtze Basin, 2018, 27(2): 380 − 385.
    [25]
    DENG Xiaojun, XU Youpeng, HAN Longfei, et al. Spatial-temporal changes of river systems in Jiaxing under the background of urbanization [J]. Acta Geographica Sinica, 2016, 71(1): 75 − 85.
    [26]
    LIN Zhixin, XU Youpeng, DAI Xiaoying, et al. Effect of Urbanization on the plain river network structure in the lower reaches of the Yangtze River [J]. Resources and Environment in the Yangtze Basin, 2019, 28(11): 2612 − 2620.
    [27]
    XU Yaochen, LIU Bi, LU Huan, et al. Reconstruction of landscape pattern based on CORONA KH-4B image: a case study in Xixi Wetland, Hangzhou [J]. Journal of Zhejiang University (Engineering Science), 2018, 52(11): 2233 − 2242.
    [28]
    SCHULLER D J, RAO A R, JEONG G D. Fractal characteristics of dense stream networks [J]. Journal of Hydrology, 2001, 243(1/2): 1 − 16.
    [29]
    HAN Longfei, XU Youpeng, SHAO Yulong, et al. Effect of urbanization on the stream structure and connectivity: a case study in the mid-lower reaches of the Qinhuai River [J]. Journal of Lake Sciences, 2013, 25(3): 335 − 341.
    [30]
    TARBOTON D G, BRAS R L, RODRIGUEZ-ITURB I. The fractal nature of river networks [J]. Water Resources Research, 1988, 24(8): 1317 − 1322.
    [31]
    CHEN Wenbo, XIAO Duning, LI Xiuzhen. Classification, application, and creation of landscape indices [J]. Chinese Journal of Applied Ecology, 2002, 13(1): 121 − 125.
    [32]
    WU Yani. The Study of Spatial and Temporal Changes in Water Systems of Tongxiang Based on Remote Sensing [D]. Hangzhou: Zhejiang University, 2020.
    [33]
    LI Hui. Survey of Population Urbanization in China [J]. Population Journal, 2003(6): 51 − 58.
    [34]
    SHAO Yulong, XU Youpeng, MA Shuangshuang. Change of river structure and stream network connectivity in the Taihu Lake Basin under the urbanization development: a case study in urban Suzhou [J]. Resources and Environment in the Yangtze Basin, 2012, 21(10): 1167 − 1172.
    [35]
    YANG Liu, XU Youpeng, HAN Longfei, et al. River networks system changes and its impact on storage and flood control capacity under rapid urbanization [J]. Hydrological Processes, 2016, 30(13): 2401 − 2412.
    [36]
    HAN Longfei, XU Youpeng, YANG Liu, et al. Temporal and spatial change of stream structure in Yangtze River Delta and its driving forces during 1960s−2010s [J]. Acta Geographica Sinica, 2015, 70(5): 819 − 827.
  • 加载中
通讯作者: 陈斌, bchen63@163.com
  • 1. 

    沈阳化工大学材料科学与工程学院 沈阳 110142

  1. 本站搜索
  2. 百度学术搜索
  3. 万方数据库搜索
  4. CNKI搜索

Figures(3)  / Tables(8)

Article views(139) PDF downloads(25) Cited by()

Related
Proportional views

Water pattern changes of Tongxiang City based on multi-source remote sensing data

doi: 10.11833/j.issn.2095-0756.20230288

Abstract:   Objective  Tongxiang City of Zhejiang Province is a typical “canal town in south of the Yangtze”. Its water system has been greatly disturbed by human activities. Assessing the changes of the water system in Tongxiang is of vital importance to optimize the water pattern and enhance the sustainable development.   Method  Based on six multi-source remote sensing images and land use survey data from 1975, 1998, 2005, 2012, 2016 and 2019, the water system data were obtained by visual interpretation method. The quantitative changes in the number, structure, shape, function, and spatial distribution of rivers and ponds in Tongxiang since 1975, were studied using river network water system indicators, landscape pattern indices, and spatial overlay analysis.   Result  (1) The length and area of rivers in Tongxiang increased before 2005, declined sharply during the period of rapid urbanization, and recovered rapidly after 2016. The length and area of Class-I rivers increased in all phases, but the tributaries changed significantly. (2) The river network density, tributary development coefficient, and fractal dimension increased first, then declined, and finally increased rapidly throughout the process. The river water surface rate continued to grow but the growth rate stagnated significantly during the period of rapid urbanization. The ring degree of river network and the actual integration degree fluctuated continuously and reached its peak in 2016. (3) The variation of river network density in suburban and exurbs was much larger than that of urban areas. Before 2005, the changes of water surface rate were larger in urban area than that in exurbs and suburbs. But during the rapid urbanization period, the changes of water surface rate were larger in urban area than that of suburbs and exurbs. The changes of tributary development index was not significant in exurbs. (4) The areas of pond experienced the same process as that of the river. It first increased, then decreased and finally increased rapidly. And the structure of the pond was constantly changing. The proliferation of farming ponds was the main factor in the change of pond area. The shape of the pond became regular during the development, and its distribution gathered, then dispersed, and finally reconnected. Large-scale aggregation of the pond occurred in in the western of exurbs.   Conclusion  The changes in the water system of Tongxiang in different periods have been greatly influenced by urban development policies, mainly including urbanization development, agricultural structure adjustment, ecological governance, and restoration, and showed obvious periodicity. The characteristics of changes in plain water network cities of the same type are similar and different. [Ch, 3 fig. 8 tab. 36 ref.]

XU Chenkai, WANG Ke, HUANG Lu. Water pattern changes of Tongxiang City based on multi-source remote sensing data[J]. Journal of Zhejiang A&F University, 2024, 41(2): 419-428. doi: 10.11833/j.issn.2095-0756.20230288
Citation: XU Chenkai, WANG Ke, HUANG Lu. Water pattern changes of Tongxiang City based on multi-source remote sensing data[J]. Journal of Zhejiang A&F University, 2024, 41(2): 419-428. doi: 10.11833/j.issn.2095-0756.20230288
  • 河湖水系维系着城市生态系统的稳定与发展,同时肩负着行洪排涝、蓄水调节的功能,是城市水资源的重要载体,是生态环境的重要组成部分,是经济社会发展的重要支撑[1]。随着城市化进程的推进,人类活动严重影响了城市原有的水系格局,部分区域水质恶化、连通受阻、抵御灾害能力减弱,引起了一系列水生态、水安全问题,制约了城市的可持续发展[2]。因此,研究水系在城市发展中的演变规律已成为地理、水文、生态和城乡规划等多学科交叉的热点问题。

    国外学者早在20世纪50年代就提出了HORTON定律[3]和 STRAHLER分级法[4],并广泛运用于自然河道的提取与分级排序工作中,为河流结构研究奠定了基础。他们侧重于预测流域河道形态的变化,常采用时空替代、相关性分析、回归分析等方法构建河流演变模型,研究河流对城市化的响应规律[56]。一些学者总结了流域内的河流损失与土地利用变化相关的时空模式[7],另一些学者关注城市水系变化的驱动因素,发现人类工程活动是城市发展中造成河流变化的主要原因[8],并发现主干河流的修复对城市水系重构有积极的影响[9]。相比之下,国内的研究起步较晚,一开始侧重于研究水系的演变规律。通过获取各时期城市内的河流信息化数据,使用水系指数法、多重分形理论、地理加权模型等方法研究水系时空变化特征以及城市化下的空间响应[1017],研究区多集中在长江三角洲[1820]、珠江三角洲[21]等城镇化发展较好且水网密布的平原地区。近年来,研究开始逐渐转向水生态文明城市概念和内涵的探讨[2223]。当前对水系演变的研究由于数据的局限性,历史水系数据都是将地方行政部门提供的纸质地形图进行数字化获得,主要分析大面积流域内主干河流的宏观变化特征[2426],忽视了细小径流在历史进程中的变化。同时现有研究大多关注河流及总水面的变化,较少考虑水系类型特别是池塘的变化,研究的详细性和系统性不足。如今,随着美国锁眼侦查卫星影像[27]以及航摄相片的解密,可以获得20世纪较高分辨率的影像数据。本研究通过土地利用调查数据与影像数据目视解译相结合的方式提取研究区的水系数据,同时将水系根据功能进一步划分成主干河流、支流、景观池塘、坑塘水面、养殖坑塘,使研究小区域范围水系的精细布局与变化成为了可能。桐乡市水乡特色鲜明,随着工业化、城市化的快速发展,不少池塘和河流因发展空间和耕地占补平衡的需要而消失。定量研究桐乡市改革开放以来各时期的水系演变特征与驱动原因,分析水乡城市水系历史演变规律,对高水平建设现代江南水乡、城市可持续发展等具有重要指导和应用价值。

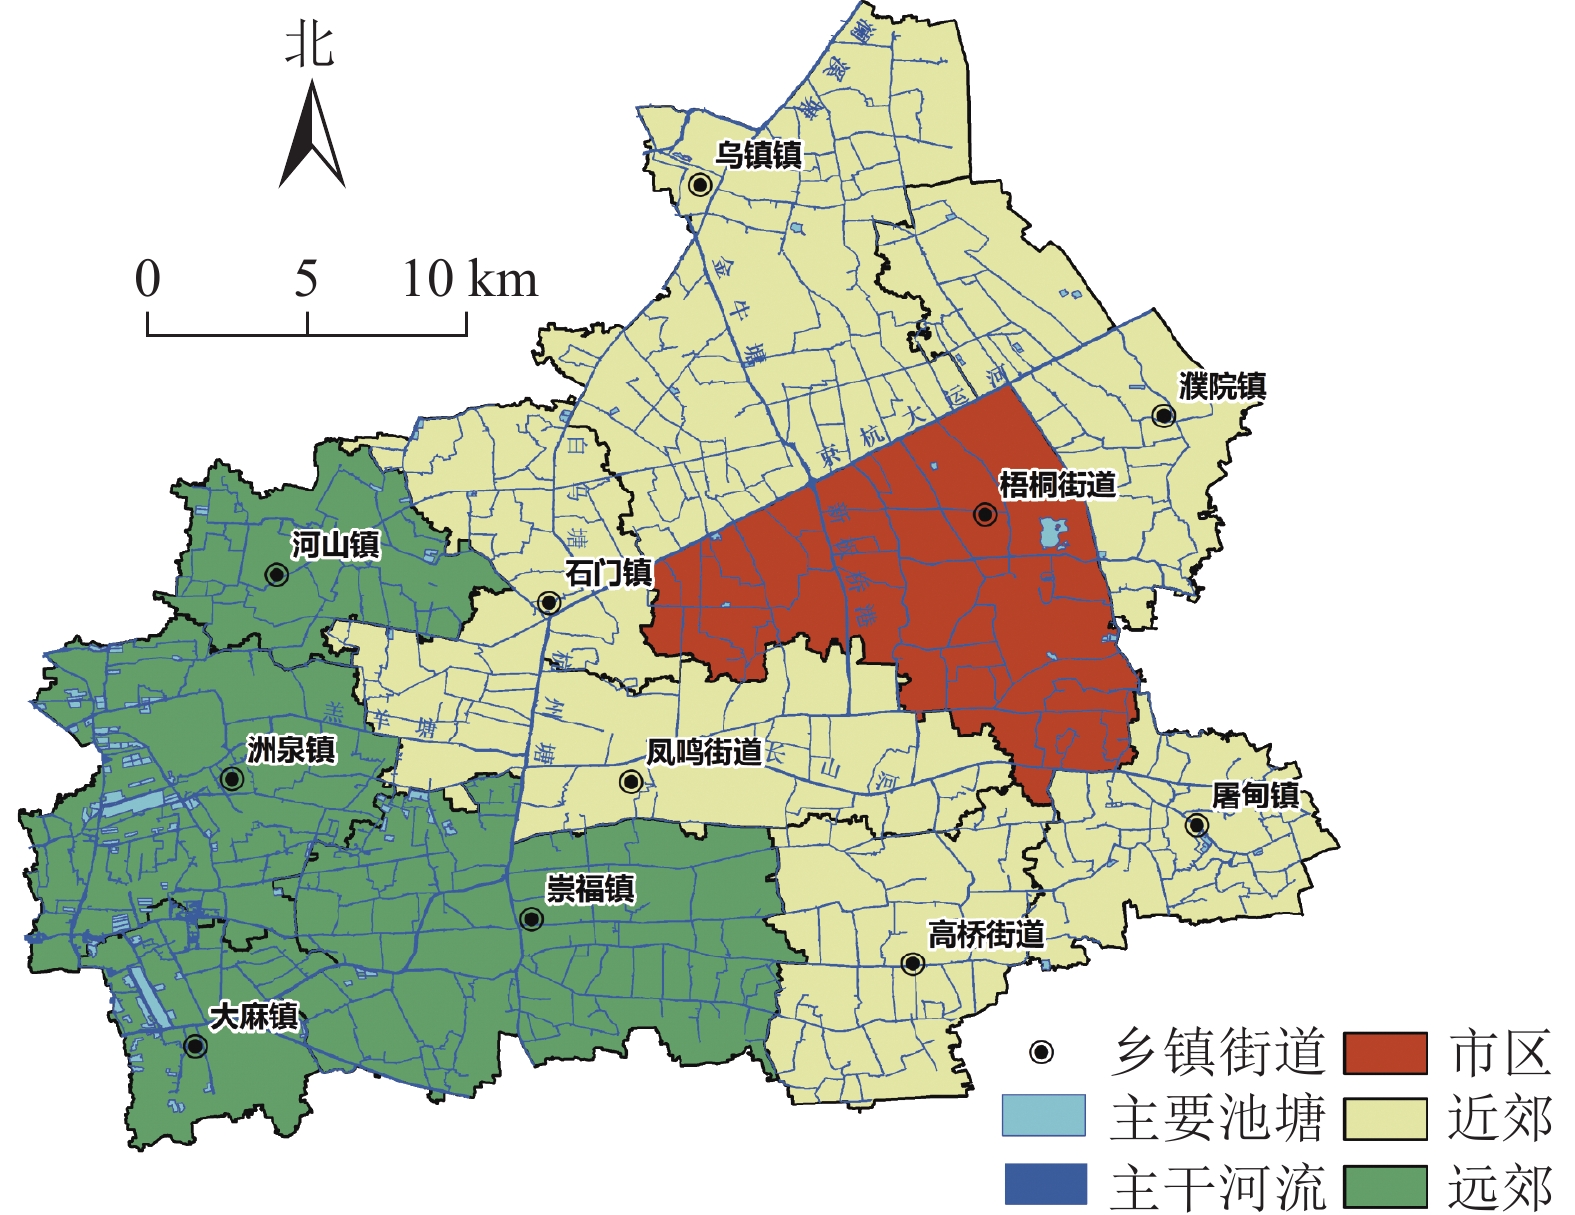
    • 浙江省嘉兴市桐乡市位于浙北平原地区,杭嘉湖平原腹地,30°28′~30°48′N,120°17′~120°40′E,行政区下辖3个街道和8个乡镇。为了分析研究区内水系演变在城市化程度不同区域内的演变特征,定义市政府所在的梧桐街道为市区,与市区直接接壤的6个街道与乡镇为近郊,远离市区不直接与之相邻的4个乡镇为远郊。桐乡市境内河流属长江流域太湖运河水系,京杭大运河斜贯全境,全市有骨干河道47条,组成纵横交错的水利引排灌溉渠道和水上运输网络。桐乡市行政区划分与城市主要水系分布见图1

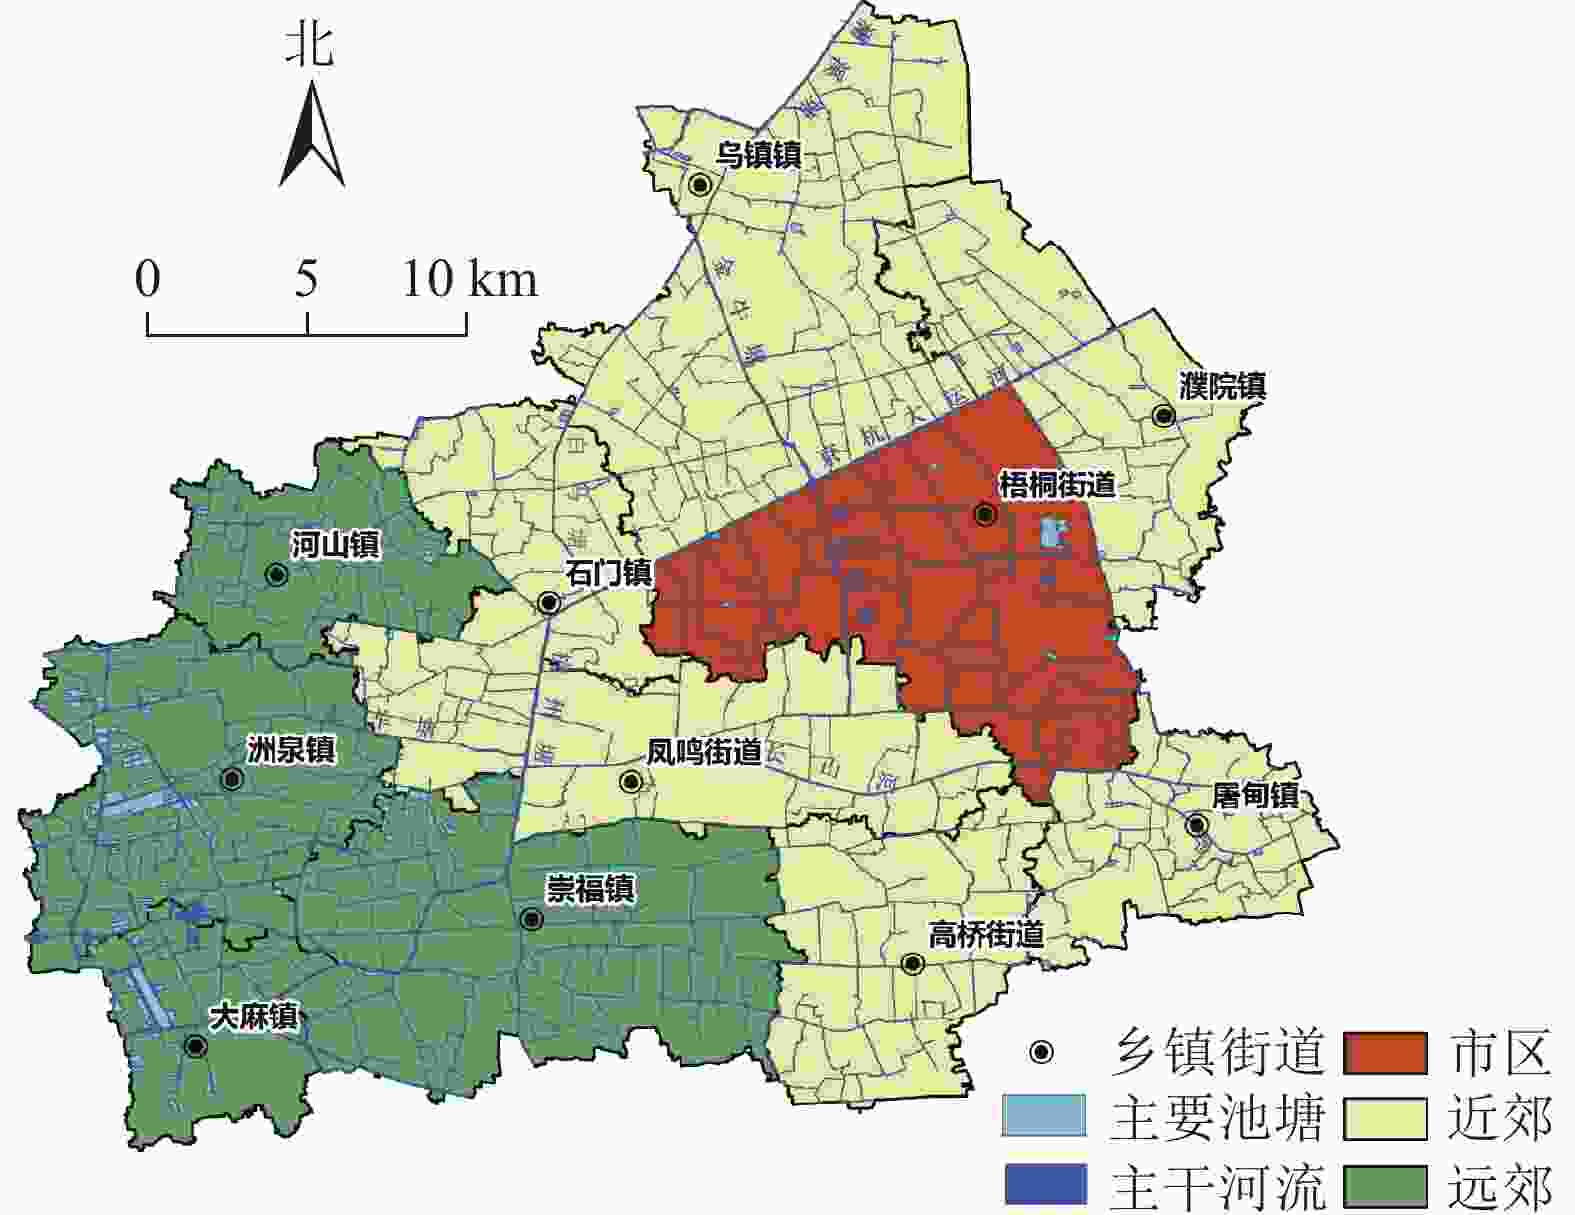
      Figure 1.  Overview of Tongxiang City and the distribution of major water systems

    • 考虑到数据的可获得性以及桐乡市不同阶段发展政策的差异,选取了1998、2005、2012、2019年4个时间节点。通过新闻报道和对当地居民的调研,发现桐乡市居住区的水环境在2016年前后发生了明显变化,因此,将2016年作为2012—2019年的中间节点,并将其纳入到分析过程中。为了准确了解改革开放前的水系格局,选择经过解密的美国锁眼侦查卫星KH-9在1975年的影像作为原始对照。选取的影像数据成像时间均为当年的冬季,云量小于10%,具体参数与来源信息说明详见表1

      影像名称成像年份空间分辨率/(m×m)来源
      锁眼侦查卫星KH-9影像 1975 6×6 美国地质勘探局(USGS)
      浙江省黑白航摄相片 1998 1×1 桐乡市自然资源和规划局
      土地变更调查全彩航摄相片 2005 1×1 桐乡市自然资源和规划局
      资源三号卫星影像 2012 2×2 桐乡市自然资源和规划局
      高分二号卫星影像 2016 1×1 中国资源卫星应用中心
      高分二号卫星影像 2019 1×1 中国资源卫星应用中心

      Table 1.  Sources and descriptions of the image data used

      以不同时期土地利用调查数据为基础,通过对遥感影像的目视解译来提取不同时期的水系数量和分布数据。1975年水系面状矢量数据以可获取的最早土地利用调查数据(1988 年)为底图,通过遥感影像目视解译获取。另外5期的水系面状矢量数据以对应年份的研究区土地利用变更调查数据(1998、2005、2012、2016年)、第3次全国土地调查数据(2019年)为基础目视解译获取。在 ArcGIS 中将解译得到的面状河流水系转换为栅格,使用软件中针对栅格的中心线自动捕捉工具获取线性河流矢量数据,对自动提取的结果进行手动修正,提高数据的准确度。河流面积和河流长度分别指河流水面面积和河流中心线长度,使用河流水系面状矢量与线性矢量计算获得。

      池塘的实际功能一般分为景观池塘、坑塘水面和养殖坑塘。由于土地利用调查数据中已有坑塘水面与养殖坑塘2类数据,因此本研究在分类时直接参考了这2类池塘。目视解译获取的新增池塘,通过比对同期确定功能的池塘的形态、结构及周边地类分布情况来判断其是否为养殖坑塘。同时,本研究将公园绿地和旅游景区内部的池塘水面归类为景观池塘。

      各时期的水系数据在进行目视解译时均由当地政府提供的土地利用调查数据为基础,真实性高,精度可满足后续的研究要求。本研究使用的所有土地利用调查数据与村镇级行政区矢量数据均由桐乡市自然资源和规划局提供。

    • 考虑到水系的景观生态功能与社会属性,以河道的平均宽度作为划分依据,对河流进行了分级[12, 20]。其中,将河道平均宽度大于40 m的河流定为Ⅰ级河流, 20~40 m为Ⅱ级,小于20 m定为Ⅲ级。Ⅰ级与Ⅱ级河流统称为主干河流,构成了研究区水系的骨架。

      针对平原水系的特征,参考国内外相关研究常用的水系特征参数与表征指标[2830],选用统一的指标识别并定量评价不同时期桐乡市河网水系格局。选取的河网结构指标包括描述河网数量特征的河网密度(Dr)、河网水面率(Wp);描述河网形态特征的支流发育系数(K)、分形维度(D0);描述河网连通性的水系环度(α)、实际结合度(γ)。由于池塘在空间中分散且相互之间不连通,为了分析池塘分布结构和形态的变化特征,本研究采用景观格局指数法[31] 对池塘斑块进行了定量计算。选用的景观指数包括景观形状指数(LSI)、几何最近邻距离加权平均指数(ENNAW)和聚合度指数(AI)。

    • 按照河流功能与宽度对桐乡市的河流进行分级,统计各级河流在历史各时期的长度和面积变化(表2)。桐乡市的主干河流在1998年相较1975年增加了8.29%的长度和30.95%的面积,其中Ⅰ级河流的长度增加了102.40%。尽管Ⅰ级河流数量最少,但在1998—2016年,桐乡市Ⅰ级河流长度持续增加,仅在2016—2019年略微减小。在40 a间,Ⅱ级河流的长度和面积不断波动,总体略有减小,其中长度和面积的降幅分别为6.25%和10.62%。支流是桐乡市河流水系变化的主要因素,其长度在所有河流中占比最大,各时期变化幅度也较为明显。仅有1975和2005年,支流面积大于主干河流,其余年份支流面积均小于主干河流。在2012和2019年,支流长度和面积接近,但整个过程中有明显减小和重新增加的趋势。

      河流等级河流长度/km河流面积/km²
      197519982005201220162019197519982005201220162019年
      主干河流 58.18 117.76 135.87 149.46 179.12 167.22 3.13 6.09 7.77 8.44 8.81 9.78
      511.75 499.41 415.77 470.95 389.83 468.20 12.28 14.09 11.12 12.50 10.38 12.59
      合计 569.93 617.17 551.64 620.42 568.95 635.41 15.41 20.18 18.89 20.94 19.19 22.37
      支流   1 334.27 1 468.52 1 857.79 1 489.56 1 188.54 1 508.65 22.51 19.75 21.22 20.17 16.71 20.11
        总计 1 904.20 2 085.69 2 409.43 2 109.98 1 757.49 2 144.06 37.92 39.93 40.12 41.11 35.90 42.47

      Table 2.  Changes in length and area of rivers at all levels

    • 采用水系指数法对桐乡市各时期的河网数量、结构、连通性特征的各项指标进行定量计算。根据表3可知:桐乡市的各项河网结构指标在2019年较1975年均有所增加,其中河网密度增加了12.64%,河流水面率上升了12.12%,支流发育系数增加了1.30%,分形维度增加了3.97%,水系环度和实际结合度则基本保持一致。桐乡市的河网密度和河流水面率在1975—1998年均呈增长趋势,但同时支流发育系数和分形维度的变化并不明显。1998—2005年,桐乡市的河网密度继续增加,增长率达9.58%,但河流水面率基本保持稳定,同时支流发育系数增幅达41.60%,河网连通性也恢复到了30 a前的水平。

      年份Dr/(km·km−2)Wp/%KD0αγ
      19752.615.202.341.260.530.69
      19982.865.482.381.250.490.66
      20053.315.503.371.400.530.68
      20122.895.642.401.260.490.66
      20162.414.922.091.280.560.71
      20192.945.832.371.310.520.68
        说明:Dr为河网密度;Wp为河网水面率;K为支流发育系数;D0为分形维度;α为水系环度;γ为实际结合度。

      Table 3.  Changes in parameters of river network structure indicators

      2005—2012年,桐乡市的河网密度、支流发育系数、分形维度、水系环度、实际结合度都急剧下降。城区河道重新规划布局,导致市内主干河流持续增长。由于主干河道宽度较大,尽管河网密度急剧下降,但桐乡市的河流水面率在2012年并未下降,这说明河网主干化和单一化的趋势更加明显。

      2012—2016年,桐乡市的河网密度和水面率分别下降了16.61%和12.77%,而支流发育系数则减小了12.92%。与此同时,河流的分形维度、水系环度和实际结合度也显著增加。2016—2019年,桐乡市的河流密度和河流水面率分别增加了21.99%和18.50%,其中河流水面率到2019年已经达到历史最高值(5.83%)。在这一阶段,支流发育系数和分形维度也恢复增加,整体呈现出向好的发展态势。

    • 定量计算桐乡市城市各区域在各个阶段的河网数量特征变化,得到了城市不同区域河网密度与河流水面率的变化情况,具体结果见表4。支流发育系数是评估人为工程对河流改造的主要指标,以城市区域作为划分标准,探究各时期该指标在空间上的数值大小差异,具体结果见表5。1975—1998年,桐乡市的河网密度与河流水面率变化情况相同。近郊区域的支流发育系数受工程影响变化显著,从4.86减小为3.66,减少了约25%。1998—2005年,各区域河网密度均发生增加,涨幅近郊>远郊>市区。近郊河网发育系数快速回升,达到30 a前的水平。2005年后,桐乡市开始进行城市改建与扩张,导致所有区域河网密度显著减小。但由于防涝的需要,桐乡市的主干河流在城市化建设中进一步提升宽度,各区域河流水面率不降反升。这一阶段也是河网发育系数衰减最为剧烈的时期,衰减幅度市区>近郊>远郊。这与城市扩张的方向相吻合,因为建设用地的扩张往往导致低等级的河流被填埋或转入地下。2012—2019年,桐乡市开始对市内水环境进行修复,各区域的支流发育系数降速得到了遏制,远郊区域甚至有一定的回升。40多年的发展过程中,市区、近郊和远郊的支流发育系数分别减小了62.68%、34.98%和21.24%。1975年,市区的支流发育系数约为远郊的2倍,并与近郊相当,但到2019年时,市区的数值仅为近郊的一半。

      城市区域河网密度变化率/%河流水面率变化率/%
      1975—19981998—20052005—20122012—20191975—19981998—20052005—20122012—2019年
      市区3.171.69−7.365.665.04−11.9324.58−5.13
      近郊6.6015.28−11.594.132.08−0.382.594.40
      远郊9.5212.80−7.992.464.086.850.030.72

      Table 4.  Change rate of river network density in different regions

      城市区域支流发育系数
      19751998200520122019年
      市区4.264.113.331.921.59
      近郊4.863.664.993.233.16
      远郊2.262.212.101.741.78

      Table 5.  Development coefficient of tributaries in different regions

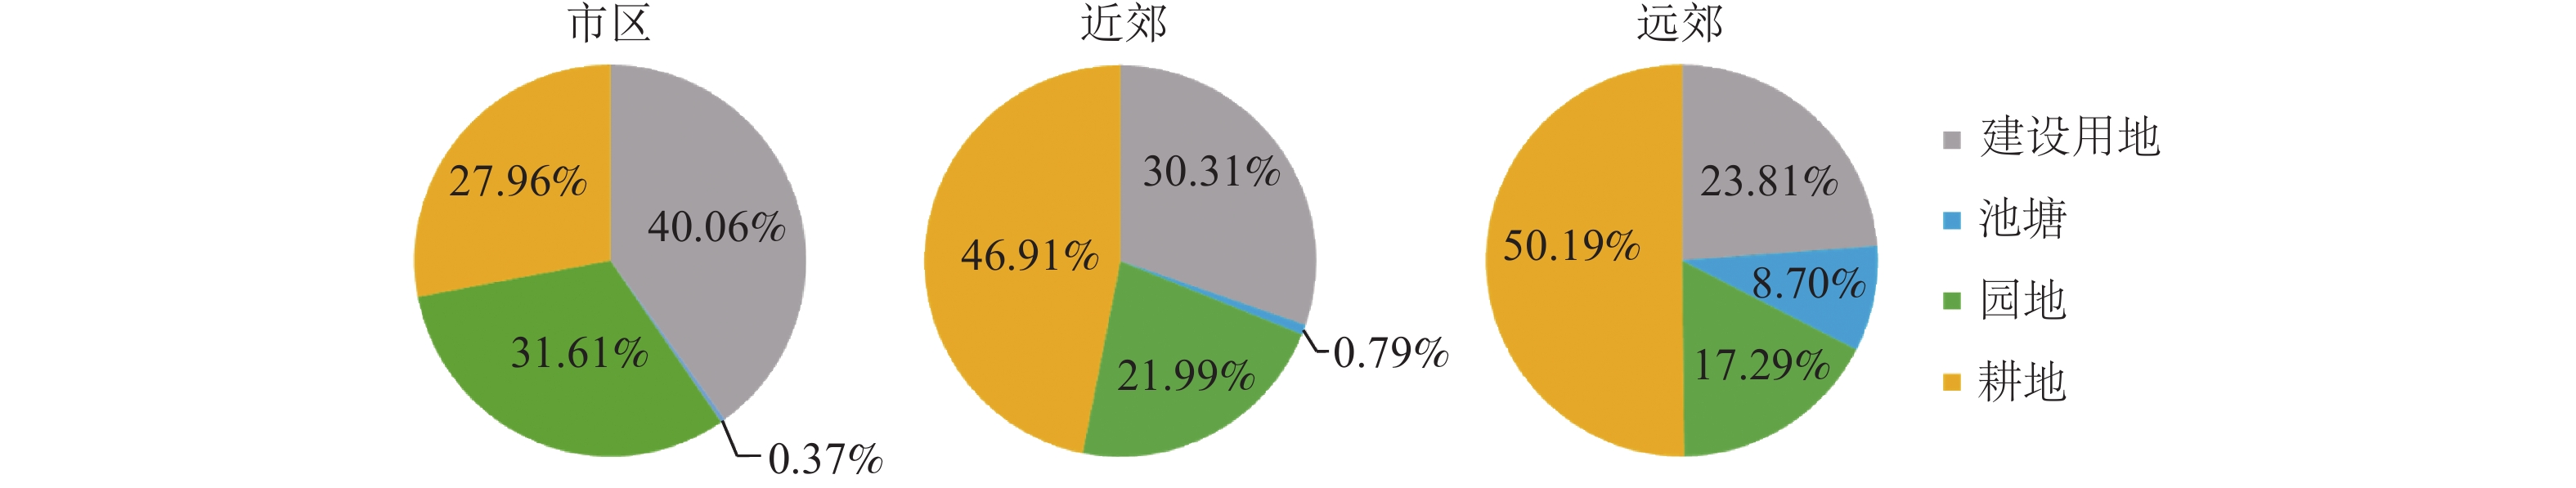
      2005—2012年,受到快速城镇化的影响,桐乡市的河流数量明显减少。通过计算各区域单位面积内河流水面被转化为其他地类的面积占比,可以发现这种趋势。由图2可见:在市区内,建设用地的增长是导致河流转出的最主要原因,其次是园地,这两者合计占到了转出河流面积的70%。在近郊和远郊,耕地是河流转出最多的地类,占总值的一半。远郊区域是桐乡市主要的水产养殖片区,当地居民利用天然河流水面围建鱼塘进行养殖,在建设过程中有8.68%的转出河流变成了池塘。

      Figure 2.  Proportion of land types transferred out of river water surface in Tongxiang City between 2005 and 2012

    • 表6分析可知:桐乡市池塘水系面积在40多年的发展过程中迅速增长。截至2019年,池塘水系的总面积已经达到了1975年的9倍。1975年,桐乡市仅有少量的坑塘水面,到1998年时池塘水系的总面积变化不显著,但水面结构组成发生了较大的变化,养殖坑塘的面积占到了总面积的68.60%。1998—2005年,池塘水面总量增加了约300%,同时水面结构组成基本保持不变。2005—2012年,坑塘水面大量消失,面积衰减了64.06%,养殖坑塘面积的增加并不显著,桐乡市池塘水面总量整体减少,与河网的变化特征基本吻合。2012—2019年,坑塘水面面积增长了3倍,景观池塘的增长速度达到了历史高值,池塘面积总量完成了翻倍。

      池塘类型池塘水系面积/km²
      197519982005201220162019年
      景观池塘0.2820.3090.7980.846
      坑塘水面3.1091.0133.6891.3260.9635.357
      养殖坑塘2.2389.0279.78713.77520.930
      总计  3.1093.25112.99711.42215.53627.132

      Table 6.  Area of various pond systems in Tongxiang City

      表7可知:在1975年,桐乡市池塘水面的聚合度指数最低,而几何最近邻距离加权平均指数达264.04 m,这表明在自然状况下桐乡市的天然坑塘处于无序排布的状态,景观的邻近度、离散度和聚集度均处于较差的水平。在接下来的20余年间,池塘景观形状指数从49.29下降至27.12,这说明在天然坑塘转化为养殖坑塘的过程中,池塘的形状通过人工改造变得更加规整。到2005年,由于湖泊、鱼塘与稻田的紧密排布,池塘斑块的几何最近邻距离加权平均指数达到了历史最低,为66.92 m,同时景观形状指数达到最高值,为91.70。随着末级支流与池塘的大量填埋,至2012年桐乡市池塘的分布重新变得离散。由于形状规整的人工鱼塘在池塘占比中的提高,景观形状指数重新降至低值。到2019年,桐乡市池塘景观通过各项工程得到了较好的治理,斑块间连片性明显提高,呈现聚集分布的态势,同时景观形状指数也恢复至40 a前的水平。

      年份LSIENNAW/mAI
      197549.29264.0484.62
      199827.12292.1092.74
      200591.7066.9287.38
      201228.28184.7595.96
      201634.23139.2895.19
      201949.4287.9295.47
        说明:LSI为景观形状指数;ENNAW为几何最近邻距离加权平均指数;AI为聚合度指数。

      Table 7.  Changes in the landscape index of pond

    • 根据表8可知:1975—1998年,桐乡市区和近郊池塘水面率快速下降,远郊池塘水面率上升。1998—2005年,所有乡镇池塘水面率均显著上升,其中市区>近郊>远郊。2005—2012年,随着城市的高速扩张,桐乡市区和近郊的池塘开始快速衰减,其中近郊的衰减幅度大于市区,整体衰减幅度达47.15%。远郊地区由于西部池塘聚集区的向外扩散,池塘水面率依旧保持上升,但相对上一阶段升速减缓。2012—2019年,各区域池塘水面率恢复上升,市区增加的多为景观池塘,近郊多为坑塘水面,远郊以养殖坑塘为主。由于各区域池塘基数差距明显,因此上升率依然是市区>近郊>远郊。

      城市
      区域
      池塘水面率变化率/%
      1975—19981998—20052005—20122012—2019年
      市区−52.55445.40−31.73319.70
      近郊−20.37348.20−47.15204.50
      远郊103.41288.3511.98107.80

      Table 8.  Change rate of pond area in different regions

      采用与河流相同的研究方式,对2005—2012年池塘水面衰减的空间规律进行了分析,计算了各区域单位面积内池塘水面转化为其他地类的面积占比。由图3可知:消失的池塘主要被转变为耕地和建设用地,而市区的转化比例则明显高于其他地区。近郊和远郊的池塘转化结构相似,各土地类型的比例差异不大。与河流不同,池塘消失后转化为园地的比例极低,在近郊和远郊却有一定数量的池塘被人工开挖成为新的河流水面。

      Figure 3.  Proportion of land types transferred out of pond water surface in Tongxiang City between 2005 and 2012

    • 桐乡市的水系变化模式具有明显的地方特色,受区域政策的影响,在不同时间段呈现不同的变化特征,与同类型平原水网城市存在异同。本研究分析总结了桐乡市的地方发展政策,从城镇化、农业结构调整和生态修复与治理三方面解释桐乡市水系演变的原因。

      改革开放后,桐乡市为满足民生防涝的需求,持续开展城镇化与水利建设。自1978年起,嘉兴市开展了长山河南排工程,整个工程历时20 a,主要对桐乡市境内自然河流的河道进行了拓宽和功能改造,但并未对河网整体分布形态结构做较大改动[32]。在此过程中,桐乡市原有的自然河流功能划分更加明确,主干河道的长度与宽度大规模增加,支流面积减小,不同等级河流形态差异增大,与嘉兴市整体变化保持一致[25]。2005—2012年,桐乡市城镇化率从21.84%提升至39.34%,进入了快速城镇化时期[33],开展了大规模的重新规划以及结构改造,但同时城区的扩张也导致河道的淤积和建筑用地侵占水面。桐乡市快速城镇化时期的水系变化特征与苏州[34]、宁波[35]等地的变化相似,支流快速衰减,河网密度大幅减小,河网连通性下降,市区主干河道因景观和防涝需要持续拓宽,河网呈现明显的主干化和单一化趋势,大量功能不明确且经济效益较低的坑塘水面消失。

      桐乡市的农业产业结构调整是造成市区外支流与池塘变化的最主要因素。从20世纪 80 年代起在远郊的农业区中开始发展经济效益高的水产养殖业,大量坑塘水面被改造成养殖坑塘,1998 年养殖坑塘已在池塘中占比最大。在2001年后因“改水”政策,农村居民开始大规模挖掘水渠,将主干河流的地表水引入村庄和农田,由于挖掘的水渠仅为引水而宽度较窄,造成2005年前桐乡市河网密度、支流发育系数增长,但河流水面面积变化不明显,该变化特征与同时期农村地区生产方式相似的苏州[26]和南京[36]相同。而无锡[20]、鄞东南[35]、苏北里下河地区[24]等地的农业生产方式在发展过程中未发生明显变化,故境内河网依旧呈现随时间推移持续萎缩特征。同时,在桐乡城镇化发展稳定后,随养殖塘标准化建设及老塘改造工程的开展,远郊的养殖坑塘得到整合,发展重心从大麻镇向北转移到洲泉镇中,使桐乡市后期池塘面积大幅提升且在空间上大规模聚集连片。

      桐乡市的水系生态治理与修复在2012年后逐步开展。该市于2014年启动了“五水共治”工程,在初期部分末端河道被填埋,大量工程设施与材料占据了水面区域,导致河网密度、河流水面率、支流发育系数在2012—2016年有一定幅度的减小。随着工程的进展,许多被填埋的天然湖泊得到了复原,同时在常住人口聚集区与景区内增加景观池塘。各项治理措施使桐乡市支流快速恢复,河网连通度增加,各类池塘快速增长,养殖坑塘结构规整且聚集排布,水环境得到明显优化,至2019年时各项指标相较1975年均有提升,说明平原河网地区河流指标数值与城镇化水平并不是简单的负相关关系[19],在定量研究时还需考虑城镇化发展后期生态修复等政策的影响。

    • Ⅰ级河流在40余年间持续增长,低等级的支流在1998—2005年显著增长,在2005—2012年的快速城镇化时期与2012—2016年的“五水共治”初期大幅衰减达到历史低值,到2019年时支流长度与面积均恢复至较高水平。

      桐乡市的河网密度在2005年前保持增加,在桐乡市进入快速城市化后持续快速衰减,于2016年后重新回增。河流水面率在2012年前持续上升,但升速显著放缓,于2012—2016年数值快速下落达到历史低值,但到2019年时数值重新回到最高点。支流发育系数和分形维度在40余年间同样经历了先增加再减小最后回增的过程,转折时间节点分别是2005和2016年。水系环度和实际结合度在整个过程中不断波动,但在其他指标均最低的2016年达到峰值。

      在城市不同区域河流变化差异显著。河网密度在近郊与远郊的变化远大于市区,河流水面率在市区的变化最为显著。在2005年前河流水面率变化远郊>近郊,但在2005年后远郊<近郊。支流发育系数的变化市区与近郊明显高于远郊。河流消亡转入的地类在不同区域存在明显差异,人类活动的需要是造成空间变化差异的主要因素。

      桐乡市池塘结构组成在发展过程中有较大的改变,养殖坑塘在40余年间从0高速增加至20.93 km²,在当前池塘水面中的占比达77%。景观池塘在2012年前变化不明显,但随后增加迅速。坑塘水面在1975年时几乎构成了桐乡市的全部池塘,但在发展过程中波动明显,与河网支流的变化规律基本相同。2005年时池塘整体形状最复杂且分布最为聚集,快速城市化进程使池塘整体结构变得更加规范但整体变得离散,经过治理后至2019年池塘间的整体连片性重新增强。

      在整个发展过程中远郊池塘总量不断增加,近郊与市区变化趋势保持一致,且市区变化幅度仅在2005—2012年的快速城镇化阶段高于近郊,养殖渔业的规模化与标准化是造成池塘水面大量增加与聚集的主要因素。

Reference (36)

Catalog

    /

    DownLoad:  Full-Size Img  PowerPoint
    Return
    Return