-
林分密度影响人工林的生产力和生态服务功能[1]。不同林分密度下单木生存空间不同[2],占用的能量和消耗的水分也不同[3],这必然导致林木生长存在差异,进而影响生态服务功能[4];生物量是衡量森林生态系统生态服务功能最重要的参数,是研究森林生态系统能量和养分循环的基础数据,更是评估人工林健康状况的重要指标[5−6],与林分密度之间存在密切联系[6]。土壤作为林木赖以生存的物质基础,其土壤理化性质能够反映土壤的结构、持水能力及肥力[7]。林分密度的改变会使林内小环境发生变化,从而使土壤理化性质也呈现不同的变化[8−9]。此外,植物和土壤的相互作用形成了完整的森林生态系统[10],植物生长对土壤状况产生影响[11],同时土壤理化性质的变化也会直接影响植被生物量的变化[12]。
已有大量关于林分密度对人工林影响的研究。ZHANG等[13]以林分密度为750~1 375株·hm−2的油松Pinus tabuliformis林为研究对象,探讨了林分密度对林下植物多样性的影响;李雪等[14]通过对不同林分密度华北落叶松Larix principis-rupprechtii人工林的研究指出,林分密度调控可以有效改善土壤肥力、改良土壤质量;吴茜等[15]以不同林分密度的柏木Cupressus funebris人工林为研究对象,分析得出利于林下植被优势种联结性和群落整体稳定性的最优林分密度;CHEN等[16]则选择不同林分密度油松林评估其实现自然更新和生物多样性方面的恢复能力。然而基于不同的林分密度条件,诸多研究集中于对林木径向生长[17]、林下植被多样性及其种类与土壤理化性质之间的相关性[18−19],研究对象多集中在3 000株·hm−2以下的林分,未涉及高密度人工林,针对人工林乔木层生物量随林分密度的变化以及与土壤理化性质之间的关系鲜有报道。
油松是中国北方主要的水土保持树种[20],被大面积种植于黄土高原地区[21],在防治水土流失、减少土壤侵蚀及改善生态环境等方面发挥重要作用。在造林初期为了尽快对地面形成有效覆盖,多采用高密度的造林模式。随着油松林的生长,过高的造林密度导致单木生长差、单木防护功能低下,表现出了低效林的生长状态[22],但在样地尺度上整个林地的生态服务功能还需要进一步测定和探究。水土保持林具有多种生态服务功能,针对某种生态服务功能,油松林应维持在何种密度也是亟待探讨的问题之一。林分密度是人工可以有效调控的指标之一[23]。因此,本研究以山西吉县蔡家川流域30年生油松人工林为研究对象,分析油松林生物量和土壤理化性质随林分密度的变化情况,并探究两者关系,以期为该流域油松林生态服务功能的可持续发挥及高质量发展提供科学依据和理论参考。
-
本研究区位于山西省临汾市吉县蔡家川流域(36°14′27″~36°18′23″N,110°39′45″~110°47′45″E),该流域是森林生态系统国家野外科学观测研究站所在地。流域面积为39.33 km2,海拔为904~1 592 m。属暖温带大陆性气候,年均气温为10.0 ℃,年均降水量为575.9 mm。土壤类型主要为褐土,黄土母质。主要造林树种为油松、刺槐Robinia pseudoacacia、侧柏Platycladus orientalis等,林下植物主要由黄栌Cotinus coggygria、黄刺玫Rosa xanthina、杠柳Periploca sepium、二柱薹草Carex lithphila、草地早熟禾Poa pratensis等组成。
-
2022年6月,在蔡家川流域以林龄30 a且立地条件基本一致的油松人工林地作为研究对象,共选择不同现存林分密度(750、1 250、1 750、2 250、2 750、3 250、3 750、4 250、4 750、5 250、5 750株·hm−2)的油松人工林样地40块。每块样地面积为20 m×20 m,样地远离林缘。在样地内进行每木检尺,计算平均树高和胸径。根据平均树高和胸径选取标准木,测定松果、松叶、枝条、树干、根系等器官鲜质量,随后各器官取样(1 kg)带回实验室。在每块样地中间部位挖掘1 m×1 m×1 m的土壤剖面,在0~100 cm土层范围内每10 cm为1层,用环刀(100 cm3)取原状土,每层取环刀3个,用于土壤物理性质的测定,并在每层均匀挖取土壤样品3份,混合后取500 g土样装入密封袋 ,带回实验室风干后过2 mm筛,用于土壤化学性质的测定。使用地质罗盘仪和RTK测量仪测定样地基本情况(表1)。
表 1 样地基本信息
Table 1. Basic information of the sample site
样地
编号林分密度/
(株·hm−2)海拔/m 树高/m 径/cm 坡度/(°) 坡向 样地
编号林分密度/
(株·hm−2)海拔/m 树高/m 胸径/cm 坡度/(°) 坡向 1 750 1 113 8.58 15.74 25 阴坡 21 3 750 1 211 10.43 11.52 30 阴坡 2 750 1 104 7.52 14.13 28 阴坡 22 3 750 1 267 9.72 10.70 19 阴坡 3 1 250 1 097 8.72 15.26 30 阴坡 23 3 750 1 271 7.93 11.05 21 阴坡 4 1 250 1 113 8.33 14.55 29 阴坡 24 3 750 1 297 8.24 10.42 27 阴坡 5 1 250 1 111 8.22 14.04 30 阴坡 25 3 750 1 321 7.80 9.72 30 阴坡 6 1 750 1 360 8.87 13.65 30 阴坡 26 3 750 1 244 9.19 10.92 29 阴坡 7 1 750 1 164 9.79 12.86 27 阴坡 27 3 750 1 268 7.01 10.81 26 阴坡 8 1 750 1 364 11.15 15.30 28 阴坡 28 4 250 1 312 10.47 12.02 21 阴坡 9 2 250 1 357 9.06 13.77 30 阴坡 29 4 250 1 362 7.41 9.10 23 阴坡 10 2 250 1 169 7.85 11.82 30 阴坡 30 4 250 1 356 8.98 11.37 19 阴坡 11 2 250 1 132 8.67 10.98 21 阴坡 31 4 250 1 327 8.15 9.48 20 阴坡 12 2 250 1 358 9.47 14.37 20 阴坡 32 4 250 1 358 8.27 17.90 22 阴坡 13 2 750 1 364 9.72 13.27 25 阴坡 33 4 750 1 242 10.12 10.67 30 阴坡 14 2 750 1 358 10.28 12.70 26 阴坡 34 4 750 1 338 7.03 10.11 18 阴坡 15 2 750 1 351 10.16 11.87 30 阴坡 35 4 750 1 313 6.07 7.52 25 阴坡 16 2 750 1 325 8.88 10.83 20 阴坡 36 5 250 1 285 9.39 10.19 20 阴坡 17 2 750 1 314 8.16 10.69 30 阴坡 37 5 250 1 320 8.31 8.61 25 阴坡 18 3 250 1 301 7.95 10.55 25 阴坡 38 5 750 1 314 8.81 8.86 25 阴坡 19 3 250 1 344 6.88 9.94 30 阴坡 39 5 750 1 315 7.22 7.76 18 阴坡 20 3 250 1 341 6.15 8.33 30 阴坡 40 5 750 1 316 6.27 7.09 24 阴坡 -
样品65 ℃烘干至恒量,计算各器官含水量和生物量。土壤容重及孔隙度采用环刀法测定;土壤含水量采用烘干法[24]测定。有机碳质量分数采用重铬酸钾氧化-外加热法测定;全氮质量分数采用凯氏定氮-消煮法测定;全磷质量分数采用酸溶-钼锑抗比色法测定;土壤铵态氮、硝态氮采用碱解扩散法和氢氧化钠熔融-钼锑抗比色法测定;土壤速效磷采用NH4F-HCL浸提-钼锑抗比色法测定[25]。
-
数据采用Excel 2010、SPSS 17.0及Canoco 5.0分析,采用单因素方差分析和最小显著性差异检验法进行显著性分析,采用冗余分析(RDA)及斯皮尔曼(Spearman)相关性分析,使用Origin 2021制作图表。
-
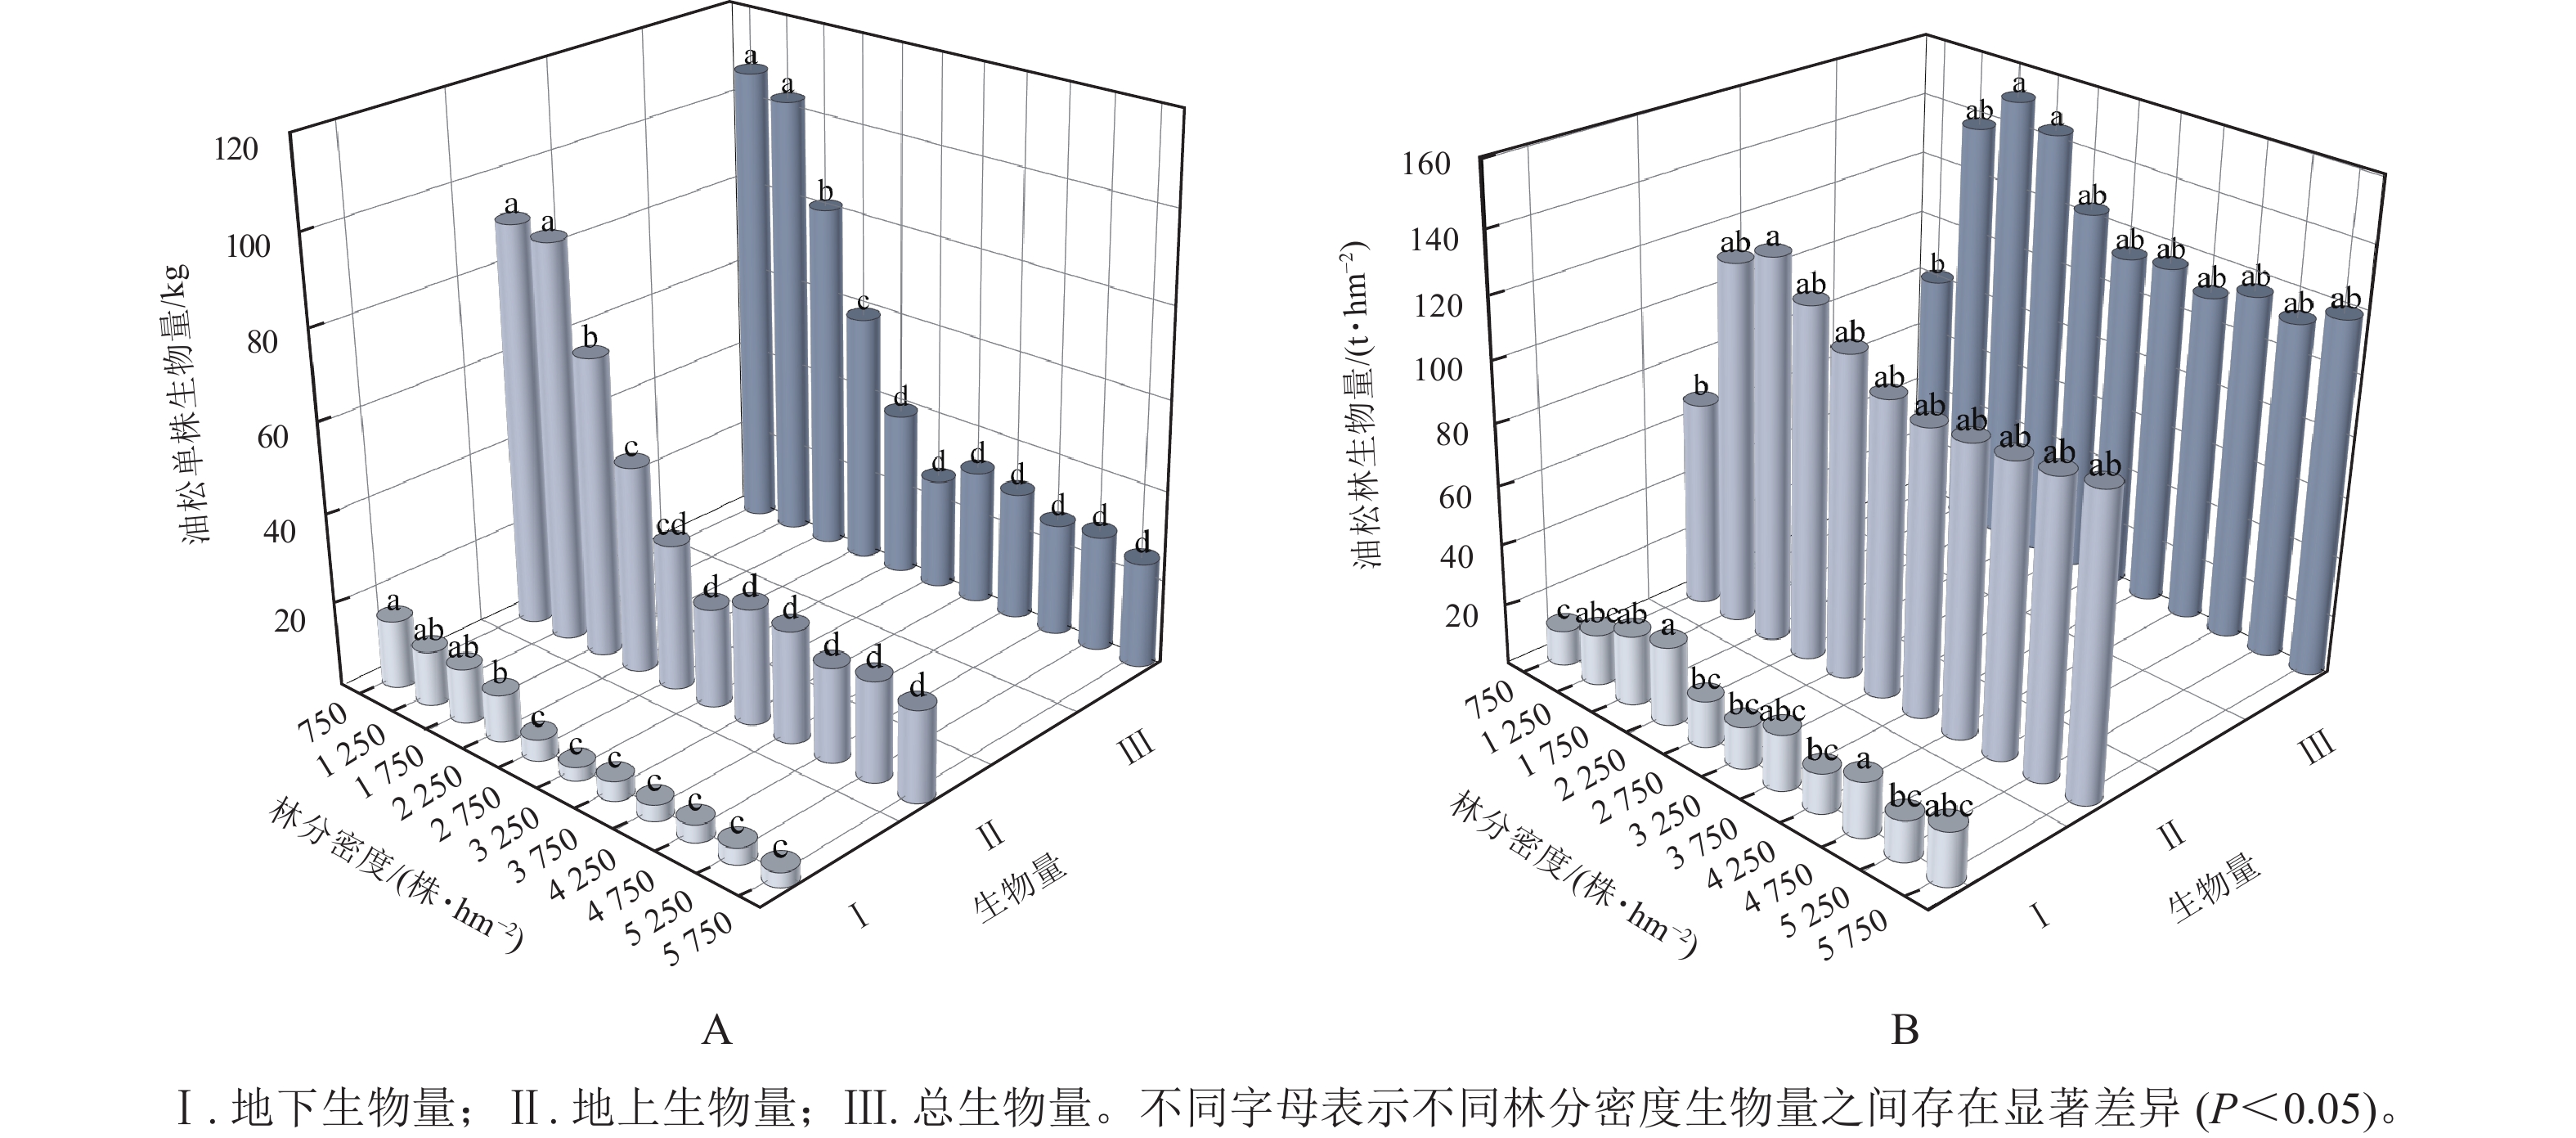
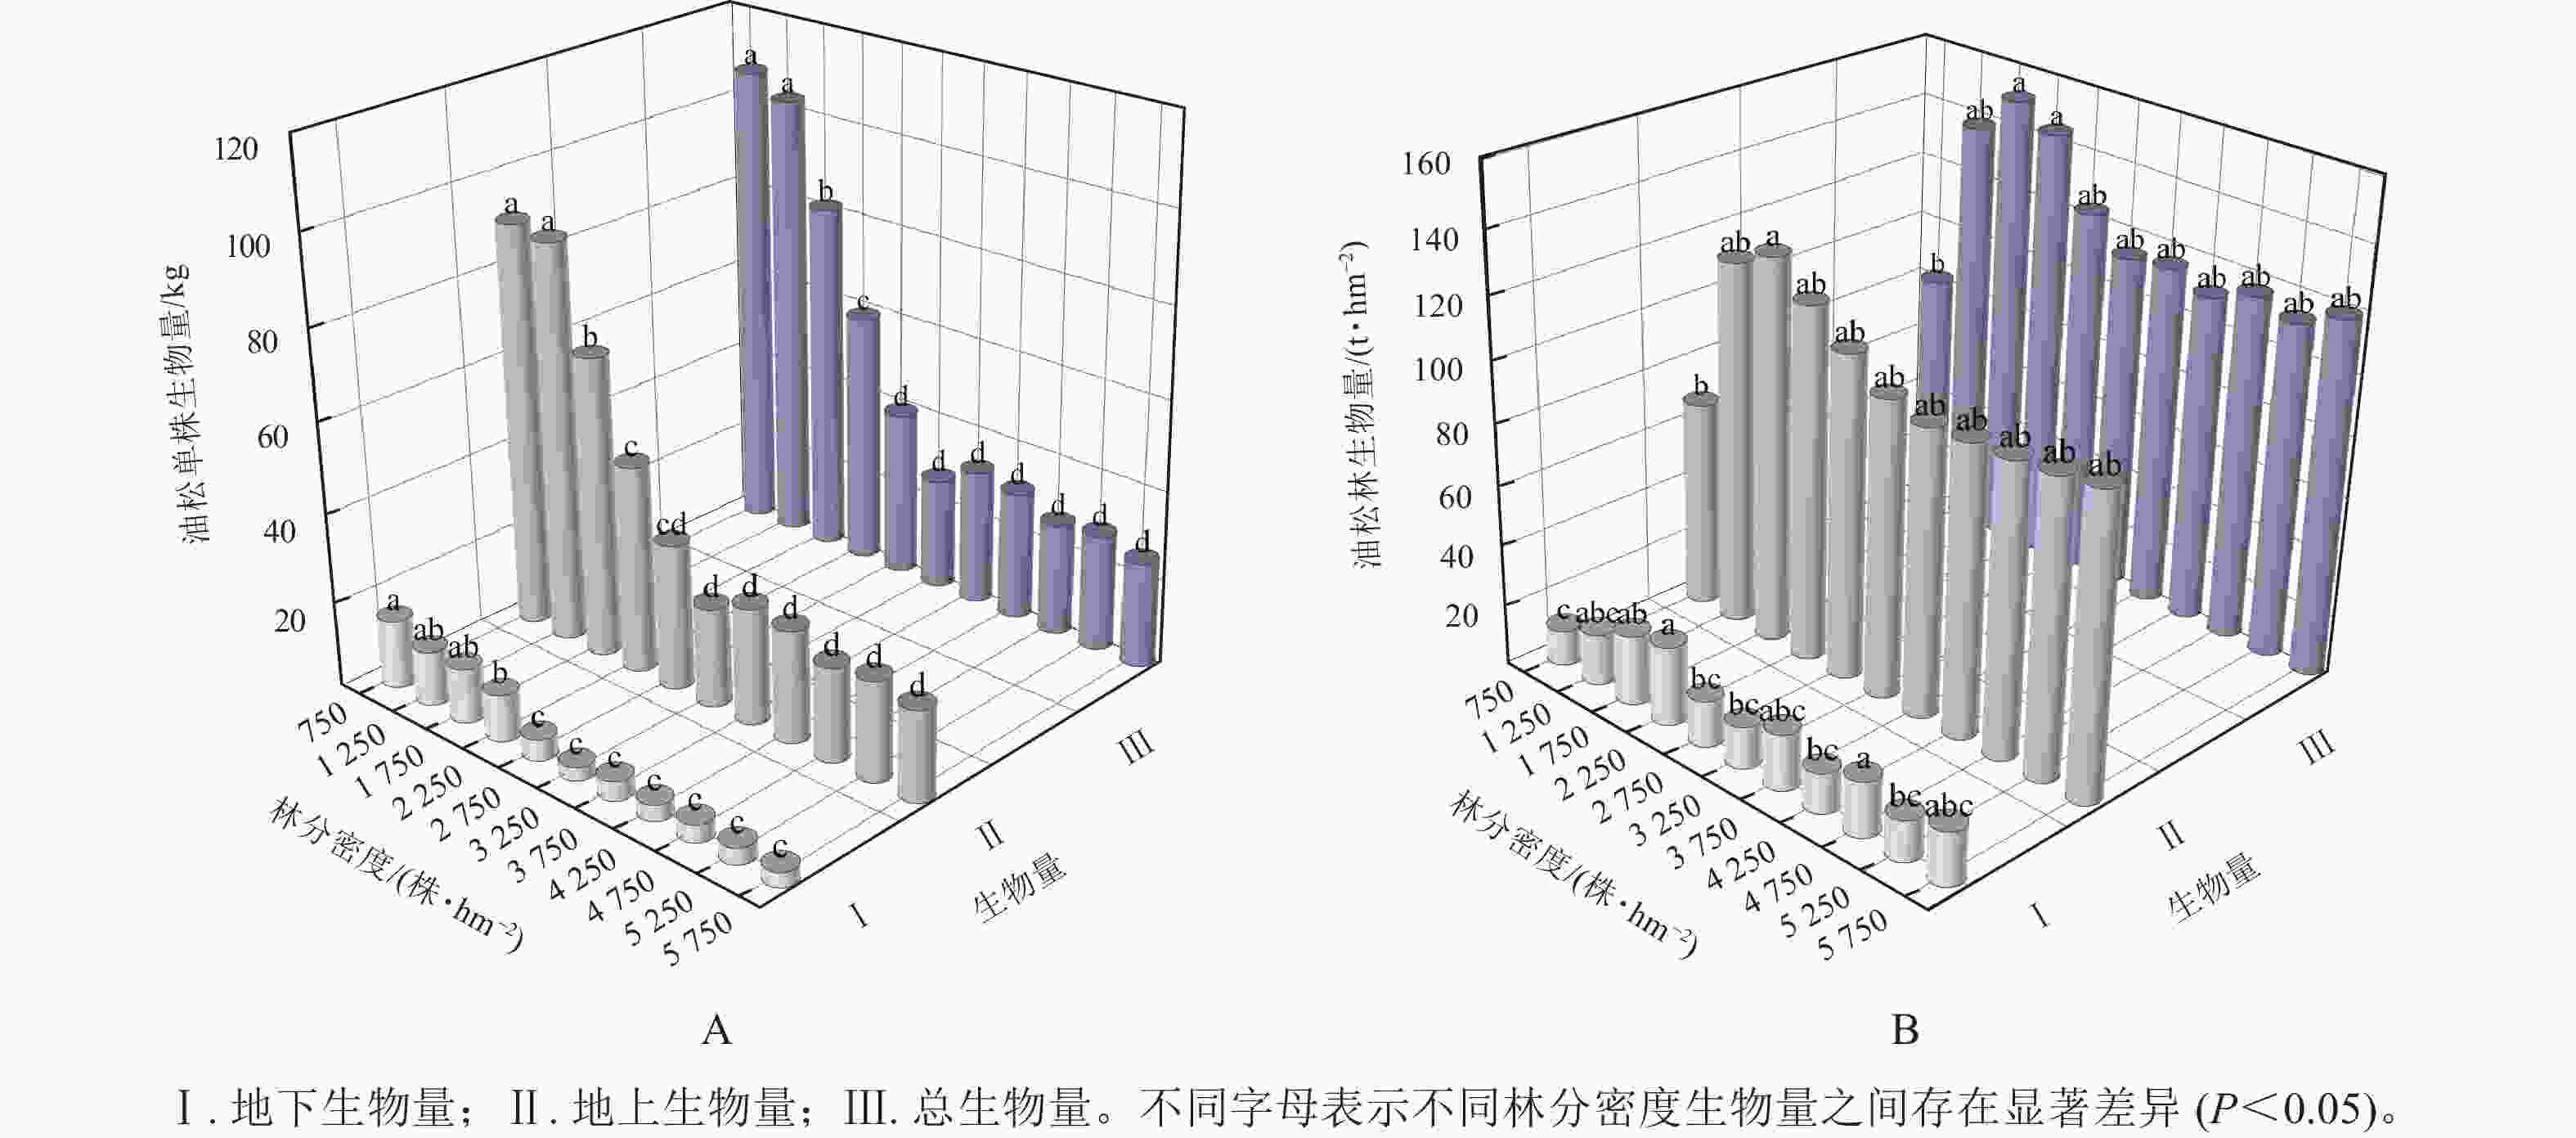
由图1A可知:油松单株总生物量、单株地上生物量和单株地下生物量均随林分密度的增大呈逐渐减少的趋势,且在林分密度为3 250 株·hm−2之后单株生物量趋于平稳。方差分析表明:不同密度油松林之间单株生物量差异显著(P<0.05)。由图1B可知:油松林生物量维持在79.36~148.81 t·hm−2,油松林总生物量和地上生物量均随林分密度呈先增加后减少的变化趋势,在1 750 株·hm−2时油松林总生物量达到最大(148.81 t·hm−2),并在3 250 株·hm−2之后趋于平稳。通过多元线性回归分析(表2)可知:在林分密度为750~2 750株·hm−2时,林分密度对油松林生物量的贡献要大于单株生物量,而在3 250株·hm−2之后单株生物量对油松林总生物量起到主要作用;油松林地下生物量则随林分密度呈波动变化。方差分析表明:在不同林分密度间油松林总生物量差异显著(P<0.05)。
表 2 油松单株生物量和林分密度对油松林总生物量的贡献率
Table 2. Contribution of individual plant biomass and stand density to total biomass in the sample plots
林分密度/(株·hm−2) 影响因子 β P VIF 750~ 2 750 林分密度 1.383 <0.001 2.441 单株生物量 1.274 <0.001 2.441 3 250 ~ 5 750 林分密度 0.312 0.018 1.104 单株生物量 0.929 <0.001 1.104 说明:β是标准化回归系数;VIF是方差扩大因子,VIF<5表示模型构建良好。 -
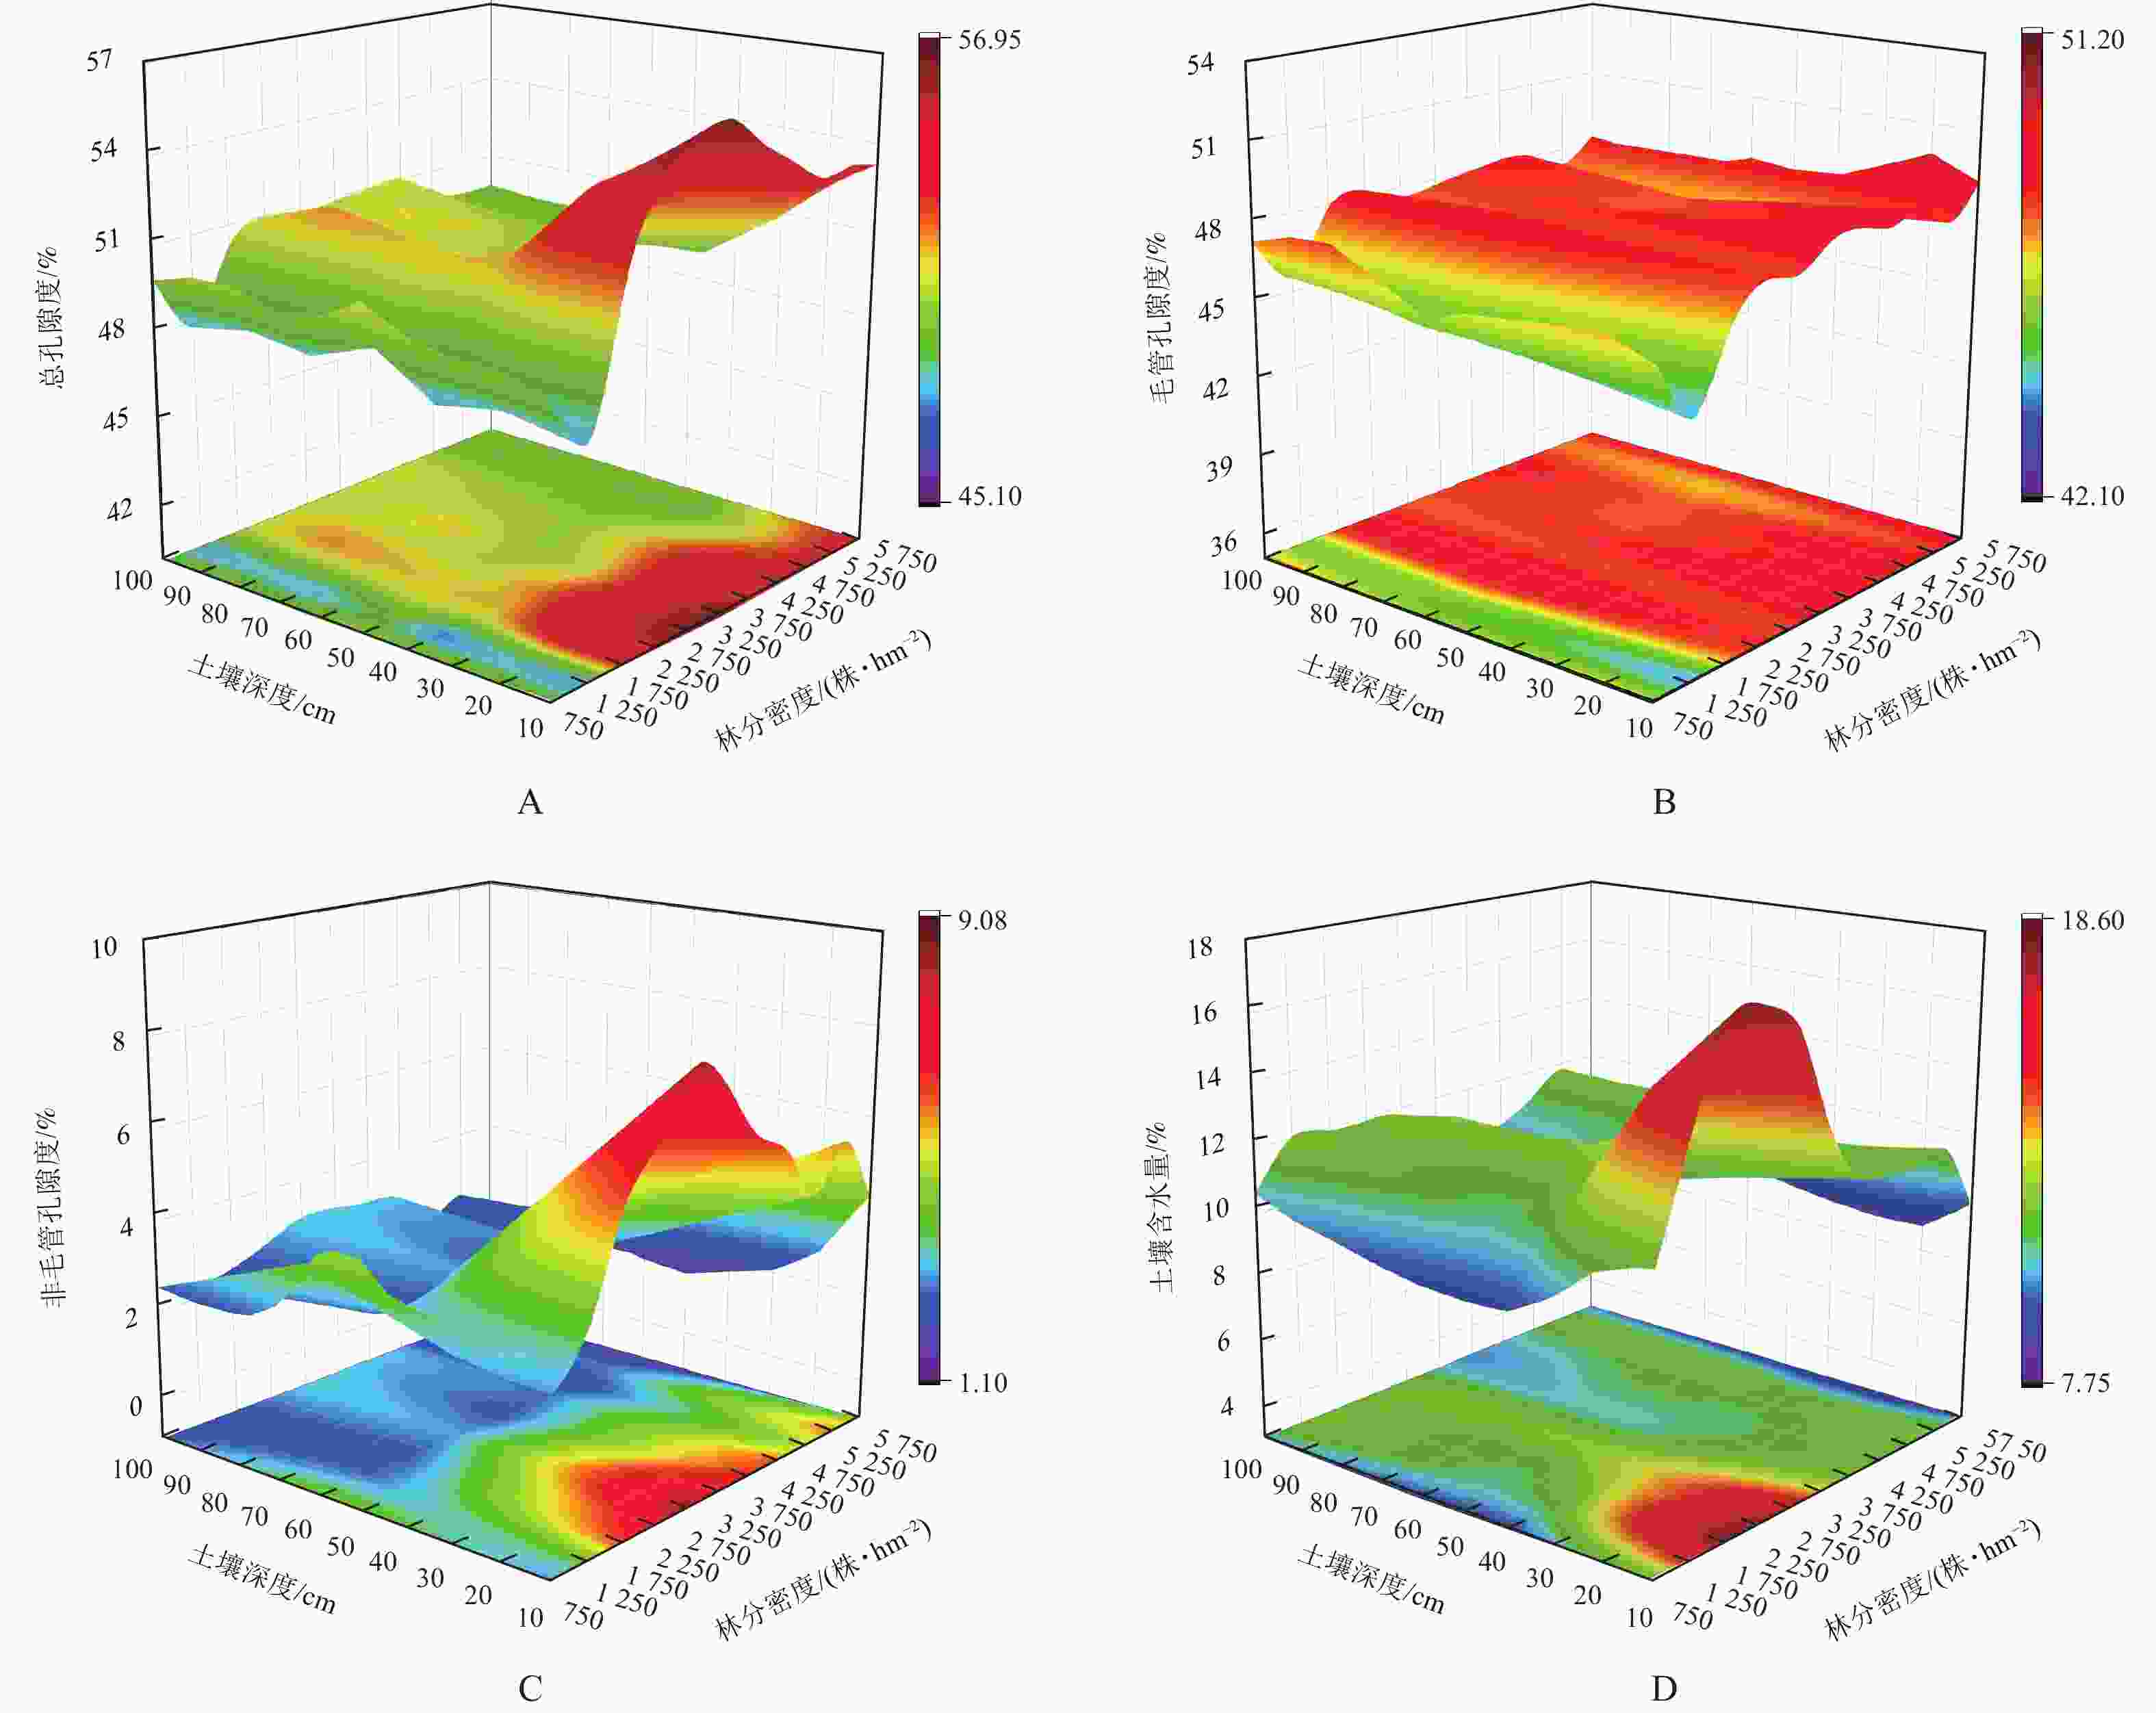
在垂直剖面上,随土层深度的增加,土壤孔隙度和土壤含水量均呈减小趋势(图2A~D)。方差分析表明:不同密度油松林地土壤总孔隙度、毛管孔隙度、非毛管孔隙度、土壤含水量存在显著差异(P<0.05)。随林分密度的增加,土壤总孔隙度、非毛管孔隙度、土壤含水量均呈先增大后减小的变化趋势,总孔隙度在1 750株·hm−2时达到最大值,非毛管孔隙度与土壤含水量在2 750株·hm−2时达到最大值且较低密度林分的土壤含水量明显高于高密度林分,而土壤毛管孔隙度随密度呈波动性变化(表3)。
表 3 不同林分密度油松林0~100 cm土壤物理性质
Table 3. Soil physical properties of 0−100 cm the P. tabulaeformis forests in in different densities
林分密度/(株·hm−2) 总孔隙度/% 毛管孔隙度/% 非毛管孔隙度/% 土壤含水量/% 750 50.77±0.75 bc 47.55±1.10 c 3.22±0.69 abc 10.01±0.81 e 1 250 46.47±1.00 d 43.80±1.03 e 3.09±1.50 abc 12.25±1.48 bc 1 750 52.38±1.50 a 48.70±0.55 ab 3.75±1.05 a 12.97±2.83 ab 2 250 52.22±1.55 a 48.78±0.73 ab 3.45±1.06 ab 12.74±2.11 ab 2 750 52.02±2.25 a 47.32±0.31 c 4.52±0.56 a 13.84±1.75 a 3 250 52.17±2.20 a 48.73±1.05 ab 3.52±0.77 ab 11.14±1.20 cd 3 750 51.58±1.79 ab 48.24±0.65 abc 3.37±0.46 abc 10.91±0.57 d 4 250 51.91±1.62 a 47.87±0.68 bc 4.03±0.95 a 11.25±0.48 cd 4 750 50.68±1.36 bc 48.73±0.93 ab 1.97±0.07 bc 10.92±0.38 d 5 250 50.37±1.51 c 46.32±0.59 d 4.02±1.32 a 12.33±0.52 bc 5 750 50.66±1.40 bc 48.87±0.99 a 1.81±0.31 c 9.03±0.63 e 说明:数值为平均值±标准差。同列不同小写字母表示不同林分密度间差异显著(P<0.05)。 -
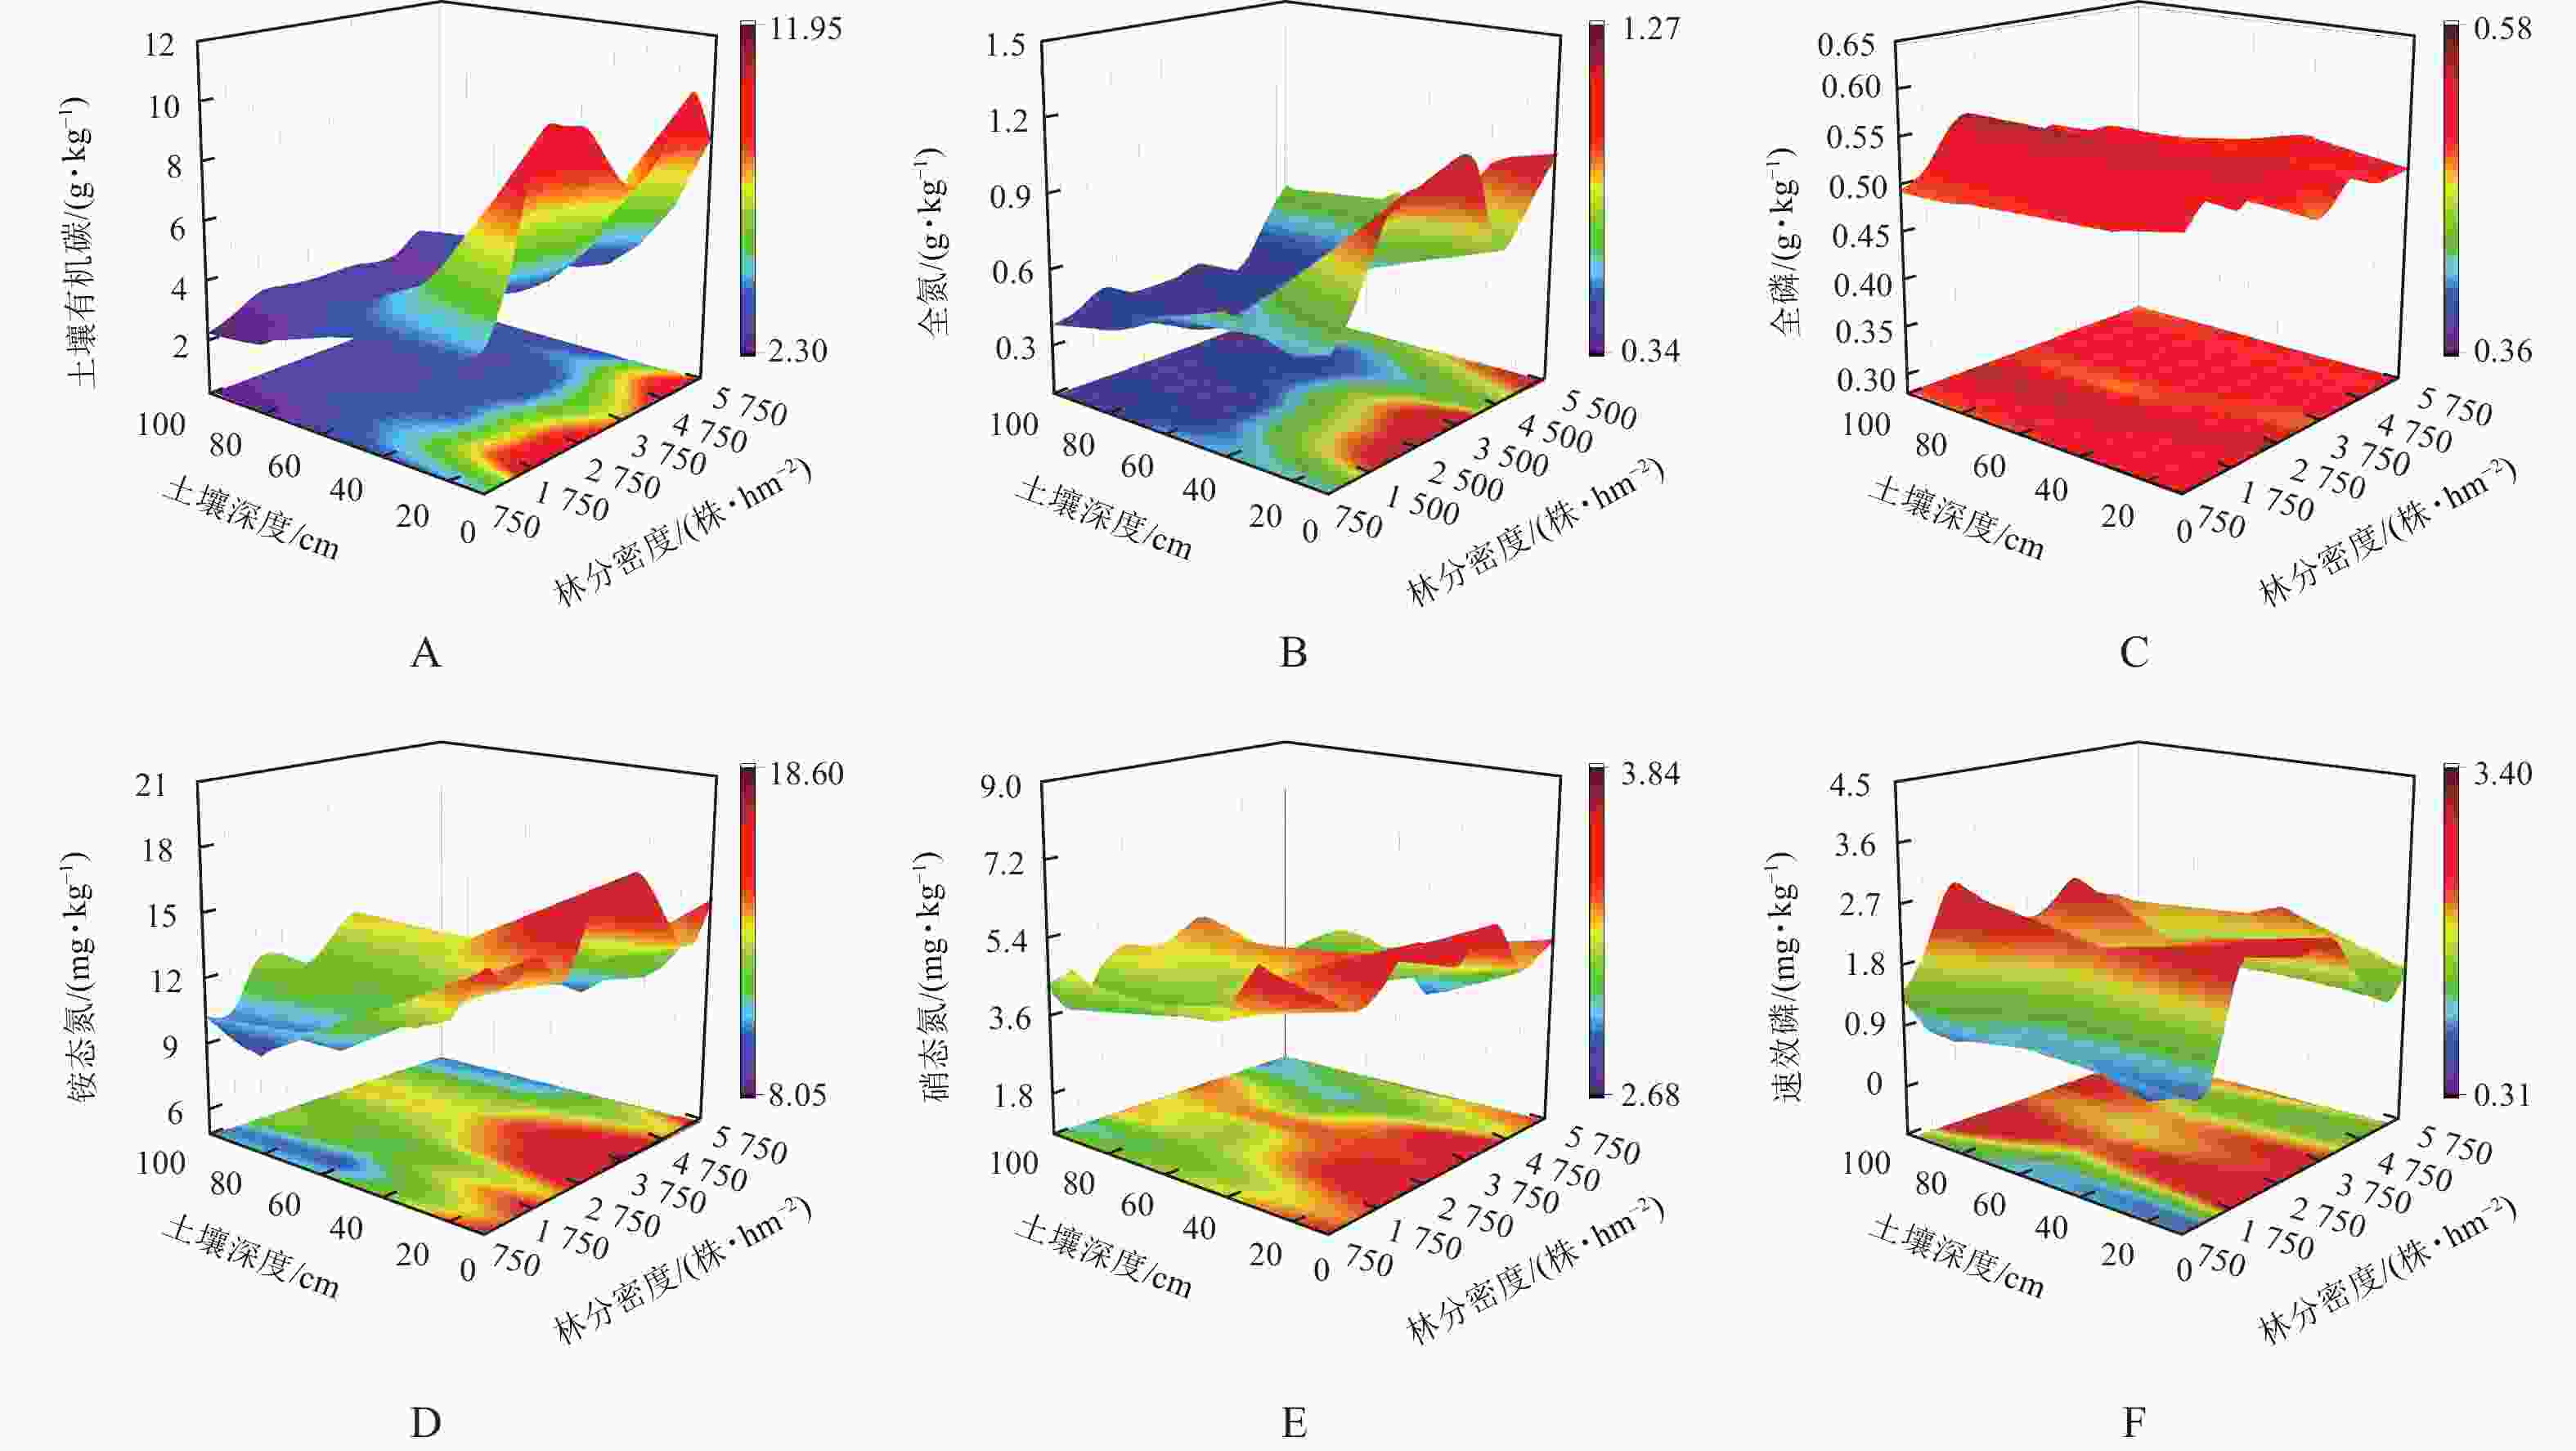
图3A~F与表4为不同林分密度油松林土壤化学特性的变化情况。除全磷、速效磷外,其他化学特性均随土层深度呈减少趋势。方差分析表明:林分密度对土壤有机碳、全氮、铵态氮、硝态氮、速效磷、全磷质量分数影响显著(P<0.05)。随林分密度的增加,土壤有机碳质量分数整体呈双峰型变化,土壤全磷、铵态氮、速效磷质量分数则均呈先增后减变化趋势;土壤全氮、硝态氮随林分密度呈波动性变化。由表4可知,林分密度为1 750株·hm−2时,土壤养分质量分数最大。
表 4 不同林分密度油松林0~100 cm土壤化学性质
Table 4. Soil chemical properties of 0−100 cm in different densities of the P. tabulaeformis forest
林分密度/(株·hm−2) 土壤有机碳/(g·kg−1) 全氮/(g·kg−1) 全磷/(g·kg−1) 铵态氮/(mg·kg−1) 硝态氮/(mg·kg−1) 速效磷/(mg·kg−1) 750 3.41±0.84 c 0.52±0.09 bc 0.50±0.01 cd 11.94±2.03 cd 5.05±0.83 ab 1.16±0.27 f 1 250 3.75±1.31 c 0.52±0.13 bc 0.56±0.01 a 10.21±1.74 e 3.95±0.90 d 0.97±0.50 f 1 750 5.40±2.87 ab 0.61±0.21 bc 0.57±0.01 a 14.13±1.38 a 4.56±0.66 bcd 2.31±0.76 ab 2 250 4.39±2.25 abc 0.52±0.23 bc 0.47±0.01 d 11.23±1.15 de 4.79±0.83 abc 2.39±0.46 a 2 750 4.57±2.57 abc 0.55±0.20 bc 0.51±0.01 bc 13.50±1.94 ab 4.74±0.73 abc 2.14±0.37 abcd 3 250 4.39±1.88 abc 0.64±0.28 abc 0.53±0.00 ab 13.20±1.38 ab 4.74±0.95 abc 1.90±0.46 cde 3 750 3.87±1.55 c 0.66±0.25 ab 0.51±0.01 bc 14.41±1.75 a 4.95±0.71 ab 2.00±0.41 abcde 4 250 4.12±1.79 bc 0.45±0.08 c 0.51±0.00 bc 13.25±1.31 ab 5.34±0.71 a 2.28±0.68 abc 4 750 4.04±2.11 bc 0.52±0.14 bc 0.51±0.00 bc 12.70±1.36 bc 3.96±0.80 d 1.66±0.37 e 5 250 5.55±2.47 a 0.65±0.18 bc 0.50±0.02 cd 11.01±0.93 de 4.16±1.11 d 1.82±0.69 de 5 750 3.74±1.80 c 0.77±0.17 a 0.51±0.01 bc 11.45±2.14 cde 4.30±0.65 cd 1.94±0.32 bcde 说明:数据为平均值±标准差。同列不同小写字母表示差异显著(P<0.05)。 -
由图4可知:2个排序轴对不同密度油松林生物量的累计解释率为53.62%,两轴较好地反映了油松生物量与土壤各因子之间存在的关联性。根据蒙特卡洛检验结果可知:第1排序轴和所有典型轴均差异显著,排序结果科学可靠。第1排序轴主要反映了土壤有机碳、速效磷的变化趋势,第2排序轴主要反映了总孔隙度、毛管孔隙度、全磷的变化趋势。生物量RDA排序图表明:油松林地上生物量、地下生物量、总生物量之间均呈正相关。油松林地上生物量、地下生物量、总生物量均与土壤有机碳、速效磷呈正相关,与土壤总孔隙度、毛管孔隙度呈负相关。轴1从左到右,油松林地上生物量、地下生物量和总生物量随着土壤有机碳、速效磷的增加而减少;沿轴2从上到下,随着总孔隙度、毛管孔隙度、全磷的增加油松林地上生物量、地下生物量和总生物量均增加。经蒙特卡洛分析表明,土壤总孔隙度、有机碳和速效磷对不同林分密度油松林生物量均达到显著影响(P<0.01)。
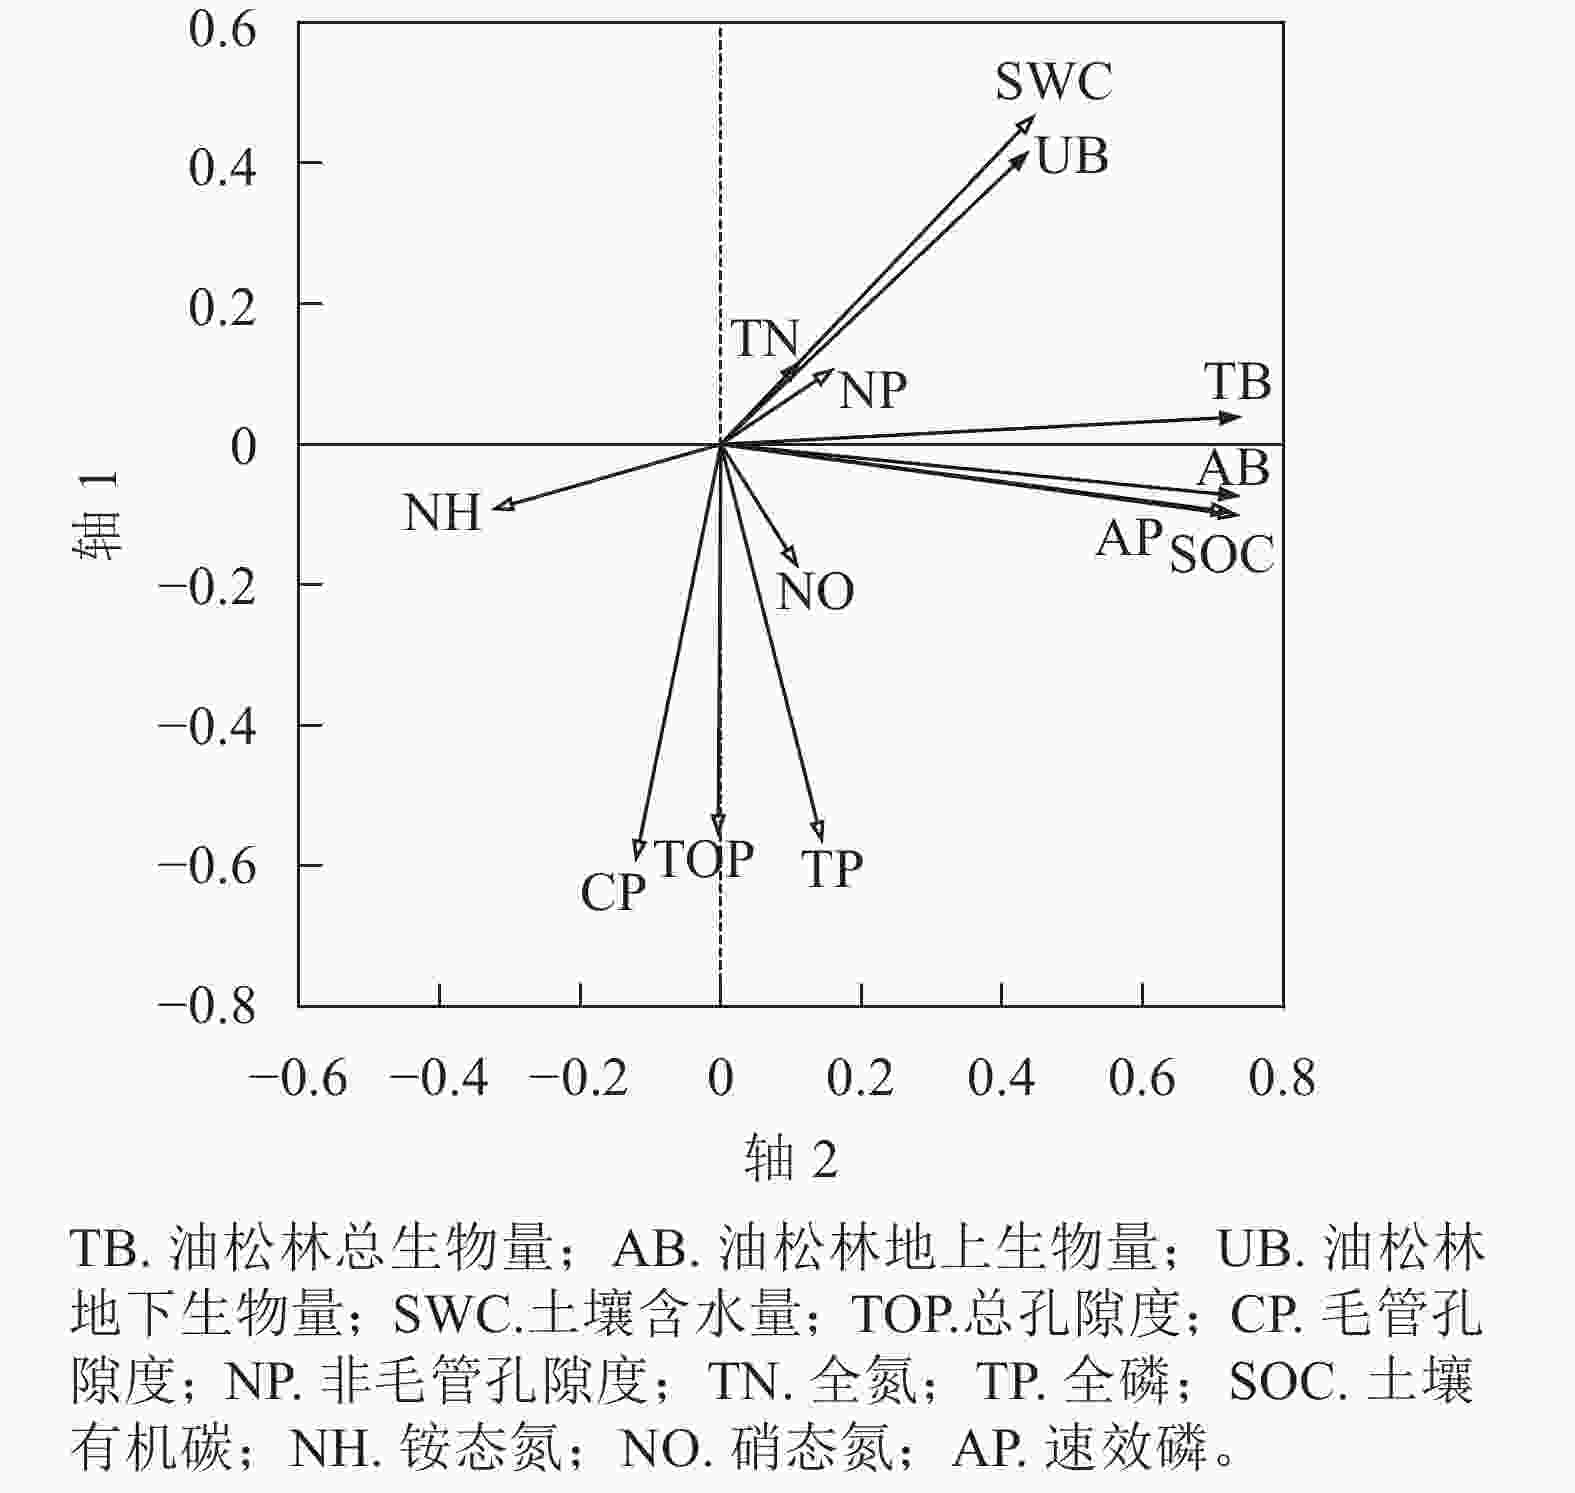
图 4 不同林分密度油松林生物量与土壤理化性质的冗余分析二维排序图
Figure 4. RDA two-dimensional ordination plot of biomass and soil physico-chemical properties in P. tabulaeformis forests of different densities
由生物量与土壤理化性质的Spearman相关分析可知(表5):除土壤有机碳与速效磷均显著影响油松林生物量外,地下生物量还受到土壤含水量的显著影响(P<0.05)。
表 5 不同林分密度油松林生物量与土壤理化性质相关系数
Table 5. Correlation coefficients between biomass and soil physico-chemical properties of P. tabulaeformis forests of different densities
项目 SWC TOP CP NP TN TP SOC NH NO AP 油松林地上生物量 0.235 −0.020 0.011 0.123 0.228 0.162 0.513** −0.242 0.002 0.358* 油松林地下生物量 0.372* 0.023 −0.056 0.198 0.213 −0.101 0.426** −0.139 −0.032 0.326* 油松林总生物量 0.257 −0.108 −0.075 0.116 0.254 0.106 0.519** −0.280 −0.041 0.336* 说明:**表示极显著相关(P<0.01); *表示显著相关(P<0.05)。SWC. 土壤含水量;TOP. 总孔隙度;CP. 毛管孔隙度;NP. 非毛管孔隙度;TN. 全氮;TP. 全磷;SOC.土壤有机碳;NH. 铵态氮;NO. 硝态氮;AP. 速效磷。 -
森林生物量是评估生态系统生产力与植被承载能力的重要指标,也是物质循环和能量流动的基础[26],林分密度是人工林经营中的关键林分因子之一。生物量作为衡量植被生产力的主要指标,两者之间有着密切联系[6]。本研究中,林分密度对油松单株生物量和林分生物量均具有显著影响。在低密度情况下,油松单株之间的树间距较大,个体拥有充足的生长空间,彼此之间相互影响较小,林分密度对树木的生长与生物量的积累具有更强的正面影响[27−28]。当林分密度增大时,一方面由于树间距缩小导致冠层关闭,影响树木的光合作用[29],进而影响生物量[30−31];另一方面由于林分密植导致林木的生长空间不断减小,增加个体之间的竞争,进而导致林分质量下降,不利于林分的可持续经营[32]。本研究表明,林分总生物量在低密度条件下会随着密度的增大而增加,而当密度达到一定阈值时,林分总生物量主要受到单株生物量的影响。人工林分在幼龄林阶段时,密度对林木的生长没有较大影响,可以采取适当密植的方法[32];但随林龄的增长,单株生物量对林分生物量的影响逐渐起到主导作用,此时林分密度过大会限制油松林的生长和发展,需采取间伐等措施对林分密度进行合理调控。本研究的30年生油松林,林分密度在1 750株·hm−2时油松单株生长情况最佳且可维持最大的生产力。
-
土壤孔隙度直接影响土壤的通透性,孔隙度大的土壤结构疏松,利于水分下渗[33]。本研究发现,随土壤深度的增大,土壤孔隙度与土壤含水量均不断减小。随林分密度的增大土壤孔隙度和含水量均先增大后减小,林分密度为1 750~2 750株·hm−2时,土壤孔隙度大,含水量高,这是由于在该密度条件下根系生物量和凋落物厚度相对其他林分较大,利于土壤孔隙的增加及土壤腐殖质的分解[34]。土壤含水量是林内降雨、林木蒸散和土壤蒸发等共同作用的结果[35]。本研究中土壤含水量在低密度与高密度林分之间存在明显差异,且低密度林分高于高密度林分。这可能是由于在低密度林分林内降雨相对较大,且在该研究区不同密度油松林内均有较厚的凋落物,土壤蒸散量相对一致,因而在低密度林分条件下土壤含水量相对较高。因此,若以保持水土和改良土壤蓄水性能为目的,林分密度建议维持在1 750~2 750株·hm−2。
本研究结果表明:不同林分密度油松林地间土壤养分均存在差异,随林分密度的增大,土壤养分呈先增大后减小的变化趋势,且在密度为1 750株·hm−2时整体养分质量分数最大。这可能是因为不同林分密度林内所受到的光照以及土壤微环境有所不同,进而影响土壤养分质量分数。随林分密度的增加,凋落物随之增加,土壤养分质量分数随之增加[36],但当林分密度继续增大,林木对土壤养分吸收量加大,而针叶树种自然更新凋落速度较慢,土壤养分消耗速度大于补偿速度,土壤养分质量分数出现减少趋势。过高密度的林分内土壤微生物也会与植被争夺养分,而森林微环境的不适宜性导致土壤生物活性较低,限制了高林分密度森林土壤养分[37]。本研究中在高密度时土壤有机碳质量分数增多,可能是由于高密度林分林木之间竞争加强,地下根系死亡分解释放的养分回归到土壤中,导致在高密度时有机碳质量分数增加。本研究还表明,除磷元素外,土壤养分均具有明显的表聚现象,而磷元素质量分数随土壤深度没有明显变化,可能是由于磷元素主要来源于土壤母质的矿化,在土壤中的分布没有明显差异[38]。因此,将林分密度维持在1 750株·hm−2左右可有效改善土壤肥力,提升土壤碳汇能力。
-
本研究发现:土壤总孔隙度、有机碳、速效磷是影响油松林生物量的主要土壤因子,除此,油松林地下生物量还受到土壤含水量的影响。土壤总孔隙度、有机碳和磷元素均是植物生长的限制因子[39],随着土壤有机碳和速效磷的变化,油松林生物量也发生显著变化。由此可见,若以获取高生物量为目标,则可以进行人为干预,施加相应养分等措施来促进油松林的生长。土壤含水量与地下生物量之间存在密切相关,这是因为植物生长的同时其根系也由浅入深进行生长,此过程需要土壤水分的供应来维持[40],进一步说明土壤储水能力对于提升林地根系生物量至关重要。由此可知,在坡地进行油松林培育时,可以采取水平阶等工程措施将地表径流转变为土壤水分,提高土壤储水能力,进而促进植物根系的生长。
-
对于30年生油松人工林,林分密度对油松单株生物量和林分生物量均影响显著,林分总生物量在油松密度1 750 株·hm−2达到峰值,且在此密度下更有利于林木个体生长及其生物量的累积。不同密度油松人工林的土壤理化性质差异显著。林分密度为1 750 株·hm−2时,土壤结构及土壤养分更适宜油松的生长以及生物量的累积。土壤总孔隙度、有机碳和速效磷对不同密度油松林生物量均达极显著影响,地下生物量还受到土壤含水量的显著影响。综上,以固碳释氧和维持最大生产力为目的,以及以提高土壤碳汇能力和改良土壤肥力为目的的油松林,林分密度建议维持在1 750株·hm−2左右,以保持水土和改良土壤蓄水性能为目的的油松林,林分密度建议维持在1 750~2 750株·hm−2。
Effects of stand density on biomass and soil physico-chemical properties of Pinus tabuliformis forest in the loess area of western Shanxi
-
摘要:
目的 探讨林分密度对油松Pinus tabuliformis人工林生物量与土壤理化性质的影响,为油松人工林高质量发展和生态服务功能持续稳定发挥提供理论支撑。 方法 以山西省临汾市吉县蔡家川流域30年生油松人工林为研究对象,采用标准木法测算不同密度条件下单株生物量及林分生物量,并测定土壤理化性质,分析林分密度对油松林生物量及土壤理化性质的影响,采用冗余分析(RDA)及斯皮尔曼(Spearman)相关性分析确定油松林生物量与土壤理化性质之间的关系。 结果 ①不同密度油松人工林的单株生物量和林分总生物量差异显著(P<0.05),且随林分密度的增加,单株生物量逐渐减少,林分总生物量在密度1 750 株·hm−2时具有峰值;②不同密度油松人工林地土壤理化性质差异显著(P<0.05),其中土壤孔隙度在林分密度 1750 株· hm−2时最大,达52.38%,林地土壤含水量在林分密度2 750 株· hm−2时最高,达13.84%,土壤肥力状况则在林分密度1750 株·hm−2时最佳;③通过冗余分析及斯皮尔曼相关分析发现:土壤总孔隙度、有机碳和速效磷与林分总生物量均呈极显著相关(P<0.01),地下生物量受到土壤含水量的显著影响(P<0.05)。结论 以固碳释氧和维持最大生产力为目的,以及以提高土壤碳汇能力和改良肥力为目的的油松林,林分密度建议维持在1 750 株·hm−2左右的油松林;以保持水土和改良土壤蓄水性能为目的的油松林,林分密度建议维持在1 750~2 750 株·hm−2。图4表5参40 Abstract:Objective This study is in order to explore the effects of stand density on biomass and soil physicochemical properties in Pinus tabuliformis forests, for high-quality development and performance of the ecological service function. Method A 30-year-old P. tabuliformis forest in Caijiachuan watershed, Jixian County, Shanxi Province, was used as the research object, and the standard wood method was used to measure the biomass of individual plants and the overall biomass of the sample plots under the conditions of different densities, and the soil physicochemical properties were determined, so as to analyze the effects of stand density on the biomass of P. tabuliformis forest and soil physicochemical properties, and to determine their relationship by redundancy analysis (RDA) and Spearman’s correlation analysis. Result (1) The differences in stand biomass and total tree biomass between different densities were significant (P<0.05), and with the increase of stand density, stand biomass gradually decreased, and the total tree biomass had a peak at a density of 1 750 plants·hm−2; (2) The physicochemical properties of soil in forests of different densities differed significantly (P<0.05), with soil porosity being the highest at 1 750 plants·hm−2, reaching 52.38%, soil moisture content being the highest at 2 750 plants·hm−2, reaching 13.84%, and soil fertility being the best at a density of 1 750 plants·hm−2; (3) RDA and Spearman’s correlation analyses revealed that total soil porosity, organic carbon and quick-acting phosphorus were all highly significantly correlated with arbor biomass in the sample plots (P<0.01), and below-ground biomass was significantly affected by soil water content (P<0.05). Conclusion The stand density should be maintained at 1750 plants·hm−2 for the purpose of sequestering carbon and releasing oxygen and maintaining maximum productivity, and for the purpose of increasing the carbon sink capacity of the soil and improving fertility, and at 1 750−2 750 plants·hm−2 for the purpose of retaining soil and water and improving soil water retention properties. [Ch, 4 fig. 5 tab. 40 ref.] -
表 1 样地基本信息
Table 1. Basic information of the sample site
样地
编号林分密度/
(株·hm−2)海拔/m 树高/m 径/cm 坡度/(°) 坡向 样地
编号林分密度/
(株·hm−2)海拔/m 树高/m 胸径/cm 坡度/(°) 坡向 1 750 1 113 8.58 15.74 25 阴坡 21 3 750 1 211 10.43 11.52 30 阴坡 2 750 1 104 7.52 14.13 28 阴坡 22 3 750 1 267 9.72 10.70 19 阴坡 3 1 250 1 097 8.72 15.26 30 阴坡 23 3 750 1 271 7.93 11.05 21 阴坡 4 1 250 1 113 8.33 14.55 29 阴坡 24 3 750 1 297 8.24 10.42 27 阴坡 5 1 250 1 111 8.22 14.04 30 阴坡 25 3 750 1 321 7.80 9.72 30 阴坡 6 1 750 1 360 8.87 13.65 30 阴坡 26 3 750 1 244 9.19 10.92 29 阴坡 7 1 750 1 164 9.79 12.86 27 阴坡 27 3 750 1 268 7.01 10.81 26 阴坡 8 1 750 1 364 11.15 15.30 28 阴坡 28 4 250 1 312 10.47 12.02 21 阴坡 9 2 250 1 357 9.06 13.77 30 阴坡 29 4 250 1 362 7.41 9.10 23 阴坡 10 2 250 1 169 7.85 11.82 30 阴坡 30 4 250 1 356 8.98 11.37 19 阴坡 11 2 250 1 132 8.67 10.98 21 阴坡 31 4 250 1 327 8.15 9.48 20 阴坡 12 2 250 1 358 9.47 14.37 20 阴坡 32 4 250 1 358 8.27 17.90 22 阴坡 13 2 750 1 364 9.72 13.27 25 阴坡 33 4 750 1 242 10.12 10.67 30 阴坡 14 2 750 1 358 10.28 12.70 26 阴坡 34 4 750 1 338 7.03 10.11 18 阴坡 15 2 750 1 351 10.16 11.87 30 阴坡 35 4 750 1 313 6.07 7.52 25 阴坡 16 2 750 1 325 8.88 10.83 20 阴坡 36 5 250 1 285 9.39 10.19 20 阴坡 17 2 750 1 314 8.16 10.69 30 阴坡 37 5 250 1 320 8.31 8.61 25 阴坡 18 3 250 1 301 7.95 10.55 25 阴坡 38 5 750 1 314 8.81 8.86 25 阴坡 19 3 250 1 344 6.88 9.94 30 阴坡 39 5 750 1 315 7.22 7.76 18 阴坡 20 3 250 1 341 6.15 8.33 30 阴坡 40 5 750 1 316 6.27 7.09 24 阴坡 表 2 油松单株生物量和林分密度对油松林总生物量的贡献率
Table 2. Contribution of individual plant biomass and stand density to total biomass in the sample plots
林分密度/(株·hm−2) 影响因子 β P VIF 750~ 2 750 林分密度 1.383 <0.001 2.441 单株生物量 1.274 <0.001 2.441 3 250 ~ 5 750 林分密度 0.312 0.018 1.104 单株生物量 0.929 <0.001 1.104 说明:β是标准化回归系数;VIF是方差扩大因子,VIF<5表示模型构建良好。 表 3 不同林分密度油松林0~100 cm土壤物理性质
Table 3. Soil physical properties of 0−100 cm the P. tabulaeformis forests in in different densities
林分密度/(株·hm−2) 总孔隙度/% 毛管孔隙度/% 非毛管孔隙度/% 土壤含水量/% 750 50.77±0.75 bc 47.55±1.10 c 3.22±0.69 abc 10.01±0.81 e 1 250 46.47±1.00 d 43.80±1.03 e 3.09±1.50 abc 12.25±1.48 bc 1 750 52.38±1.50 a 48.70±0.55 ab 3.75±1.05 a 12.97±2.83 ab 2 250 52.22±1.55 a 48.78±0.73 ab 3.45±1.06 ab 12.74±2.11 ab 2 750 52.02±2.25 a 47.32±0.31 c 4.52±0.56 a 13.84±1.75 a 3 250 52.17±2.20 a 48.73±1.05 ab 3.52±0.77 ab 11.14±1.20 cd 3 750 51.58±1.79 ab 48.24±0.65 abc 3.37±0.46 abc 10.91±0.57 d 4 250 51.91±1.62 a 47.87±0.68 bc 4.03±0.95 a 11.25±0.48 cd 4 750 50.68±1.36 bc 48.73±0.93 ab 1.97±0.07 bc 10.92±0.38 d 5 250 50.37±1.51 c 46.32±0.59 d 4.02±1.32 a 12.33±0.52 bc 5 750 50.66±1.40 bc 48.87±0.99 a 1.81±0.31 c 9.03±0.63 e 说明:数值为平均值±标准差。同列不同小写字母表示不同林分密度间差异显著(P<0.05)。 表 4 不同林分密度油松林0~100 cm土壤化学性质
Table 4. Soil chemical properties of 0−100 cm in different densities of the P. tabulaeformis forest
林分密度/(株·hm−2) 土壤有机碳/(g·kg−1) 全氮/(g·kg−1) 全磷/(g·kg−1) 铵态氮/(mg·kg−1) 硝态氮/(mg·kg−1) 速效磷/(mg·kg−1) 750 3.41±0.84 c 0.52±0.09 bc 0.50±0.01 cd 11.94±2.03 cd 5.05±0.83 ab 1.16±0.27 f 1 250 3.75±1.31 c 0.52±0.13 bc 0.56±0.01 a 10.21±1.74 e 3.95±0.90 d 0.97±0.50 f 1 750 5.40±2.87 ab 0.61±0.21 bc 0.57±0.01 a 14.13±1.38 a 4.56±0.66 bcd 2.31±0.76 ab 2 250 4.39±2.25 abc 0.52±0.23 bc 0.47±0.01 d 11.23±1.15 de 4.79±0.83 abc 2.39±0.46 a 2 750 4.57±2.57 abc 0.55±0.20 bc 0.51±0.01 bc 13.50±1.94 ab 4.74±0.73 abc 2.14±0.37 abcd 3 250 4.39±1.88 abc 0.64±0.28 abc 0.53±0.00 ab 13.20±1.38 ab 4.74±0.95 abc 1.90±0.46 cde 3 750 3.87±1.55 c 0.66±0.25 ab 0.51±0.01 bc 14.41±1.75 a 4.95±0.71 ab 2.00±0.41 abcde 4 250 4.12±1.79 bc 0.45±0.08 c 0.51±0.00 bc 13.25±1.31 ab 5.34±0.71 a 2.28±0.68 abc 4 750 4.04±2.11 bc 0.52±0.14 bc 0.51±0.00 bc 12.70±1.36 bc 3.96±0.80 d 1.66±0.37 e 5 250 5.55±2.47 a 0.65±0.18 bc 0.50±0.02 cd 11.01±0.93 de 4.16±1.11 d 1.82±0.69 de 5 750 3.74±1.80 c 0.77±0.17 a 0.51±0.01 bc 11.45±2.14 cde 4.30±0.65 cd 1.94±0.32 bcde 说明:数据为平均值±标准差。同列不同小写字母表示差异显著(P<0.05)。 表 5 不同林分密度油松林生物量与土壤理化性质相关系数
Table 5. Correlation coefficients between biomass and soil physico-chemical properties of P. tabulaeformis forests of different densities
项目 SWC TOP CP NP TN TP SOC NH NO AP 油松林地上生物量 0.235 −0.020 0.011 0.123 0.228 0.162 0.513** −0.242 0.002 0.358* 油松林地下生物量 0.372* 0.023 −0.056 0.198 0.213 −0.101 0.426** −0.139 −0.032 0.326* 油松林总生物量 0.257 −0.108 −0.075 0.116 0.254 0.106 0.519** −0.280 −0.041 0.336* 说明:**表示极显著相关(P<0.01); *表示显著相关(P<0.05)。SWC. 土壤含水量;TOP. 总孔隙度;CP. 毛管孔隙度;NP. 非毛管孔隙度;TN. 全氮;TP. 全磷;SOC.土壤有机碳;NH. 铵态氮;NO. 硝态氮;AP. 速效磷。 -
[1] 卢立华, 农友, 李华, 等. 保留密度对杉木人工林生长和生物量及经济效益的影响[J]. 应用生态学报, 2020, 31(3): 717 − 724. LU Lihua, NONG You, LI Hua, et al. Effects of retention density on growth, biomass, and economic benefit of Cunninghamia lanceolata plantation [J]. Chinese Journal of Applied Ecology, 2020, 31(3): 717 − 724. [2] 李晓燕, 段爱国, 张建国, 等. 不同良种与初植密度杉木林分密度指标动态特征[J]. 林业科学研究, 2021, 34(2): 72 − 80. LI Xiaoyan, DUAN Aiguo, ZHANG Jianguo, et al. Dynamic characteristics of stand density measure of Chinese fir (Cunninghamia lanceolata) plantations with different improved varieties and initial planting densities [J]. Forest Research, 2021, 34(2): 72 − 80. [3] 王玲. 林分密度对油松人工林群落结构和植物多样性的影响[J]. 生态环境学报, 2020, 29(12): 2328 − 2336. WANG Ling. Effects of different stand densities on community structure and species diversity of Pinus tabulaeformis plantation [J]. Ecology and Environmental Sciences, 2020, 29(12): 2328 − 2336. [4] 陈贝贝, 姜俊, 陆元昌, 等. 间伐强度对马尾松人工林冠下套种树种生长的影响[J]. 北京林业大学学报, 2021, 43(1): 58 − 65. CHEN Beibei, JIANG Jun, LU Yuanchang, et al. Effects of thinning intensity on the growth of interplanting broadleaved trees under Pinus massoniana plantation [J]. Journal of Beijing Forestry University, 2021, 43(1): 58 − 65. [5] WANG Yueting, JIA Xiang, CHAI Guoqi, et al. Improved estimation of aboveground biomass of regional coniferous forests integrating UAV-LiDAR strip data, Sentinel-1 and Sentinel-2 imageries[J/OL]. Plant Methods, 2023, 19(65) [2023-11-10]. doi: 10.1186/s13007-023-01043-9. [6] ANDRZEJ M, JAGODZIŃSKI, DYDERSKI M K, et al. Effects of stand features on aboveground biomass and biomass conversion and expansion factors based on a Pinus sylvestris L. chronosequence in western Poland [J]. European Journal of Forest Research, 2019, 138: 673 − 683. [7] 方怡然, 蔡金桓, 薛立. 3种改造人工林的林下植物多样性和土壤物理性质[J]. 华南农业大学学报, 2018, 39(4): 87 − 92. FANG Yiran, CAI Jinhuan, XUE Li. Undergrowth plant diversity and soil physical properties in three reformed plantations [J]. Journal of South China Agricultural University, 2018, 39(4): 87 − 92. [8] 王岩松, 马保明, 高海平, 等. 晋西黄土区油松和刺槐人工林土壤养分及其化学计量比对林分密度的响应[J]. 北京林业大学学报, 2020, 42(8): 81 − 93. WANG Yansong, MA Baoming, GAO Haiping, et al. Response of soil nutrients and their stoichiometric ratios to stand density in Pinus tabuliformis and Robinia pseudoacacia plantations in the loess region of western Shanxi Province, Northern China [J]. Journal of Beijing Forestry University, 2020, 42(8): 81 − 93. [9] 董威, 刘泰瑞, 覃志杰, 等. 不同林分密度油松天然林土壤理化性质及微生物量碳氮特征研究[J]. 生态环境学报, 2019, 28(1): 65 − 72. DONG Wei, LIU Tairui, TAN Zhijie, et al. Research on the characteristics of soil physicochemical properties and microbial biomass carbon and nitrogen in natural Pinus tabulaeformis forests with different stand densities [J]. Ecology and Environmental Sciences, 2019, 28(1): 65 − 72. [10] PEICHL M, LEAVA N A, KIELY G. Above- and belowground ecosystem biomass, carbon and nitrogen allocation in recently afforested grassland and adjacent intensively managed grassland [J]. Plant &Soil, 2012, 350(1/2): 281 − 296. [11] KONG Weibo, YAO Yufei, ZHAO Zhongna, et al. Effects of vegetation and slope aspect on soil nitrogen mineralization during the growing season in sloping lands of the Loess Plateau [J]. Catena, 2019, 172: 753 − 763. [12] 杨学亭, 樊军, 盖佳敏, 等. 祁连山不同类型草地的土壤理化性质与植被特征[J]. 应用生态学报, 2022, 33(4): 878 − 886. YANG Xueting, FAN Jun, GE Jiamin, et al. Soil physical and chemical properties and vegetation characteristics of different types of grassland in Qilian Mountains, China [J]. Chinese Journal of Applied Ecology, 2022, 33(4): 878 − 886. [13] ZHANG Yunxiang, LIU Tairui, GUO Jingping, et al. Changes in the understory diversity of secondary Pinus tabulaeformis forests are the result of stand density and soil properties[J/OL]. Global Ecology and Conservation, 2021, 28: e01628 [2023-11-10]. doi: 10.1016/j.gecco.2021.e01628. [14] 李雪, 王静, 张静, 等. 林龄和林分密度对华北落叶松人工林土壤养分和细菌群落的影响[J]. 中南林业科技大学学报, 2022, 42(10): 83 − 92. LI Xue, WANG Jing, ZHANG Jing, et al. Effects of stand age and stand density on the soil nutrient and bacterial community of Larix principis-rupprechtii plantation [J]. Journal of Central South University of Forestry &Technology, 2022, 42(10): 83 − 92. [15] 吴茜, 傅红, 郝建锋, 等. 林分密度对四川云顶山柏木人工林林下植被种间关联的影响[J]. 应用与环境生物学报, 2023, 29(4): 922 − 932. WU Qian, FU Hong, HAO Jianfeng, et al. Effect of stand density on interspecific association with under-canopy planting of Cupressus funebris plantation on Yunding Mountain in Sichuan, China [J]. Chinese Journal of Applied and Environmental Biology, 2023, 29(4): 922 − 932. [16] CHEN Yunming, CAO Yang. Response of tree regeneration and understory plant species diversity to stand density in mature Pinus tabulaeformis plantations in the hilly area of the Loess Plateau, China [J]. Ecological Engineering, 2014, 73: 238 − 245. [17] 何如梦, 王百田, 于显威, 等. 晋西黄土区油松林的生长释放与生长抑制[J]. 应用与环境生物学报, 2018, 24(6): 1204 − 1210. HE Rumeng, WANG Baitian, YU Xianwei, et al. Growth release and growth inhibition of Pinus tabulaeformis forest in the Loess Plateau of western Shanxi Province, China [J]. Chinese Journal of Applied and Environmental Biology, 2018, 24(6): 1204 − 1210. [18] 云慧雅, 毕华兴, 焦振寰, 等. 晋西黄土区不同林分类型和密度条件下林下灌草组成及多样性特征[J]. 浙江农林大学学报, 2023, 40(3): 569 − 578. YUN Huiya, BI Huaxing, JIAO Zhenhuan, et al. Composition and diversity of understory plants under different stand types and densities in loess region of western Shanxi Province [J]. Journal of Zhejiang A&F University, 2023, 40(3): 569 − 578. [19] 刘俊廷, 张建军, 王恒星, 等. 晋西黄土区不同退耕年限油松林草本多样性与土壤养分的关系[J]. 干旱区研究, 2020, 37(2): 400 − 409. LIU Junting, ZHANG Jianjun, WANG Hengxing, et al. Relationship between species diversity at the herbaceous stratum and soil nutrients in Pinus tabulaeformis plantations of various ages on the Loess Plateau of western Shanxi Province, China [J]. Arid Zone Research, 2020, 37(2): 400 − 409. [20] 余新晓, 吴岚, 饶良懿, 等. 水土保持生态服务功能评价方法[J]. 中国水土保持科学, 2007(2): 110 − 113. YU Xinxiao, WU Lan, RAO Liangyi, et al. Assessment methods of ecological functions of soil and water conservation measures [J]. Science of Soil and Water Conservation, 2007(2): 110 − 113. [21] WANG L N, ZHU Q K, ZHAO W J, et al. The drought trend and its relationship with rainfall intensity in the Loess Plateau of China [J]. Natural Hazards, 2015, 77(1): 479 − 495. [22] 何如梦. 晋西黄土区人工油松林生长对干旱的响应[D]. 北京: 北京林业大学, 2021. HE Rumeng. The Growth of Pinus tabulaeformis Plantation Response to Drought in Loess Region of Western Shanxi Province[D]. Beijing: Beijing Forestry University, 2021. [23] WGIEL A, BIELINIE E, POLOWY K. The stock and content of micronutrients in aboveground biomass of Scots pine stands of different densities [J]. Journal of Elementology, 2019, 24(2): 615 − 628. [24] 赵晓雪, 饶良懿, 申震洲. 砒砂岩区不同地形位置土壤物理性质分异特征[J]. 应用与环境生物学报, 2020, 26(6): 1359 − 1368. ZHAO Xiaoxue, RAO Liangyi, SHEN Zhenzhou. Heterogeneous characteristics of soil physical properties of different terrain locations in the Pisha sandstone area [J]. Chinese Journal of Applied and Environmental Biology, 2020, 26(6): 1359 − 1368. [25] 鲁如坤. 土壤农业化学分析方法[M]. 北京: 中国农业科技出版社, 2000. LU Rukun. Methods of Soil Agrochemical Analysis [M]. Beijing: China Agricultural Science and Technology Press, 2000. [26] 韩新生, 许浩, 郭永忠, 等. 六盘山西侧华北落叶松林密度对生长和林分蓄积的影响[J]. 甘肃农业大学学报, 2023, 58(2): 169 − 179. HAN Xinsheng, XU Hao, GUO Yongzhong, et al. Influence of stand density on growth and stand volume of Larix principis-rupprechtil plantations on the west side of Liupan Mountain [J]. Journal of Gansu Agricultural University, 2023, 58(2): 169 − 179. [27] FAROOQ H T, WU Wenjing, TIGABU M, et al. Growth, biomass production and root development of Chinese fir in relation to initial planting density[J/OL]. Forests, 2019, 10(3): 236 [2023-11-10]. doi: 10.3390/f10030236. [28] TUN N T, GUO Jiao, FANG Shengzuo, et al. Planting spacing affects canopy structure, biomass production and stem roundness in poplar plantations [J]. Scandinavian Journal of Forest Research, 2018, 33(5): 464 − 474. [29] 公宁宁, 王小平, 李皓, 等. 北京地区40年生油松人工林密度效应的研究[J]. 林业资源管理, 2014(4): 85 − 91. GONG Ningning, WANG Xiaoping, LI Hao, et al. Management density effects of Pinus tabulaeformis plantation in Beijing [J]. Forest Resources Management, 2014(4): 85 − 91. [30] TSAMIR M, GOTTLIEB S, PREISLER Y, et al. Stand density effects on carbon and water fluxes in a semi-arid forest, from leaf to stand-scale[J/OL]. Forest Ecology and Management, 2019, 453: 117573 [2023-11-10]. doi: 10.1016/j.foreco.2019.117573. [31] BAI Yanfeng, SHEN Yangyang, JIN Yunduo, et al. Selective thinning and initial planting density management promote biomass and carbon storage in a chronosequence of evergreen conifer plantations in Southeast China[J/OL]. Global Ecology and Conservation, 2020, 24: e01216 [2023-11-10]. doi: 10.1016/j.gecco.2020.e01216. [32] 宋爱云, 董林水, 周金星, 等. 晋西黄土丘陵边缘区油松人工林密度调控与生物量特征[J]. 西北林学院学报, 2016, 31(4): 7 − 11, 66. SONG Aiyun, DONG Linshui, ZHOU Jinxing, et al. Suitable density management and biomass characters of Pinus tabulaeformis plantations in the ecotone between bedrock region and loess hill area of West Shanxi Province [J]. Journal of Northwest Forestry University, 2016, 31(4): 7 − 11, 66. [33] 简永旗, 吴家森, 盛卫星, 等. 间伐和林分类型对森林凋落物储量和土壤持水性能的影响[J]. 浙江农林大学学报, 2021, 38(2): 320 − 328. JIAN Yongqi, WU Jiasen, SHENG Weixing, et al. Effects of thinning and stand types on litter stock and soil water-holding capacity [J]. Journal of Zhejiang A&F University, 2021, 38(2): 320 − 328. [34] 王立超, 夏江宝, 赵玉尧, 等. 密度调控对鲁北黄泛平原区人工林土壤物理性质及植物多样性的影响[J]. 水土保持通报, 2022, 42(3): 43 − 48, 56. WANG Lichao, XIA Jiangbao, ZHAO Yuyao, et al. Effects of plant density regulation on soil physical properties and plant diversity of plantations in Yellow River Flood Plain of northern Shandong Province [J]. Bulletin of Soil and Water Conservation, 2022, 42(3): 43 − 48, 56. [35] 于洋, 卫伟, 陈利顶, 等. 黄土丘陵区坡面整地和植被耦合下的土壤水分特征[J]. 生态学报, 2016, 36(11): 3441 − 3449. YU Yang, WEl Wei, CHEN Liding, et al. Coupling effects of different land preparation and vegetation on soil moisture characteristics in a semi-arid loess hilly region [J]. Acta Ecologica Sinica, 2016, 36(11): 3441 − 3449. [36] 卜瑞瑛, 梁文俊, 魏曦, 等. 不同林分密度华北落叶松林的土壤养分特征[J]. 森林与环境学报, 2021, 41(2): 140 − 147. BU Ruiying, LlANG Wenjun, WEI Xi, et al. Soil nutrient characteristics of Larix principis-rupprechtii forest with different stand densities [J]. Journal of Forest and Environment, 2021, 41(2): 140 − 147. [37] QIU Xincai, WANG Haibin, PENG Daoli, et al. Thinning drives C: N: P stoichiometry and nutrient resorption in Larix principis-rupprechtii plantations in North China[J/OL]. Forest Ecology and Management, 2020, 462: 117984 [2023-11-10]. doi: 10.1016/j.foreco.2020.117984 [38] 兰道云, 毕华兴, 赵丹阳, 等. 晋西黄土区不同密度油松人工林保育土壤功能评价[J]. 水土保持学报, 2022, 36(2): 189 − 196. LAN Daoyun, BI Huaxing, ZHAO Danyang, et al. Evaluation on soil conservation function of Pinus tabulaeformis plantation with different densities in the loess area of Western Shanxi Province [J]. Journal of Soil and Water Conservation, 2022, 36(2): 189 − 196. [39] LUCAS-BORJA E M, DELGADO-BAQUERIZO M. Plant diversity and soil stoichiometry regulates the changes in multifunctionality during pine temperate forest secondary succession[J/OL]. Science of the Total Environment, 2019, 697: 134204 [2023-11-10]. doi: 10.1016/j.scitotenv.2019.134204. [40] 李轲, 赵勇钢, 刘小芳, 等. 黄土丘陵区典型草地演替中植物群落特征与土壤储水量关系[J]. 水土保持通报, 2019, 39(1): 55 − 60. LI Ke, ZHAO Yongqang, LIU Xiaofang, et al. Relationship between plant community characteristics and soil water storage along typical grassland succession in loess hilly region [J]. Bulletin of Soil and Water Conservation, 2019, 39(1): 55 − 60. -

-
链接本文:
https://zlxb.zafu.edu.cn/article/doi/10.11833/j.issn.2095-0756.20240571


 下载:
下载:
