


-
近年来,土壤盐渍化问题日益突出,盐胁迫已成为限制农、林、牧业健康可持续发展的重要因素之一。据统计,全球约有20%的耕地和50%的灌溉土地受到盐渍化的威胁,且面积仍在不断扩大[1-2]。中国盐渍土总面积约3.6×10⁷ hm2,占全国可利用土地面积的4.88%,主要分布在西北、华北、东北及沿海地区[1]。盐渍环境可能会抑制某些植物的生长发育[3],造成细胞水分亏缺[4],离子失衡[5],渗透作用失调[6],抗氧化酶系统紊乱[7],光合作用改变[8]等。盐胁迫对植物的毒害作用主要通过渗透胁迫、离子毒害、营养亏缺及其综合作用[4, 9-12]。研究表明:植物响应盐胁迫的生理机制主要有离子外排与区隔化、渗透调节、活性氧清除、光合作用改变、内源激素调节等[4-5, 13]。因此,深入研究植物的耐盐机理并提高植物的耐盐性已经成为研究者关注的热点。石榴Punica granatum作为集经济、营养、药用、观赏与生态价值于一身的优良果树[14],耐盐碱能力强,常用作盐碱地造林先锋树种[15-16],多种植于干旱和半干旱地区[14, 17]。也有报道认为:石榴是中度耐盐树种,利用盐水灌溉可以提高石榴的果实品质[18-19]。盐胁迫对石榴不同品种的生长和生理生化指标的影响不同[20-21],石榴细胞内钠和氯离子含量增加,会影响其他营养元素如氮、磷、钾、钙、镁等的吸收,从而引起营养缺失[22-23]。BHANTANA等[24]认为:石榴可以作为多年生落叶果树的模式植物,研究其对逆境的响应机制具有重要的意义。对石榴耐盐性的研究主要集中在离子平衡和生长方面[3, 20],还没有全面系统的阐述其抗盐机理的报道。因此,本试验选择‘泰山红’‘Taishanhong’,‘超大籽’‘Chaodazi’和‘红珍珠’‘Hongzhenzhu’3个适应性广,研究和推广价值高,但抗逆性和适应环境有所差异的优良石榴品种[15]作为试材。通过研究不同品种对盐胁迫的生理生化应答,筛选耐盐性指标,以期为将来在盐碱地石榴栽培和理论研究作参考。
HTML
-
盆栽实验在南京林业大学的人工气候室进行。选择‘泰山红’‘超大籽’和‘红珍珠’3个品种1年生扦插苗,2016年3月1日扦插于盆(32 cm × 25 cm)中,2株·盆-1,盆土基质为V(珍珠岩):V(草炭土)=1:1。设置人工气候室温度28/25 ℃(白/夜),光照周期14/10 h(光/暗),空气湿度75%,隔3 d浇1次水,隔1周浇1次Hoagland营养液[25]。石榴各品种生物学性状如表 1。
品种 单果质量/g 百粒质量/g 主栽区 果实品质 树体优势 泰山红 400~500 54 山东 果皮薄,质脆;籽粒鲜红色,粒大肉厚,软籽,品质优 适应性强,寿命长,耐瘠薄,抗旱,适应范围广,适用于绿化美化及轻盐碱地等栽植 超大籽 450~550 56 河南 粒大,色鲜,果个大,果仁软,味酸甜,品质极优 抗旱,抗病,抗寒,耐瘠薄,适应范围广,对土壤要求不严,均可良好生长 红珍珠 350~400 75 云南 果皮光滑,果锈较少;软籽,味酸甜,品质佳 适应范围广,抗寒,抗旱,抗病。植株较为矮小,在平原、沙地、丘陵等地区均适宜栽培 Table 1. Comparison of the traits of each pomegranate
-
2017年4月1日选择健壮并生长一致的石榴苗,用含不同氯化钠浓度[0(ck),150,300,450 mmol·L-1]的1/2 Hogland营养液处理,重复3次·处理-1,各重复5盆,2株·盆-1。隔3 d的上午10:00浇1次营养液(渗出的水分回浇),隔6 d用淡水冲洗土壤(洗净残留的盐分,防治盐分累积)。处理18 d后观察植株生长情况,并采集位于植株中上部的功能叶片10~15片,放入液氮中,带回实验室置于-80 ℃冰箱待测。将各处理的实验材料按照根、茎、叶分别收集,用水冲洗干净,晾干,带回实验室待用。
-
样品根、茎、叶在105 ℃烘箱中杀青15 min,70 ℃烘干48 h至恒量。分别称量,计算单株生物量与根冠比。叶绿素质量分数测定用丙酮浸提法[26];丙二醛(MDA)采用硫代巴比妥酸(TBA)法[27];脯氨酸(Proline)采用酸性茚三酮比色法[28];可溶性蛋白质(soluble protein)采用考马斯亮蓝G-250比色法[29];超氧化物歧化酶(SOD)采用氮蓝四唑NBT光化还原[30];过氧化物酶(POD)采用愈创木酚法[31];过氧化氢酶(CAT)采用紫外吸收法[32];叶片钾、钠离子质量分数经微波消煮后,用电感耦合等离子体发射光谱仪测定[33]。
-
所有数据由3个独立的生物学重复获得,表示为平均值±标准差。Excel预处理实验数据后,用SPSS 19.0进行ANOVA分析(P<0.05)和Duncan多重比较(P<0.05),用Excel 2013作图。运用灰色关联分析对不同耐盐指标进行筛选和排序。根据于洁等[34]的方法计算3个石榴品种的综合评价值(D),按照杨升等[35]方法,将3个品种的耐盐综合评价值及12个指标视为一个整体,计算各指标的关联度。
1.1. 材料
1.2. 方法
1.3. 指标测定
1.4. 数据分析
-
石榴3个品种的盐害率和盐害指数均随着盐浓度的增大而增大(图 1A,图 1B)。氯化钠浓度为300 mmol·L-1时,各品种的盐害率均接近100%,盐害指数均显著增大(P<0.05),表现为‘红珍珠’>‘超大籽’>‘泰山红’。可见,‘泰山红’耐盐性更强。与对照组相比,低盐浓度(150 mmol·L-1)下,‘泰山红’和‘超大籽’的单株生物量分别增长了21%和18%(P<0.05),而‘红珍珠’的生长却受到抑制;随着浓度升高,各品种生物量显著下降(图 1C),说明高盐胁迫抑制了石榴的生长。根冠比随着盐浓度的增大而增大(图 1D),由于胁迫时间短,其数值的变化主要是由地上部分生物量的下降导致。

Figure 1. Variasions of salt injury rate, salt injury index, biomass per plant and root cap ratio of each pomegranate cultivars under NaCl
-
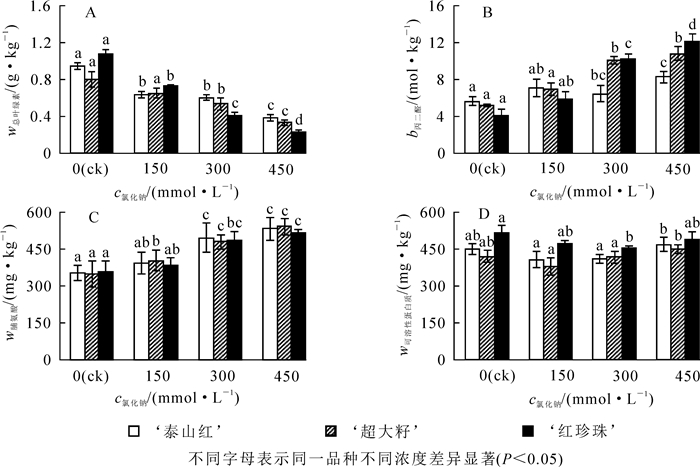
随着盐浓度增大,单位质量石榴叶片中叶绿素质量分数均显著下降(图 2A);与对照组相比,450 mmol·L-1盐处理后,‘泰山红’‘超大籽’‘红珍珠’叶片中叶绿素质量分数分别下降了59.6%,58.8%和78.7%(P<0.05),说明盐胁迫对‘红珍珠’叶片的叶绿素影响较大。丙二醛(MDA)是膜质过氧化的产物之一,其质量摩尔浓度越高,说明膜质氧化程度越大,受到的盐害也越重。研究发现:150 mmol·L-1氯化钠处理下,单位质量石榴叶片鲜样中MDA质量摩尔浓度升高,但品种间差异不显著;盐浓度达450 mmol·L-1时,‘泰山红’‘超大籽’‘红珍珠’叶片中MDA摩尔质量浓度分别比对照组升高了0.5,1.1和1.9倍(P<0.05)(图 2B)。脯氨酸和可溶性蛋白质是植物体内参与调解渗透胁迫的有机渗透调节物质。研究发现:随着氯化钠浓度的增大,3个石榴品种单位质量叶片中脯氨酸质量分数均升高(图 2C),300 mmol·L-1时均达到显著水平(P<0.05);叶片可溶性蛋白质的质量分数随着盐浓度的增大呈先降后升的趋势,‘泰山红’和‘超大籽’的最低值在150 mmol·L-1处,‘红珍珠’的最小值在300 mmol·L-1处(图 2D)。

Figure 2. Variasions of total chlorophyll, MDA, proline and soluble protein of each pomegranate cultivars under NaCl stress
-
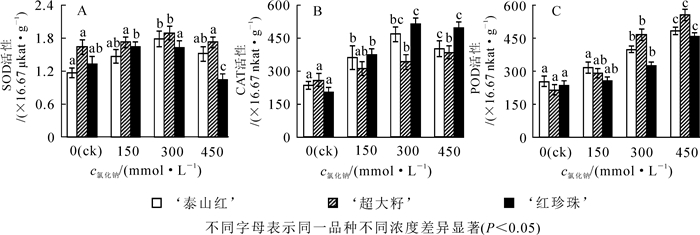
盐胁迫对石榴叶片内的抗氧化酶也有影响。随着盐浓度的升高,超氧化歧化酶(SOD)的活性先增大后减小(图 3A),与对照组相比,‘泰山红’和‘超大籽’的最大值出现在300 mmol·L-1处,且达到显著水平(P<0.05);‘红珍珠’的最大值在150 mmol·L-1处。高盐胁迫(450 mmol·L-1)下‘红珍珠’的SOD酶活性大大降低。‘泰山红’和‘红珍珠’叶片中的过氧化氢酶(CAT)的活性随着盐浓度的升高先增大后减小,最大值在300 mmol·L-1处;而‘超大籽’CAT酶活性随着盐浓度的增大而增大(图 3B)。3个石榴品种叶片中过氧化物酶(POD)的活性随着氯化钠浓度的增大而升高,300 mmol·L-1时均达到显著水平(P<0.05)(图 3C)。

Figure 3. Variasions of SOD, CAT, POD activities in each pomegranate cultivars leaves under NaCl stress
-
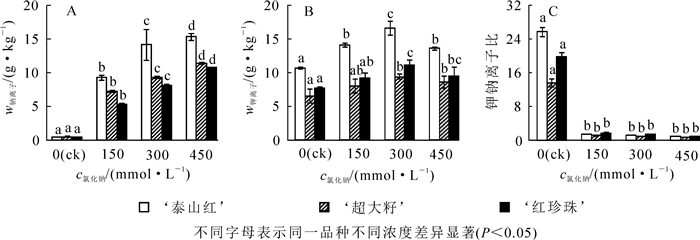
盐胁迫下,钠离子在石榴叶片中迅速积累;随着氯化钠浓度升高,3个石榴品种单位质量叶片中钠离子分别比对照增加了22.3~37.3,14.6~26.3和12.6~23.6倍(图 4A),差异显著(P<0.05);各品种叶片中钠离子的累积量排序为‘泰山红’>‘超大籽’>‘红珍珠’。3个石榴品种单位质量叶片中钾离子质量分数均随着氯化钠浓度增大呈先上升后下降的趋势,并在300 mmol·L-1时达到最大值(图 4B),差异显著(P<0.05);各品种叶片中钾离子的累积量排序为‘泰山红’>‘红珍珠’>‘超大籽’;相比对照组,300 mmol·L-1氯化钠处理下,各品种叶片中钾离子质量分数分别增加了55.4%,46.2%和42.8%。可见,盐胁迫下,‘泰山红’叶片吸收和积累较多的钠钾离子,‘超大籽’次之,‘红珍珠’最小。各石榴品种叶片的钾钠离子比在盐胁迫下显著下降(图 4C),各处理之间差异不显著,当氯化钠浓度不超过300 mmol·L-1时,钾钠离子比均大于1,说明石榴在中度盐胁迫下仍能够保持一定的离子平衡。

Figure 4. Variations of Na+, K+, K+/Na+ ratio in each pomegranate cultivars leaves under NaCl stress
-
计算可知:各石榴品种的耐盐性与各指标之间的关联度为0.409~0.828(表 2),其中关联度最大的是生物量,其次为叶片中钠离子质量分数,分别为0.828和0.652。各指标按关联度从大到小排序前7个为生物量>钠离子质量分数>SOD活性>盐害指数>钾钠离子比>钾离子质量分数>MDA质量摩尔浓度。由于钾钠离子比这一指标的变化包含了钠离子和钾离子质量分数的变化,因此筛选出单株生物量、SOD酶活性、盐害指数、钾钠离子比值和MDA质量摩尔浓度等5个指标,来评价石榴在盐胁迫环境下的生长情况、膜系统稳定性、渗透调节能力和离子平衡能力等。
指标 关联度 关联序 x1(盐害指数) 0.592 4 x2(生物量) 0.828 1 x3(叶绿素质量分数) 0.527 9 x4(脯氨酸质量分数) 0.522 10 x5(可溶性蛋白质质量分数) 0.409 12 x6(丙二醛质量摩尔浓度) 0.545 7 x7(SOD活性) 0.614 3 x8(CAT活性) 0.453 11 x9(POD活性) 0.539 8 x10(钾离子质量分数) 0.547 6 x11(钠离子质量分数) 0.652 2 x12(钾钠离子比值) 0.548 5 Table 2. Grey correlation coefficient, value and sequence of different traits
2.1. 盐胁迫对石榴生长的影响
2.2. 盐胁迫对石榴叶片叶绿素,丙二醛(MDA),脯氨酸和可溶性蛋白质的影响
2.3. 盐胁迫对石榴叶片抗氧化酶活性的影响
2.4. 盐胁迫对石榴叶片离子及比值的影响
2.5. 灰色关联分析法筛选耐盐指标
-
盐渍环境下,植物的生物量和盐害特征是反映植物耐盐性大小的最直观表型。有研究表明:盐胁迫对植物的生长有抑制作用[4];也有人认为:虽然高盐对植物有害,但低钠对植物生长也会有促进作用,这可能是因为钠是植物生长的必需元素[36-37]。研究表明:石榴的一些品种如‘Manfalouty’‘Wonderfull’和‘Nab-Elgamal’在盐胁迫下苗高、地径、干质量、鲜质量等都显著下降[21, 38];而另一些品种如‘MalasShirin’‘Voshike-e-Saravan’和‘Tab-o-Larz’在低盐胁迫下则生长良好[21, 39]。本试验也发现:与对照相比,盐胁迫抑制了‘红珍珠’的生长,但在150 mmol·L-1氯化钠处理下,‘泰山红’和‘超大籽’的生物量有所增加(图 1C),说明不同石榴品种耐盐性存在差异。本研究还发现:随盐胁迫程度增加,单位质量石榴叶片脯氨酸、可溶性蛋白质、钾离子质量分数增加,SOD,CAT和POD活性提高,起到缓解盐害和防御活性氧伤害的作用[40];但当氯化钠浓度超过300 mmol·L-1时,钾钠离子比小于1,钾离子质量分数和SOD,CAT活性均开始下降(图 3A,图 3B)。该研究结果说明石榴具有一定的耐盐性,能够抵抗中度(300 mmol·L-1)的盐胁迫,与前人的研究结果一致[18, 41]。
-
植物耐盐性是一个复杂的反应过程。盐渍环境下,植物的形态结构和生理生化等各方面都可能发生变化。本研究利用灰色关联分析法对12个耐盐性指标进行了筛选,结果筛选出单株生物量、钠离子质量分数、SOD活性、盐害指数、钾钠离子比值、钾离子质量分数和丙二醛质量摩尔浓度等7个指标。对石榴的耐盐性评价反应出石榴在盐胁迫环境下的生长情况、膜系统稳定性、渗透调节能力和离子平衡能力。SOD是重要的抗氧化酶之一,能够减轻膜系统的氧化损伤[42],而MDA是植物膜质过氧化的产物之一,其质量摩尔浓度的大小能够衡量植物膜质过氧化程度[43]。本研究发现:随着氯化钠浓度的升高,MDA质量摩尔浓度上升,石榴膜质过氧化程度加重,与杨升等[35]研究结果一致。盐渍环境下,钠离子是植物内主要的毒害离子之一,钾离子在植物的蛋白质合成、光合作用、细胞渗透压平衡和酶激活反应等方面起着重要作用[44]。高盐胁迫破坏植物细胞乃至整个植物体的钠离子和钾离子稳态的失衡。本研究发现,随着氯化钠浓度的增加,石榴叶片中钠离子大量积累,是盐害加重的主要原因。当盐浓度不超过300 mmol·L-1时,钾离子作为无机渗透调节剂,其质量分数的升高,有利于缓解钠离子毒害,建立离子平衡稳态和维持合理的钾钠离子比值。许多研究证明:钾钠离子比是衡量植物的抗盐能力大小的重要指标之一[4, 45-47]。因此,筛选出单株生物量、SOD活性、盐害指数、钾钠离子比值和MDA质量摩尔浓度5个形态和生理生化指标,对评价这3个石榴品种的耐盐性是比较科学合理的。
本研究对形态和生理生化指标的综合研究发现,石榴能够承受的氯化钠浓度不超过300 mmol·L-1,且用生长量、盐害特征以及离子质量分数等指标判断其耐盐性大小,具有理论和实践的指导意义。本研究只选择了3个石榴品种,要全面系统的研究石榴的耐盐性,筛选耐盐评价指标并建立评价标准体系还需要不断深入探索。
 DownLoad: