Volume 36 Issue 5
Sep.  2019
Turn off MathJax
Article Contents

ZHAO Jingyao, ZHANG Xuexia, YANG Wei. Leaf equivalent water thickness estimation based on spectral moisture indexes in broadleaf species[J]. Journal of Zhejiang A&F University, 2019, 36(5): 868-876. doi: 10.11833/j.issn.2095-0756.2019.05.004
Citation: ZHAO Jingyao, ZHANG Xuexia, YANG Wei. Leaf equivalent water thickness estimation based on spectral moisture indexes in broadleaf species[J]. Journal of Zhejiang A&F University, 2019, 36(5): 868-876. doi: 10.11833/j.issn.2095-0756.2019.05.004

Leaf equivalent water thickness estimation based on spectral moisture indexes in broadleaf species

doi: 10.11833/j.issn.2095-0756.2019.05.004
  • Received Date: 2018-03-18
  • Rev Recd Date: 2018-05-03
  • Publish Date: 2019-10-20
  • To quickly and accurately obtain the leaf water content of plants, an important evaluation indicator for evaluating the plant water status, a sensitivity analysis with the PROSPECT Model was performed using the traditional sensitivity analysis method and the EFAST (Extended Fourier Amplitude Sensitivity Test) method. Then, the spectral water indexes with a high sensitivity were selected. Using 8 deciduous broadleaf tree species as the research samples, 1 494 spectral data as input data, an equivalent water thickness estimation model was established and validated based on the ground equivalent water thickness and spectral data. Results showed that EFAST was more sensitive than the traditional sensitivity analysis method in quantifying characteristics of various biochemical parameters. The sensitive wavelength of leaf equivalent water thickness (lEWT) was in the range of 900-2 500 nm, but in the same range, spectral reflectance was also affected by leaf structure and dry matter content. Among the eight spectral water indexes selected, moisture stress index (IMSI), normalized difference infrared index (INDⅡ), and normalized difference water index (INDWI1640) effectively increased sensitivity to lEWT. Validation results based on measured data showed that prediction accuracy of INDWI1640 and INDⅡ estimation models were better than other indexes. Therefore, among the spectral water indexes selected for this study, INDWI1640 and INDⅡ were the best indexes for estimating leaf equivalent water thickness at the scale of the plant leaf; whereas, normalized difference water index (INDWI1240) and simple ratio water index (ISRWI) were suitable for inversion of leaf equivalent water thickness in the areas with lower moisture. The research demonstrated that EFAST method has significant value in guiding modification for localization of model parameters.
  • [1] TAN Cancan, NIE Wen, LIU Yifu, WANG Ya, DONG Yao, HUANG Ruizhi, LIU Jianfeng, SHI Shengqing, CHANG Ermei, ZHAO Xiulian, JIANG Zeping, JIA Zirui.  Tree growth model and bark thickness model of three Quercus species based on trunk analysis . Journal of Zhejiang A&F University, 2023, 40(3): 589-597. doi: 10.11833/j.issn.2095-0756.20220455
    [2] LI Siyuan, YE Zhenni, MAO Yongwei, CHEN Yuling, ZENG Na.  Comparison of four fusion models for generating high spatio-temporal resolution NDVI . Journal of Zhejiang A&F University, 2023, 40(2): 427-435. doi: 10.11833/j.issn.2095-0756.20220381
    [3] SUN Zhanwei, MA Lan, MEI Xuemei, LIU Jingjing, WANG Fuxing, ZHANG Jinge, YAN Lin.  Characteristics of soil moisture and its main influencing factors in different hydrological years in western Shanxi loess region . Journal of Zhejiang A&F University, 2021, 38(1): 10-20. doi: 10.11833/j.issn.2095-0756.20200260
    [4] ZHOU Yong, XU Tongxin, LUO Shuwen, YANG Hao, CHANG Meng, ZHUANG Jiayao.  Response of rainfall runoff to forest quality in Shicheng County, Jiangxi Province . Journal of Zhejiang A&F University, 2021, 38(3): 502-509. doi: 10.11833/j.issn.2095-0756.20200505
    [5] LIU Guangwu, CHEN Chen, WANG Keli.  Density index model of the Pinus massoniana plantation based on artifical neural network (ANN) . Journal of Zhejiang A&F University, 2020, 37(1): 100-104. doi: 10.11833/j.issn.2095-0756.2020.01.013
    [6] DAI Qilin, ZHANG Chao, SHANG Kerong, ZHOU Yan, QIU Lei, YU Shuquan.  Rational annual cutting volume of forest management units based on FSOS . Journal of Zhejiang A&F University, 2020, 37(5): 833-840. doi: 10.11833/j.issn.2095-0756.20190651
    [7] WANG Dongli, HAO Kexin, LIANG Xiaosa, FANG Xiang, TANG Jiaxi, LIAN Zhao, ZHAO Yan, SHEN Haiou.  Litter characteristics and water holding capacity in Pinus sylvestris var. mongolica sandy-fixation plantations with disturbances . Journal of Zhejiang A&F University, 2019, 36(6): 1125-1133. doi: 10.11833/j.issn.2095-0756.2019.06.009
    [8] MU Yanan, DING Lixia, LI Nan, LU Linying, WU Ming.  Classification of coastal wetland vegetation in Hangzhou Bay with an object-oriented, random forest model . Journal of Zhejiang A&F University, 2018, 35(6): 1088-1097. doi: 10.11833/j.issn.2095-0756.2018.06.012
    [9] ZHANG Haitao, GONG Yuanbo, FU Wanquan, CHEN Yaojia, XU Yunyan, CUI Yaxiao.  Rainfall and runoff in low efficiency Pinus massoniana forests with different silvicultural prescriptions . Journal of Zhejiang A&F University, 2018, 35(1): 29-34. doi: 10.11833/j.issn.2095-0756.2018.01.004
    [10] HU Mengxiao, HANG Yun, HUANG Huahong, ZHANG Shenglong, TONG Zaikang, LOU Xiongzhen.  A near infrared prediction model and variation analysis of wood crystallinity in Cunninghamia lanceolata . Journal of Zhejiang A&F University, 2017, 34(2): 361-368. doi: 10.11833/j.issn.2095-0756.2017.02.022
    [11] HE Tao, SUN Yujun.  Dynamic monitoring of forest carbon stocks based on the InVEST model . Journal of Zhejiang A&F University, 2016, 33(3): 377-383. doi: 10.11833/j.issn.2095-0756.2016.03.002
    [12] LI Yadan, DU Huaqiang, ZHOU Guomo, GU Chengyan, XU Xiaojun, SUN Shaobo, GAO Guolong.  Chlorophyll content in Phyllostachys violascens related to hyper-spectral vegetation indices and development of an inversion model . Journal of Zhejiang A&F University, 2015, 32(3): 335-345. doi: 10.11833/j.issn.2095-0756.2015.03.002
    [13] LIU Xin1, ZHANG Jinchi, XIE Dejin, ZHUANG Jiayao, SHAO Yongchang, ZHANG Shuifeng.  Temporal variation for canopy transpiration and its cooling properties in a Quercus acutissima forest of suburban Nanjing . Journal of Zhejiang A&F University, 2015, 32(4): 529-536. doi: 10.11833/j.issn.2095-0756.2015.04.006
    [14] WU Huqiang, SHAO Yongchang, ZHUANG Yilin, ZHANG Jinchi, HAN Cheng, LIU Xin, ZHUANG Jiayao.  Lateral water flow and volumetric water content with rainfall for soils in a suburban Quercus acutissima forest in Nanjing . Journal of Zhejiang A&F University, 2014, 31(5): 683-689. doi: 10.11833/j.issn.2095-0756.2014.05.004
    [15] HAN Cheng, ZHANG Jinchi, ZHUANG Yilin, GU Zheyan, LIU Xin, ZHUANG Jiayao.  Rainfall redistribution in a Cunninghamia lanceolata forest of the Yangtze River Delta . Journal of Zhejiang A&F University, 2014, 31(3): 424-430. doi: 10.11833/j.issn.2095-0756.2014.03.015
    [16] YU Jing-fang, YU Shu-quan, ZHANG Chao, LI Tu-sheng.  Net primary productivity estimates for Zhejiang Province based on the CASA model . Journal of Zhejiang A&F University, 2012, 29(4): 473-481. doi: 10.11833/j.issn.2095-0756.2012.04.001
    [17] LIU Wei-yi, FAN Shao-hui, SU Wen-hui, LIU Guang-lu, YU Lin.  Research on hydrological effect in different interfaces under bamboo forests . Journal of Zhejiang A&F University, 2011, 28(3): 486-493. doi: 10.11833/j.issn.2095-0756.2011.03.022
    [18] ZHAO Li-jun, LI Ji-yue, ZHU Li-qiong.  A study of application of solid-water in vegetation restoration . Journal of Zhejiang A&F University, 2004, 21(2): 144-149.
    [19] WANG Sheng-kui.  Optimal model of sustainable development of forests . Journal of Zhejiang A&F University, 2001, 18(3): 233-237.
    [20] Zheng Yongping, Zeng Jianfu, Wang Hemu, Shi Bailin, Yu Qionghua.  Polymorphic Site Model for Chinese Fir in Zhejiang Province . Journal of Zhejiang A&F University, 1993, 10(1): 55-62.
  • [1]
    RIAÑO D, VAUGHAN P, CHUVIECO E, et al. Estimation of fuel moisture content by inversion of radiative transfer models to simulate equivalent water thickness and dry matter content:analysis at leaf and canopy level[J]. IEEE Trans Geosci Remote Sensing, 2005, 43(4):819-826.
    [2]
    CHENG Zhiqing, ZHANG Jingsong, MENG Ping, et al. Estimation model of poplar equivalent water thickness based on hyperspectral information[J]. For Res, 2016, 29(6):826-833.
    [3]
    WANG Meng, ZHANG Lianpeng, MA Weiwei, et al. Remote sensing inversion of leaf biochemical components through PCA algorithm[J]. J Geomatics Sci Technol, 2013, 30(6):619-623.
    [4]
    JI Ronghua, ZHENG Lihua, DENG Xiaolei, et al. Forecasting chlorophyll content and moisture of apple leaves in different tree growth period based on spectral reflectance[J]. Trans Chin Soc Agric, 2014, 45(8):269-275.
    [5]
    HU Zhenzhu, PAN Cunde, PAN Xin, et al. Estimation models for water content of walnut leaves based on spectral moisture index[J]. Sci Silv Sin, 2016, 52(12):39-49.
    [6]
    FENG Haikuan, LI Zhenghai, JIN Xiuliang, et al. Estimating equivalent water thickness of apple leaves using hypersecptraldata based on EFAST and PLS[J]. Trans Chin Soc Agric Eng, 2016, 32(12):165-171.
    [7]
    WANG Qinghua, ZHU Xicun, WANG Ling, et al. Quantitative estimation of equivalent water thickness of apple leaves based on hyperspectral transformation[J]. Infrared, 2016, 37(11):42-48.
    [8]
    LU Cheng, CHEN Shengbo, LIU Wansong. Research of PROSPECT leaf optical property model[J]. World Geol, 2013, 32(1):177-188.
    [9]
    XU Shoulin. Study on Estimating Biochemical Content of Leaf Based on Radiative Transfer Model[D]. Wuhan: Huazhong University of Science and Technology, 2009.
    [10]
    CECCATO P, FLASSE S, TARANTOLA S, et al. Detecting vegetation leaf water content using reflectance in the optical domain[J]. Remote Sensing Environ, 2001, 77(1):22-33.
    [11]
    FANG Meihong, JU Weimin. A inversion model for remote sensing of leaf water content based on the leaf optical property[J]. Spectrosc Spectral Anal, 2015, 35(1):167-171.
    [12]
    COLOMBO R, MERONI M, MARCHESI A, et al. Estimation of leaf and canopy water content in poplar plantations by means of hyperspectral indices and inverse modeling[J]. Remote Sensing Environ, 2008, 112(4):1820-1834.
    [13]
    GUO Chaofan, DUAN Fuzhou, GUO Xiaoyu, et al. Estimating wetland plant leaf total nitrogen content based on optimal bands of reflectance from wetland vegetation[J]. Acta Ecol Sin, 2014, 34(17):4839-4849.
    [14]
    FERET J B, FRANÇOIS C, ASNER G P, et al. PROSPECT-4 and 5:Advances in the leaf optical properties model separating photosynthetic pigments[J]. Remote Sensing Environ, 2015, 112(6):3030-3043.
    [15]
    WU Ling, LIU Xiangnan, ZHOU Botian, et al. Simulation of vegetation indices optimizing under retrieval of vegetation biochemical parameter based on PROSPECT+SAIL model[J]. Chin J Appl Ecol, 2012, 23(12):3250-3256.
    [16]
    WANG Lijuan, NIU Zheng. Sensitivity analysis of vegetation parameters based on PROSAIL model[J]. Remote Sensing Technol Appl, 2014, 29(2):219-223.
    [17]
    SALTELLI A, TARANTOLA S, CHAN P S. A quantitative model-independent method for global sensitivity analysis of model output[J]. Technometrics, 1999, 41(1):39-56.
    [18]
    BAI Yunjie, LIU Ling, LI Xin, et al. Sensitivity analysis on snow parameters impacting passive microwave brightness temperature of snow:an study based on MEMLS[J]. Remote Sensing Technol Appl, 2009, 24(5):622-630.
    [19]
    GONG Zhaoning, LIN Chuan, ZHAO Wenji, et al. Canopy water content estimation for typical emerged plant community using WorldView-2 imagery:a case study in wild duck lake wetlang, Beijing[J]. J Infrared Millimeter Wave, 2014, 33(5):533-545.
    [20]
    ERJR H, ROCK B N. Detection of changes in leaf water content using near-and middle-infrared reflectances[J]. Remote Sensing Environ, 1989, 30(1):43-54.
    [21]
    ZARCO P J. Water content estimation in vegetation with MODIS reflectance data and model inversion methods[J]. Remote Sensing Environ, 2003, 85(1):109-124.
    [22]
    HARDISKYS M, KLEMAS V, SMART R M, et al. The influence of soil salinity, growth form, and leaf moisture on the spectral radiance of Spartina Alterniflora canopies[J]. Photogramm Eng Remote Sensing, 1983, 48(1):77-84.
    [23]
    GAO Bocai. NDWI:anormalized difference water index for remote sensing of vegetation liquid water from space[J]. Remote Sensing Environ, 1996, 58(3):257-266.
    [24]
    CHEN Daoyi, HUANG Jingfeng, JACKSON T J. Vegetation water content estimation for corn and soybeans using spectral indices derived from MODIS near-and short-wave infrared bands[J]. Remote Sensing Environ, 2005, 98(2/3):225-236.
    [25]
    WANG Lingli, QU J J, HAO Xianjun, et al. Sensitivity studies of the moisture effects on MODIS SWIR reflectance and vegetation water indices[J]. Int J Remote Sensing, 2008, 29(24):7065-7075.
    [26]
    CECCATO P, FLASSE S, GREGOIRE J M. Designing a spectral index to estimate vegetation water content from remote sensing data:Part 1. theoretical approach[J]. Remote Sensing Environ, 2002, 81(2):188-197.
    [27]
    CHEN Xiaoping, WANG Shudong, ZHANG Lifu, et al. Accuracy and sensitivity of retrieving vegetation leaf water content[J]. Remote Sensing Inf, 2016, 31(1):48-57.
    [28]
    ZHANG Jiahua, GUO Wenjuan, YAO Fengmei. The study on vegetation water content estimating model based on remote sensing technique[J]. J Basic Sci Eng, 2007, 15(1):45-53.
  • 加载中
通讯作者: 陈斌, bchen63@163.com
  • 1. 

    沈阳化工大学材料科学与工程学院 沈阳 110142

  1. 本站搜索
  2. 百度学术搜索
  3. 万方数据库搜索
  4. CNKI搜索

Figures(3)  / Tables(5)

Article views(2961) PDF downloads(102) Cited by()

Related
Proportional views

Leaf equivalent water thickness estimation based on spectral moisture indexes in broadleaf species

doi: 10.11833/j.issn.2095-0756.2019.05.004

Abstract: To quickly and accurately obtain the leaf water content of plants, an important evaluation indicator for evaluating the plant water status, a sensitivity analysis with the PROSPECT Model was performed using the traditional sensitivity analysis method and the EFAST (Extended Fourier Amplitude Sensitivity Test) method. Then, the spectral water indexes with a high sensitivity were selected. Using 8 deciduous broadleaf tree species as the research samples, 1 494 spectral data as input data, an equivalent water thickness estimation model was established and validated based on the ground equivalent water thickness and spectral data. Results showed that EFAST was more sensitive than the traditional sensitivity analysis method in quantifying characteristics of various biochemical parameters. The sensitive wavelength of leaf equivalent water thickness (lEWT) was in the range of 900-2 500 nm, but in the same range, spectral reflectance was also affected by leaf structure and dry matter content. Among the eight spectral water indexes selected, moisture stress index (IMSI), normalized difference infrared index (INDⅡ), and normalized difference water index (INDWI1640) effectively increased sensitivity to lEWT. Validation results based on measured data showed that prediction accuracy of INDWI1640 and INDⅡ estimation models were better than other indexes. Therefore, among the spectral water indexes selected for this study, INDWI1640 and INDⅡ were the best indexes for estimating leaf equivalent water thickness at the scale of the plant leaf; whereas, normalized difference water index (INDWI1240) and simple ratio water index (ISRWI) were suitable for inversion of leaf equivalent water thickness in the areas with lower moisture. The research demonstrated that EFAST method has significant value in guiding modification for localization of model parameters.

ZHAO Jingyao, ZHANG Xuexia, YANG Wei. Leaf equivalent water thickness estimation based on spectral moisture indexes in broadleaf species[J]. Journal of Zhejiang A&F University, 2019, 36(5): 868-876. doi: 10.11833/j.issn.2095-0756.2019.05.004
Citation: ZHAO Jingyao, ZHANG Xuexia, YANG Wei. Leaf equivalent water thickness estimation based on spectral moisture indexes in broadleaf species[J]. Journal of Zhejiang A&F University, 2019, 36(5): 868-876. doi: 10.11833/j.issn.2095-0756.2019.05.004
  • 植物的蒸腾作用是生物圈水循环中非常重要的一个环节,对于调节大气湿度、环境温度和降雨量有着重要作用。植被水分含量也是影响生物体燃烧的一个重要因素[1],对森林火险有着重要的影响。在干旱和半干旱地区,叶片含水量可以反映水分胁迫下树木的生长状态,进而对不同树种的耐旱性能进行评价。同时,植物叶片含水量也是陆面生态模型计算的一个关键参数[2]。因此,快速、准确地估算植物的叶片含水量,不仅可以为绿化园林建设,提升区域生态功能,打造生态宜居城市提供指导意义,而且在防护林经营管理以及森林火灾风险管理和预测方面也具有重要的参考价值。传统的叶片水分含量测定方法需要对植物进行破坏性采样,而且耗时费力。光谱技术的快速发展,使快速无损伤地测定叶片水分含量成为可能。目前,利用高光谱数据估算植被生化参数的方法主要有2种[3]:一是基于经验和半经验的统计方法,即建立光谱反射率或其变化形式与植被生化参数的回归方程来估算植被生化参数,半经验统计方法的重点是构建与某一生化参数高度相关而对其他参数不敏感的植被指数,建立其与生化参数之间的关系,对植被生化参数进行估算。二是基于辐射传输模型反演方法,辐射传输模型描述了植被与入射光谱之间的相互作用过程和特征,相对于传统的经验/半经验方法,辐射传输模型物理意义明确,稳定性好且具有普适性。冀荣华等[4]研究表明:在420~500,640~680和740~860 nm等3个波段区间内叶片含水量与反射光谱有较高的相关性,而且采用神经元网络方法建立的苹果Malus pumila叶片含水量预测模型精度较高。胡珍珠等[5]选取水分指数(water index, IWI),水分波段指数(water band index, IWBI),归一化水分指数(normalized difference water index, INDWI),比值指数(IWI/INDWI),中心波长比值指数(IRatio975)和光化/生理反射(photochemical reflectance index,IPRI)等6种光谱水分指数构建了核桃Juglans叶片等效水厚度估算模型,表明应用光谱水分指数可以较好地定量反演核桃叶片含水量。冯海宽等[6]利用扩展傅里叶幅度灵敏度检测方法和偏最小二乘方法,构建新的归一化近红外水分指数(INDIWI)建立苹果叶片等效水厚度估算模型,表明EFAST-PLS在估算叶片等效水厚度方面有较大潜力。程志庆等[2]应用IGVMI/IMSI,全球植被水分指数(IGVMI),水分胁迫指数(moisture stress index, IMSI)估算杨树Populus叶片水分含量,表明IGVMI/IMSI指数为估算杨树叶片等效水厚度的最佳指数。王青华等[7]分析了原始光谱的反射率及其13种变换光谱反射率与苹果叶片水分含量之间的相关性,筛选敏感波段并利用支持向量机建立了苹果叶片等效水厚度的定量估算模型,达到较好精度。目前,应用最为广泛的植物叶片辐射传输模型主要为PROSPECT模型和LIBERTY模型,分别用于模拟计算阔叶和针叶的反射率和透射率。陆成等[8]研究表明:PROSPECT模型有良好的物理基础,能够准确地模拟叶片的反射率和透射率。徐寿林[9]基于PROSPECT模型和粒子群算法建立了叶片生化组分与光谱反射率之间的关系,为反演提取叶片组分的含量信息打下了基础。CECCATO等[10]通过对PROSEPCT模型进行敏感度分析,表明结合近红外波段(NIR)和短波近红外波段(SWIR)可以提高估算叶片等效水厚度的精度。方美红等[11]基于PROSPECT模型的辐射传输理论,并用实测数据验证表明小波分析方法在反演叶片水分含量方面具有独特的优势。COLOMBO等[12]分别使用光谱水分指数和PROSPECT模型估算了叶片等效水厚度,探究了经验模型和辐射传输模型估算叶片含水量的适用性。目前,植被水分估算研究大多应用于作物水分方面,对阔叶树种的研究较少。而且传统的基于特征波段建立的叶片水分估算模型,由于光谱信息复杂,容易存在入选波段稳定性差,生化参量含义不明确、多重共线性、回归过度拟合的问题[13]。光谱指数可以使光谱反射信息最大化,外部因素最小化,简化叶片含水量估算模型。本研究以阔叶树种为研究对象,利用EFAST全局敏感性分析方法,旨在筛选与叶片含水量敏感度高的光谱水分指数,构建叶片等效水厚度估算模型,为叶片层次上估算等效水厚度提供技术参考。

  • 本研究选取8个阔叶树种作为研究对象,分别为华东椴Tilia japonica,山杏Armeniacasibirica,洋白蜡Fraxinuspennsylvanica,加杨Populus × canadensis,蒙古栎Quercus mongolica,美国榆Ulmusamericana,刺槐Robiniapseudoacacia,臭椿Ailanthus altissima定期进行样本采集,并测量得到其叶片光谱反射率数据和叶片等效水厚度数据。监测地点选在北京林业大学校园内,监测时间为2016年4-10月和2017年5-6月,监测周期为7 d。

  • 叶片光谱测定采用荷兰爱万提斯AvaSpec光纤光谱仪进行测定,其中可见光光谱仪波长范围为200~1 100 nm,近红外光谱仪范围为1 000~2 500 nm,光谱间隔为1 nm。叶片光谱测定时间与采集样本时间同步,选在11:00到14:00光照充足,晴朗少云无风的时段进行。对新鲜叶片样品测量光谱后迅速放入自封袋中带回实验室进行叶片等效水厚度的测定。

  • 使用精度为1/1 000的分析天平称取采得的叶片鲜质量,用Yaxin-1241叶面积仪测量得到叶片面积,然后使用烘箱将所有叶片样品在75 ℃条件下烘干48 h以上,直至恒量再次称量得到叶片干质量。叶片等效水厚度(lEWT)的计算公式如下:lEWT =(mFW-mDW)/A。其中:lEWT为等效水厚度(g·cm-2或者cm),mFW表示叶片鲜质量(g),mDW表示叶片干质量(g),A为叶片面积(cm2)。

  • PROSPECT模型通过模拟叶片在400~2 500 nm波段内的上行和下行辐射通量得到叶片的反射率和透射率。该模型假设叶片由N层同性质的平板堆叠而成,并由N-1层空气隔开,只有在叶片表皮存在光线的非漫射特性,而在叶片内部,光线被认为是各向同性的。本研究采用最新版PROSPECT模型(PROSPECT5)[14]。该模型把光合色素区分为叶绿素和类胡萝卜素来探索叶片的光合特性,并通过计算新的折射指数以及设置更加合理的叶片表面参数,从而使模拟的叶片反射率更加准确,是目前得到广泛认可的叶片辐射传输模型之一。PROSPECT5模型需要6个输入参数,包括叶片结构(N),叶绿素含量(Cab,μg·cm-2),等效水厚度(lEWT,g·cm-2),类胡萝卜素含量(Car,μg·cm-2),叶黄素含量(Cbrown,μg·cm-2)和干物质含量(Cm,g·cm-2)。研究参照公开的野外实测数据集LOPEX’93(Leaf Optical Properties Experiment)中的样本数据[15-16]以及实测叶片样本数据,确定了模型各参数的取值范围(表 1)。

    参数叶片结构参数(N叶绿素(Cab)/
    (μg·cm-2
    类胡萝卜素(Car)/
    (μg·cm-2
    叶黄素(Cbrown)/
    (μg·cm-2
    等效水厚度(lEWT)/
    (g·cm-2
    干物质(Cm)/
    (μg·cm-2
    分布范围1.0~4.015~903~200.000 6~0.002 00.005~0.0500.002~0.020
    分布形式均匀分布均匀分布均匀分布均匀分布均匀分布均匀分布

    Table 1.  Range of input parameters for PROSPECT model

  • 扩展傅立叶振幅灵敏度分析(EFAST)是由SALTELLI等[17]在CUKIER等的基础上进一步扩展的一种敏感性分析方法。EFAST可以定性并且定量地得到不同输入参数对模型输出结果的影响。EFAST是对局部敏感性分析的一种改进,它允许模型的输入参数可以同时变化,以探究参数之间的耦合作用对模型输出结果的影响。局部敏感性分析只允许一个参数变化,其他参数保持不变。EFAST分析方法可以得到一阶敏感指数和总阶敏感指数,一阶敏感指数表示的是目标模型输入参数的方差占总方差的百分比,总阶敏感指数表示目标输入参数和所有输入参数之间相互作用的方差占总体方差的百分比。当模型输入参数相互独立或者说参数之间没有耦合作用时,总敏感性指数等同于局部敏感性指数。本研究使用的敏感性分析软件为SimLab 2.2以及Matlab 2015b。分析过程包括样本生成、连接模型、Monte Carlo模拟以及敏感性分析4个部分。

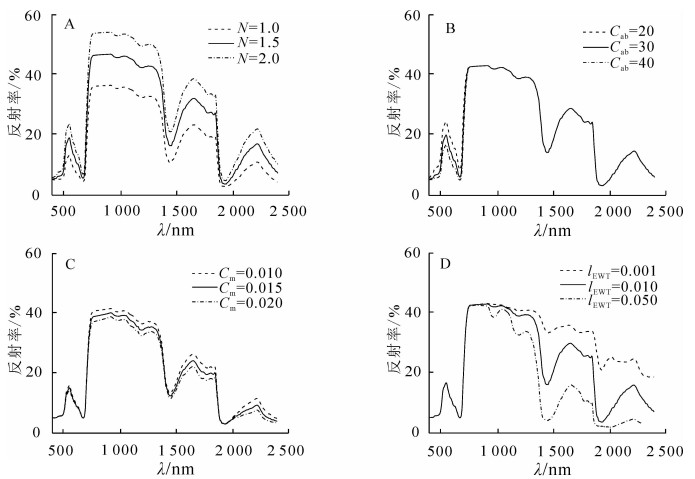
  • 本研究首先采用传统的参数敏感性分析方法OTA(one factor at a time)[18]对PROSPECT模型进行了敏感性研究,即设定目标的参数范围,其他参数保持不变,并且认定各参数之间是相互独立的,进而分析各个参数变化对模型输出结果的影响程度。模型参数参照表 1的基础值,因为类胡萝卜素含量和叶黄素含量影响范围较小,此处不作考虑。参数取值变化引起的光谱变化范围如图 1所示。

    Figure 1.  Spectral changes caused by pardmeter variations of PROSPECT model

    图 1显示叶绿素含量对光谱的影响主要在可见光波段,即400~800 nm,其光谱反射率随叶绿素含量的增大而减小,在近红外和短波红外波段范围内不变化。叶片结构和干物质含量的主要影响波段为700~2 500 nm。叶片等效水厚度和干物质含量对可见光波段影响不明显,其主要影响范围在近红外和短波红外波段,叶片等效水厚度主要影响的光谱波段为900~2 500 nm。在这段范围内,光谱反射率随两者取值的增大而减小。

  • 为了量化每个参数对光谱反射率的影响,本研究采用EFAST方法进行了全局敏感性分析,并与之前的敏感性分析进行比较。研究对PROSPECT模型的输入参数范围设置为均匀分布,按照EFAST采样方法得到1 494组模型输入参数样本(EFAST法认为采样次数大于参数个数65倍的分析结果有效)[16],然后连接PROSPECT模型,基于参数样本模拟出1 494条光谱数据,最后在Simlab软件中对模拟结果执行Monte Carlo模拟及敏感性分析。

    图 2显示了使用PROSPECT模型模拟出来的数据进行全局敏感性分析的结果。图 2中一阶敏感指数以百分比形式表示,表示每个参数对模型输出结果的贡献程度,也可以解释为光谱反射率对每个叶片生化参数的敏感度。一阶敏感指数总和接近于100%,这表明模型输出的不确定性不是由于参数之间的相互作用引起的。图 2显示在400~750 nm波段内,模型输出结果主要受Cab的影响,其次为N。在750~1 200 nm波段内,光谱反射率主要受NCm影响,其中N的贡献度最高达90%左右,Cm的贡献度保持在8%~9%。在波长900 nm处,可以观察到lEWT开始对模型输出结果产生影响,并在波长1 440,1 920和2 500 nm处其贡献达到顶峰。这一波段范围内,lEWT起着主要贡献作用,然而CmN也在一定程度上影响着模型输出结果。因此,为了提高估算lEWT的精度,应该结合其他波段的信息将NCm的影响最小化。根据上述分析结果,在750~1 200 nm波段内,lEWT的敏感度较小,光谱反射率主要受NCm影响,因此可以与900~2 500 nm波段结合以减弱NCm的影响,以达到提高对lEWT敏感度的目的。

    Figure 2.  First order indices of leaf spectral reflectance to leaf characteristics

  • 为了探究这2个波段范围的组合是否有效,本研究选择了8种目前应用广泛的植被水分指数。这8种植被水分指数均由参考波段和测量波段2个波段以比值或者归一化形式组成。参考波段选择lEWT敏感度较低的波段,如820和860 nm。测量波段为lEWT敏感的波段,如1 240,1 600,1 640和2 130 nm。由于实测光谱中1 340~1 450,1 780~2 000和2 350~2 500 nm波段是大气中受水汽和噪声影响较大的波段[19],所以本研究在选择植被指数时不考虑这些波段。本研究选择的具体植被水分指数名称及其计算公式见表 2

    指数名称 计算公式 参考文献
    水分胁迫指数(moisiture stress index,MSI) IMSI=R1600/R820 [20]
    简单水分指数(simple ratio water index,SRWI) ISRWI=R860/R1240 [21]
    归一化差异红外指数(normalized difference infrared index,NDII) INDII=(R820-R1600)/(R820+R1600 [22]
    归一化差异水分指数(normalized difference water index,NDWI1240) INDWI1240=(R860-R1240)/(R860+R1240 [23]
    归一化差异水分指数(normalized difference water index,NDWI1640) INDWI1640=(R860-R1640)/(R860+R1640 [24]
    归一化差异水分指数(normalized difference water index,NDWI2130) INDWI2130=(R860-R2130)/(R860+R2130 [24]
    归一化多波段干旱指数(normalized multi-band drought index,NMDI) ${I_{{\rm{NMDI}}}} = \frac{{{R_{860}} - \left( {{R_{1640}} - {R_{2130}}} \right)}}{{{R_{860}} + \left( {{R_{1640}} - {R_{2130}}} \right)}}$ [25]
    全球植被水分指数(global vegetation moisture index,GVMI) ${I_{{\rm{GVMI}}}} = \frac{{\left( {{R_{820}} + 0.1} \right) - \left( {{R_{1600}} + 0.02} \right)}}{{\left( {{R_{820}} + 0.1} \right) + \left( {{R_{1600}} + 0.02} \right)}}$ [26]

    Table 2.  Equation of water content spectral indices

    为探究这些植被水分指数对lEWT的敏感度,本研究对这8种植被水分指数进行了EFAST敏感性分析,并与植被水分指数中测量波段的敏感性分析结果进行对比。结果如表 3表 4

    参数 λ/nm lEWT/% N/% C/%
    参考波段 820 0.00 91.92 7.03
    860 0.02 92.07 6.87
    测量波段 1 240 7.02 87.18 4.88
    1 600 42.91 51.76 4.38
    1 640 38.50 55.96 4.71
    2130 53.07 33.40 6.80

    Table 3.  Sensitivity analysis of single wavelength to lEWT, N and Cm

    指数名称 lEWT N Cm
    敏感指数1% 改变量/% 敏感指数1% 改变量/% 敏感指数1% 改变量/%
    IMSI 87.03 44.12 12.28 -39.48 1.09 -3.29
    ISRWI 82.15 75.13 13.32 -73.86 0.41 -4.47
    INDII 84.80 4189 14.09 -37.67 0.99 -3.39
    INDWI1240 83.56 76.54 12.77 -74.41 0.39 -4.49
    INDWI1640 84.54 46.04 14.39 -41.57 1.08 -3.63
    INDWI2130 77.87 24.8 17.48 -15.92 5.19 -1.61
    INMDI 29.86 -8.64 5.55 - 50.46 25.73 21.02
    IGVWI 77.17 34.26 22.90 -28.86 1.75 3.63

    Table 4.  Sensitivity analysis of vegetation water content indices to lEWT, N and Cm

    对比表 3表 4可以看出:IMSIISRWIINDIIINDWI1240INDWI1640INDWI2130IGVWI相较测量波段都有效地降低了NCm对光谱反射率的影响,提高了lEWT的敏感度。其中IMSIISRWIINDIIINDWI1240INDWI1640这5种植被水分指数对lEWT的敏感度都达80%以上,IMSI最高,为87.03%。INMDIlEWT的敏感度最低,与测量波段相比,INMDI只是较好地降低了N的影响,其对lEWT的敏感度反而降低,对Cm的敏感度也有所上升。从敏感指数改变量来看,INDWI1240提升lEWT敏感度而弱化叶片结构和干物质含量的干扰能力最强,敏感指数增加了76.54%,其次为ISRWI,除INMDI外,INDWI2130的敏感指数改变量最低,仅为24.8%。说明对测量波段的选择也不是lEWT敏感性越高越好。所以根据敏感性分析结果,对lEWT敏感度最高的植被水分指数依次为IMSIINDIIINDWI1640

  • 为了直观表明8种植被水分指数估算叶片等效水厚度的能力,本研究基于314组实测的光谱反射率数据和对应的叶片水分数据,分别使用这8个植被水分指数建立统计回归模型并进行预测,以模型决定系数(R2)和均方根误差(ERMSE)为指标对各植被指数的估算模型精度进行评价。研究以植被水分指数为自变量,266组叶片水分数据分别建立线性、一元二次函数、对数、幂函数和指数函数估算模型。结果表明:ISRWIINDIIINDWI1240INDWI1640INDWI2130INMDIIGVWI建立的叶片水分估算模型,拟合R2最大的均为一元二次函数,IMSI为指数函数,但其R2与对应的一元二次函数模型的R2相差很小。所以本研究就以8种植被水分指数的一元二次函数模型进行对比(表 5)。

    指数 回归模型 评价指标
    R2 ERMSE
    IMSI y=0.210 5-0.429 0 IMSI +0.305 2 IMSI2 0.675 2 0.007 1
    ISRWI y=1.322 0-2.572 0 ISRWI +1.265 0 ISRWI2 0.596 2 0.008 0
    INDII y=0.012 0-0.051 4 INDII +0.400 3 INDII2 0.679 5 0.007 1
    INDWI1240 y=0.015 9-0.178 4 INDWI1240 +7.004 0 INDWI12402 0.595 8 0.008 0
    INDWI1640 y=0.011 6-0.051 4 INDWI1640 +0.492 0 INDWI16402 0.684 3 0.007 1
    INDWI2130 y=0.052 8-0.232 0 INDWI2130+0.323 6 INDWI21302 0.605 8 0.007 9
    INMDI y=0.798 0-3.182 0 INMDI +3.239 0 INMDI2 0.160 0 0.011 5
    IGVWI y=0.025 5-0.170 9 IGVWI +0.475 5 IGVWI2 0.615 8 0.007 8

    Table 5.  Spectral index statistical regression model and its evaluation indexes

    表 5可以看出:IMSIINDIIINDWI1640INDWI2130IGVWI的建模精度较高,其估算模型R2均在0.60以上,估算模型精度排名前3位的依次为INDWI1640INDIIIMSIR2分别为0.684 3,0.679 5和0.675 2,均方根误差ERMSE均为0.007 1 g·cm-2ISRWIINDWI1240的建模精度较低,R2分别为0.596 2和0.595 8,ERMSE均为0.008 0 g·cm-2INMDI估算模型的R2最低,仅为0.16。综合敏感性分析和估算模型的结果,INMDI并不适合在叶片尺度上估算叶片含水量。

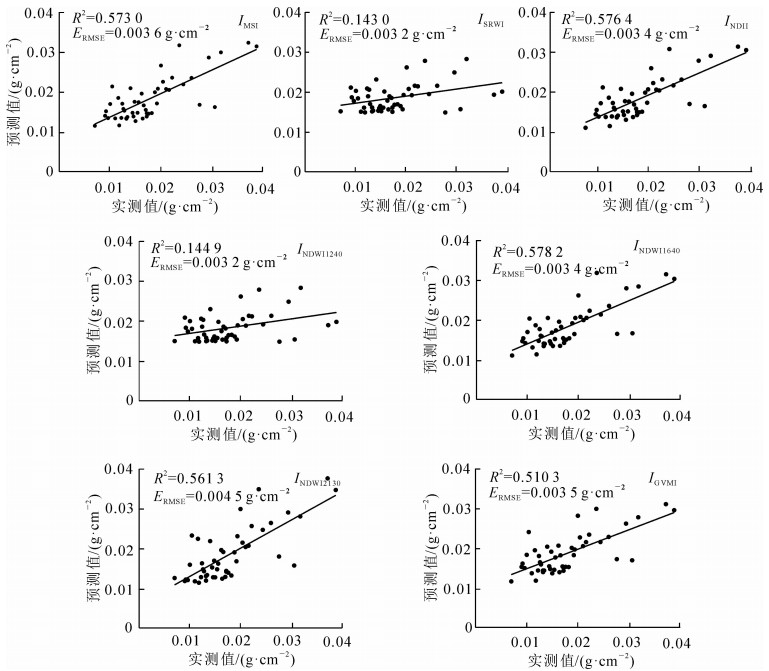
    为了对比上述估算模型的预测能力,本研究利用另外48组实测的样本数据对估算模型进行验证。以决定系数R2,均方根误差ERMSE作为评估叶片等效水厚度估算模型的预测精度和稳定性的指标。各植被水分指数估算模型的预测结果如图 3

    Figure 3.  Relationships between predicted lEWT and measured lEWT

    图 3可以看出:估算模型预测结果的R2较高的为INDWI1640INDIIIMSI,与估算模型的R2保持良好一致,其均方根误差ERMSE分别为0.003 4,0.003 4和0.003 6 g·cm-2INDWI2130模型预测精度也保持在良好水平,R2为0.561 3,但是其ERMSE较大,为0.004 5 g·cm-2,说明该模型的预测值与实测值相差较大。IGVWI模型的预测能力属于中等水平,其R2为0.510 3,ERMSE为0.003 5 g·cm-2INDWI1240ISRWI的估算模型预测精度较差,R2仅在0.140 0左右,从图 3B图 3D可以看出:当lEWT大于0.020 0 g·cm-2时,INDWI1240ISRWI预测值出现较大偏差,出现了过早饱和现象,说明INDWI1240ISRWI适合低值区域的叶片等效水厚度反演。而且研究发现:在植被水分指数敏感分析中,INDWI1240ISRWI与测量波段相比,其敏感度改变量最大,可能是INDWI1240ISRWIlEWT某一特定范围内比较敏感,陈小平等[27]研究显示:INDWI1240lEWT低值区域变化比较明显,到一定程度时达到饱和,而且指数抗噪能力差,实际反演效果具有局限性。程志庆等[2]研究显示:IGVMIlEWT处于0.009 0~0.027 0 g·cm-2时,可以灵敏地反应叶片水分的变化,但当lEWT大于0.027 0 g·cm-2时,其敏感性趋于稳定。综合考虑,叶片尺度上估算叶片等效水厚度效果最好的指数为INDWI1640INDII。这一结果与陈小平等[27]和张佳华等[28]的研究结果基本一致。同时研究表明:基于冠层反射率提出的INMDI不适合用于叶片尺度的等效水厚度估算。

  • 本研究使用EFAST方法对PROSPECT模型叶片各项生化参数进行了敏感性分析。在敏感性分析基础上优选植被水分指数,并以阔叶树种为研究对象,根据其地面实测lEWT和光谱数据建立了叶片等效水厚度估算模型。得出以下结论:①EFAST相较传统的敏感性分析方法,可以定量地得到叶片各项生化参数的敏感指数,其中:lEWT的敏感波段为900~2 500 nm,但在这个范围内光谱反射率也受NCm的影响,所以应该结合其他波段的信息来估算lEWT。基于此选择了8种植被水分指数,敏感性最强的依次为IMSIINDIIINDWI1640,最弱的为INMDI。其结果为叶片生化参数反演植被水分指数选择以及模型结果的优化与改进奠定了基础。②本研究基于植被水分指数建立叶片等效水厚度估算模型并验证发现,INDWI1640INDIIIMSI估算模型的预测精度较好,并与其模型精度保持了良好的一致性。INDWI1640INDII是叶片尺度上估算水分的最佳指数。INDWI1240ISRWI适合低值区域的叶片等效水厚度反演,基于冠层反射率提出的INMDI不适合用来估算叶片含水量。

    研究仍存在一些不足。实验数据采用了2016和2017年2期的实测数据,考虑到气候原因也可能是影响模型精度的重要因素,在以后研究中会结合气象数据来建立叶片等效水厚度估算模型。其次,在研究中发现:植被水分指数随lEWT的变化其估算能力也会变化。在以后的研究中应探究不同lEWT范围内各个植被水分指数的敏感性和估算能力,以提高叶片等效水厚度估算模型的精度。

Reference (28)

Catalog

    /

    DownLoad:  Full-Size Img  PowerPoint
    Return
    Return