


-
近年来,随着生猪养殖业的飞速发展,规模猪场普遍采用生化处理模式[1-2]对养殖污水处理后进行排放,但由于受处理工艺稳定性及其他因素的影响,大量排放的污水达标与否成为突出问题[3-4]。因此,提出合理、快速的水质评价方法用于污水实时监管十分必要。现有的水质评价研究主要是针对地下水及河流湖泊等地表水[5-7]。在单因子评价法的研究中,超标最严重的指标往往被简单地视作整体水质的决定性因素,而其他指标所产生的综合影响则被忽视,导致评价结果不准确。模糊综合评价法常用于地下水的评价,方运海等[8]引入相对隶属度概念建立起模糊综合优化模型评价地下水水质,并证明了模型的可靠性,但该方法仍存在隶属函数判定区间不精确、水质评价结果表达方式单一等问题。BP人工神经网络法在自学习以及自适应功能方面优势显著,有利于将各水质指标与水质整体等级更好地拟合,被广泛应用于水质评价[9-10],孔刚等[11]通过BP神经网络法对浅层地下水水质进行综合评级,在减小了人为影响因素的同时,得到更加贴近客观实际的水质评价结果,但因其对样本依赖性过强而具有局限性。与以上方法相比,水质指数(water quality index,WQI)方法能够结合多个环境参数并将其有效地转换为反映水质状况的单个值,被广泛用于地下水和地表水的水质评价[12-13],在水资源管理中起着越来越重要的作用。KAMRAN等[14]对河流水采用主成分分析法提取主要指标后,再结合WQI方法对河流水质进行准确评价。目前,规模猪场针对生化处理后的养殖污水水质评价仅以GB 18596—2001《畜禽养殖业污染物排放标准》中的各指标限值作为依据,评价结果具有一定的单一性和片面性。本研究以一家采用SFAO4(step-feed four-stage micro aeration units)微氧曝气工艺的规模猪场处理后的养殖污水为研究对象,在分析其水质特征的基础上,构建了基于关键水质指标和WQI的生猪养殖污水水质评价模型,以期为生化处理后的生猪养殖污水提供准确和快速的评价方法。
HTML
-
本研究自2018年秋至2020年秋对浙北一家规模猪场处理后的养殖污水进行随机采样,累计样本81组,其中春、夏、秋、冬分别采样20、19、24和18组。
-
以GB 18596—2001《畜禽养殖业污染物排放标准》中规定的指标和现有规模猪场中常规监测的水质指标为依据,本研究选取了氨氮(NH3-N)、总磷(TP)、总氮(TN)、化学需氧量(COD)、酸碱度(pH)和电导率(EC)共6个指标对生猪养殖污水水质进行评价。
-
为避免水质评价的片面性和单一性,初始水质指数(WQI)的计算选取了评价生猪养殖污水水质常用的NH3-N、COD、TN、TP、pH共5个指标,计算方法如式(1)所示。根据每个指标对水质的影响程度及相对重要性,为其分配权重[15-17],同时对其进行标准化以消除变量的不同量纲和不同数量级对评价结果的影响(表1)。
标准化值 pH TN/
(mg·L−1)NH3-N/
(mg·L−1)TP/
(mg·L−1)COD/
(mg·L−1)100 6~9 <50 <4 <0.5 <20 90 50~70 4~6 0.5~1.0 20~40 80 70~90 6~8 1.0~2.0 40~60 70 90~110 8~20 2.0~3.0 60~100 60 110~130 20~40 3.0~6.0 100~200 50 130~150 40~80 6.0~9.0 200~400 40 150~170 80~120 9.0~12.0 400~600 30 170~190 120~160 12.0~15.0 600~800 20 190~210 160~200 15.0~18.0 800~1 000 10 210~230 200~240 18.0~21.0 1 000~1 200 0 <6、>9 >230 >240 >21.0 >1 200 权重 1 3 3 1 4 Table 1. Weights and standardized values of water quality indexes
式(1)中:n为指标总数,Ci和Pi分别为指标i的标准化值与权重。IWQ为水质指数,取值范围为[0, 100],根据水质指数把水质等级划分为:很好(90, 100]、好(70, 90]、一般(50, 70]、差(30, 50]、很差[0, 30]。在保证水质评价合理的同时,为了缩减评价指标以提高评价速度,本研究采用逐步回归分析法筛选影响生猪养殖污水水质的关键指标,并引入了加权和非加权最小水质指数模型[18],分别表示为WQImin-w和WQImin-nw。
1.1. 样本采集
1.2. 水质评价指标选取
1.3. 水质指数计算
-
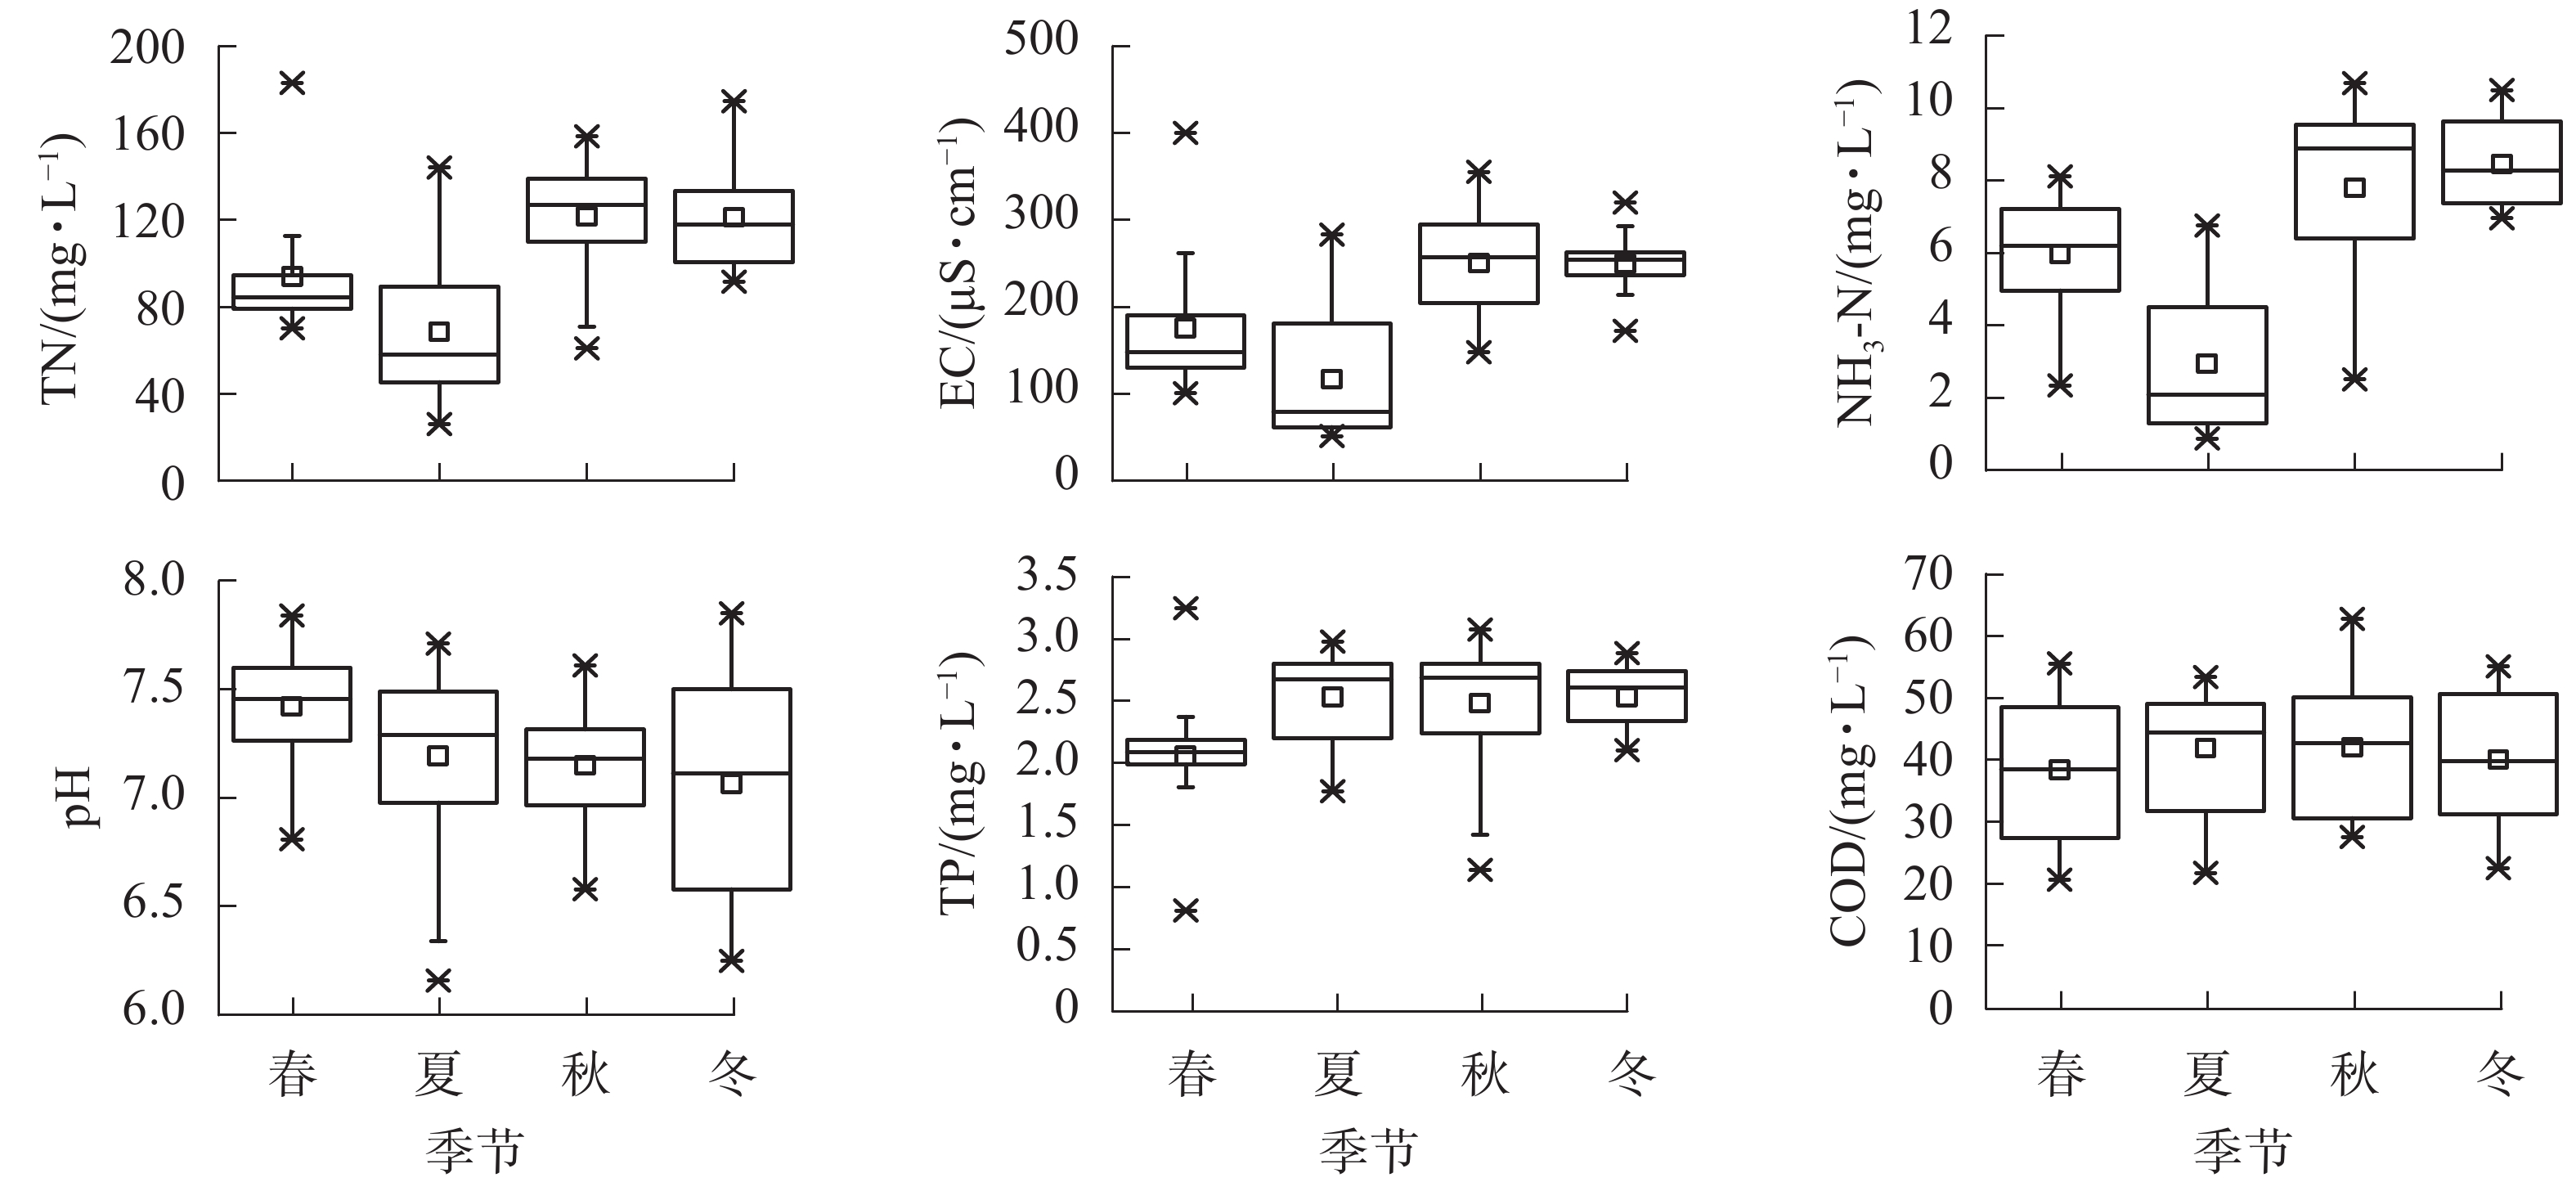
从表2可以看出:部分样本的TN质量浓度偏高,最大质量浓度为183.00 mg·L−1;NH3-N、COD和TP的平均质量浓度分别为6.36、40.79和2.40 mg·L−1,均远低于限值,且标准差相对较小;pH均在正常范围内。
项目 pH EC/(μS·cm−1) TN/(mg·L−1) NH3-N/(mg·L−1) TP/(mg·L−1) COD/(mg·L−1) 限值 6.00~9.00 ≤140.00 ≤80.00 ≤8.00 ≤400.00 最大值 7.85 400.00 183.00 10.70 3.24 62.76 最小值 6.16 51.80 26.10 0.88 0.81 20.78 平均值±标准差 7.21±0.39 200.31±85.90 102.32±35.83 6.36±2.77 2.40±0.50 40.79±10.09 Table 2. Statistical characteristics of water quality indexes
对不同季节的水质指标进行统计分析(图1)可以看出:秋、冬季TN和NH3-N的质量浓度及EC相比春、夏季较高;TP的质量浓度春季较小;COD四季变化规律不明显;pH在春季相对较高。
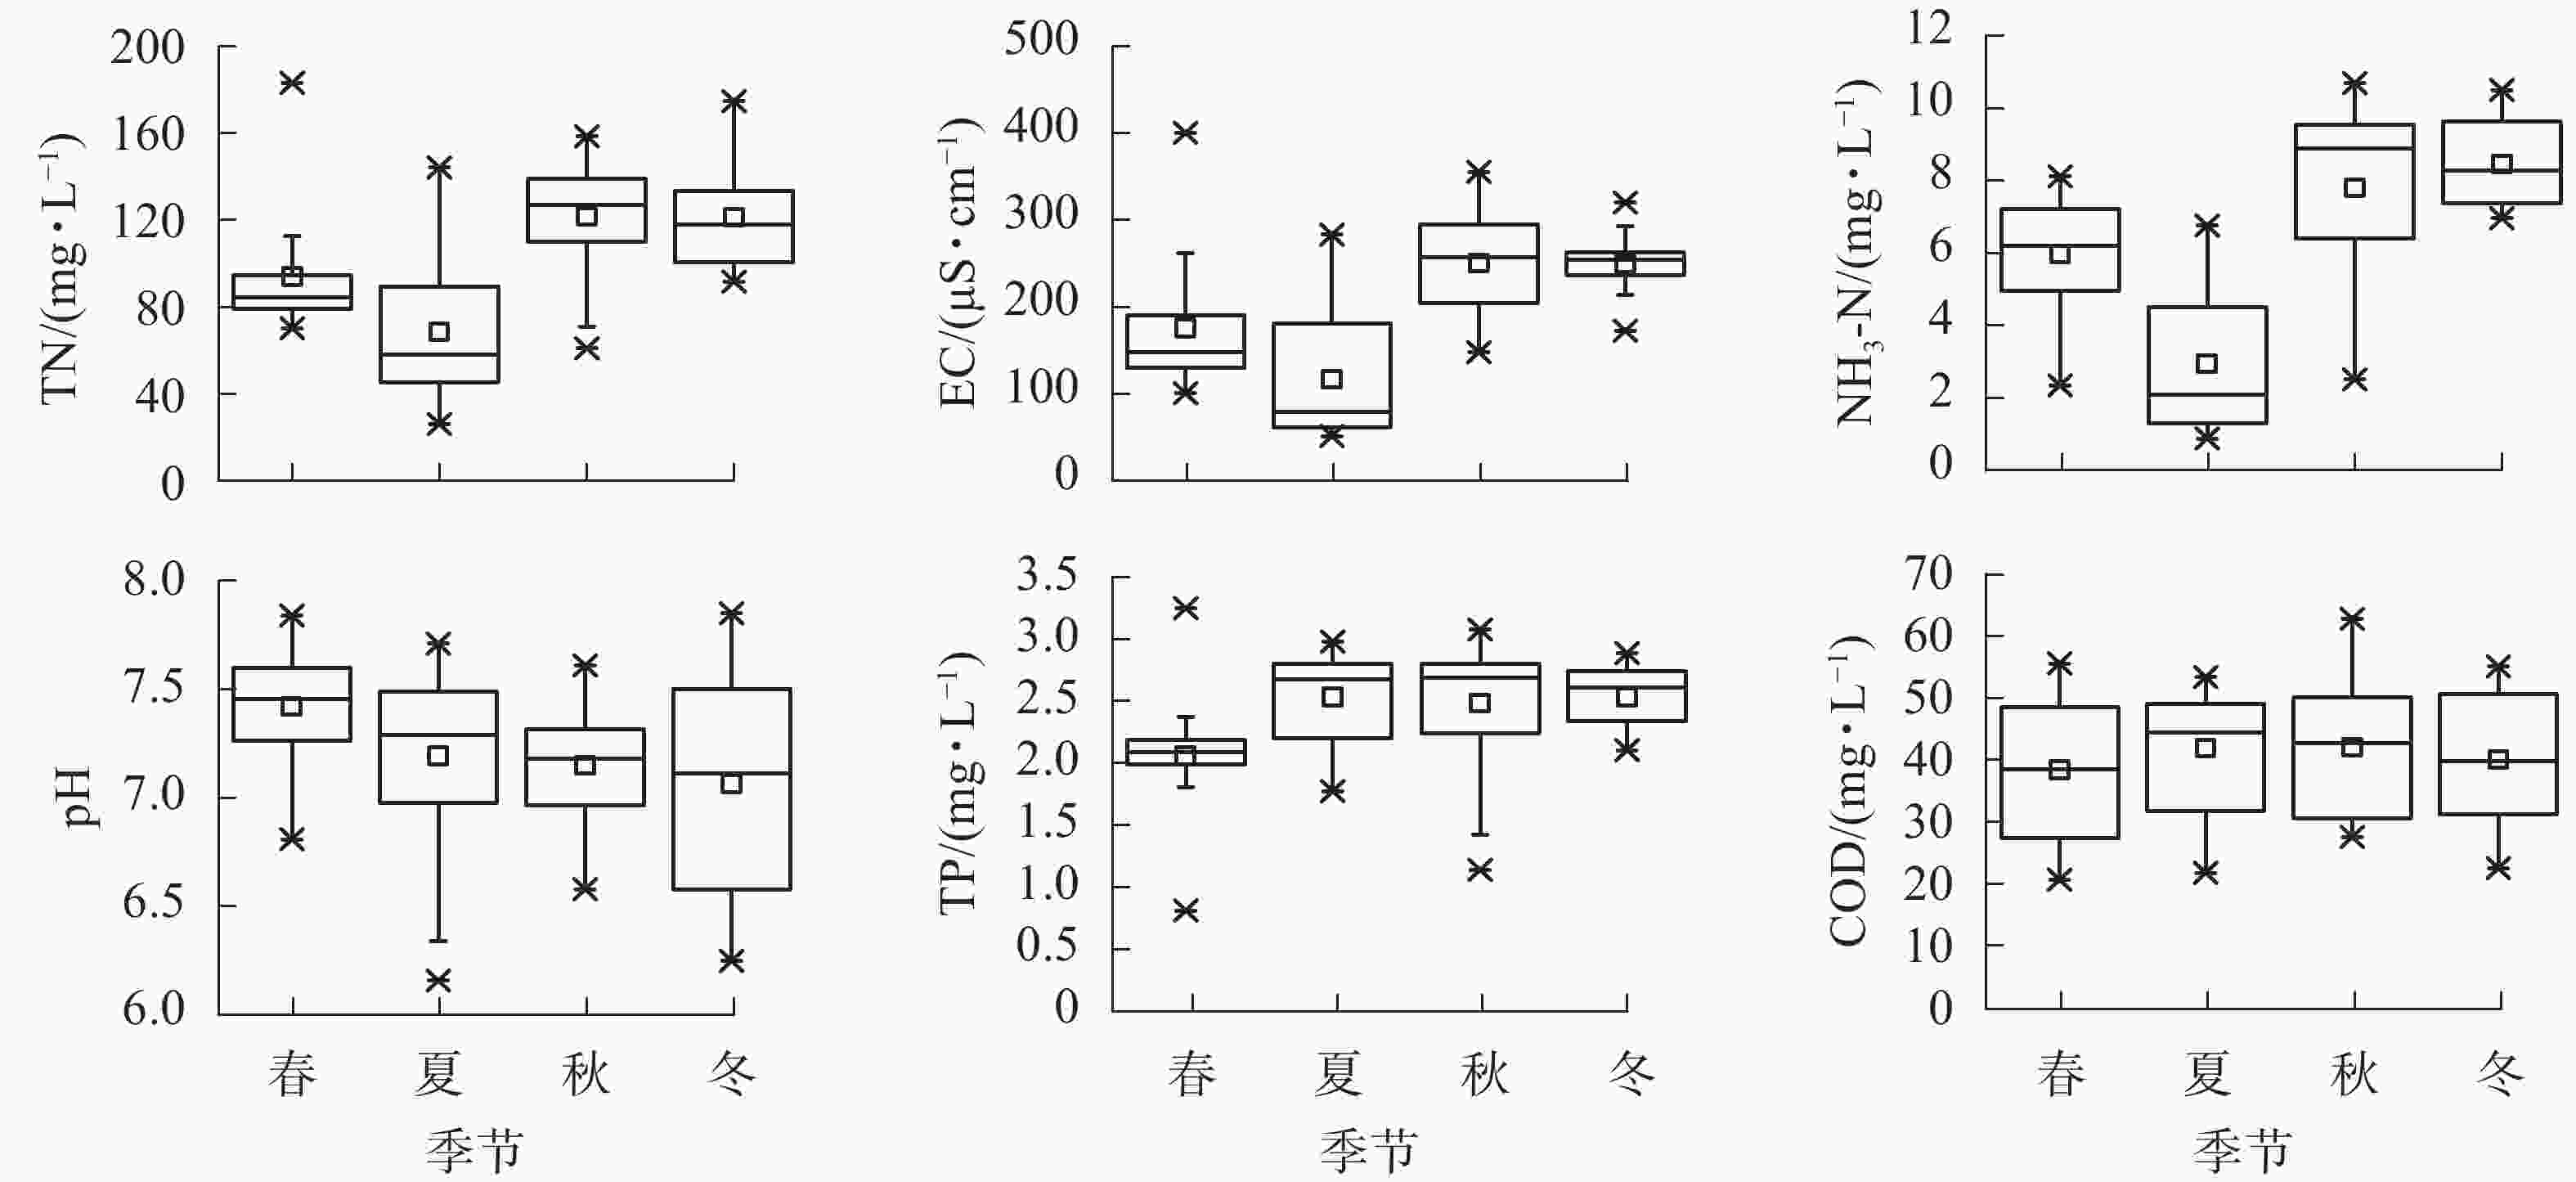
Figure 1. Regulation of concentration or value of water quality indexes in different seasons
-
将采样数据代入水质指数公式的计算结果表明:81组样本中有64组等级为好,占比为79.0%,等级为一般和很好的样本分别占8.6%和12.4%。从图2可以看出:不同季节中水质指数差异较大,秋、冬季的污水水质指数相对较低,平均为60~80,而春、夏季的水质指数显著增大,平均为75~95,尤其在夏季较为突出,这表明总体上春、夏季的水质较好。
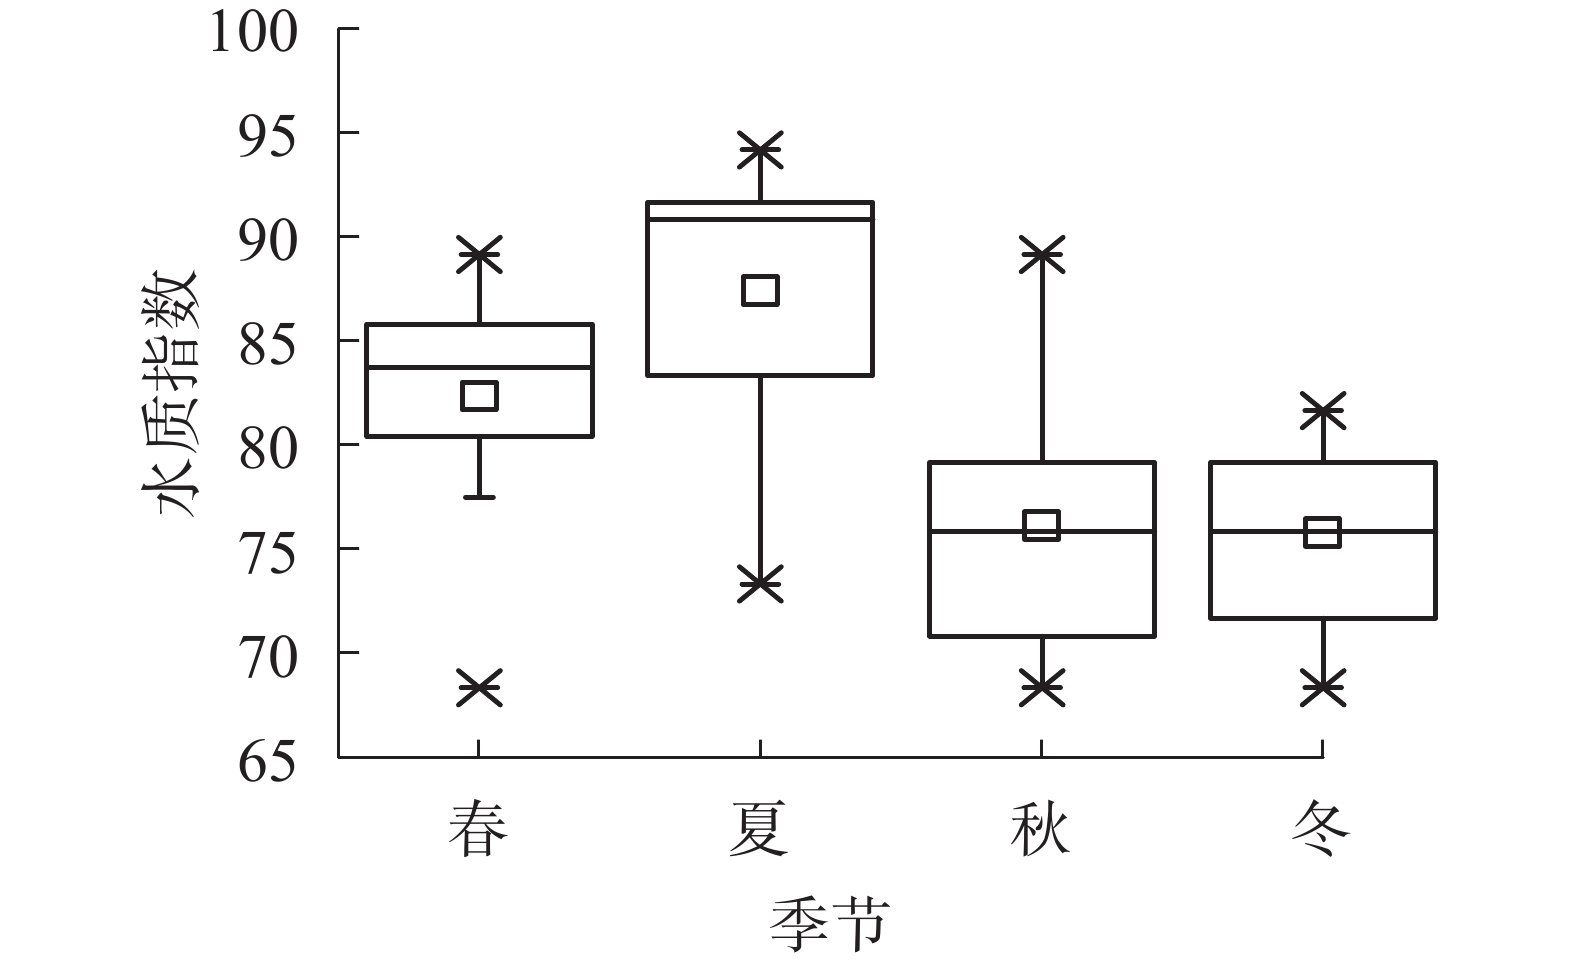
Figure 2. Initial water quality indexes value of swine breeding wastewater
-
从81组样本中根据不同季节共随机抽取45组用于建模,其余36组用于模型检验。如表3所示:在构建最小水质指数模型(WQImin)之前,利用逐步多元线性回归法确定了对水质指数影响最大的指标为TN(模型1,R2=0.859,P<0.001),依次增加NH3-N、COD后,模型的决定系数(R2)逐渐增加(模型2、模型3)。从R2变化可以看出:NH3-N、COD对模型精度有较为明显的提升;但加入TP后,R2仅提升了0.005(模型4)。因此,TN、NH3-N和COD对水质指数的影响较大。
模型编号 模型表达式 数据来源 R2 P 1 y=12.745+48.381 lg(x1+1) 实测值 0.859 <0.001 2 y=−87.461+37.294 lg(x1+1)+39.662 lg(x2+1) 实测值 0.927 <0.001 3 y=−232.459+31.739 lg(x1+1)+45.921 lg(x2+1)+55.114 lg(x3+1) 实测值 0.981 <0.001 4 y=−237.045+35.884 lg(x1+1)+59.762 lg(x2+1)+70.416 lg(x3+1)+21.264 lg(x4+1) 实测值 0.986 <0.001 5 y=−22.539+51.28 lg(x1+1) 计算值 0.842 <0.001 6 y=−135.074+37.179 lg(x1+1)+57.368 lg(x2+1) 计算值 0.925 <0.001 7 y=−213.361+35.154 lg(x1+1) +78.005 lg(x2+1)+67.733 lg(x3+1) 计算值 0.994 <0.001 说明:y表示WQI;x1、x2、x3和x4分别表示TN、NH3-N、COD和TP的标准化值 Table 3. Water quality indexes stepwise multiple regression results based on measured values
周昊等[19]发现生猪污水中NH3-N、TN和EC具有强相关性,其中NH3-N、TN的标准化值可分别通过替代模型由EC推导的NH3-N(记做NH3-Nd)、TN(记做TNd)标准化值代替。本研究将NH3-N、TN分别与EC和WQI进行相关性分析表明:①NH3-N、TN与EC的强相关性依然存在,相关系数分别为0.738和0.914。②NH3-N、TN与WQI的相关系数分别为0.898和0.938;NH3-Nd、TNd与WQI的相关系数分别为0.768和0.812。因此NH3-N和TN的推导值与实测值均与WQI显著相关。
基于这一结论,本研究利用NH3-Nd和TNd计算WQI (记做WQId),并将其与初始WQI值进行对比,结果表明:①WQId与初始WQI之间存在较强的相关性,其R2为0.721,P<0.001;②WQId与WQI的差值平均值仅为1.13,标准差为3.8,差值小于等于5的组数占总组数的88.73%。因此,WQId与WQI差距较小,采用NH3-Nd和TNd替代NH3-N和TN实测值计算WQI值是可行的。综上,在利用逐步多元线性回归方法剔除TP并确定NH3-N、TN和COD等3个关键指标后,利用NH3-Nd和TNd可再次精简计算WQI所需指标,仅需要使用EC和COD计算WQI即可。在45组建模样本中,将原NH3-N和TN分别用NH3-Nd和TNd替换,得出模型5~7共3个WQI模型(表3),这3个模型的R2逐步递增,分别为0.842、0.925和0.994。因此,本研究选择精度最高的模型7作为WQImin模型。
-
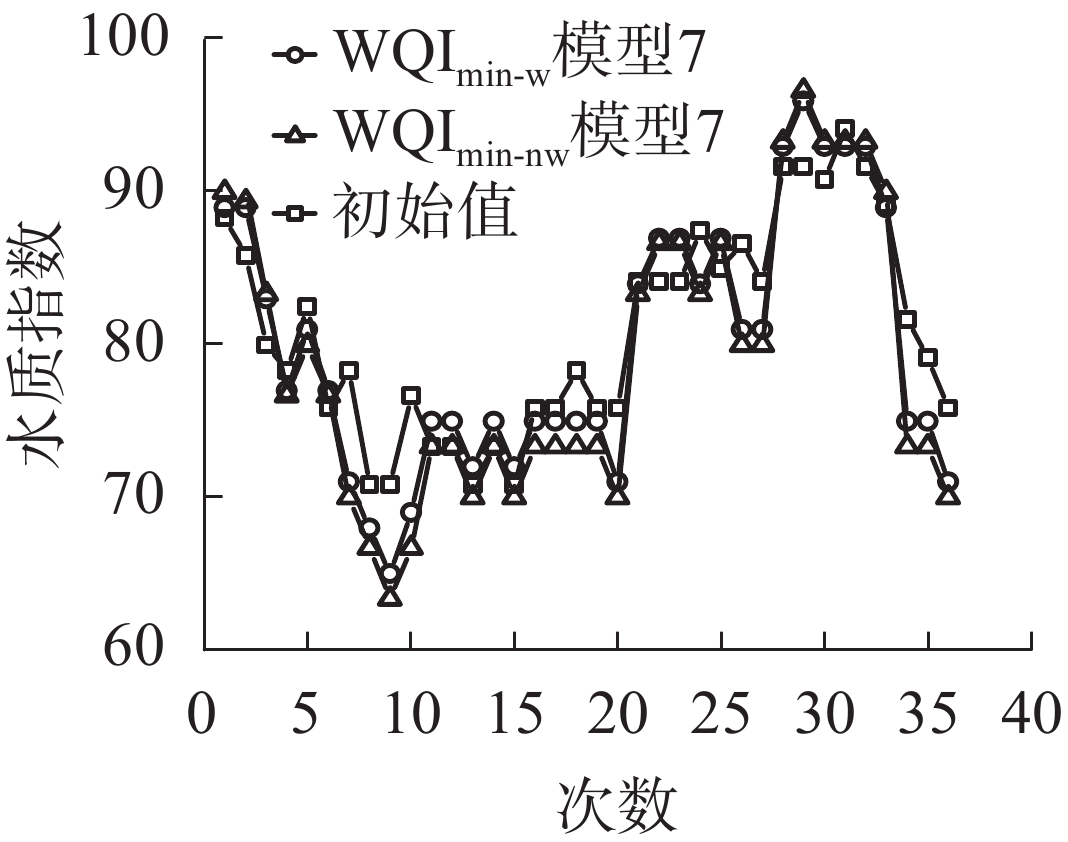
以模型7为验证对象,将加权最小水质指数模型WQImin-w和非加权最小水质指数模型WQImin-nw进行对比验证。首先基于决定系数(R2)、残差平方和(RSS)以及显著性(P)来判断模型本身的拟合优度和精度,再将基于WQImin-w、WQImin-nw计算得到的WQI值,与通过初始5个指标计算得到的WQI值的线性拟合效果判断模型的适用性。以EC和COD作为关键指标,将36组检验数据分别代入2个模型,进行精度检验。模型WQImin-w和WQImin-nw的P<0.001,其中模型WQImin-w的决定系数(0.994)略高于模型WQImin-nw(0.971),且模型WQImin-w的残差平方和(RSS)为1.327,小于模型WQImin-nw(6.580)。因此,模型WQImin-w的拟合优度和精度略高于模型WQImin-nw。为进一步判断模型的适用性,将检验样本数据分别代入2个模型,得到WQI值,与初始WQI值进行线性拟合分析。从图3可知:由模型WQImin-w得到的WQI值与初始WQI值具有更密切的相关性,其拟合直线决定系数为0.855,略高于模型WQImin-nw(0.854);模型WQImin-nw对应的样点与1∶1参考线的距离普遍较大,且偏离程度大于WQImin-w中拟合直线与1∶1参考直线的偏离程度。图4为分别通过2个模型以及初始WQI公式计算得到的36组水质指数,可以直观地看出:模型WQImin-w的WQI值与初始WQI值较为接近,而模型WQImin-nw的误差相对较大。可见,模型WQImin-w的水质评价结果与初始WQI水质评价结果一致程度更高(91.7%),而模型WQImin-nw的水质评价结果误差相对较大,一致程度仅为83.3%。综合以上对比结果,模型WQImin-w更适用于生猪养殖污水水质的评价。
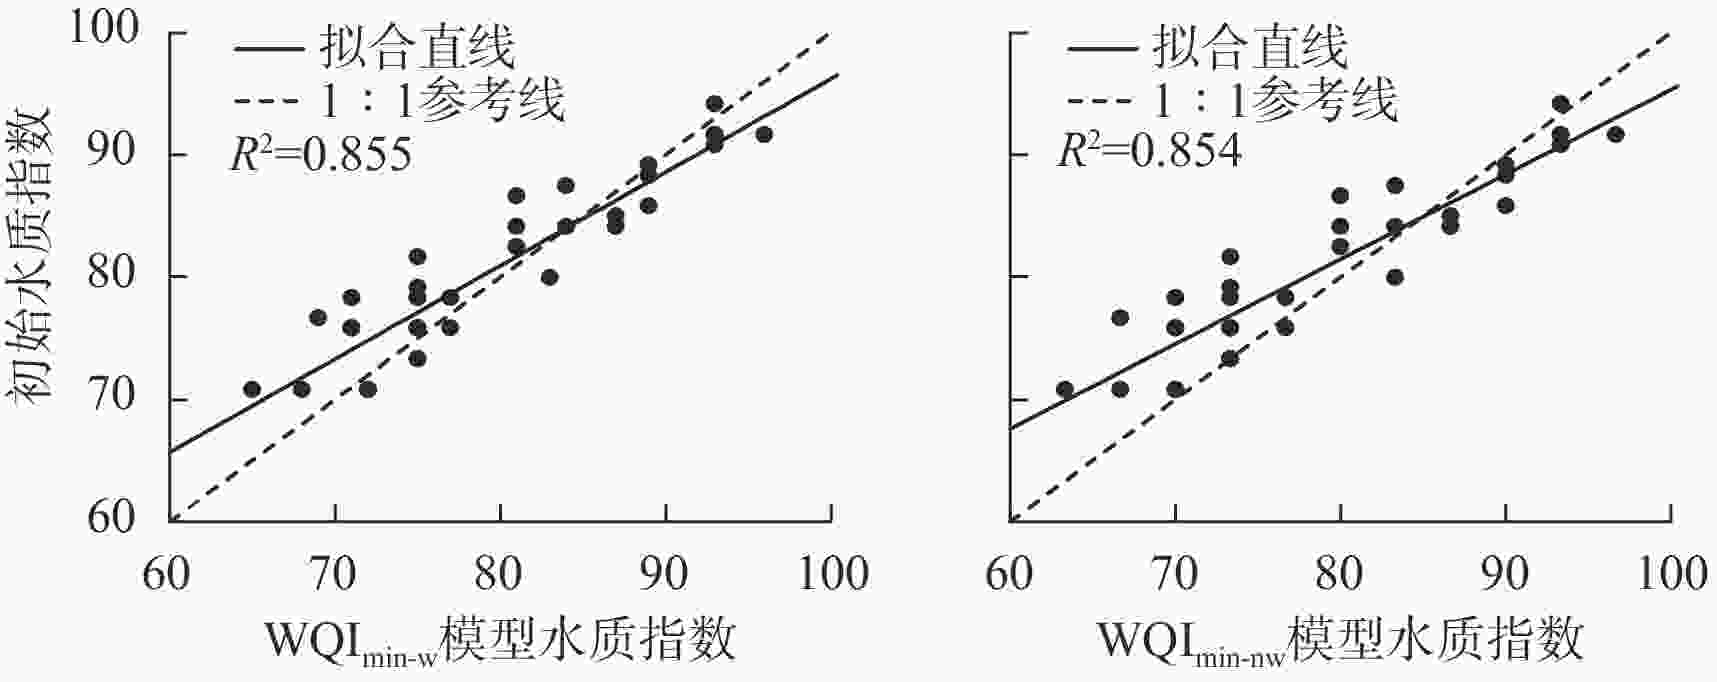
Figure 3. Validation of WQImin model

Figure 4. Comparison of WQI value calculated by model 7 with initial WQI value
2.1. 水质指标特征
2.2. 水质指数分析

2.3. 最小水质指数模型的构建与验证
2.3.1. 模型构建
2.3.2. 模型验证

-
本研究结果表明:相对于TP、pH和COD这3个污水水质主要指标,TN和NH3-N这2个关键指标的大小受季节变化影响较为明显,这可能与不同季节的气温有关。仇天雷[20]研究发现:在适当的温度范围内,温度的升高有利于养殖废水中NH3-N的消除。何佳敏等[21]研究了温度对升流式微氧活性污泥反应器(UMSR)处理高NH3-N、低碳氮比养猪废水效能的影响,结果表明当温度下降时,TN和NH3-N的去除率均有大幅度下降,而其他指标的去除率变化不明显。诸多关于城市生活污水处理工艺或水质影响因素的研究中也有同一发现[22-24],即不同处理工艺的污水处理效果均与温度密切相关。因春夏季平均气温高于秋冬季,故本研究处理后的污水水质为春夏季优于秋冬季,且以夏季最优。此外,污水曝气情况、静置时间、阳光照射等因素也可能对各指标的值产生影响[25]。曝气是否充分是影响污水指标质量浓度的重要因素,如曝气不足将导致溶解氧供应不充分,直接影响微生物的代谢,从而降低COD、NH3-N和TP的去除率[26];曝气过量也同样会影响污水处理效率,可能导致COD等指标质量浓度超标[27]。
-
污水样本检测的精度、水质指标的标准化方法、权重分配是影响水质评价模型精度的主要因素。本研究以地表水水质指标的标准化方法为参考,结合生猪养殖污水的特点,基于GB 18596—2001《畜禽养殖业污染物排放标准》对污水中相应指标进行了标准化,标准化值共分为11个等级,而等级数和等级划分的细致程度会对水质指数的大小产生直接影响。在权重分配环节,是以地下水及河流湖泊等地表水水质研究中的权重分配方式为参考,对生猪养殖污水中的TN、NH3-N、COD、TP和pH进行权重分配。在地下水及河流湖泊等地表水水质研究中,TN的权重取2。而针对生猪养殖污水的有关研究表明[28]:TN是畜禽养殖污水中重要的指标,也是极易超标的指标之一,因此本研究适当地对TN的权重进行了调整,COD、TN和NH3-N的权重分别为4、3、3,其他指标为1。
除上述分析外,污水处理工艺的稳定性也是需要考虑的因素,不稳定的工艺必然导致出水水质异常,若将异常数据作为水质评价模型构建的基础,即使数量很少,也会对模型精度产生不容忽视的影响。
3.1. 生猪养殖污水水质影响因素分析
3.2. 模型精度影响因素分析
-
生化处理模式下,规模猪场处理后的养殖污水水质呈现季节性变化特征,具体表现为春、夏季水质总体优于秋、冬季,尤其是夏季水质最好。基于EC和COD构建的最小水质指数评价模型决定系数为0.994,通过该模型得到的水质等级与基于NH3-N、COD、TN、TP和pH共5个指标评价的等级一致程度可达90%以上。因此,利用该模型能够较为准确、合理地评价处理后的生猪养殖污水水质。
 DownLoad: