Volume 39 Issue 2
Mar.  2022
Turn off MathJax
Article Contents

ZHU Zheng, ZHAO Fan, WANG Qiuhua, GAO Zhongliang, DENG Xiaofan, HUANG Penggui. Driving factors of forest fire and fire risk zoning in Kunming City[J]. Journal of Zhejiang A&F University, 2022, 39(2): 380-387. doi: 10.11833/j.issn.2095-0756.20210339
Citation: ZHU Zheng, ZHAO Fan, WANG Qiuhua, GAO Zhongliang, DENG Xiaofan, HUANG Penggui. Driving factors of forest fire and fire risk zoning in Kunming City[J]. Journal of Zhejiang A&F University, 2022, 39(2): 380-387. doi: 10.11833/j.issn.2095-0756.20210339

Driving factors of forest fire and fire risk zoning in Kunming City

doi: 10.11833/j.issn.2095-0756.20210339
  • Received Date: 2021-04-30
  • Accepted Date: 2021-11-16
  • Rev Recd Date: 2021-10-21
  • Available Online: 2022-03-25
  • Publish Date: 2022-03-25
  •   Objective  With an analysis of the data of fire spots in Kunming City from 2000 to 2015, this study is aimed to determine the main driving factors of forest fires, establish the forest fire prediction model in Kunming City, map the forest fire-risk zones so as to provide reference for the prevention and management of forest fires in Kunming City.  Method  First, with 17 forest fire driving factors selected, a Logistic regression forest fire probability model was constructed on the basis of the satellite forest fire data, including meteorology, terrain, vegetation, artificial, and so on. Then five intermediate models were employed to select the significant variable factors for whole samples before the model was tested using ROC curve. Based on the modeling results of the whole samples, an analysis was conducted of the main forest fire driving factors in Kunming City with the best threshold for probability of forest fire calculated. At last, five fire-risk zones were determined based on the results obtained via the Logistic model.  Result  Among the nine driving factors were altitude, distance from residential areas, distance from railways, NDVI value, monthly average surface temperature, monthly average air pressure, monthly average relative humidity, monthly average wind speed and per capita GDP. The prediction accuracy of Logistic model was as high as 81.7%. The area AUC under ROC curve is 0.905. The best threshold of division was 0.342, the area percent of the five-level fire danger zones were 48.82%, 35.17%, 11.26%, 2.55% and 2.2% respectively.  Conclusion  The main driving factor for forest fire in Kunming City is the meteorological factor with the high fire risk areas in Kunming City concentrated in the southwest region including Wuhua District, Panlong District, Guandu District, Chenggong District, Xishan District and Anning City. [Ch, 4 fig. 3 tab. 22 ref.]
  • [1] WANG Zhichao, XU Yuxing, ZHU Wankuan, DU Apeng.  Characteristics and driving factors of nocturnal water consumption of Eucalyptus urophylla plantations in Leizhou Peninsula . Journal of Zhejiang A&F University, 2020, 37(4): 646-653. doi: 10.11833/j.issn.2095-0756.20190531
    [2] YU Fei, LI Zhiyong.  Forests landscape pattern changes and driving forces in Mount Tianmu . Journal of Zhejiang A&F University, 2020, 37(3): 439-446. doi: 10.11833/j.issn.2095-0756.20190306
    [3] ZHAO Xungang, HU Yucun, WANG Wenhui, HU Yunqing.  Changes in the ecological environment of Wuhai City and driving factors . Journal of Zhejiang A&F University, 2019, 36(5): 990-998. doi: 10.11833/j.issn.2095-0756.2019.05.019
    [4] SHI Jingjing, ZHANG Chao, YU Shuquan, MAO Shiliang, LI Xiupeng.  Forest fire weather indexes for the fire danger period in Zhejiang Province . Journal of Zhejiang A&F University, 2014, 31(2): 231-237. doi: 10.11833/j.issn.2095-0756.2014.02.011
    [5] MA Rui-sheng, YANG Bin, ZHANG Li-hui, LIU Zhi-ping.  Design and implementation of a forest fire monitoring system using a miniature unmanned aerial vehicle . Journal of Zhejiang A&F University, 2012, 29(5): 783-789. doi: 10.11833/j.issn.2095-0756.2012.05.023
    [6] QIN Fei-fei, TANG Li-hua.  Study on synchronization tracking algorithm in remote video monitoring of forest fires based on DEM . Journal of Zhejiang A&F University, 2012, 29(6): 917-922. doi: 10.11833/j.issn.2095-0756.2012.06.017
    [7] XU Ai-jun, HUANG Xiao-yin, JIANG Guang-yu, SHAO Jian-long.  Precision fire hazard divisions for collective forest in southern China . Journal of Zhejiang A&F University, 2012, 29(1): 65-71. doi: 10.11833/j.issn.2095-0756.2012.01.012
    [8] XIN Xiao-ying, JIANG Hong, ZHOU Guo-mo, YU Shu-quan, WANG Yong-he.  Canadian forest fire weather index (FWI) system:a review . Journal of Zhejiang A&F University, 2011, 28(2): 314-318. doi: 10.11833/j.issn.2095-0756.2011.02.023
    [9] QIU Jin-hong, SHEN Ming-xia, CONG Jing-hua, LI Long-guo.  Monocular vision technique based real-time location of fire-point in forest . Journal of Zhejiang A&F University, 2010, 27(5): 651-658. doi: 10.11833/j.issn.2095-0756.2010.05.003
    [10] GU Lei, WU Chun-jun, WANG Xin.  Land utilization pattern changing and driving force analysis based on remote sensing data in Lin’an . Journal of Zhejiang A&F University, 2009, 26(6): 870-876.
    [11] XIA Qi-biao, LI Guang-hui, YIN Jian-xin.  Application of percolation theory in forest fire simulation . Journal of Zhejiang A&F University, 2009, 26(2): 233-238.
    [12] CHEN Pei-jin, XU Ai-jun, SHAO Xiang-jun, LIU Ai-jun.  Design and implementation of GIS-based forest fire assessment algorithm . Journal of Zhejiang A&F University, 2008, 25(1): 72-77.
    [13] HUANG Chu-dong, SHAO Yun, LI Jing, LIU Jing-hui, CHEN Jie-qiong.  Urban forest research based on regression tree techniques and ASTER imagery . Journal of Zhejiang A&F University, 2008, 25(2): 240-244.
    [14] SONG Li-yan, ZHOU Guo-mo, TANG Meng-ping, YU Shu-quan, ZHENG Wen-da, LIU Xue-song.  Realization of a simulation model for forest fire spread . Journal of Zhejiang A&F University, 2007, 24(5): 614-618.
    [15] TANG Li-hua, FANG Lu-ming, ZHENG Wen-da, CHEN Pei-jin.  Study on multi-index based adaptability evaluation method of regional forest fire danger rating . Journal of Zhejiang A&F University, 2007, 24(5): 608-613.
    [16] XIE Da-yang.  Plague area classification and forecast model of Ceratosphaeria phyllostachydis . Journal of Zhejiang A&F University, 2003, 20(4): 398-402.
    [17] XU Ai-jun, LI Qing-quan, FANG Lu-ming, WU Da-sheng.  Study on model about forest fire forecast and prediction based on GIS . Journal of Zhejiang A&F University, 2003, 20(3): 285-288.
    [18] XIANG Xiao-qiang, WANG Jin-zhi, ZHA Yin-shui, LI Yue-qing.  Phase-varied growth model technique and its applications in subcompartment data updating . Journal of Zhejiang A&F University, 1999, 16(3): 279-282.
    [19] Lu Xiaozhen, Ye Jingzhong, Sun Duo.  Application of the linear autoregression model with input variables to forecast tree phenology. . Journal of Zhejiang A&F University, 1998, 15(2): 201-206.
    [20] Ge Hongli, Xiang Xiaoqiang, He Shizhen, Gu Jinrong.  Variances Estimation of A Sequence Forecasted by An Autoregression Model . Journal of Zhejiang A&F University, 1997, 14(4): 382-387.
  • [1]
    YING Lingxiao, HAN Jie, DU Yongsheng, et al. Forest fire characteristics in China: spatial patterns and determinants with thresholds [J]. For Ecol Manage, 2018, 424: 345 − 354.
    [2]
    SU Zhangwen, TIGABU M, CAO Qiangqian, et al. Comparative analysis of spatial variation in forest fire drivers between boreal and subtropical ecosystems in China[J/OL]. For Ecol Manage, 2019, 454: 117669[2021-03-14]. doi: 10.1016/j.foreco.2019.117669.
    [3]
    SHU Lifu, ZHANG Xiaoluo, DAI Xing’an, et al. Forest fire research (Ⅱ) fire forecast [J]. World For Res, 2003(4): 34 − 37.
    [4]
    YANG Xiajie, SU Zhangwen, TIAN Chao, et al. Optimization of resource distribution of forest fire management in southern Fujian based on ArcGIS [J]. Chin J Ecol, 2017, 36(4): 1142 − 1149.
    [5]
    CHAS-AMIL M L, PRESTEMON J P, MCCLEAN C J, et al. Human-ignited wildfire patterns and responses to policy shifts [J]. Appl Geogr, 2015, 56: 164 − 176.
    [6]
    TAN Sanqing, LIN Qiang, ZHANG Sheng, et al. Study on forest fire danger division based on variable fuzzy sets method [J]. J Cent South Univ For Technol, 2015, 35(9): 35 − 38.
    [7]
    SU Lijuan, HE Youjun, CHEN Shaozhi. Temporal and spatial characteristics and risk analysis of forest fires in China from 1950 to 2010 [J]. Sci Silv Sin, 2015, 51(1): 88 − 96.
    [8]
    MODUGNO S, BALZTER H, COLE B, et al. Mapping regional patterns of large forest fires in wildland-urban interface areas in Europe [J]. J Environ Manage, 2016, 172: 112 − 126.
    [9]
    STRYDOM S, SAVAGE M J. A spatio-temporal analysis of fires in the Southern African Development Community region[J]. Nat Hazards, 2018, 92(3): 1617−1632.
    [10]
    GAO Chao, LIN Honglei, HU Haiqing, et al. A review of models of forest fire occurrence prediction in China [J]. Chin J Appl Ecol, 2020, 31(9): 3227 − 3240.
    [11]
    ZENG Aicong, CAI Qijun, SU Zhangwen, et al. Seasonal variation and driving factors of forest fire in Zhejiang Province, based on MODIS satellite hot spots [J]. Chin J Appl Ecol, 2020, 31(2): 399 − 406.
    [12]
    ALOSON-CANAS I, CHUVIECO E. Global burned area mapping from ENVISAT-MERIS and MODIS active fire data [J]. Remote Sensing Environ, 2015, 163: 140 − 152.
    [13]
    CAI Qijun, ZENG Aicong, SU Zhangwen, et al. Driving factors of forest fire in Zhejiang Province based on Logistic regression model [J]. J Northwest A&F Univ Nat Sci Ed, 2020, 48(2): 102 − 109.
    [14]
    GUO Futao, WANG Guangyu, SU Zhangwen, et al. What drives forest fire in Fujian, China? Evidence from logistic regression and Random Forests [J]. Int J Wildl Fire, 2016, 25(5): 505 − 519.
    [15]
    PENCINA M J, D’AGOSTINO Sr R B, D’AGOSTINO Jr R B, et al. Evaluating the added predictive ability of a new marker: from area under the ROC curve to reclassification and beyond [J]. Stat Med, 2008, 27(2): 157 − 172.
    [16]
    FLUSS R, FARAGGI D, REISER B. Estimation of the Youden Index and its associated cutoff point [J]. Biom J Biom Zeitschrift, 2005, 47(4): 458 − 472.
    [17]
    Survey and Design Institute of State Forestry Administration. Rank of the Regionalization on Nationwide Forest Fire Risk: LY/T 1063−2008[S]. Beijing: China Standards Press, 2008.
    [18]
    MA Wenyuan, FENG Zhongke, CHENG Zhuxin, et al. Study on driving factors and distribution pattern of forest fires in Shanxi province [J]. J Cent South Univ For Technol, 2020, 40(9): 57 − 69.
    [19]
    GUO Futao, SU Zhangwen, WANG Guangyu, et al. Understanding fire drivers and relative impacts in different Chinese forest ecosystems [J]. Sci Total Environ, 2017, 605: 411 − 425.
    [20]
    LIANG Huiling, LIN Yurui, YANG Guang, et al. Application of random forest algorithm on the forest fire prediction in Tahe area based on meteorological factors [J]. Sci Silv Sin, 2016, 52(1): 89 − 98.
    [21]
    WANG Weiguo, PAN Jinghu, FENG Yaya, et al. Model and zoning of fire risk in Gansu Province based on GWLR and MODIS imagery [J]. Remote Sensing Technol Appl, 2017, 32(3): 514 − 523.
    [22]
    PAN Deng, YU Peiyi, WU Qiang. Application of random forest algorithm on the forest fire prediction based on meteorological factors in the hilly area, central Hunan Province [J]. J Northwest For Univ, 2018, 33(3): 169 − 177.
  • 加载中
通讯作者: 陈斌, bchen63@163.com
  • 1. 

    沈阳化工大学材料科学与工程学院 沈阳 110142

  1. 本站搜索
  2. 百度学术搜索
  3. 万方数据库搜索
  4. CNKI搜索

Figures(4)  / Tables(3)

Article views(544) PDF downloads(38) Cited by()

Related
Proportional views

Driving factors of forest fire and fire risk zoning in Kunming City

doi: 10.11833/j.issn.2095-0756.20210339

Abstract:   Objective  With an analysis of the data of fire spots in Kunming City from 2000 to 2015, this study is aimed to determine the main driving factors of forest fires, establish the forest fire prediction model in Kunming City, map the forest fire-risk zones so as to provide reference for the prevention and management of forest fires in Kunming City.  Method  First, with 17 forest fire driving factors selected, a Logistic regression forest fire probability model was constructed on the basis of the satellite forest fire data, including meteorology, terrain, vegetation, artificial, and so on. Then five intermediate models were employed to select the significant variable factors for whole samples before the model was tested using ROC curve. Based on the modeling results of the whole samples, an analysis was conducted of the main forest fire driving factors in Kunming City with the best threshold for probability of forest fire calculated. At last, five fire-risk zones were determined based on the results obtained via the Logistic model.  Result  Among the nine driving factors were altitude, distance from residential areas, distance from railways, NDVI value, monthly average surface temperature, monthly average air pressure, monthly average relative humidity, monthly average wind speed and per capita GDP. The prediction accuracy of Logistic model was as high as 81.7%. The area AUC under ROC curve is 0.905. The best threshold of division was 0.342, the area percent of the five-level fire danger zones were 48.82%, 35.17%, 11.26%, 2.55% and 2.2% respectively.  Conclusion  The main driving factor for forest fire in Kunming City is the meteorological factor with the high fire risk areas in Kunming City concentrated in the southwest region including Wuhua District, Panlong District, Guandu District, Chenggong District, Xishan District and Anning City. [Ch, 4 fig. 3 tab. 22 ref.]

ZHU Zheng, ZHAO Fan, WANG Qiuhua, GAO Zhongliang, DENG Xiaofan, HUANG Penggui. Driving factors of forest fire and fire risk zoning in Kunming City[J]. Journal of Zhejiang A&F University, 2022, 39(2): 380-387. doi: 10.11833/j.issn.2095-0756.20210339
Citation: ZHU Zheng, ZHAO Fan, WANG Qiuhua, GAO Zhongliang, DENG Xiaofan, HUANG Penggui. Driving factors of forest fire and fire risk zoning in Kunming City[J]. Journal of Zhejiang A&F University, 2022, 39(2): 380-387. doi: 10.11833/j.issn.2095-0756.20210339
  • 森林火灾是一种失去人为控制肆意燃烧毁坏林地的森林燃烧现象,严重威胁着生物多样性、森林生态系统和人类生命财产安全[1-2]。森林火险区划是有效防止和减小森林火灾危害的手段,结合火环境将森林区域划分为不同的火险等级便于分级管理[3]。国内外许多学者研究表明,林火受多种驱动因子共同影响,因子可以分为气象、地形、植被和人为因素[4-5]。森林火险区划与林火驱动因子之间存在复杂联系,根据前人研究,其划分方法主要包括模糊聚类法、主成分分析法、模糊综合评判法等[6-8]。Logistic模型是林火研究常用的一种回归模型,因其模型的解释性好和预测准确率较高被广泛应用在林火研究之中。本研究应用Logistic回归模型结合气象、地形、植被、人为等因素建立林火预测模型,对昆明市林火驱动因子进行分析并划分等级,以期为昆明市林火预防和管理工作提供参考。

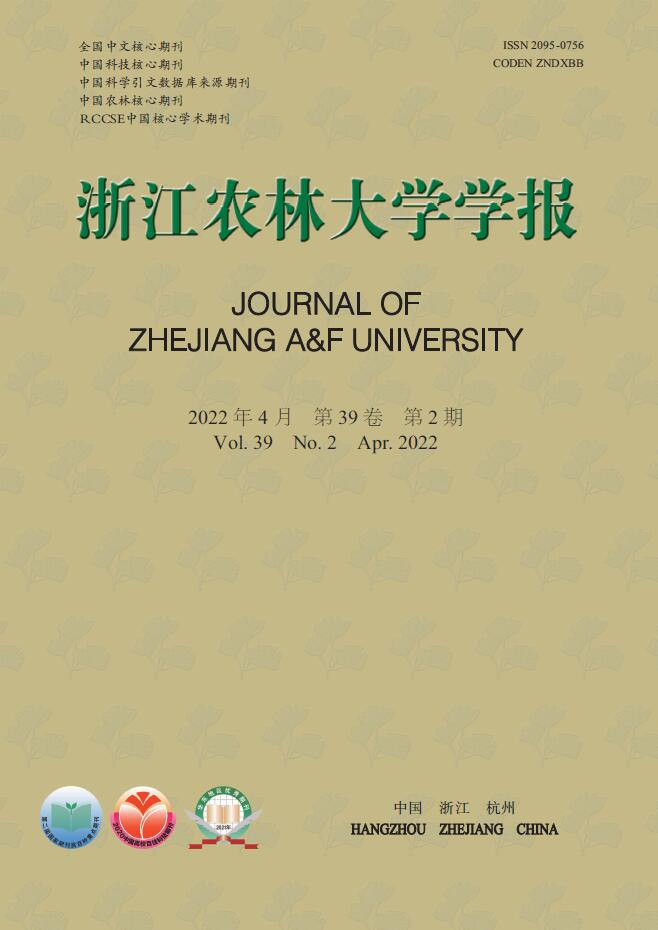
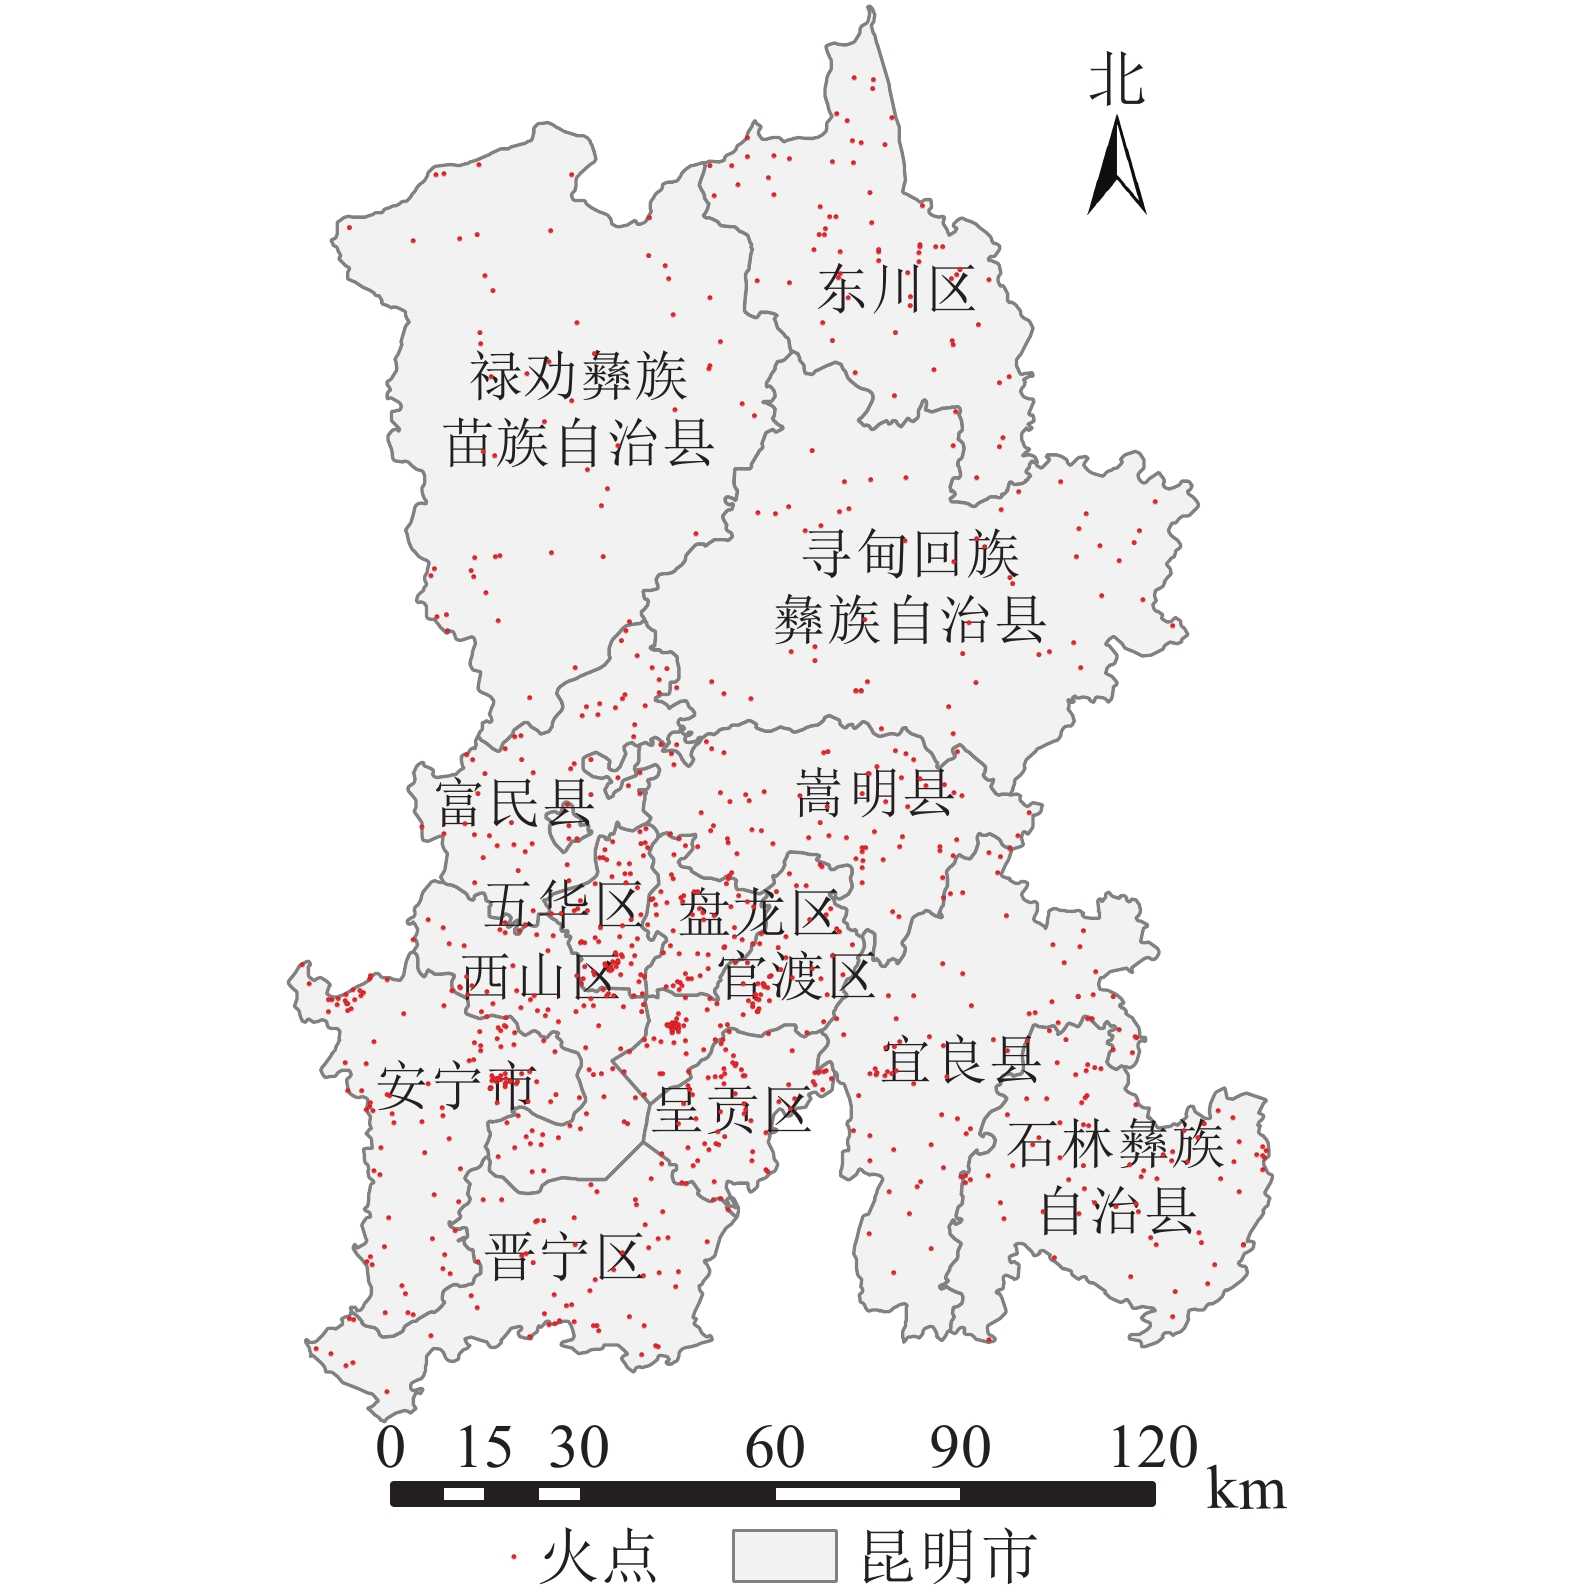
    • 昆明市行政管辖范围包括7个区6个县,代管安宁市。地处云贵高原中南部,24°23′~26°22′N,102°10′~103°40′E,行政面积为2 1473 km2。地势北高南低,地形以高原为主,多数地区海拔为1 500~2 800 m,垂直地域特征明显,物种多样性丰富。昆明属于亚热带高原季风气候,四季如春,日照长、霜期短,市区年平均气温为15.0 ℃,全年干湿季明显,干季在11月至次年4月,属于森林火灾高频期。现有森林面积110.69 万 hm2,森林覆盖率达52.62%,森林蓄积量达6 057 万 m3。主要树种有云南松Pinus yunnanensis、华山松P. armandii、栎类Quercus spp.、杉木Cunninghamia lanceolata、杨树Populus spp.等。卫星火点数据(图1)表明:昆明市2000—2015年共发生森林火灾321次,落在昆明防火期12月到次年5月的火点有280个,占总火点的80%以上。

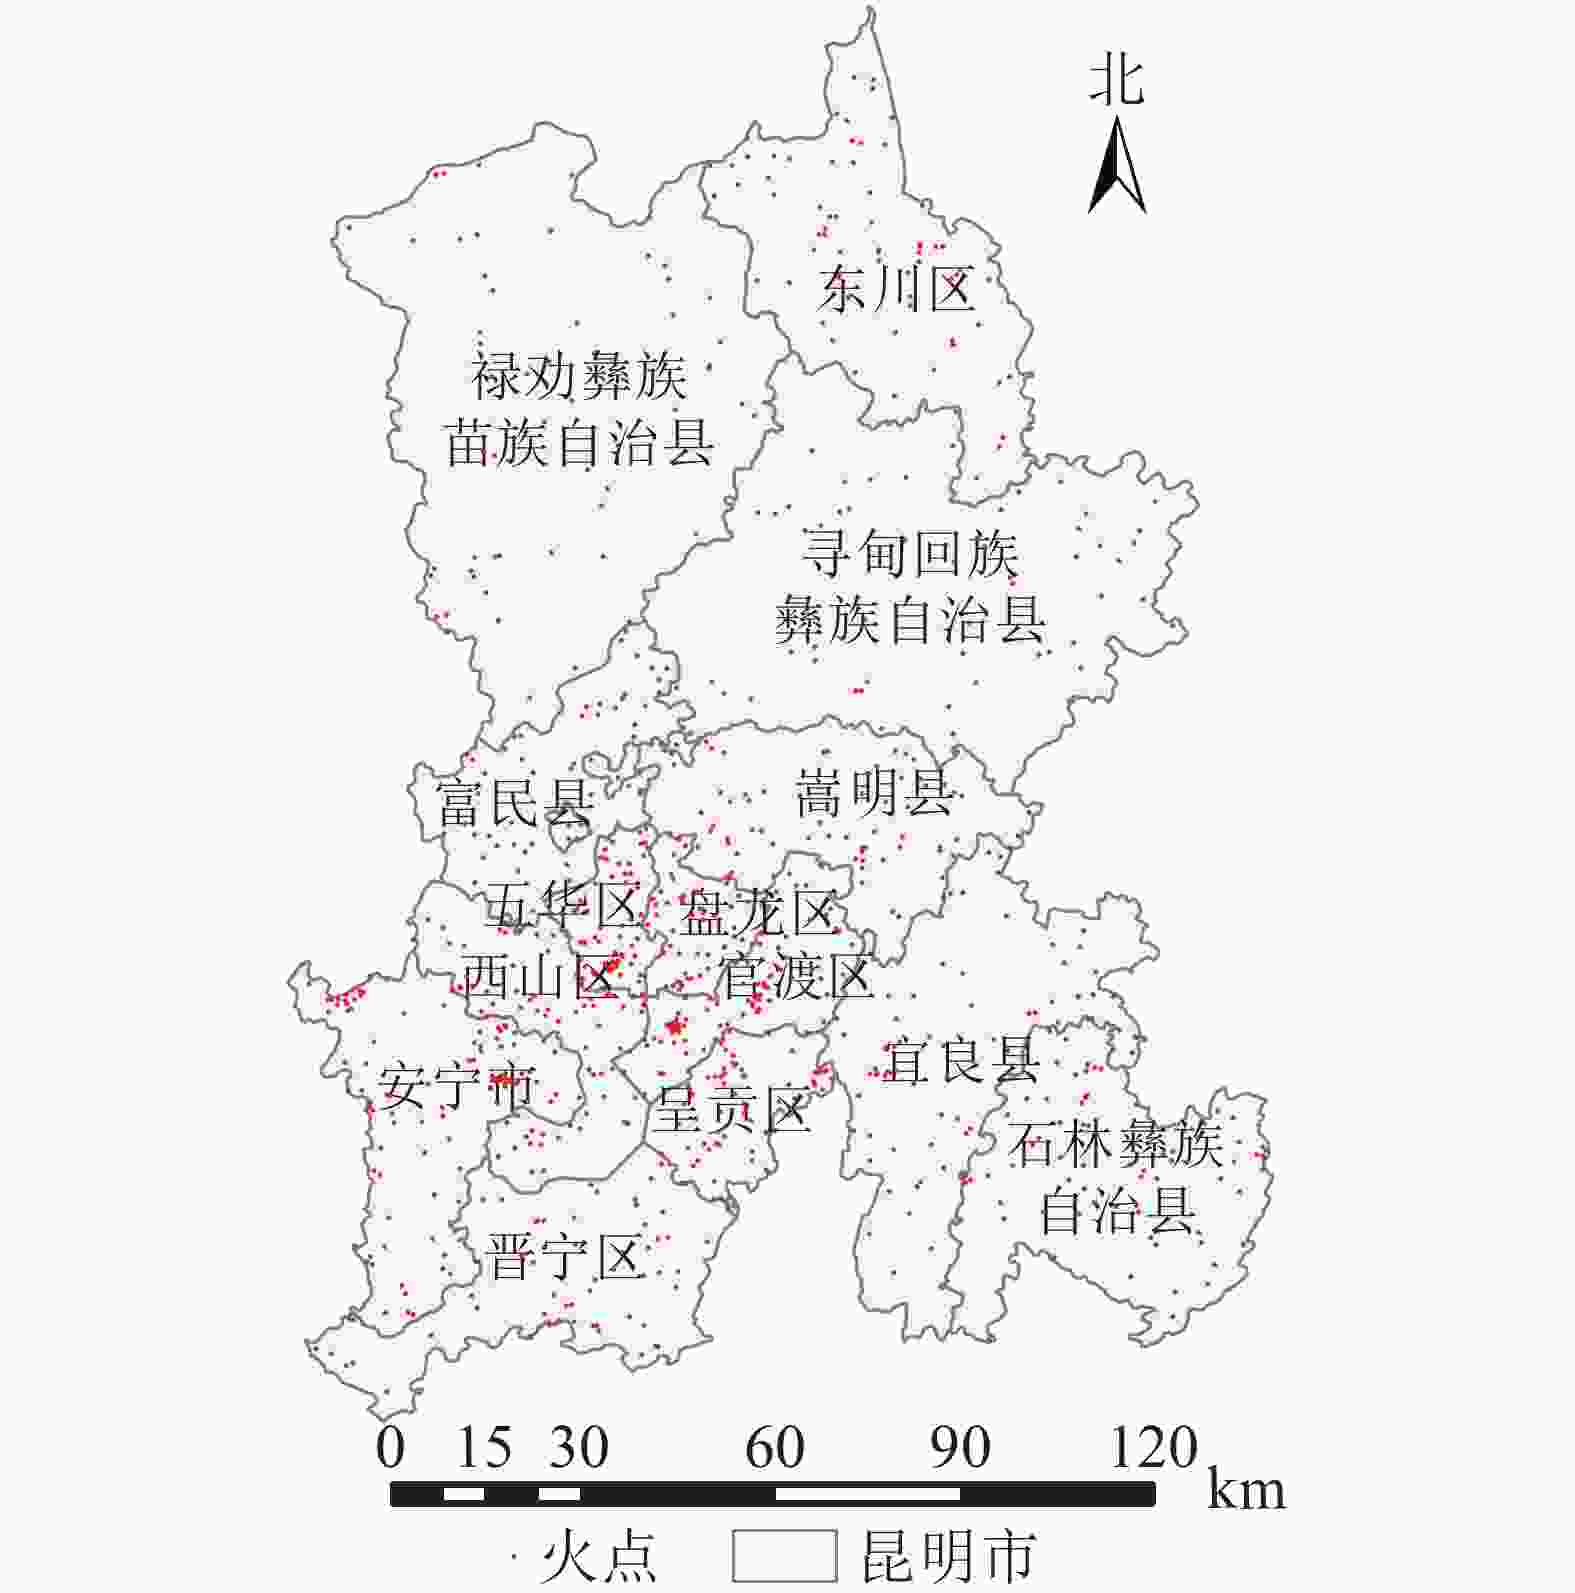
      Figure 1.  Distribution of forest satellite fire data in Kunming from 2000 to 2015

    • 林火发生受多种驱动因子共同影响[9-10]。火点数据来自地理空间数据云平台(http://www.gscloud.cn/)提供的MOD14A2卫星火点数据。该数据为8 d合成数据,该产品被国内外学者用于林火的广泛研究[11-12]。用ArcGIS 10.7对下载的MOD14A2影像数据投影和裁剪获得昆明市范围的影像数据,利用重分类功能将firemask灰度属性值按照0~6和7~9划分为未过火和过火像元,将过火像元比对昆明市地物类型图,将所有落在类型为林地的火点提取作为本研究使用的林火数据。

    • 选取气象、地形、植被、人为活动等共17个因子。地形初始变量有海拔、坡度、坡向,数据来源于地理空间云(http://www.gscloud.cn/)的GDEMV2 30 m数字高程模型(DEM)数据。使用ArcGIS 10.7按掩膜提取昆明市DEM,采用“值提取到点”分别提取各火点对应的值。气象初始变量有月均地表温度、月均气压、月均相对湿度、月均风速、月均气温、月均日照时长,数据来源于中国气象数据共享网(http://cdc.cma.gov.cn/),气象数据采用月均值的方式计算,对各火点直接赋值。植被数据有植被类型和季度归一化植被指数(NDVI)。植被类型来源于全国地理信息资源目录系统下30 m全球地表覆盖数据Globeland 30,运用ArcGIS 10.7值提取至点,得到分类变量值。NDVI来源于中国科学院资源与环境科学与数据中心下中国季度1 km植被指数空间分布数据集,数值分为春夏秋冬4个季节,对火点年份和月份按照对应的季度NDVI进行分类和提取。人为活动因素有距河流距离、距居民区距离、距公路距离、距铁路距离、人均国内生产总值(GDP)、人口密度,数据来源于全国地理信息资源目录系统下1∶25万全国基础地理数据库和中国科学研究院资源与环境数据中心下分辨率1 km人口和GDP格网数据。导入基础设施矢量图后,利用ArcGIS 10.7的近邻分析工具得到火点距离各要素的最近距离,人口密度和人均GDP只有2000、2005、2010年的栅格数据,通过比对《云南省统计年鉴》测算各年人口密度和人均GDP增长率,用“值提取至点”功能得到各火点对应数据。各变量因子之间的量纲不同且存在数据级之间的巨大差别,为消除量纲,避免存在数据级引发的结果贡献问题,对数据采取归一化处理。

    • 二项Logistic回归模型可以有效进行二分类数据的判别,被国内外学者广泛运用于林火区划[8,13]。以林火发生概率作为二项Logistic回归模型的因变量,以y=1或0代表林火是否发生。设P为林火发生概率,则林火未发生概率为1−P,由此得公式:

      将上面公式做logit变换,得到公式为:

      其中:$ {\;\beta }_{0} $$ {\;\beta }_{1} $$ {\;\beta }_{2} 、\cdots 、 {\beta }_{j} $为各自变量因子的回归系数,$ {x}_{1}、{x}_{2} 、\cdots 、 {x}_{j} $为各自变量因子,$ e $为常量,j为自变量个数,P为林火发生概率,$ \mathrm{l}\mathrm{n}\left(\dfrac{P}{1-P}\right) $P的比数的对数。

      建立二项Logistic林火预测回归模型时,需要一些随机非火点与火点共同构成样本数据。基于前人的研究经验[14],将火点与非火点比例调整为1∶2,对非火点日期进行随机赋值,保证时间和空间上的双随机。将样本数据随机分成60%作为模型样本,40%进行独立检验,重复5次随机划分,避免样本分布对最终模型结果的影响。

    • 多重共线指变量因子之间存在相关关系使模型精度下降,利用多重共线性诊断可以有效剔除相关变量。使用方差膨胀因子(VIF)进行多重共线性检验,通常认为0<VIF<10时不存在多重共线性,当VIF≥10时,变量之间存在显著共线性,据此逐步剔除直至变量间不存在显著共线性。

    • 为减小随机选择自变量对建模结果的影响,提高模型的精确度,采用SPSS中系统默认的“强迫回归方法”进行自变量的筛选,逐步剔除变量使剩余变量VIF值均小于10。在上述5次划分的随机模型中选取至少出现3次的显著变量参与全样本数据的拟合。

    • 受试者工作特征曲线(receiver operator characteristic curve,ROC)常用于评价分类模型精度和计算最佳阈值。该曲线以特异性(正类误判为负类)为横坐标,以敏感性(正类判断为正类)为纵坐标,ROC曲线下面积(area under curve AUC)的值用来评价模型的精度,AUC的值越接近于1则表示该模型的精度越高,通常认为AUC>0.8时该模型拥有较好预测能力[15]。约登指数(Youden index,敏感性+1-特异性)是ROC曲线上最靠近左上角的一点,代表两分类模型预测准确度最佳阈值[16],用该阈值计算可以得到模型的预测准确率。

    • 依据全样本运算得到的Logistic回归方程式计算结果,使用ArcGIS的克里金插值法进行图层运算,获得昆明市的林火发生概率分布图。《全国森林火险区划等级》[17]将全国森林火险等级划分为3级,但该标准只适用于县级或林场的等级区划,对于大区域的宏观预测精度和指导意义远远不够。本研究按照前人的经验和国际惯例[18],依据概率等间距将昆明市划分为五级森林火险:0~0.2为一级火险区,0.2~0.4为二级火险区,0.4~0.6为三级火险区,0.6~0.8为四级火险区,0.8~1.0为五级火险区。

    • 共线性诊断适用于连续变量不适用于分类变量,因此,先对15个连续变量进行多重共线性诊断,再综合5个中间模型加上非连续性变量“植被类型”和“坡向”进行模型显著性检验,确定最终林火驱动因子。多重共线性诊断的结果如表1所示:在剔除月均气温之后,不存在多重共线性。将筛选的连续变量和分类变量采用“沃尔德(Wald)向前”原则对5个样本进行拟合,选择结果中出现3次及以上的显著变量作为全样本模型的自变量因子,全样本的拟合结果如表2所示。

      序号变量名剔除变量
      前VIF值
      剔除变量
      后VIF值
      1 海拔 1.179 1.177
      2 坡度 1.113 1.109
      3 月均地表温度 23.899 1.933
      4 月均气压 1.930 1.823
      5 月均相对湿度 4.562 4.351
      6 月均风速 1.950 1.946
      7 月均气温 25.876
      8 月均日照时长 3.573 3.514
      9 归一化植被指数 2.213 2.173
      10 距河流距离 1.090 1.089
      11 距居民区距离 1.171 1.170
      12 距公路距离 1.216 1.210
      13 距铁路距离 1.243 1.236
      14 人均GDP 1.810 1.799
      15 人口密度 1.168 1.168
        说明:−表示月均气温被剔除

      Table 1.  Results of multicollinearity diagnosis

      变量系数标准误沃尔德显著性
      海拔(x1) −2.138 1.096 3.805 0.000
      距居民点距离(x2) 1.768 0.658 7.224 0.007
      距铁路距离(x3) −1.373 0.614 4.997 0.025
      归一化植被指数(x4) −3.159 0.769 16.875 0.000
      月均地表温度(x5) 2.110 0.641 3.298 0.000
      月均气压(x6) −1.654 0.552 6.665 0.010
      月均相对湿度(x7) −2.273 0.612 18.478 0.000
      月均风速(x8) 1.169 1.153 3.649 0.000
      人均GDP(x9) 6.638 1.162 33.169 0.000
      常量 2.061 0.796 6.699 0.010

      Table 2.  Results of logistic regression model for all data

    • 图2所示:用ROC曲线分别计算模型的AUC和约登指数并以此计算测试样本预测准确率。如表3所示:5个中间模型的样本的AUC值均大于0.890,对样本的预测准确率均高于80%,全样本AUC值为0.905,预测准确率为81.7%,说明Logistic回归模型对昆明市林火发生预测有较好的预测效果,适用于昆明市林火发生预测。根据全样本拟合结果建立昆明市Logistic回归概率模型为:

      Figure 2.  ROC curve of forest fire prediction model in Kunming City

      样本AUC阈值训练样本预测
      准确率/%
      测试样本预测
      准确率/%
      样本组1 0.906 0.334 83.3 82.1
      样本组2 0.898 0.385 82.0 84.5
      样本组3 0.906 0.366 81.1 82.3
      样本组4 0.898 0.329 82.5 85.7
      样本组5 0.913 0.379 82.0 84.3
      全样本 0.905 0.342 81.7

      Table 3.  Model evaluation

      其中:P是林火发生概率,$ {x}_{1} $为海拔,$ {x}_{2} $为居民点,$ {x}_{3} $为离铁路距离,$ {x}_{4} $为NDVI,$ {x}_{5} $为月均地表温度,$ {x}_{6} $为月均气压,$ {x}_{7} $为月均相对湿度,$ {x}_{8} $为月均风速,$ {x}_{9} $为人均GDP。

    • 图3可见:5类森林火险等级分别占昆明市区面积的48.82%、35.17%、11.26%、2.55%、2.2%,高火险地区集中分布在五华区、盘龙区、官渡区、呈贡区、西山区、安宁市等,四级和五级火险区集中在一起。与实际火点进行比对,这片区域发生历史火灾集中且次数最多。总体来看,昆明市的重点火险区主要分布在昆明市西南部、嵩明县的中部地区、东川区的边界和石林彝族自治县的中部地区。

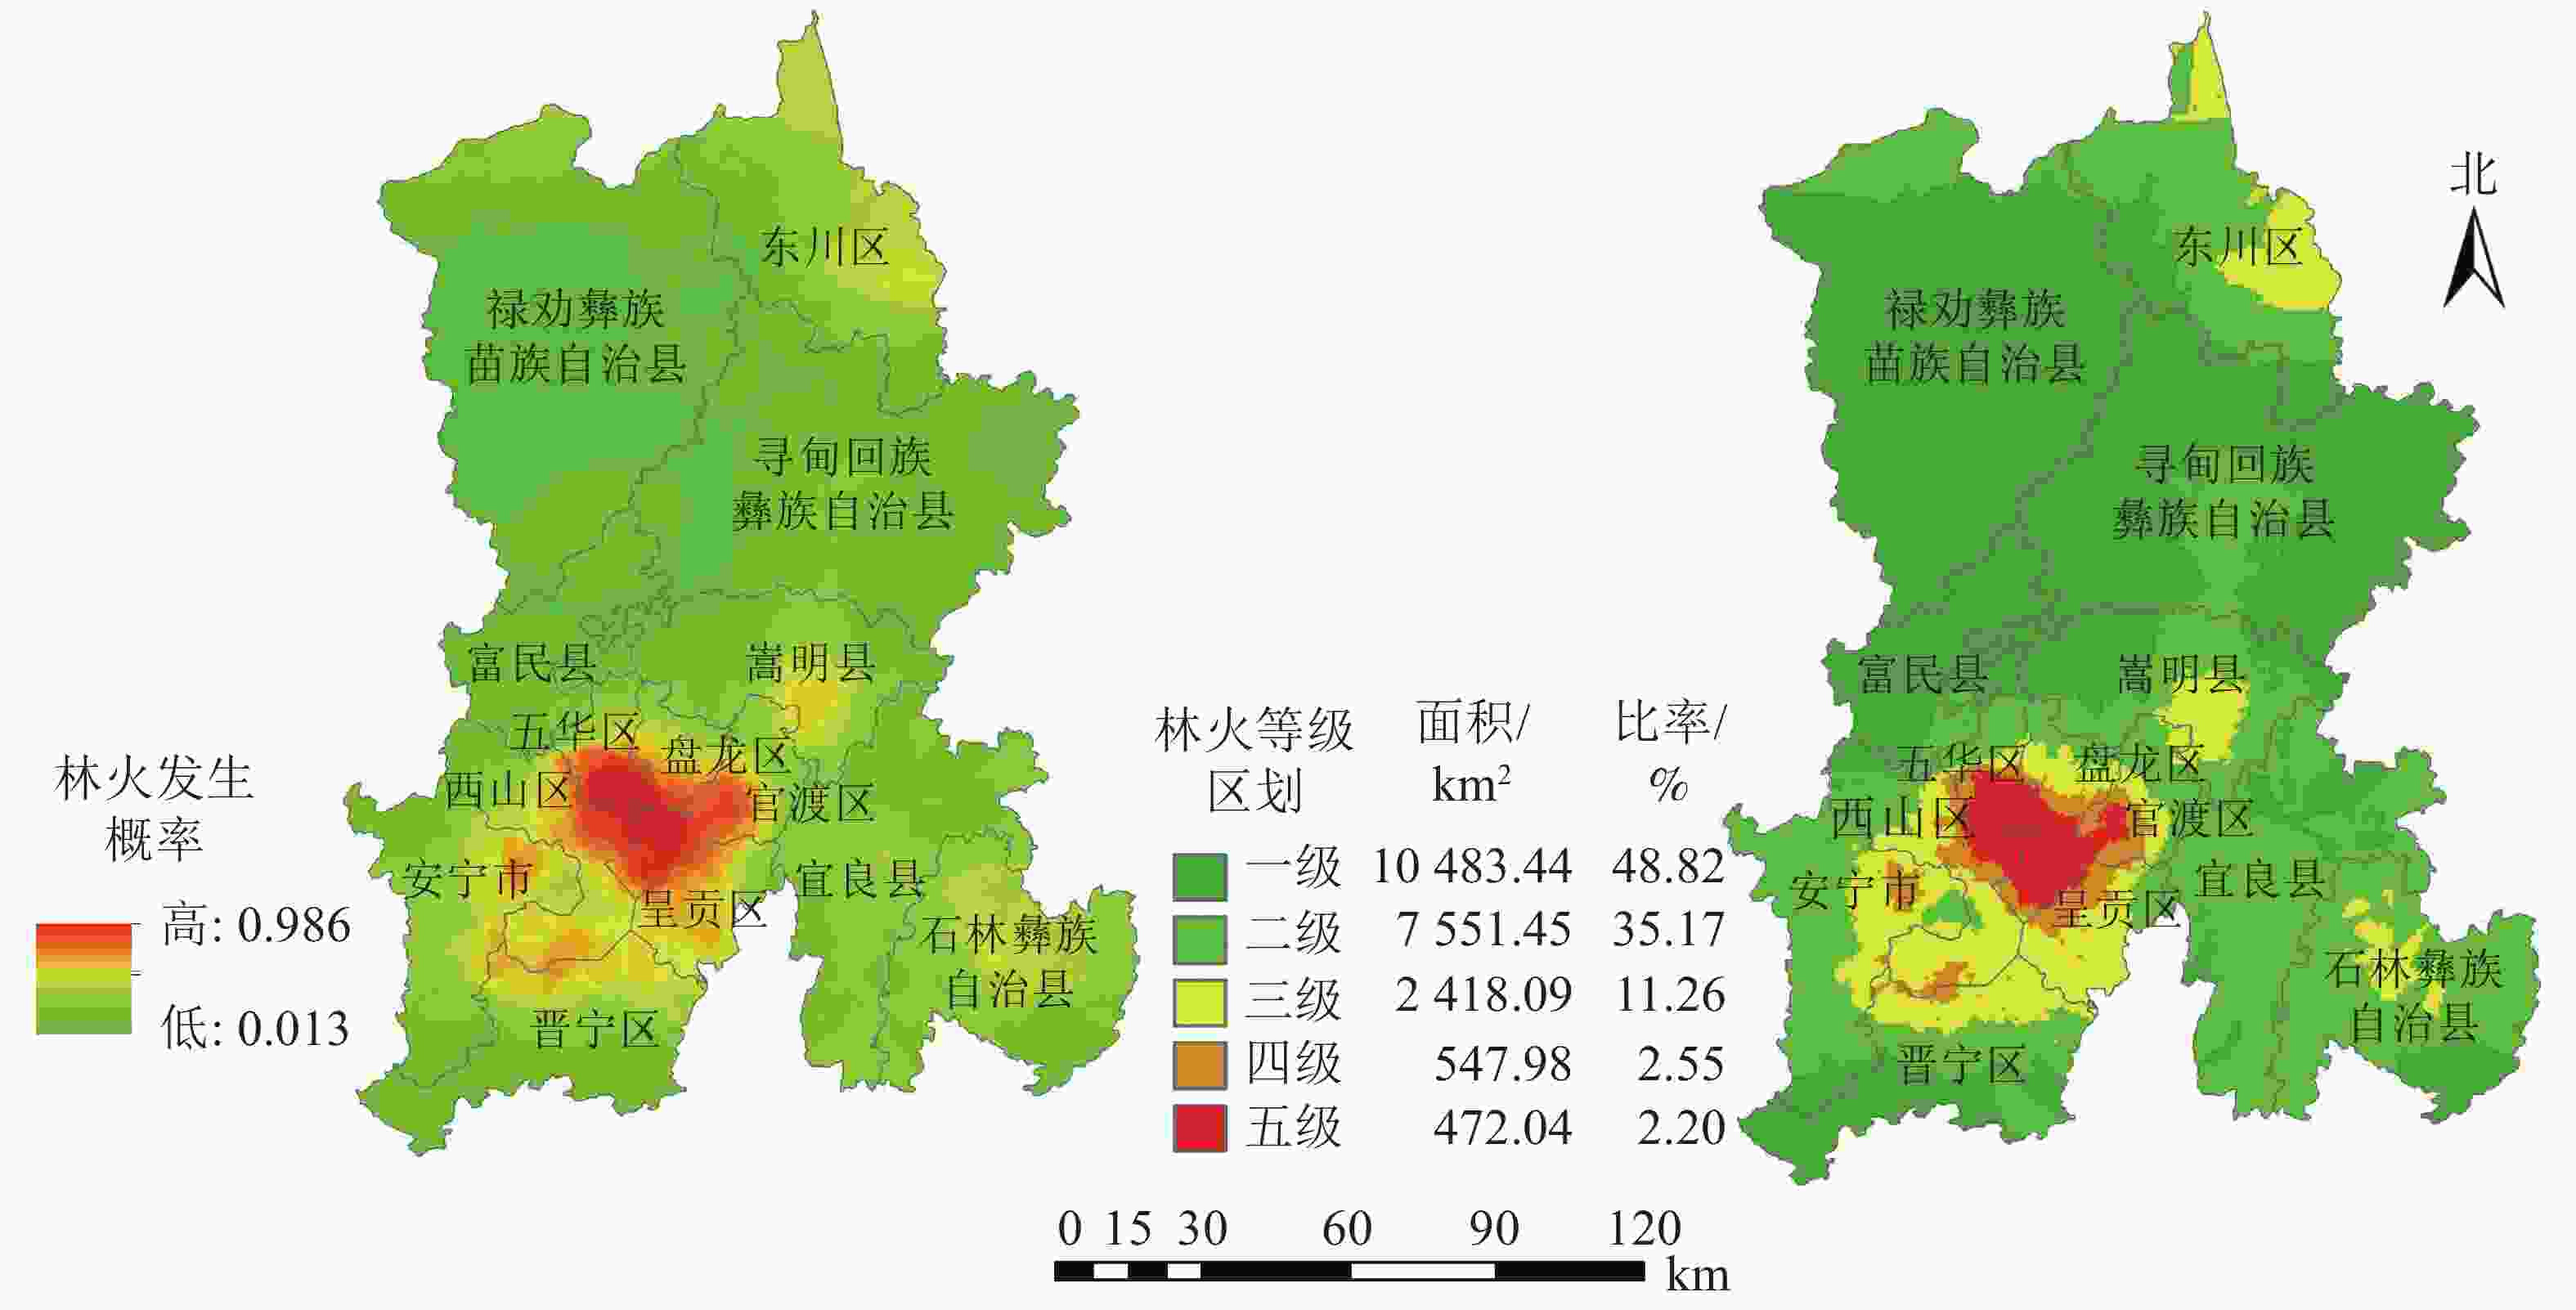
      Figure 3.  Probability and risk division of forest fire occurrence in Kunming City
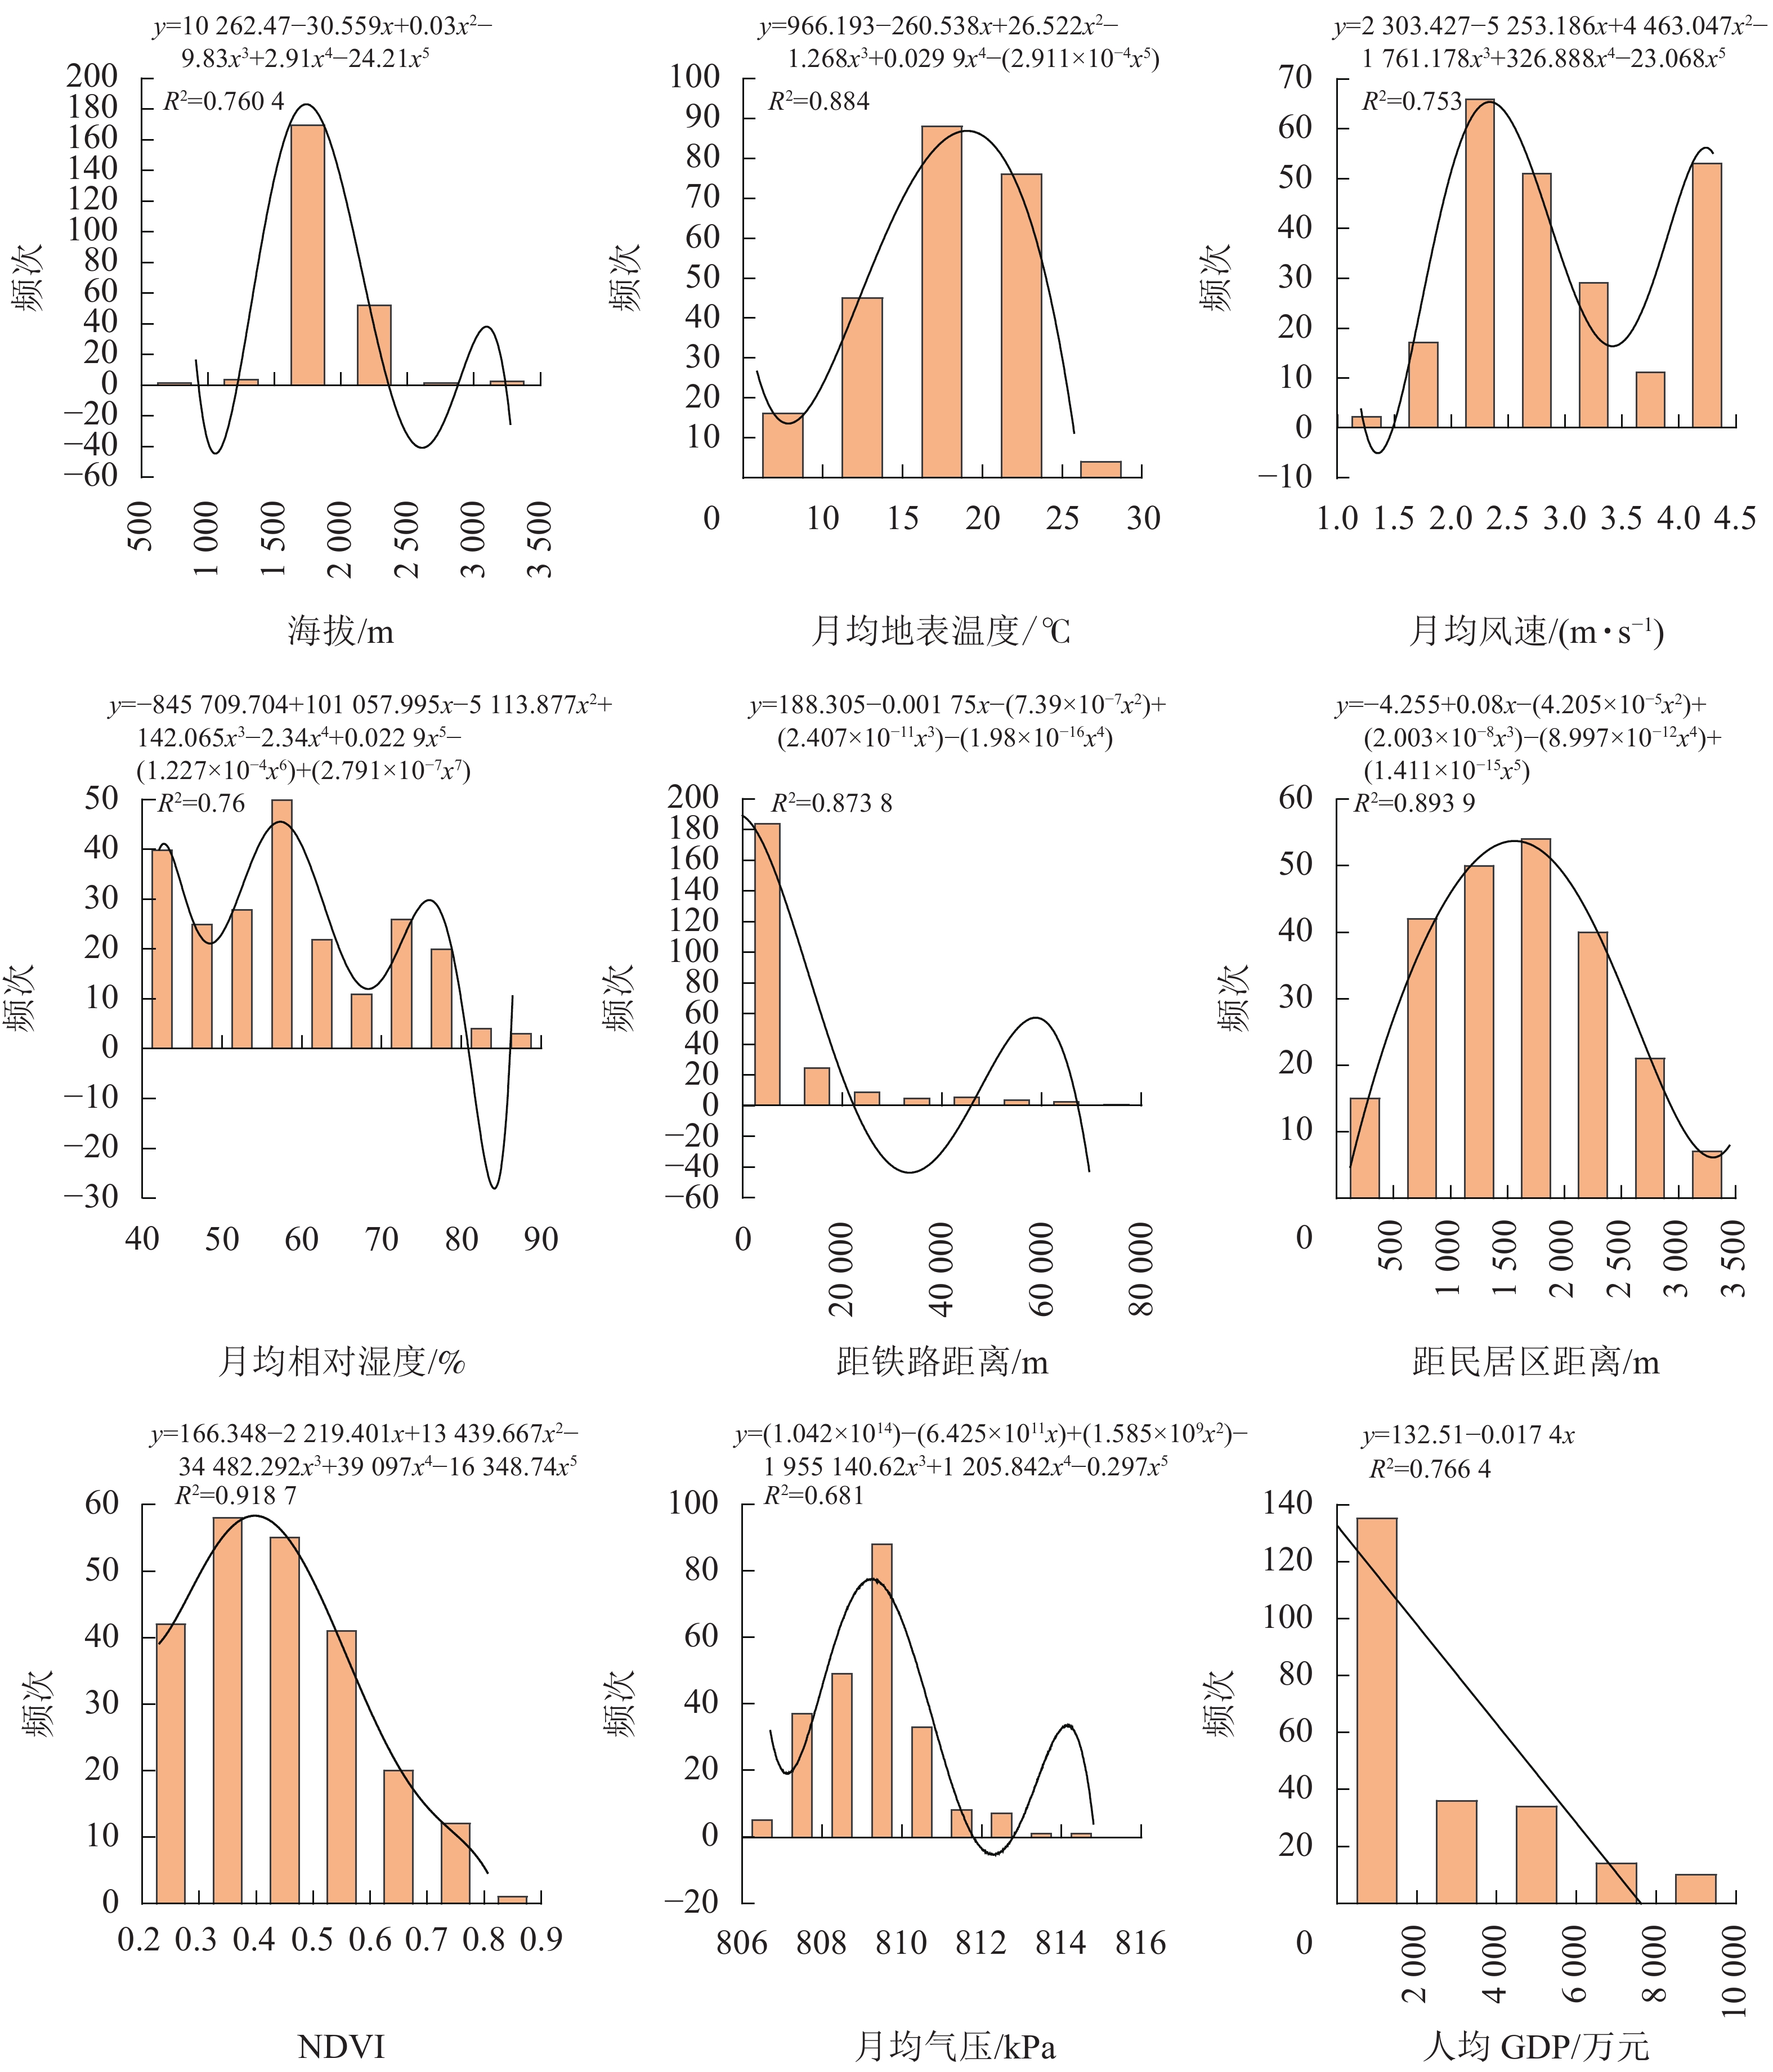
    • 表3可以看出:对昆明市林火发生概率具有显著影响的林火驱动因子分别为海拔、距居民点距离、距铁路距离、NDVI值、月均地表温度、月均气压、月均相对湿度、月均风速、人均GDP。由图4可得:火点集中在距居民区1 500~2 500 m,这个区间属于人口密集区,人为活动频繁导致林火发生概率增大。火点集中分布在月均地表温度15~25 ℃区间,该温度对应昆明市春夏季,此时正是昆明市的防火期,降水稀少,日照时间长,可燃物含水率低,容易引发火灾发生。昆明市火点频次在月均风速2.0~4.0 m·s−1时呈下降趋势,到达4.5 m·s−1先上升后下降,该区间对应昆明市春夏季过渡到秋季,降水增多,植物含水率和温度较低,不易发生火灾。11月进入冬季,为昆明市防火期时段,从月均相对湿度来看,昆明市火点主要集中在40%~60%,在相对湿度高于60%之后的区间,月均相对湿度与火点频次呈负相关关系。

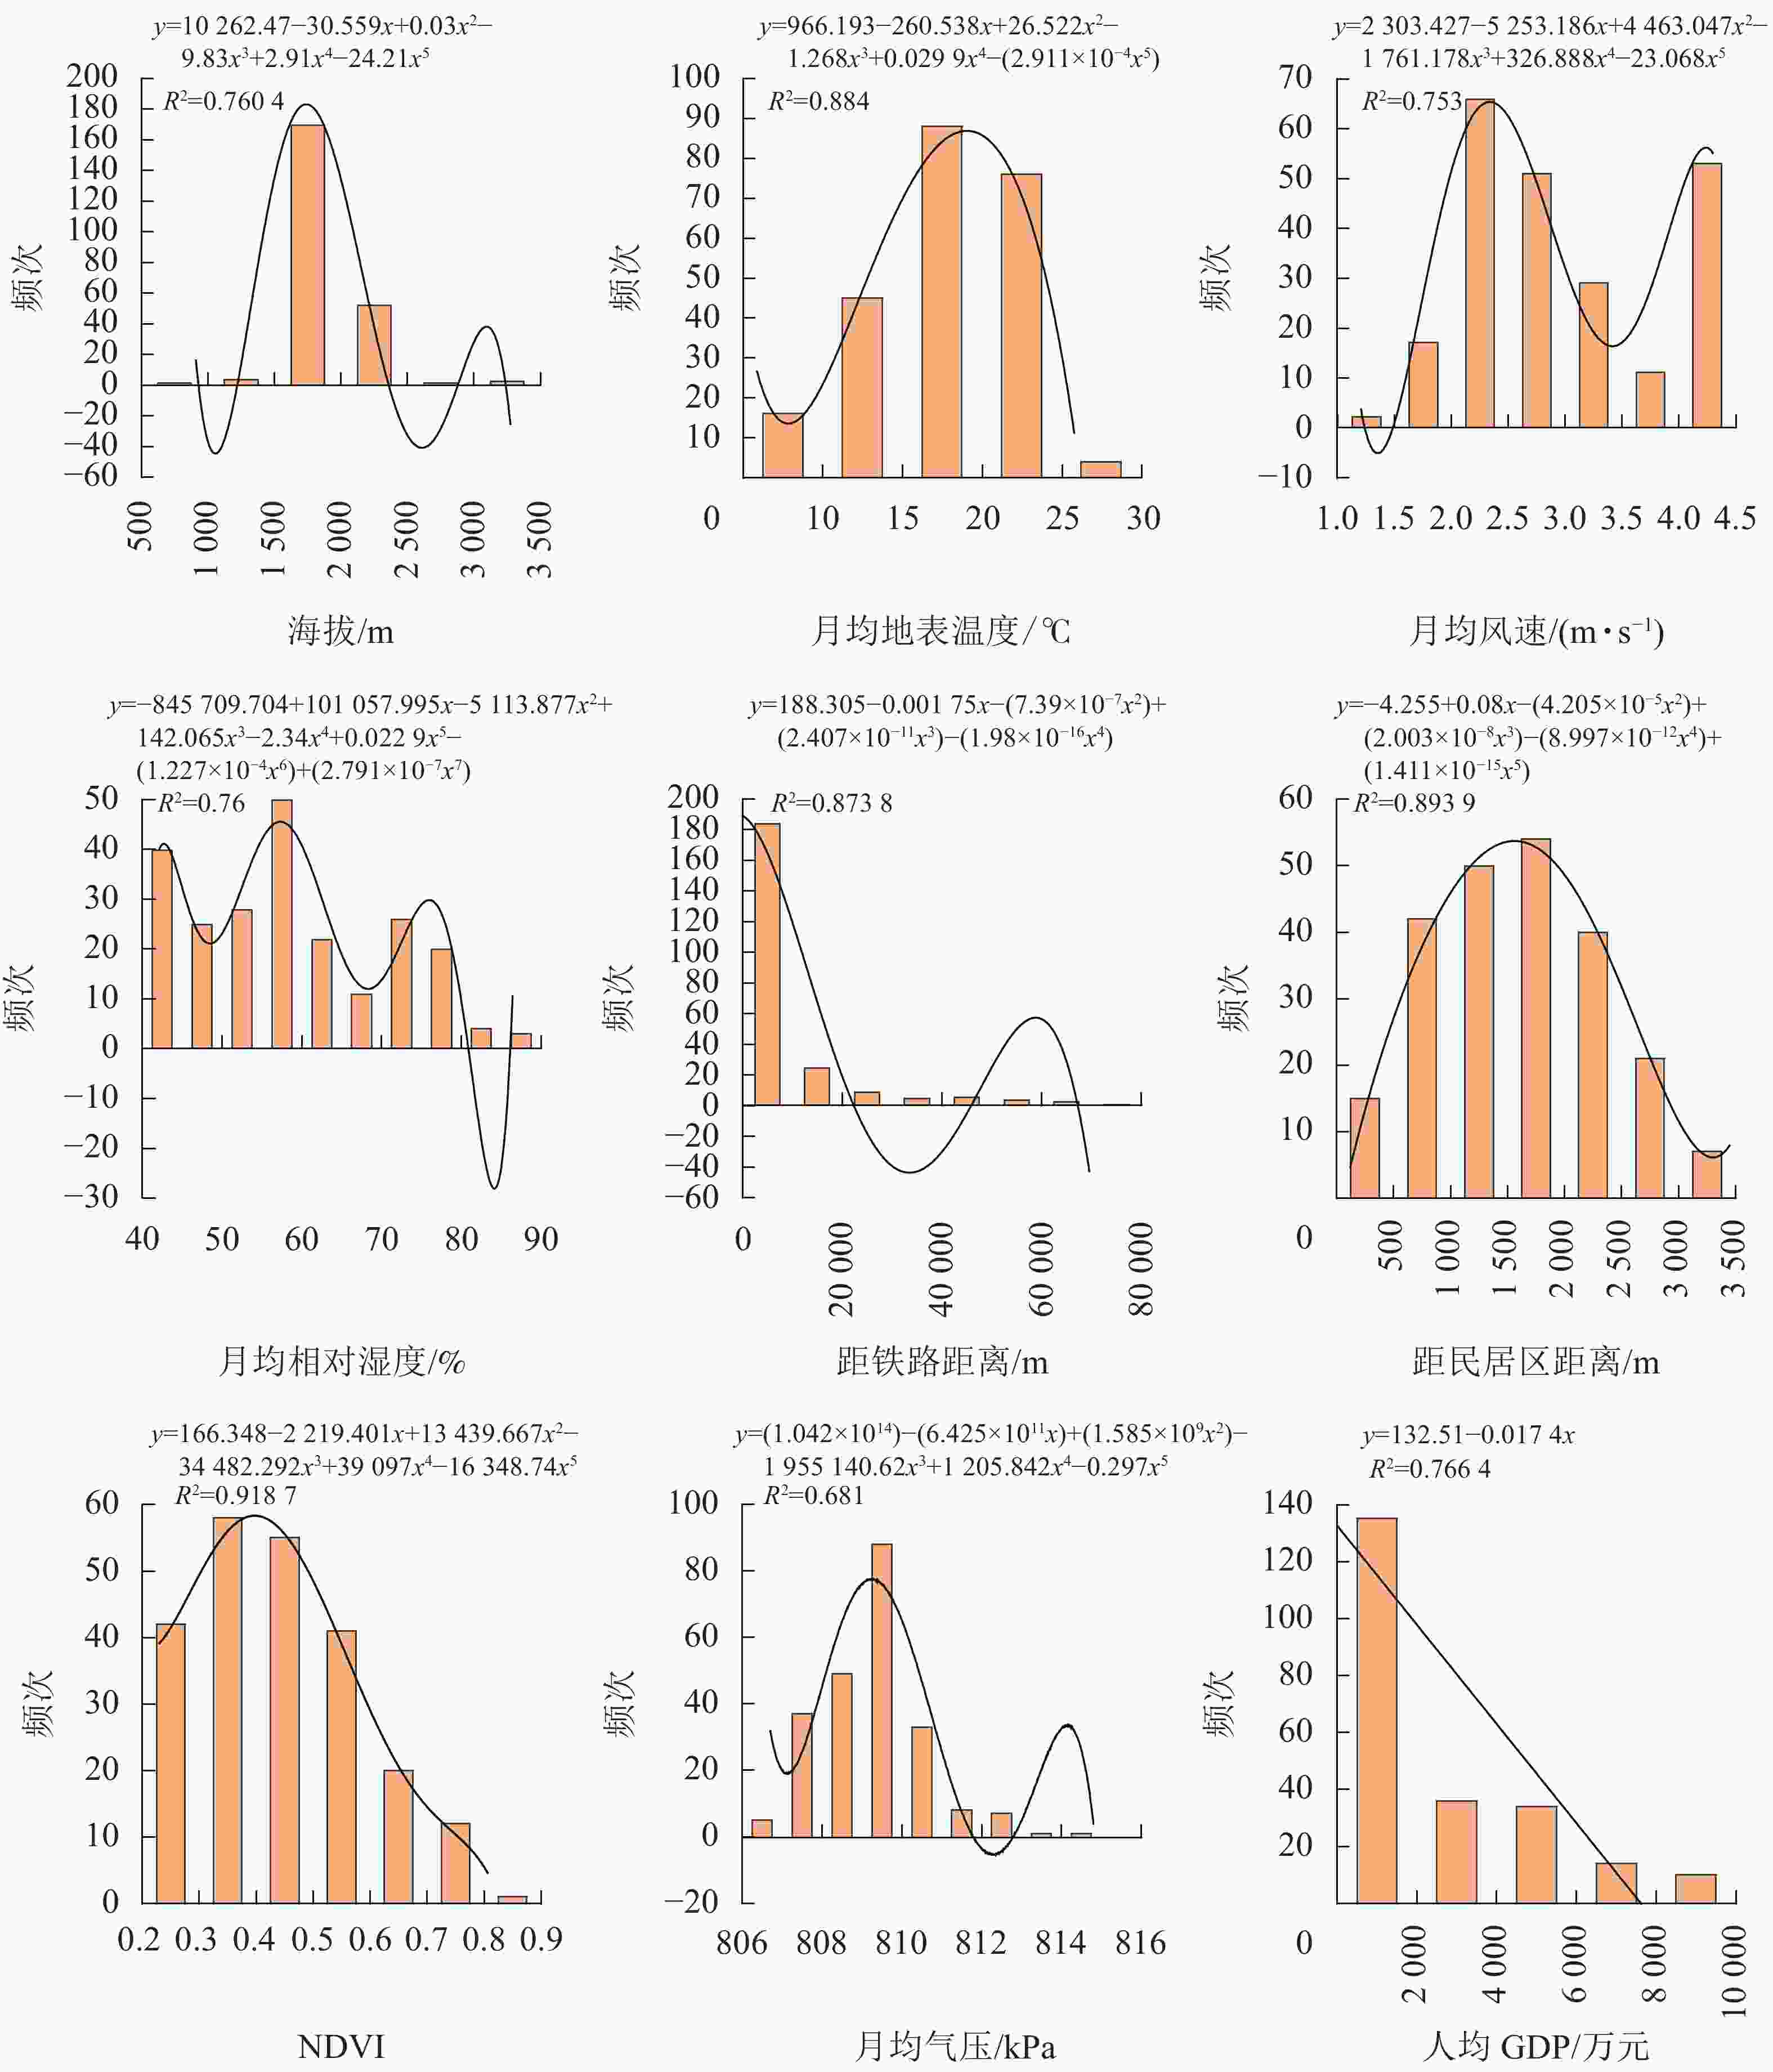
      Figure 4.  Relationships of forest fire driving factors and fire frequency

      火点频次与距铁路距离呈明显的负相关关系,火点主要分布在0~20 km的区域内,随距离增加,火点越来越少,距居民区的火点集中在0~2 000 m的区域内,2 000 m以后呈明显的负相关。人均GDP与火点频次呈明显的负相关,随人均GDP的增长火点减少,人均GDP较少的区域多处于农村、乡镇区域,森林面积大,火点占有可能性较高。NDVI代表植被覆盖率,其值与植被覆盖率呈正比关系,火点落入0.2~0.5最多,这一现象可能是因为植被茂密地区地表温度较低,地表蒸发量小,从而使可燃物含水率保持在较高的程度,不易发生火灾。

    • 林火驱动因子中,月均地表温度、月均气压、月均相对湿度、月均风速都属于气象因素,气象因素是影响昆明市林火发生的主要因素。气象因素影响火三角中可燃物与温度这2个因素,相对湿度影响可燃物含水率,抑制林火发生,与林火发生呈负相关[19]。地温和风速通过减小可燃物含水率影响林火发生,风速还可以加快空气流动,影响火灾蔓延的方向和速率,与林火发生呈正相关。气压随海拔升降发生变化,火点落入806~816 hPa为多,其中,火点主要分布在810 hPa。昆明市范围内的林火不仅受到气象因素的影响,还受到地形、可燃物、人为活动等因素的共同影响,气象因素决定大范围内林火发生的可能性,而地形、可燃物、人为活动等因素从更精细的空间角度预示着潜在的林火分布状况。

      进行二项Logistic多重线性诊断时,5个中间模型得到的林火驱动因子都不相同,海拔作为显著变量却成为中间模型剔除因素,林火驱动因子之间存在复杂关联,仅仅考虑自变量之间的相关性可能会剔除模型中存在重要影响的因子[20]。本研究选取了当前林火驱动因子所有时间段的数据,Logistic回归风险模型进行拟合,没有考虑可能存在气候差异明显的时间段,比如昆明市存在明显的干湿季,对于林火发生概率也会产生显著影响。在接下来的的研究中应考虑做多个不同时期的森林火险区划。除本次研究中使用的Logistic回归模型以外,预测林火的模型还有随机森林算法、地理加权回归模型等,国内已有相关学者用于林火预测的研究[21-22]。不同林火模型对于地区的适用性和解释性都不相同,可针对昆明市的林火分布特征找出最优解释模型。本研究所选的自变量没有包含日值气象数据,对于极端值情形研究不足,下一步将研究极端值情况对林火发生概率的影响。

Reference (22)

Catalog

    /

    DownLoad:  Full-Size Img  PowerPoint
    Return
    Return