Volume 40 Issue 2
Apr.  2023
Turn off MathJax
Article Contents

XU Hao, LI Wei, LIU Wei, WANG Chengkang. Spatio-temporal evolution of Nanjing’s urban green space pattern and its influencing factors[J]. Journal of Zhejiang A&F University, 2023, 40(2): 407-416. doi: 10.11833/j.issn.2095-0756.20220332
Citation: XU Hao, LI Wei, LIU Wei, WANG Chengkang. Spatio-temporal evolution of Nanjing’s urban green space pattern and its influencing factors[J]. Journal of Zhejiang A&F University, 2023, 40(2): 407-416. doi: 10.11833/j.issn.2095-0756.20220332

Spatio-temporal evolution of Nanjing’s urban green space pattern and its influencing factors

doi: 10.11833/j.issn.2095-0756.20220332
  • Received Date: 2022-05-05
  • Accepted Date: 2022-12-01
  • Rev Recd Date: 2022-11-20
  • Available Online: 2023-02-16
  • Publish Date: 2023-04-20
  •   Objective  The urban green space is not only an important part of the regional ecological environment, but also an important bearing space for suburban recreation and a structural space that restricts the infinite spread of the city. Therefore, this study, with an investigation of the dynamic landscape changes of green space in Nanjing, a mega city in the Yangtze River Delta and its influencing factors, is aimed to help further optimize the spatial structure of green space and regional sustainable development. In Nanjing so as to promote the sustainable development of the Yangtze River Delta region.   Method  With the land cover data of Nanjing City in five time nodes in 2000, 2005, 2010, 2015 and 2020 selected, an analysis was conducted of the spatio-temporal evolution pattern of the green space in Nanjing City employing dynamic degree calculation and landscape pattern index. Then, the partial least squares regression equation (PLSR) model was adioted to explore the impact of socioeconomic factors and natural factors on the evolution of green space pattern.   Result  From 2000 to 2020, there was first a decrease and then an increase in the green space in Nanjing. From 2000 to 2005, the green space patches in Nanjing City tended to be integrated, with the fragmentation of green space landscapes easing up. After 2005, the scale of urban green space has increased, with an obvious fragmentation trend and a steady decrease in the overall landscape connectivity, The regression model showed that among the socioeconomic factors, the proportion of the industrial structure, the green area of the built-up area and the changes in the urban green space pattern had a greater correlation, and there were differences in the force of natural factors.   Conclusion  The overall scale of green space in Nanjing has increased with an obvious trend of pattern fragmentation and the socioeconomic factor being the direct influencing factor in the evolution of urban green space spatial pattern which is subject to the restriction of many natural factors. There is an urgent need to strengthen systematic planning for regional green spaces. [Ch, 5 fig. 6 tab. 29 ref.]
  • [1] WANG Jianwu, JI Biyong, WANG Zhengyi, ZHU Chenghao.  Impact of subtropical forest landscape pattern on forest carbon density in Lishui City of Zhejiang Province . Journal of Zhejiang A&F University, 2024, 41(1): 30-40. doi: 10.11833/j.issn.2095-0756.20230205
    [2] LIN Zhouyu, HAN Renjie, LI Jian.  Courses, characteristics and motivations of spatial and temporal evolution of national forest cities in China . Journal of Zhejiang A&F University, 2024, 41(1): 183-191. doi: 10.11833/j.issn.2095-0756.20230248
    [3] XU Chenkai, WANG Ke, HUANG Lu.  Water pattern changes of Tongxiang City based on multi-source remote sensing data . Journal of Zhejiang A&F University, 2024, 41(2): 419-428. doi: 10.11833/j.issn.2095-0756.20230288
    [4] JIAO Xinyu, LONG Mei, LIU Zhixiong.  Spatiotemporal distribution and influencing factors of wild Cymbidium faberi from the perspective of historical geographic information system . Journal of Zhejiang A&F University, 2023, 40(6): 1261-1272. doi: 10.11833/j.issn.2095-0756.20220766
    [5] ZHANG Chenghu, LIU Ju, HU Baoqing, CHEN Xiufen.  Spatial pattern and its influencing factors of water conservation services in Xijiang River Basin, Guangxi . Journal of Zhejiang A&F University, 2022, 39(5): 1104-1113. doi: 10.11833/j.issn.2095-0756.20210616
    [6] LIU Yuqing, ZHANG Huabing, SUN Xiaoxiang, LI Yufeng.  Spatial-temporal variations of landscape pattern and hot spot analysis in the Lixiahe Plain of Jiangsu Province from 1980 to 2018 . Journal of Zhejiang A&F University, 2022, 39(1): 105-114. doi: 10.11833/j.issn.2095-0756.20210178
    [7] CAI Mengqing, HUANG Lu, YAN Lijiao.  Temporal and spatial variation characteristics of annual water yield and its influencing factors in Hangzhou based on InVEST model . Journal of Zhejiang A&F University, 2022, 39(1): 127-135. doi: 10.11833/j.issn.2095-0756.20210170
    [8] YU Fei, LI Zhiyong.  Forests landscape pattern changes and driving forces in Mount Tianmu . Journal of Zhejiang A&F University, 2020, 37(3): 439-446. doi: 10.11833/j.issn.2095-0756.20190306
    [9] GUO Yujing, WANG Yan, ZHENG Yi, LIU Yungen, WEN Guojing, ZHAN Pengfei.  Temporal and spatial evolution of landscapes in Jianhu Lake Basin of northwestern Yunnan Province . Journal of Zhejiang A&F University, 2018, 35(4): 695-704. doi: 10.11833/j.issn.2095-0756.2018.04.015
    [10] LI Hongji, CAI Xianfeng, YUAN Jiali, ZENG Yingying, YU Xiaopeng, WEN Guosheng.  Photosynthetic carbon fixation in Phyllostachys edulis during its fast growth period . Journal of Zhejiang A&F University, 2016, 33(1): 11-16. doi: 10.11833/j.issn.2095-0756.2016.01.002
    [11] WU Luyi, YUE Yongjie, LIU Guohou, GAO Runhong, SU Zhicheng.  Climate changes affecting regional landscape patterns at Xanadu . Journal of Zhejiang A&F University, 2016, 33(2): 232-238. doi: 10.11833/j.issn.2095-0756.2016.02.007
    [12] CAI Bifan, TAO Zhuomin, ZHANG Mingru, LI Tao, LU Senhong.  Seasonal fluctuation characteristics and determinants of tourist flows of Mount Tianmu scenic area . Journal of Zhejiang A&F University, 2015, 32(6): 947-957. doi: 10.11833/j.issn.2095-0756.2015.06.019
    [13] Lü Kunlong, RAO Liangyi, LI Feifei, LI Huijie, ZHU Mengxun, ZHU Zhenya, ZHOU Jian.  Storage and determinants of coarse woody debris in China’s forests . Journal of Zhejiang A&F University, 2013, 30(1): 114-122. doi: 10.11833/j.issn.2095-0756.2013.01.017
    [14] LU Xinyue, LI Lanying, WAN Chaowei, HUANG Wenjing, LI Lang.  On farmer households’ response to the “Two Separations and Two Exchanges” policy . Journal of Zhejiang A&F University, 2013, 30(5): 734-739. doi: 10.11833/j.issn.2095-0756.2013.05.016
    [15] GUO Hui-hui, JIANG Wen-wei, MEI Yan-xia.  Landscape pattern analysis of Yinzhou new city zone based on high spatial resolution aerial photos . Journal of Zhejiang A&F University, 2012, 29(3): 344-351. doi: 10.11833/j.issn.2095-0756.2012.03.005
    [16] CHE Teng-teng, FENG Yi-ming, CAI Dao-xiong, ZHANG Wan-xing, ZHANG Xian-qiang, WU Chun-zheng.  Dynamics analysis on landscape patterns of Chinese tropical and subtropical plantation areas . Journal of Zhejiang A&F University, 2011, 28(5): 706-712. doi: 10.11833/j.issn.2095-0756.2011.05.004
    [17] GUO Zheng, JIANG Hong, CHEN Jian, CHENG Miao-miao, JIANG Zi-shan, YU Shu-quan, LI Tu-sheng.  Forest landscape analysis with remote sensing data for Yuhang,Zhejiang Province . Journal of Zhejiang A&F University, 2010, 27(1): 36-43. doi: 10.11833/j.issn.2095-0756.2010.01.006
    [18] XIA Wei-weil, HAN Hai-rong, YI Li-ta, CHENG Xiao-qin.  Dynamics of forest landscape pattern in Pangquangou National Nature Reserve . Journal of Zhejiang A&F University, 2008, 25(6): 723-727.
    [19] LI De-hui, LI Xian-wei, WANG Qiao, RONG Li, YANG Miao, LIUShuo.  A review of forest root respiration-determinants and response to global change . Journal of Zhejiang A&F University, 2007, 24(2): 231-238.
    [20] WEN Gui-feng, SUN Fang-li, YU Hong-wei.  Influencing factors of dyeing depth on Castanopsis sclerophylla . Journal of Zhejiang A&F University, 2004, 21(1): 6-9.
  • [1]
    LIU Binglian, ZHU Junfeng. Development of the People’s Republic of China in the past 70 years: process, problems and prospects [J]. Research on Economics and Management, 2019, 40(11): 3 − 14.
    [2]
    SHANG Zhendong. Study on Municipal Administrative Areas’ Planning of Green Spaces’ System [D]. Beijing: Beijing Forestry University, 2006.
    [3]
    YIN Baihui. On urban green space system planning from the perspective of urban-rural integration [J]. Chinese Landscape Architecture, 2013, 29(11): 76 − 79.
    [4]
    MAHENG D, PATHIRANA A, ZEVENBERGEN C. A preliminary study on the impact of landscape pattern changes due to urbanization: case study of Jakarta, Indonesia [J/OL]. Land, 2021, 10(2): 218[2022-04-28]. doi: 10.3390/land10020218.
    [5]
    QIGELHEN, HE Bingyu, HUANG Ling. Dynamic change of urban greenbelt landscape pattern based on GIS and Fragstats: a case study of Urumqi, Xinjiang [J]. Journal of Anhui Agricultural Sciences, 2019, 47(15): 72 − 77, 88.
    [6]
    NOR A N M, AZIZ H A, NAWAWI S A, et al. Evolution of green space under rapid urban expansion in southeast Asian cities [J/OL]. Sustainability, 2021, 13(21): 12024[2022-05-01]. doi: 10.3390/su132112024.
    [7]
    DAI Fei, BI Shibo, CHEN Ming, et al. Research on green space system pattern evolution and its driving factors based on MSPA and confusion matrix: taking London as an example [J]. Chinese Landscape Architecture, 2020, 36(11): 34 − 39.
    [8]
    LIU Song, ZHANG Xinsu, FENG Yongjiu, et al. Spatiotemporal dynamics of urban green space influenced by rapid urbanization and land use policies in Shanghai [J/OL]. Forests, 2021, 12(4): 476[2022-05-01]. doi: 10.3390/f12040476.
    [9]
    ZHAO Haixia, WANG Shufen, MENG Fei, et al. Green space pattern changes and its driving mechanism: a case study of Nanjing metropolitan area [J]. Acta Ecologica Sinica, 2020, 40(21): 7861 − 7872.
    [10]
    GU Yuqing. Investigation of green space and development mode of ecological land in Nanjing [J]. Journal of Anhui Agricultural Sciences, 2013, 41(27): 11082 − 11083.
    [11]
    HU Yong, ZHAO Yuan. Analysis on the pattern of urban green land features in Nanjing [J]. Chinese Landscape Architecture, 2004, 20(11): 37 − 39.
    [12]
    ZONG Lianggang, LIU Cunli, DONG Yawen. Analysis of landscape spatial evolvement and its driving forces in Nanjing [J]. Journal of Nanjing Agricultural University, 2006, 29(3): 49 − 53.
    [13]
    XU Hao, LI Huanxin, LIU Wei. Evolution of regional green space in Nanjing metropolitan area in the past 15 years [J]. Journal of Northwest Forestry University, 2021, 36(5): 215 − 222.
    [14]
    LIU Wei, XU Hao, ZHANG Xiaotong, et al. Green infrastructure network identification at a regional scale: the case of Nanjing metropolitan area, China [J/OL]. Forests, 2022, 13(5): 735[2022-05-01]. doi: 10.3390/f13050735.
    [15]
    SHAO Dawei, WU Dianming. Landscape pattern evolvement of green space: a case study of the central area of Nanjing [J]. Chinese Landscape Architecture, 2016, 32(2): 103 − 107.
    [16]
    SHI Yunfeng. Driving Mechanisms of Differentiated Urban Growth Rates in the Urban Fringe Area of Nanjing [D]. Nanjing: Nanjing University, 2013.
    [17]
    LI Fazhi, ZHU Gaoli, JI Chao, et al. Analysis on the trend and driving mechanism of urban growth based on impervious surface index: taking Nanjing City for example [J]. Resources and Environment in the Yangtze Basin, 2021, 30(3): 575 − 590.
    [18]
    LI Fangzheng, XIE Shuang, LI Xiong. Evolutionary driving mechanism of green space in central Beijing City based on the PLSR model [J]. Journal of Beijing Forestry University, 2019, 41(4): 116 − 126.
    [19]
    WENG Huayan, GAO Yongchao, SU Xinyi, et al. Spatial-temporal changes and driving force analysis of green space in coastal cities of southeast China over the past 20 years [J/OL]. Land, 2021, 10(5): 537[2022-05-01]. doi: 10.3390/land10050537.
    [20]
    AGUILERA F, VALENZUELA L M, BOTEQUILHA-LEITAO A. Landscape metrics in the analysis of urban land use patterns: a case study in a Spanish metropolitan area [J]. Landscape and Urban Planning, 2011, 99(3/4): 226 − 238.
    [21]
    DADASHPOOR H, AZIZI P, MOGHADASI M. Land use change, urbanization, and change in landscape pattern in a metropolitan area [J]. Science of the Total Environment, 2019, 655: 707 − 719.
    [22]
    FU Fengjie, LIU Zhenhuan, HUANG Qiandu. Three-dimensional urban landscape pattern changes: a case study in the central business district of Futian, Shenzhen [J]. Acta Ecologica Sinica, 2019, 39(12): 4299 − 4308.
    [23]
    LIU Yu, LÜ Yihe, FU Bojie. Implication and limitation of landscape metrics in delineating relationship between landscape pattern and soil erosion [J]. Acta Ecologica Sinica, 2011, 31(1): 267 − 275.
    [24]
    MA Mingde, MA Xuejuan, XIE Yingzhong, et al. Analysis the relationship between ecological footprint (EF) of Ningxia and influencing factors: Partial Least Squares Regression (PLS) [J]. Acta Ecologica Sinica, 2014, 34(3): 682 − 689.
    [25]
    GAO Huixuan. Statistical analyses for multiple correlation variables of two sets (3) (Partial least-sguares Regression and PLS Procedure) [J]. Journal of Applied Statistics and Management, 2002, 21(2): 58 − 64.
    [26]
    Ministry of Natural Resources. Notice of the General Office of the Ministry of Natural Resources on Printing and Distributing theGuidelines for the Classification of Land and Sea Use for Land and Space Survey, Planning, and Use Control (Trial)’ (Natural Resources Office [2020] No. 51) [EB/OL]. 2020-11-17[2022-11-29]. http://www.gov.cn/zhengce/zhengceku/2020-11/22/content_5563311.htm.
    [27]
    YU Yang. Research on the Landscape Ecological Effects of Regional LUCC based on RS and GIS: A Case Study of Miyun in Beijing [D]. Harbin: Northeast Forestry University, 2014.
    [28]
    ZHAO Haixia, FAN Jinding, LUO Xinliao, et al. Changes of green infrastructure pattern and its driving factors: taking Nanjing as an example [J]. Acta Ecologica Sinica, 2022, 42(18): 7597 − 7611.
    [29]
    Jl Yiwen, ZHANG Lang, ZHANG Qingping, et al. Research on the formation and deep development of the concept of regional green space [J]. Chinese Journal of Environmental Management, 2021, 13(1): 88 − 95, 34.
  • 加载中
通讯作者: 陈斌, bchen63@163.com
  • 1. 

    沈阳化工大学材料科学与工程学院 沈阳 110142

  1. 本站搜索
  2. 百度学术搜索
  3. 万方数据库搜索
  4. CNKI搜索

Figures(5)  / Tables(6)

Article views(609) PDF downloads(81) Cited by()

Related
Proportional views

Spatio-temporal evolution of Nanjing’s urban green space pattern and its influencing factors

doi: 10.11833/j.issn.2095-0756.20220332

Abstract:   Objective  The urban green space is not only an important part of the regional ecological environment, but also an important bearing space for suburban recreation and a structural space that restricts the infinite spread of the city. Therefore, this study, with an investigation of the dynamic landscape changes of green space in Nanjing, a mega city in the Yangtze River Delta and its influencing factors, is aimed to help further optimize the spatial structure of green space and regional sustainable development. In Nanjing so as to promote the sustainable development of the Yangtze River Delta region.   Method  With the land cover data of Nanjing City in five time nodes in 2000, 2005, 2010, 2015 and 2020 selected, an analysis was conducted of the spatio-temporal evolution pattern of the green space in Nanjing City employing dynamic degree calculation and landscape pattern index. Then, the partial least squares regression equation (PLSR) model was adioted to explore the impact of socioeconomic factors and natural factors on the evolution of green space pattern.   Result  From 2000 to 2020, there was first a decrease and then an increase in the green space in Nanjing. From 2000 to 2005, the green space patches in Nanjing City tended to be integrated, with the fragmentation of green space landscapes easing up. After 2005, the scale of urban green space has increased, with an obvious fragmentation trend and a steady decrease in the overall landscape connectivity, The regression model showed that among the socioeconomic factors, the proportion of the industrial structure, the green area of the built-up area and the changes in the urban green space pattern had a greater correlation, and there were differences in the force of natural factors.   Conclusion  The overall scale of green space in Nanjing has increased with an obvious trend of pattern fragmentation and the socioeconomic factor being the direct influencing factor in the evolution of urban green space spatial pattern which is subject to the restriction of many natural factors. There is an urgent need to strengthen systematic planning for regional green spaces. [Ch, 5 fig. 6 tab. 29 ref.]

XU Hao, LI Wei, LIU Wei, WANG Chengkang. Spatio-temporal evolution of Nanjing’s urban green space pattern and its influencing factors[J]. Journal of Zhejiang A&F University, 2023, 40(2): 407-416. doi: 10.11833/j.issn.2095-0756.20220332
Citation: XU Hao, LI Wei, LIU Wei, WANG Chengkang. Spatio-temporal evolution of Nanjing’s urban green space pattern and its influencing factors[J]. Journal of Zhejiang A&F University, 2023, 40(2): 407-416. doi: 10.11833/j.issn.2095-0756.20220332
  • 中国城镇化进程以中国区域经济发展为主线,其本质是空间层面上要素的流动与资源的配置[1]。近年来,长江三角洲地区城镇化水平明显提高,城市人口急剧增长,客观上导致了城市空间无序扩张、土地利用混乱、生态空间啃食严重等问题的出现。在此背景下,认识城市化进程下绿地空间的动态演变规律,系统研究人类活动对绿地空间的作用,构建合理的绿地空间格局和数量结构,对城市可持续发展和健康人居环境建设具有重要意义。

    市域绿地指城市行政管辖范围内,以自然和人工植被为主要存在形态的城市用地,具有维护区域生态环境、提供郊野游憩空间、城镇隔离等重要作用。目前针对市域绿地的研究主要包括3个方面:①市域绿地的界定与规划编制问题探讨[23]。②市域绿地面积与空间结构演变分析。相关研究主要基于地理信息系统数据库以及遥感影像技术,运用土地动态度、景观格局指数、归纳演绎等方法,围绕典型区域展开实证研究[46]。③绿地演变影响机制研究。目前相关研究主要从定性和定量2个方面探究绿地面积和空间结构产生演变的影响因素[78]。研究多是围绕着南京绿色空间(包括林地、草地和耕地)的演变[910]展开,聚焦于南京市域绿地研究较少[1112],这不利于进一步构建生态安全格局;在研究尺度方面,近年来多聚焦于南京都市圈[1314]或是南京部分城区[15];针对南京市域绿地格局演变影响因素的研究较少,且多受数据限制,研究方法多以定性或简单回归为主[1617]

    2000—2020年,在城市化建设与生态环境建设叠加作用的背景下,南京市域绿地的演变具有复杂性,探究市域绿地面积演变及其影响因素,有利于进一步协调城市经济发展与可持续发展之间的关系。鉴于此,本研究将基于南京市2000—2020年共5期的绿地地理信息数据,分析其动态格局演变过程,探寻演变影响因子及作用机制,以期为南京市域绿地优化与区域可持续发展提供依据与支持,也为其他经济发达地区市域绿地空间构建与管理提供借鉴。

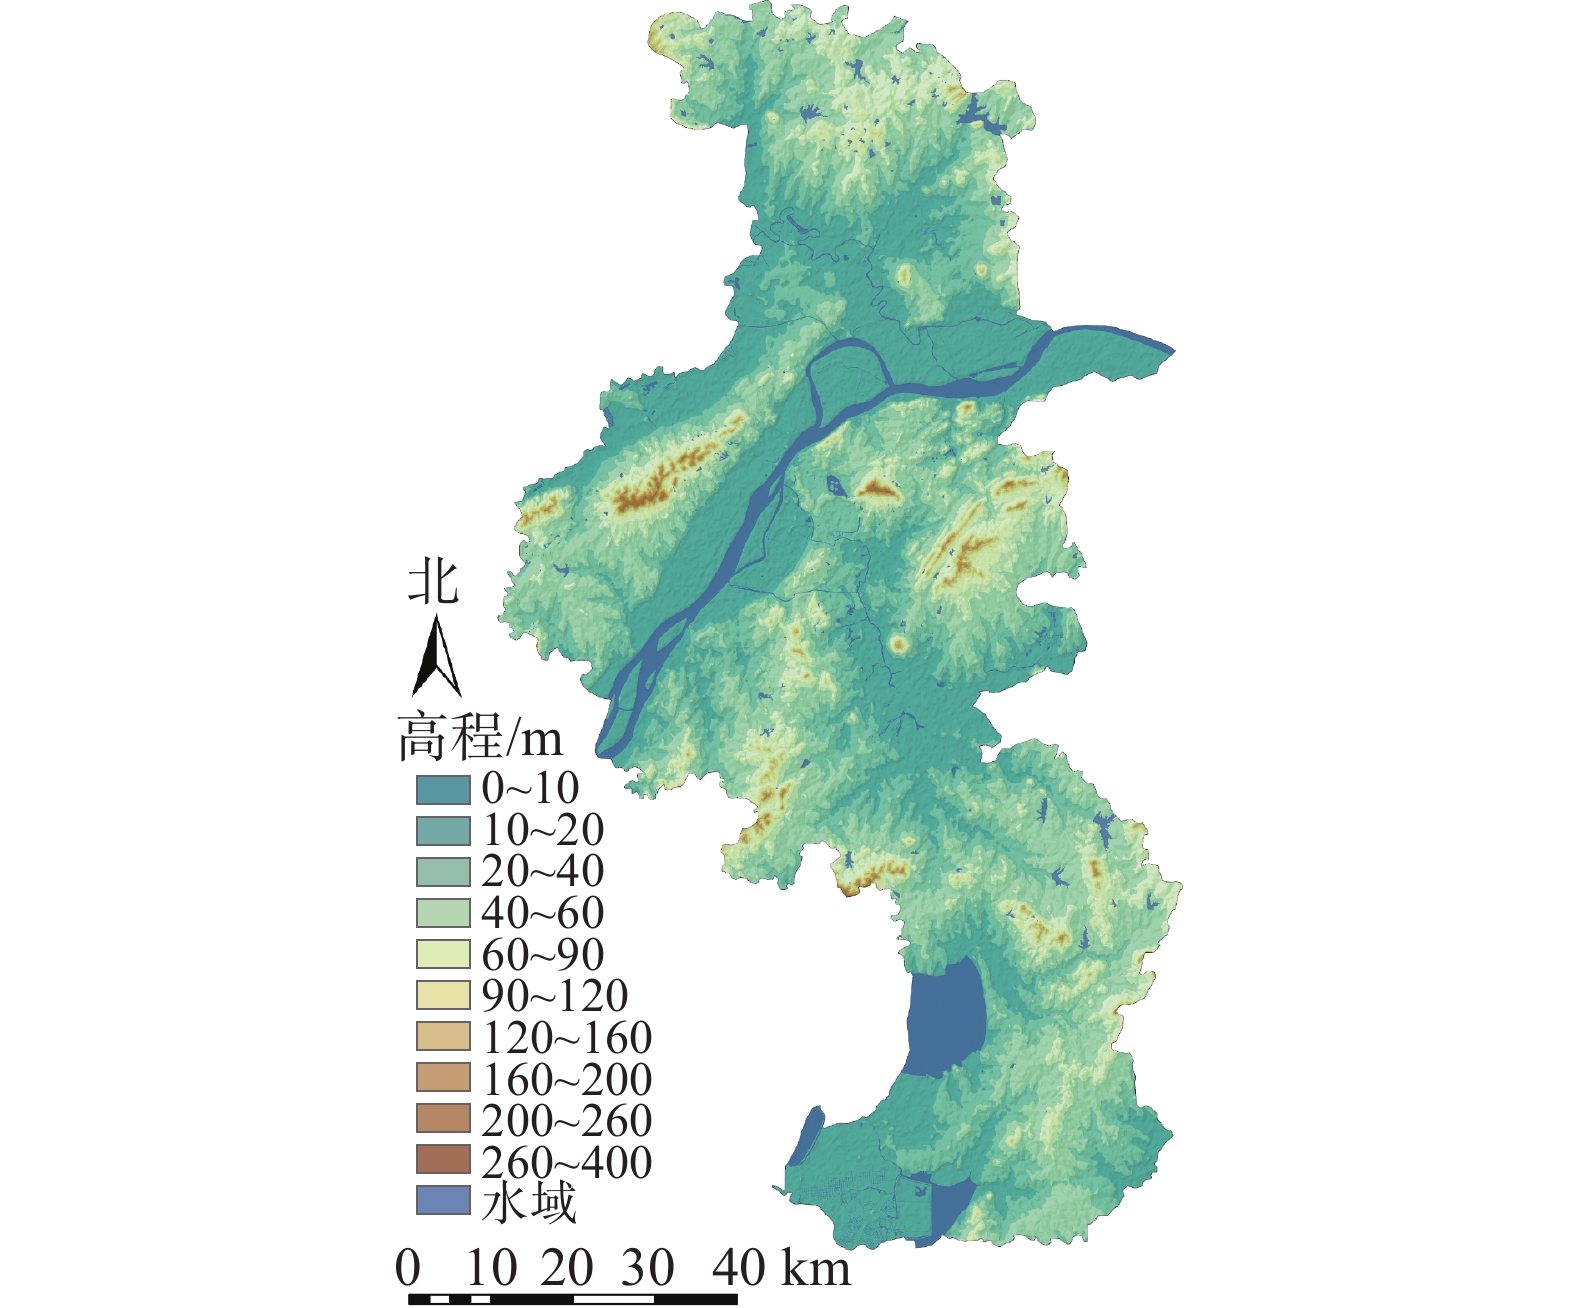
    • 南京市地处长江三角洲西端(31°14′~32°37′N,118°22′~119°14′E),市域总面积为6 586.02 km2。气候类型为北亚热带湿润气候,四季分明,雨水充沛。位于宁镇扬丘陵地区,低山缓岗(图1)。栖霞山、牛首山、幕府山、狮子山、清凉山、鸡笼山环峙城区。市域内江河湖泊遍布,长江穿城而过,主要河流有秦淮河、滁河等,玄武湖、石臼湖、金牛湖等湖泊星罗棋布,造就以山、水、城、林为大格局的奇致景观。

      Figure 1.  Elevation distribution map of Nanjing City

    • 本研究所用遥感影像数据来源自美国地质勘探局[USGS,
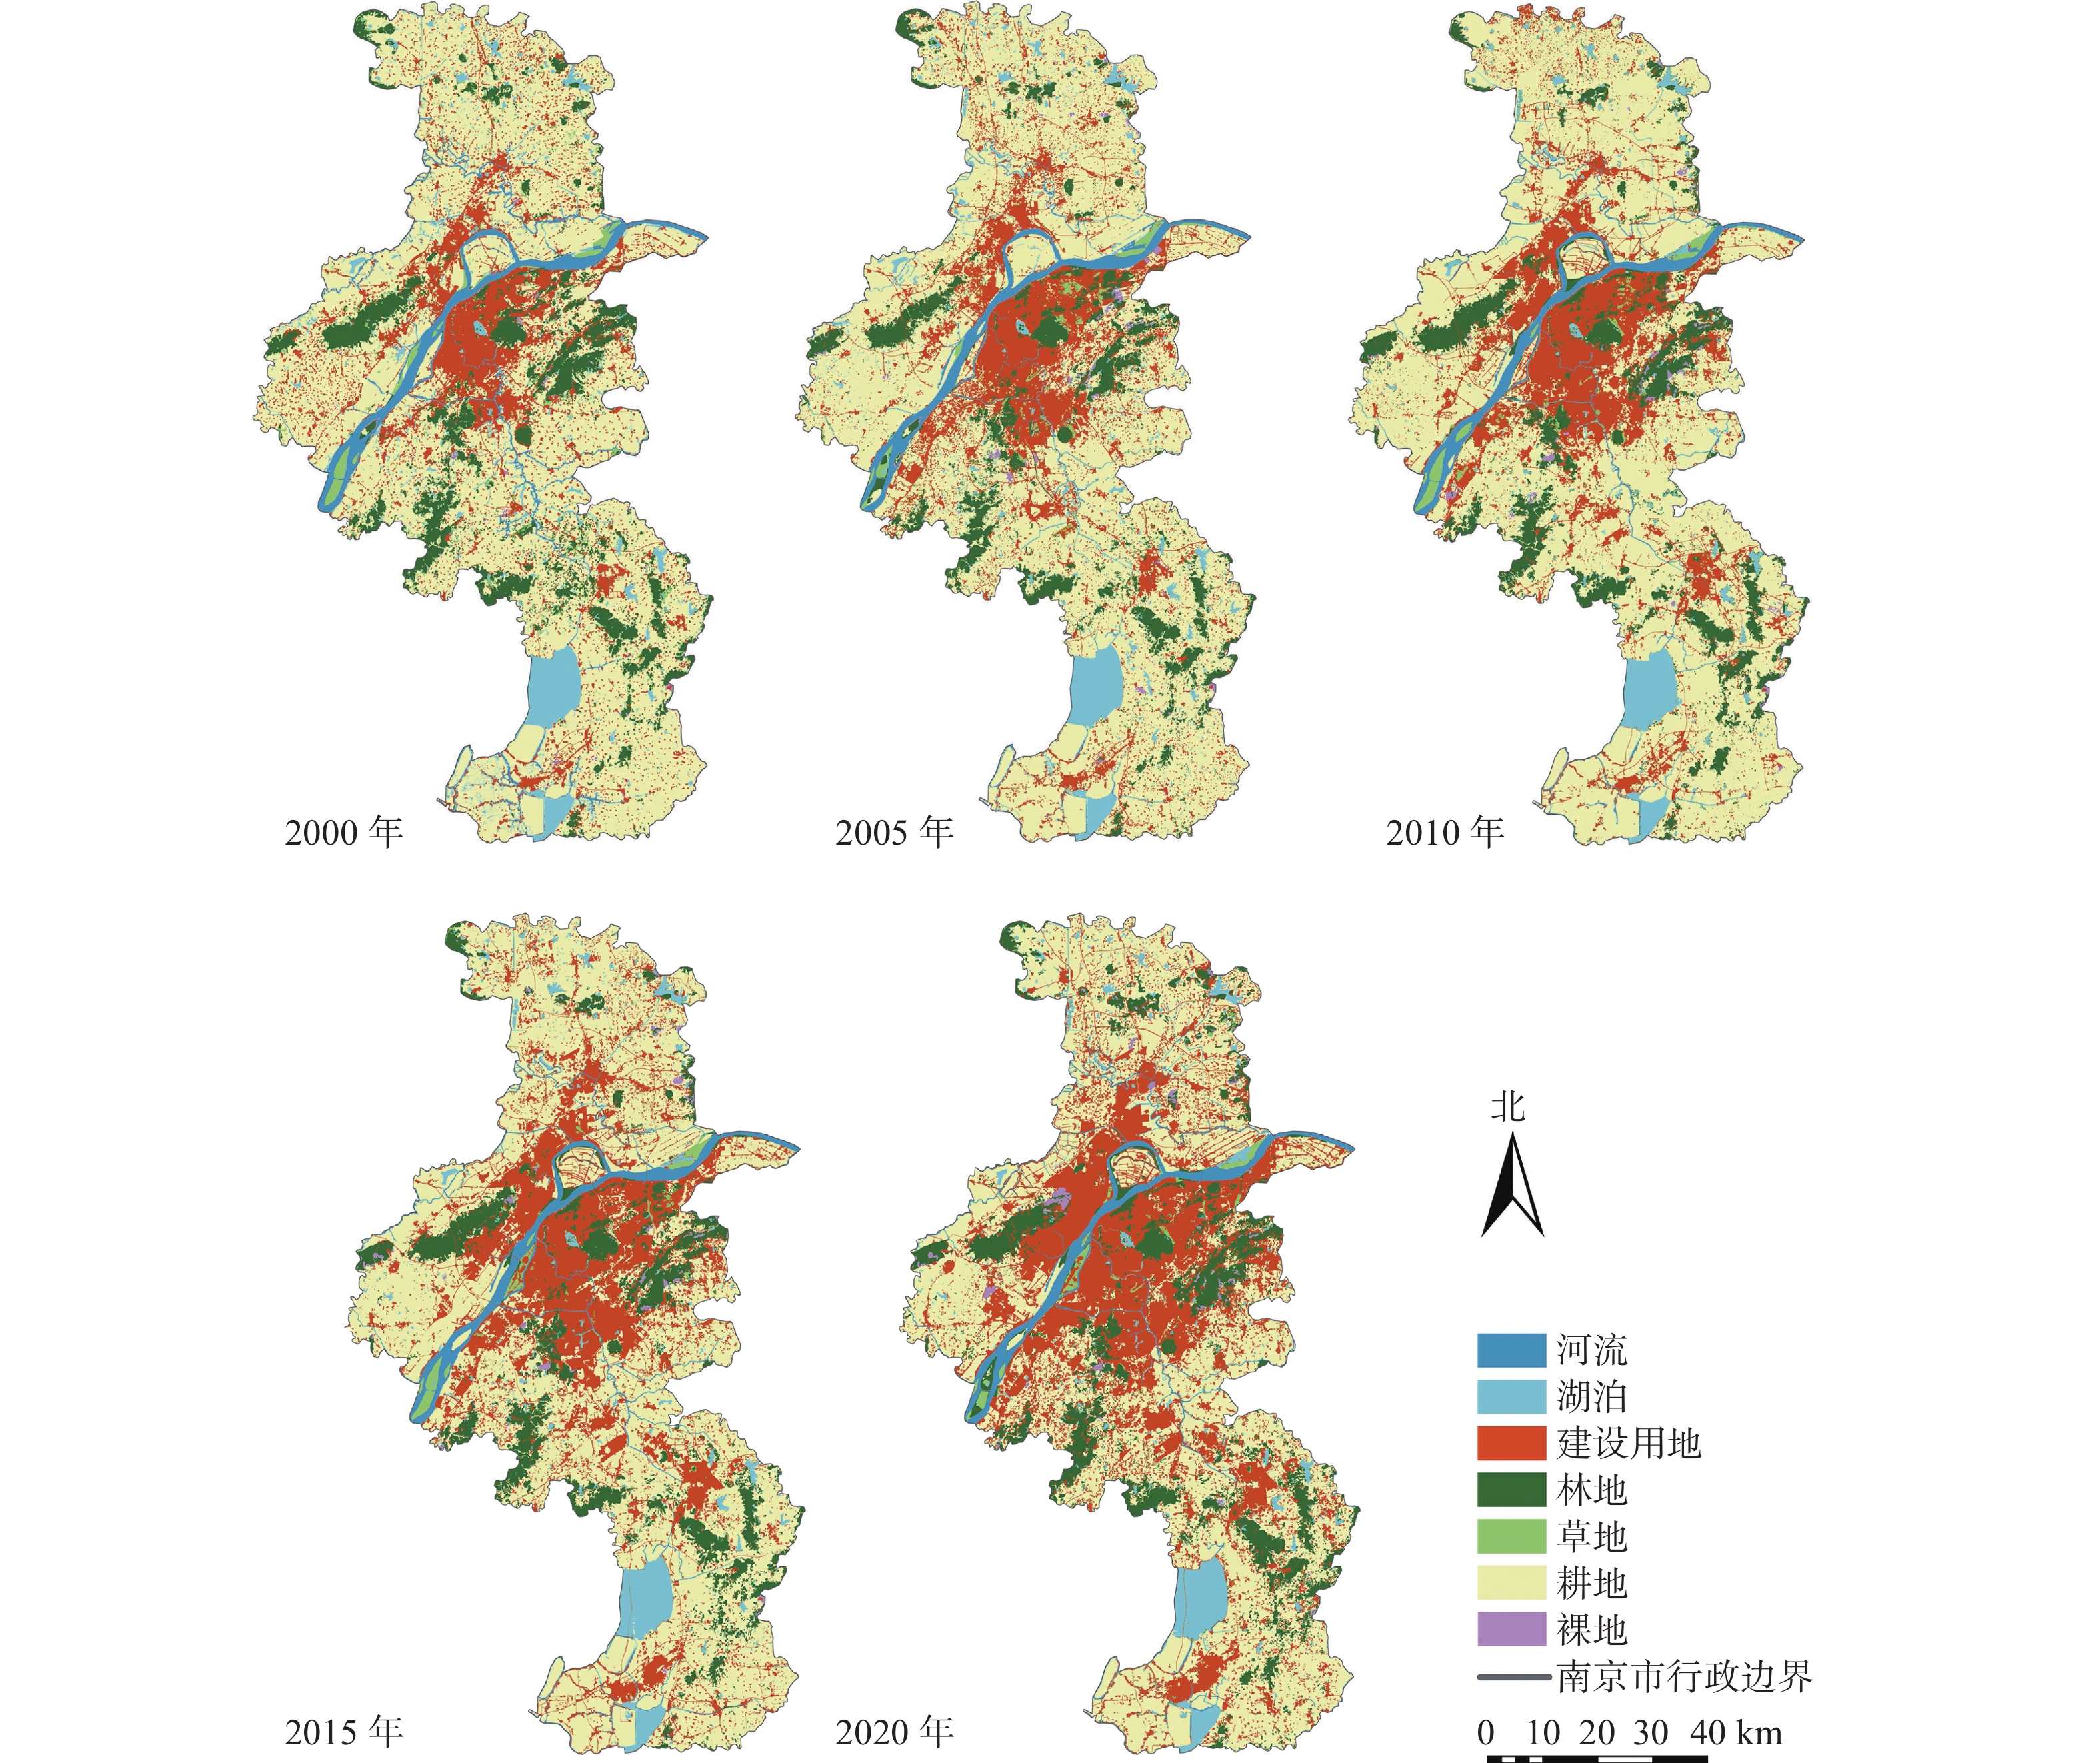
https://earthexplorer.usgs.gov/ (Earth Explorer)],采用2000、2005、2010、2015、2020年5个时间节点的Landsat TM/OIL遥感影像,影像分辨率为30 m×30 m,云量皆小于5%。使用中国科学院资源环境科学数据中心(https://www.resdc.cn/)提供的2015年中国地市行政边界数据对遥感影像进行裁剪。对通过ENVI 5.3预处理后的数据进行目视解译,参照国际地圈生物圈计划(IGBP)的土地利用及覆盖变化(LUCC)分类系统,结合南京实际和研究目的,将土地利用类型分为河流、湖泊、建设用地、林地、草地、耕地和裸地7类(图2),最终通过总体分类精度以及混淆矩阵对分类准确度验证(表1)。

      Figure 2.  Land use classification map in Nanjing from 2000 to 2020

      年份总体分类精度/%Kappa系数
      200093.30.88
      200593.30.89
      201092.00.85
      201589.00.83
      202091.30.87

      Table 1.  Accuracy verification statistics of Nanjing land use classification map from 2000 to 2020

      将南京市域绿地演变的影响因子分为自然因素和社会经济要素两大类。首先,对自然因素的考虑缘于其在大尺度空间上和较长时间范围内对绿地格局变化的影响。其次,政府在城市化进程当中会通过改变用地性质来指引社会未来发展方向,故社会经济因素的变化会在较小尺度空间上和短时间范围内引起绿地格局的变化[18]。影响机制研究中涉及的数据主要来源于相应年份的《江苏省统计年鉴》和《南京市统计年鉴》。此外,年份久远的个别缺失数据根据当年各区县统计数据进行计算补充。考虑到数据的可获取性以及可定量化,具体影响因子选取如表2所示。

      分类编号影响因子单位
      自然因素   1 年降水量 mm
      2 年平均气温
      3 全年日照时长 h
      4 总水资源量 亿m3
      社会经济要素 5 地区生产总值 亿元
      6 人均国内生产总值(GDP) 万元·人−1
      7 第一产业产值比例 %
      8 第二产业产值比例 %
      9 第三产业产值比例 %
      10 农林牧渔业总产值 亿元
      11 建成区绿化面积 hm2
      12 常住人口数量 万人
        说明:自然因素数据来源于《南京市统计年鉴(2001—2021)》《江苏省统计年鉴(2001—2021)》,社会经济要素数据来源于《江苏省统计年鉴(2001)》《南京市统计年鉴(2006—2021)》

      Table 2.  Influencing factors on the evolution of Nanjing’s urban green space

    • 使用动态度表达研究范围内某种类型的绿地数量在一定时间段内的变化速率。其计算公式为:

      其中:IR表示研究区在该时间段内单一绿地类型的变化速率,即动态度;Sa为该类绿地在研究时间段起点的面积;Sb为该类绿地在研究时间段终点的面积;T为时间间隔年份。

      综合土地动态度反映研究区内绿地总数量在一定时段内的变化速率。其计算公式为:

      其中:R表示研究区在该时间段内所有绿地类型的变化速率即绿地综合动态度;j为某种绿地类型,Si为研究起始时间第i类绿地的面积;$ \Delta S_{i-j}$为研究时段内第i类绿地转化为第j类绿地的面积绝对值;T为时间间隔年份。

    • 景观格局指数是能够高度浓缩景观格局信息,反映其结构组成和空间配置某些方面特征的简单定量指标,景观格局指数分析方法能够揭示市域绿地格局的时空演变特征[1922]。为了全面系统地对南京市域绿地景观格局结构、特点、动态进行描述,采用斑块数量(NP)、边缘密度(ED)、景观形状指数(LSI)、连接度指数(CONHESION)以及香农多样性指标(SHDI)表明绿地景观格局的水平。基于Fragstats 4.2软件计算各个景观指数,计算方法见参考文献[23]。

    • PLSR作为一种多元统计回归模型,具有广泛适用性,近年来被大量运用到土地覆被变化的影响机制研究当中[18, 24]。PLSR模型具有以下优点:首先,它可以同时实现主成分分析、相关分析和线性回归分析;其次,它能够排除自变量或因变量指标之间的多重共线性问题,同时适用于样本容量较小的情况。

      在PLSR模型中,交叉有效性(Q2)表示模型的预测能力,当Q2>0.097时,模型具有较强的预测能力。解释能力($R_{\rm{Y}}^2 $)表示模型的稳健性,当$R_{\rm{Y}}^2 $>0.5时,模型具有较好的稳健性。变量投影重要性(VIP)表示各个解释变量的相对重要性,当VIP<0.5时,变量对于绿地格局演变不重要;当0.5<VIP<1.0时,变量对绿地格局演变比较重要;当VIP>1.0时,变量对绿地格局演变具有较为明显的解释能力,VIP越大,自变量对因变量的解释性越强[25]。回归系数(RC)表示各解释变量与绿地格局演变的正负相关性,当RC>0时,变量与绿地格局演变呈正相关;当RC<0时,变量与绿地格局演变呈负相关。使用SIMCA-P软件进行回归模型的构建以及绿地演变影响机制研究。

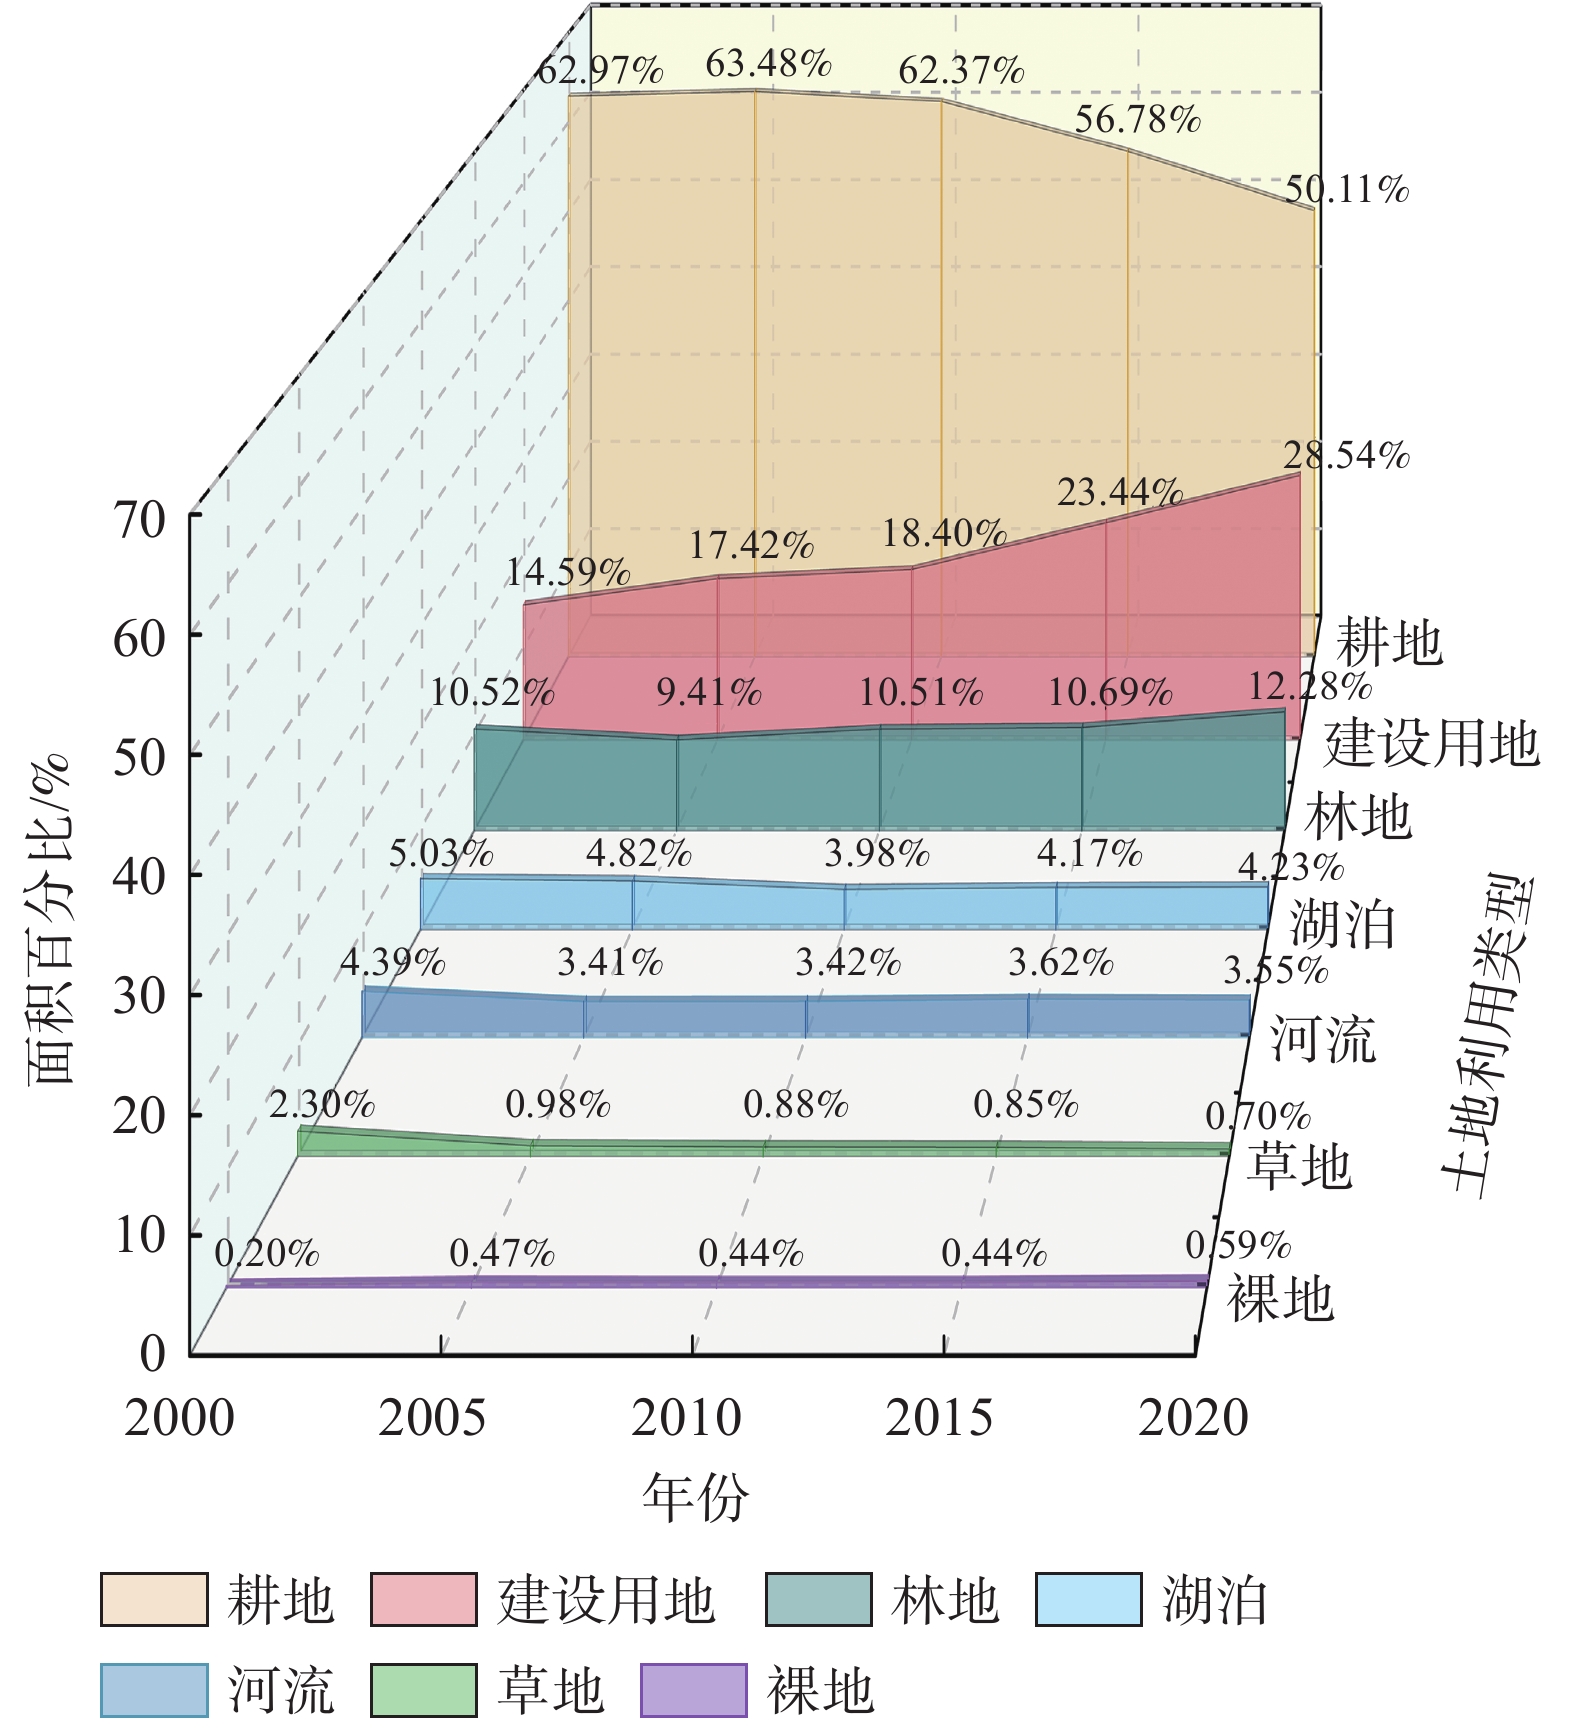
    • 南京市土地利用类型总体上呈现以耕地、建设用地为主,河流、湖泊、林地、草地及裸地为辅的格局。2000—2020年,研究区域内水域及裸地变化较小,建设用地占比持续大幅度增加,耕地面积不断缩减转移,市域绿地面积变化起伏较为明显(图3)。

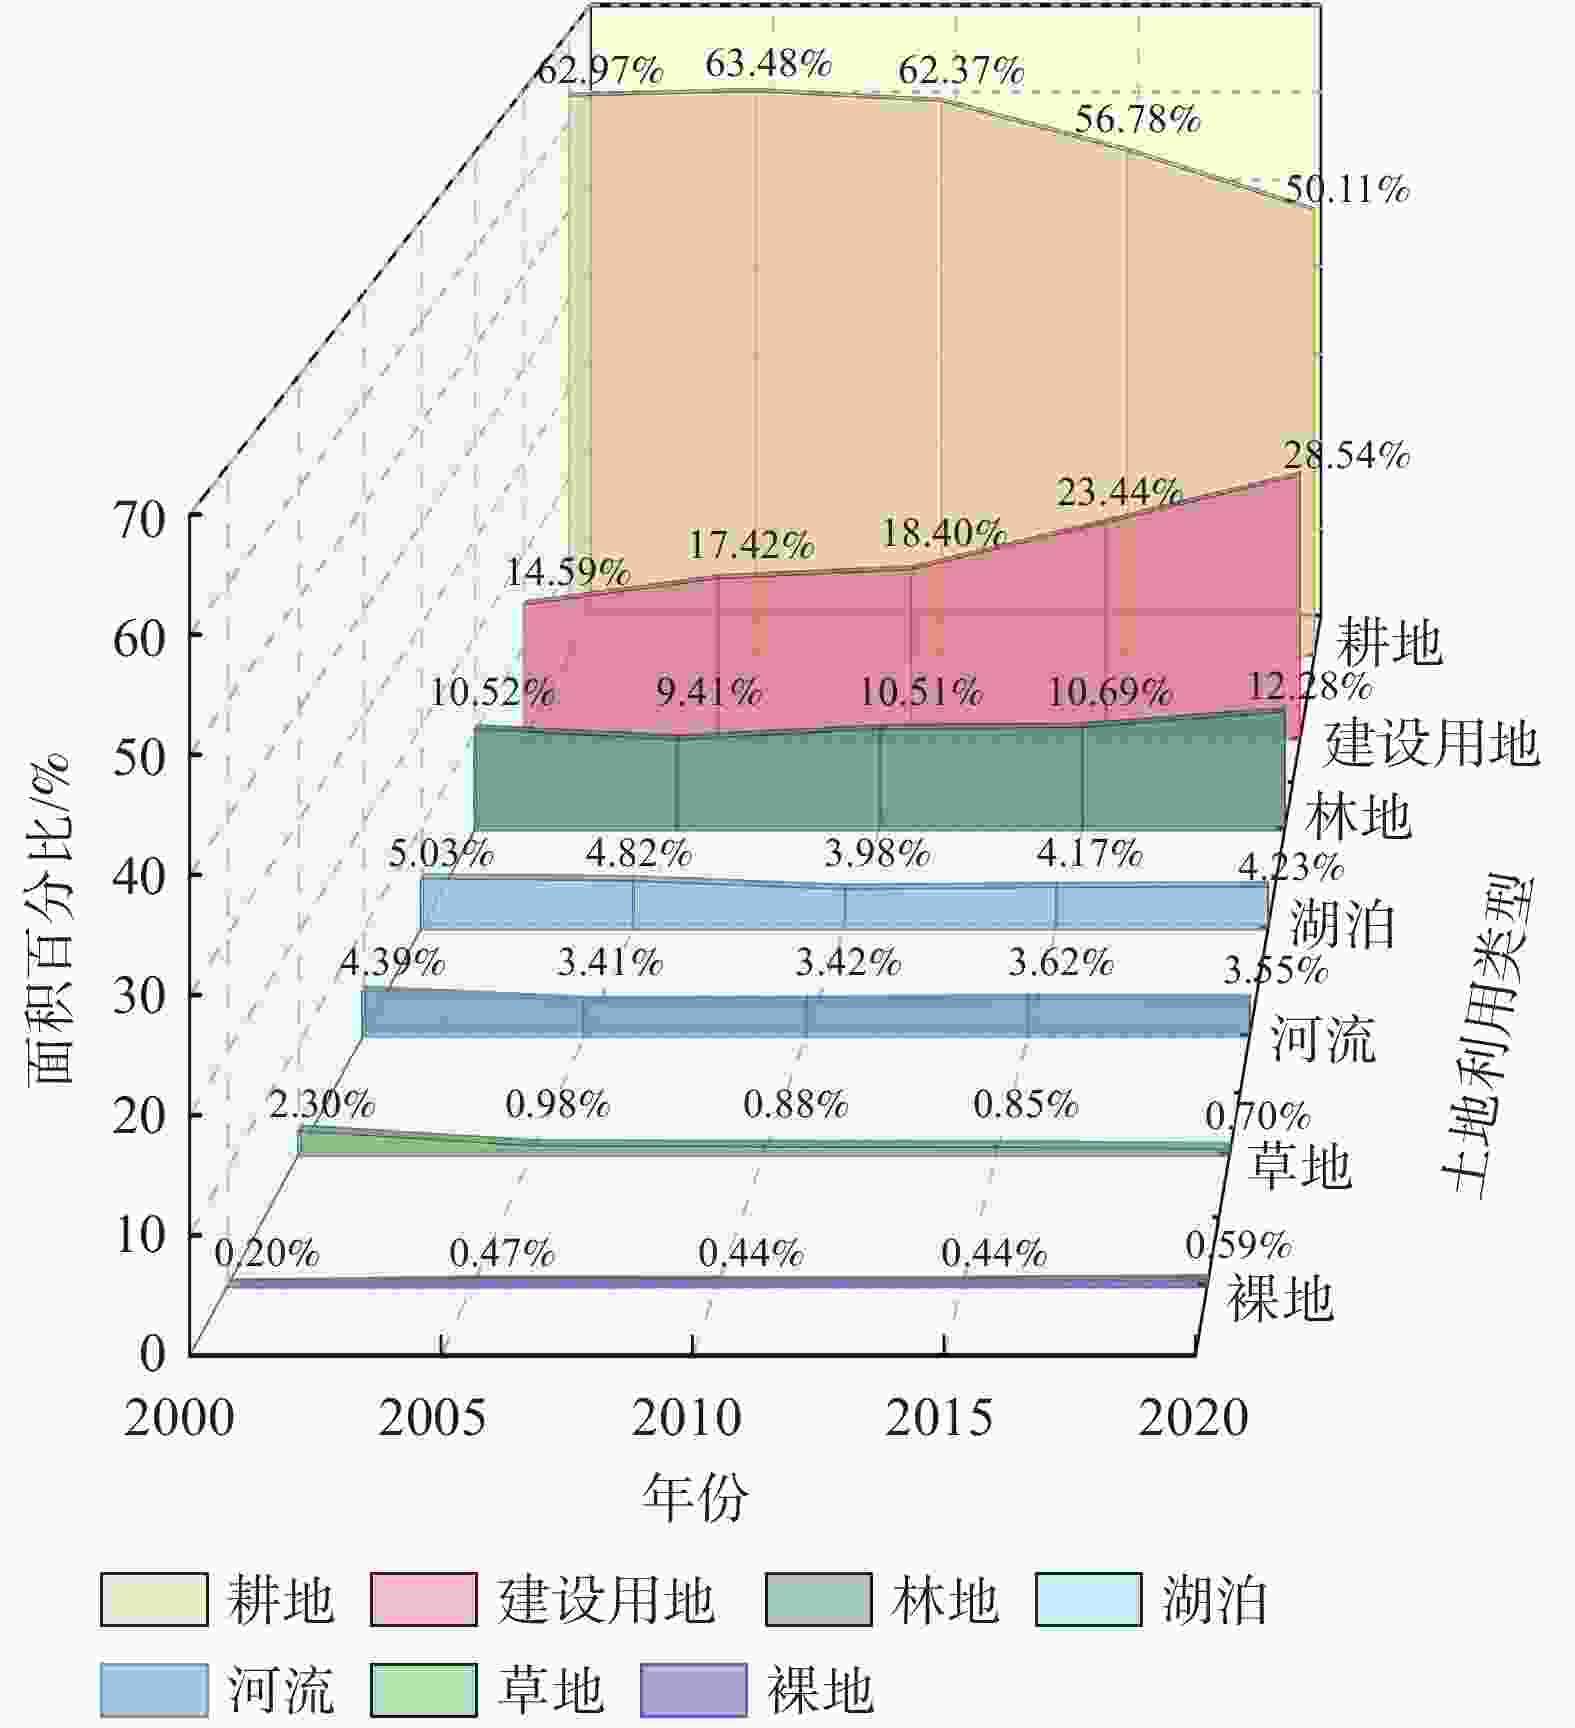
      Figure 3.  Comparison of land use area changes in Nanjing City area from 2000 to 2020

      2000—2020年,南京市域绿地面积总体呈先减后增的状态。其中,作为市域绿地组成部分的林地与草地在面积上呈现出的变化趋势具有一定的差异性(表3)。2000—2005年,林地和草地的面积均呈减少状态,分别减少了72.47和86.77 km2,两者的变化动态度分别为−2.10%·a−1和−11.46%·a−1,最终市域绿地面积整体减少了159.24 km2,整体面积的变化动态度为−3.78%·a−1。2005年之后,林地面积一直呈现正增长的状态,但与持续下降的草地面积进行综合计算后发现:研究期间市域绿地面积仅增加了11.96 km2,变化动态度为0.07%·a−1

      土地类型2000—2005年2005—2010年2010—2015年2015—2020年2000—2020年
      变化量/
      km2
      动态度/
      (%·a−1)
      变化量/
      km2
      动态度/
      (%·a−1)
      变化量/
      km2
      动态度/
      (%·a−1)
      变化量/
      km2
      动态度/
      (%·a−1)
      变化量/
      km2
      动态度/
      (%·a−1)
      林地  −72.47−2.1072.782.3512.100.35104.732.97117.140.85
      草地  −86.77−11.46−6.94−2.15−1.48−0.51−9.99−3.55−105.18−3.47
      市域绿地−159.24−3.7862.841.9310.620.2894.742.4911.960.07
        说明:正值表示该类用地面积呈正向增长;负值表示该类用地面积呈负向减少

      Table 3.  Changes of green space scale in Nanjing during different periods

    • 根据斑块数量指数可知:在2000—2020年南京市域绿地斑块趋于破碎化。结合边缘密度指数和景观形状指数的变化可以看出:绿地景观形状复杂度逐步升高。在景观系统中,土地利用越丰富,破碎化程度越高,其不定性的信息含量也越大,香农多样性指数也就越高。2000—2005年香农多样性指数明显下降,说明这5 a间,市域绿地各斑块类型减少且并呈不均衡化趋势分布,绿地破碎化有一定的缓和。2005—2020年,香农多样性指数稳步上升,说明后期南京市域内部土地利用类型更加丰富,景观破碎度也随之升高。另外,2000—2005年,连接度指数稍有提高,但2005年之后,由于景观破碎度升高,其连接度也持续降低(表4)。

      年份斑块数
      量/个
      边缘密度/
      (m·hm−2)
      景观形
      状指数
      连接度
      指数
      香农多样
      性指数
      20002 1309.01221.52599.9870.385
      20052 9938.45619.98499.9870.334
      20106 6359.61822.29899.9860.355
      20155 3939.16021.36999.9860.358
      20207 69011.64226.40599.9860.386

      Table 4.  Pattern index statistics of urban green space landscape

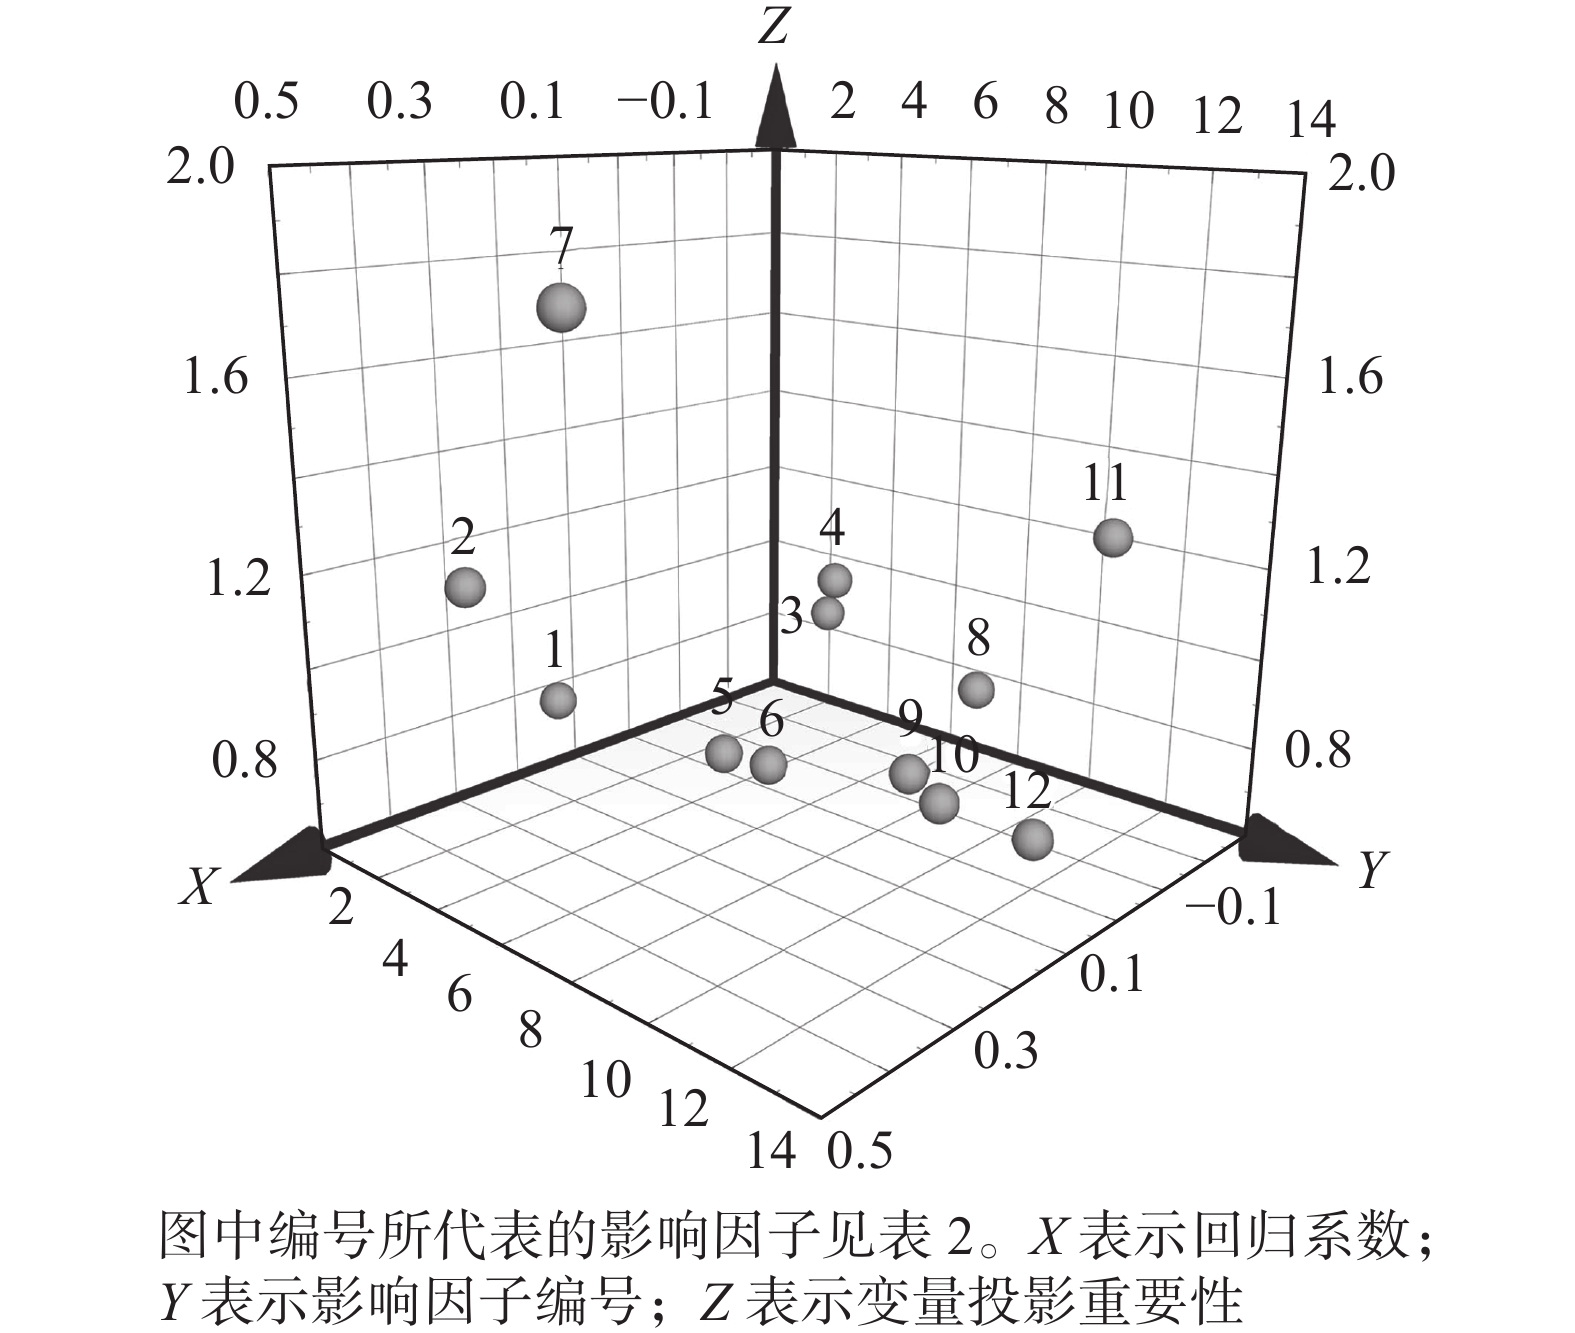
    • 以8项社会经济指标和4项自然影响因素为自变量,以南京市域绿地面积为因变量构建回归模型,对影响市域绿地规模演变的主要因素进行主成分提取。以Q2>0.097和$R_{\rm{Y}}^2 $>0.5作为PLSR模型主成分提取的终止条件,市域绿地的总体面积最终以$R_{\rm{Y}}^2 $=0.808和Q2=0.534在第2主成分处达到模型终止条件。南京市域绿地规模变化的重要解释变量如表5图4所示。

      影响因子变量投影重要性(VIP)回归系数(RC)
      年降水量 0.80 0.17
      年平均气温 1.16 0.35
      全年日照时长 0.89 −0.23
      总水资源量 1.02 −0.18
      地区生产总值 0.75 0.10
      人均GDP 0.74 0.08
      第一产业产值比例 1.79 0.44
      第二产业产值比例 0.83 −0.20
      第三产业产值比例 0.77 0.02
      农林牧渔业总产值 0.74 0.03
      建成区绿化面积 1.24 −0.23
      常住人口数量 0.71 0.003

      Table 5.  Results of partial least squares regression of urban green space scale and each influencing factor

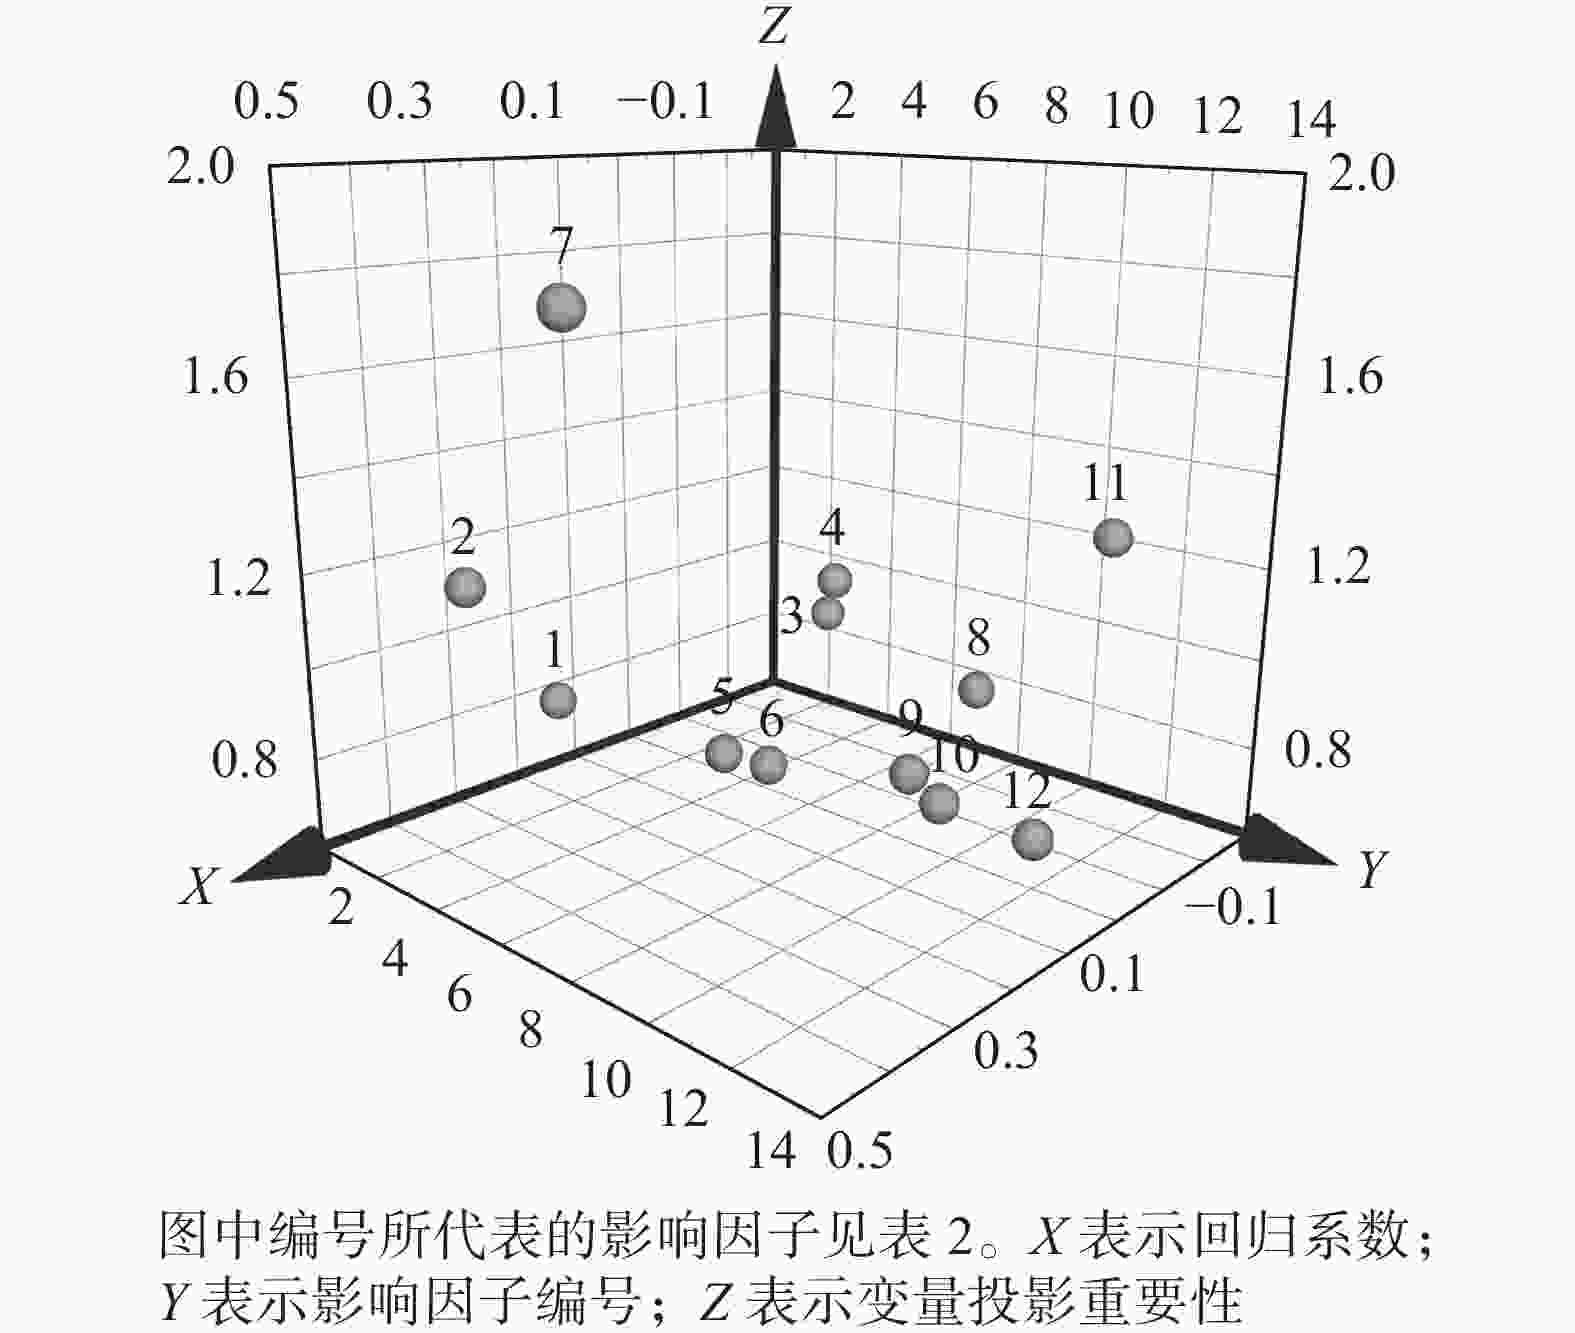
      Figure 4.  PLSR analysis of each influencing factor on the green space area of Nanjing

      通过市域绿地面积与各影响因素的PLSR结果分析可知:社会经济指标的变化与自然环境的演变在不同程度上影响着市域绿地面积的演变,其中主要因素(VIP>1)为年平均气温、总水资源量、第一产业产值比例以及建成区绿化面积。由回归系数可知:与市域绿地面积演变呈正相关(RC>0)的因素为年平均气温、年降水量、地区生产总值、人均GDP、第一产业产值比例、第三产业产值比例、农林牧渔业总产值以及常住人口数量。除此之外,其余因素均与市域绿地面积变化呈负相关。

      其中,第一产业产值比例为市域绿地面积演变最相关的因子,且为正相关,说明以种植业、林业等自然物为生产对象的第一产业规模与城市绿地规模密不可分。同时,这也体现出产业关系转变在城市绿地格局演变中的重要地位。另外,建成区绿化面积指标作为市域绿地面积演变的次相关因子,反而呈现负相关关系,说明相关城市规划政策的制定仍旧只聚焦于城市建成区内的绿地修复,而在城市扩张区域初始发展阶段并不注重绿化建设,体现出城市生态发展地域间的不平衡问题。除此之外,通过对自然条件相关性的评估可以看出,适宜的温度环境以及水资源环境对植物生长有长期性的影响,因此也是城市绿地发展的重要先决条件。

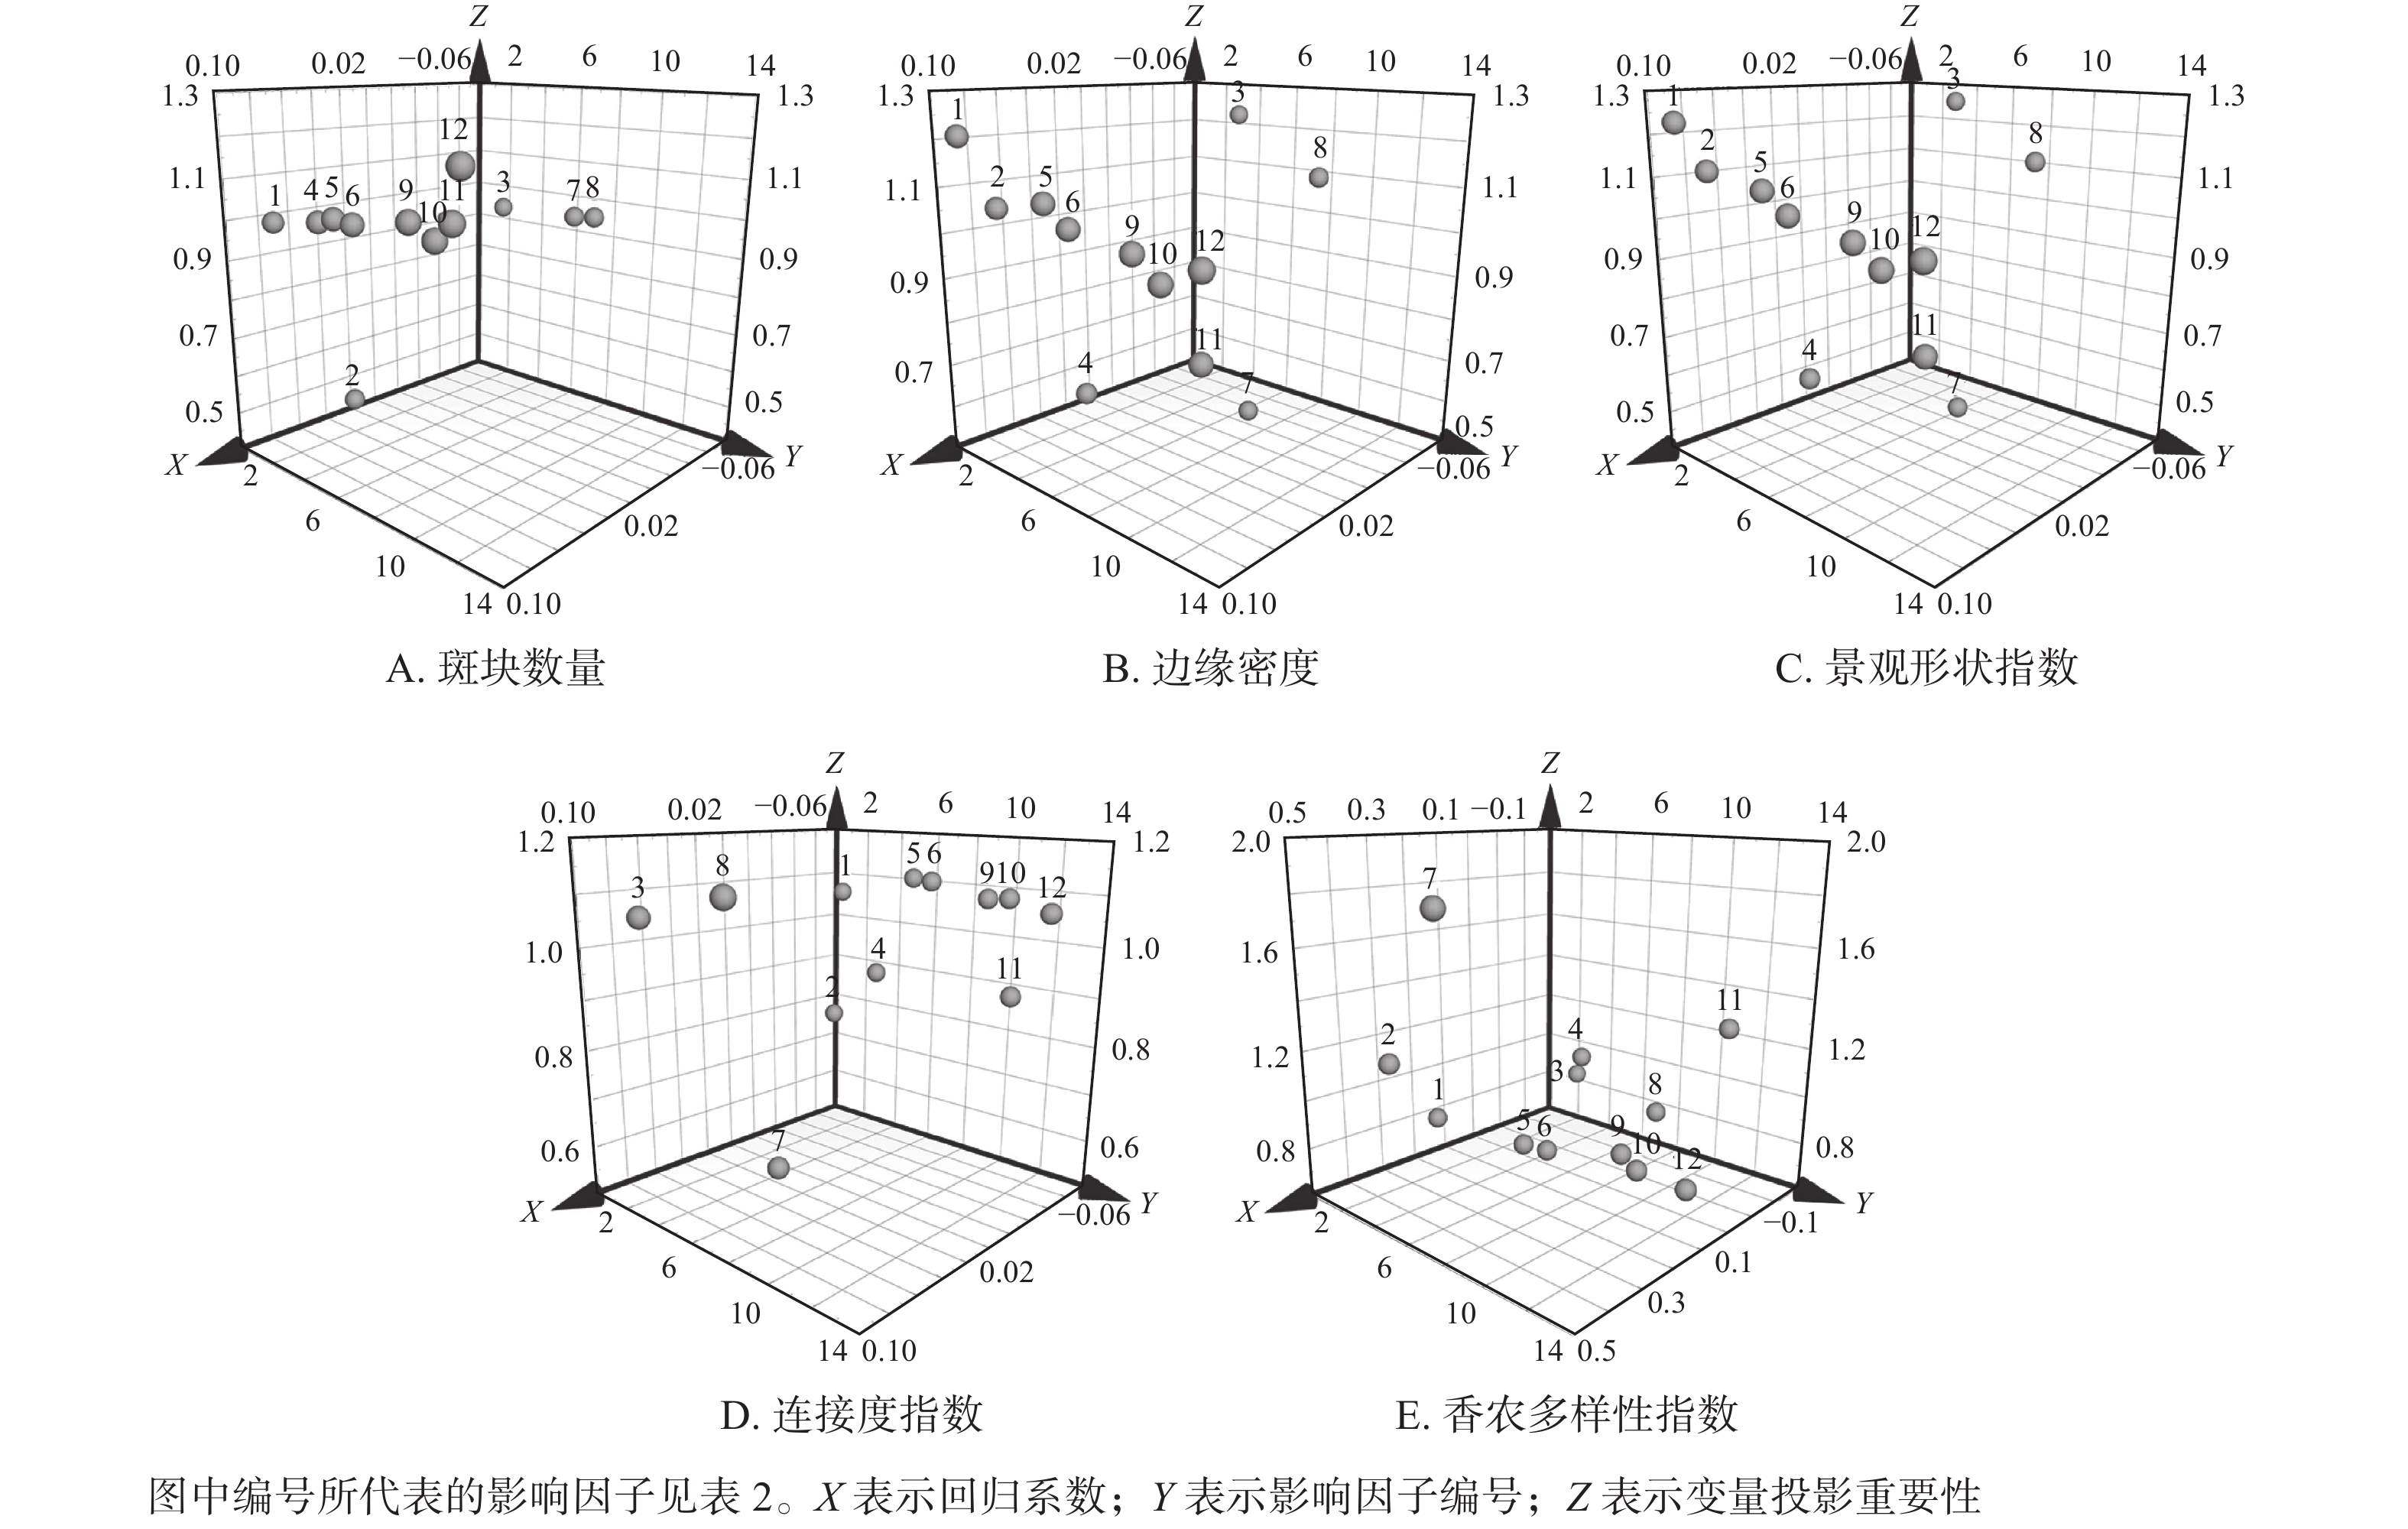
    • 将景观格局指数作为因变量,将社会经济指标以及自然影响因素作为自变量进行PLSR分析。以Q2>0.097和$R_{\rm{Y}}^2 $>0.5作为PLSR模型主成分提取的终止条件,南京市域绿地总体斑块数量、边缘密度、景观形状指数、连接度指数在第1主成分处已满足模型终止条件,$R_{\rm{Y}}^2 $分别为0.781、0.731、0.687、0.891,Q2分别为0.729、0.457、0.380、0.829;香农多样性指数以$R_{\rm{Y}}^2 $=0.796及Q2=0.525在第2主成分处达到了模型终止条件(表6图5)。

      影响因子斑块数量边缘密度景观形状指数连接度指数香农多样性指数
      VIPRCVIPRCVIPRCVIPRCVIPRC
      年降水量 0.99 0.08 1.21 0.10 1.23 0.09 1.06 −0.09 0.80 0.17
      年平均气温 0.49 0.04 1.06 0.08 1.12 0.09 0.79 −0.07 1.14 0.35
      全年日照时长 0.96 −0.08 1.22 −0.10 1.25 −0.10 1.07 0.09 0.88 −0.23
      总水资源量 1.02 0.08 0.64 0.05 0.59 0.05 0.89 −0.08 1.01 −0.18
      地区生产总值 1.04 0.08 1.09 0.09 1.10 0.08 1.10 −0.09 0.75 0.10
      人均GDP 1.03 0.08 1.05 0.08 1.05 0.08 1.10 −0.09 0.74 0.08
      第一产业产值比例 0.96 −0.08 0.53 −0.04 0.45 −0.03 0.61 0.05 1.80 0.45
      第二产业产值比例 0.97 −0.08 1.09 −0.09 1.11 −0.09 1.13 0.10 0.83 −0.20
      第三产业产值比例 1.07 0.09 1.03 0.08 1.01 0.08 1.08 −0.09 0.78 0.01
      农林牧渔业总产值 1.04 0.08 0.98 0.08 0.96 0.07 1.08 −0.09 0.75 0.03
      建成区绿化面积 1.08 0.09 0.82 0.06 0.78 0.06 0.89 −0.08 1.25 −0.23
      常住人口数量 1.20 0.10 1.03 0.08 1.01 0.08 1.06 −0.09 0.71 0.00
        说明:VIP为变量投影重要性;RC为回归系数

      Table 6.  Results of partial least squares regression of urban green space landscape pattern index with each influencing factor

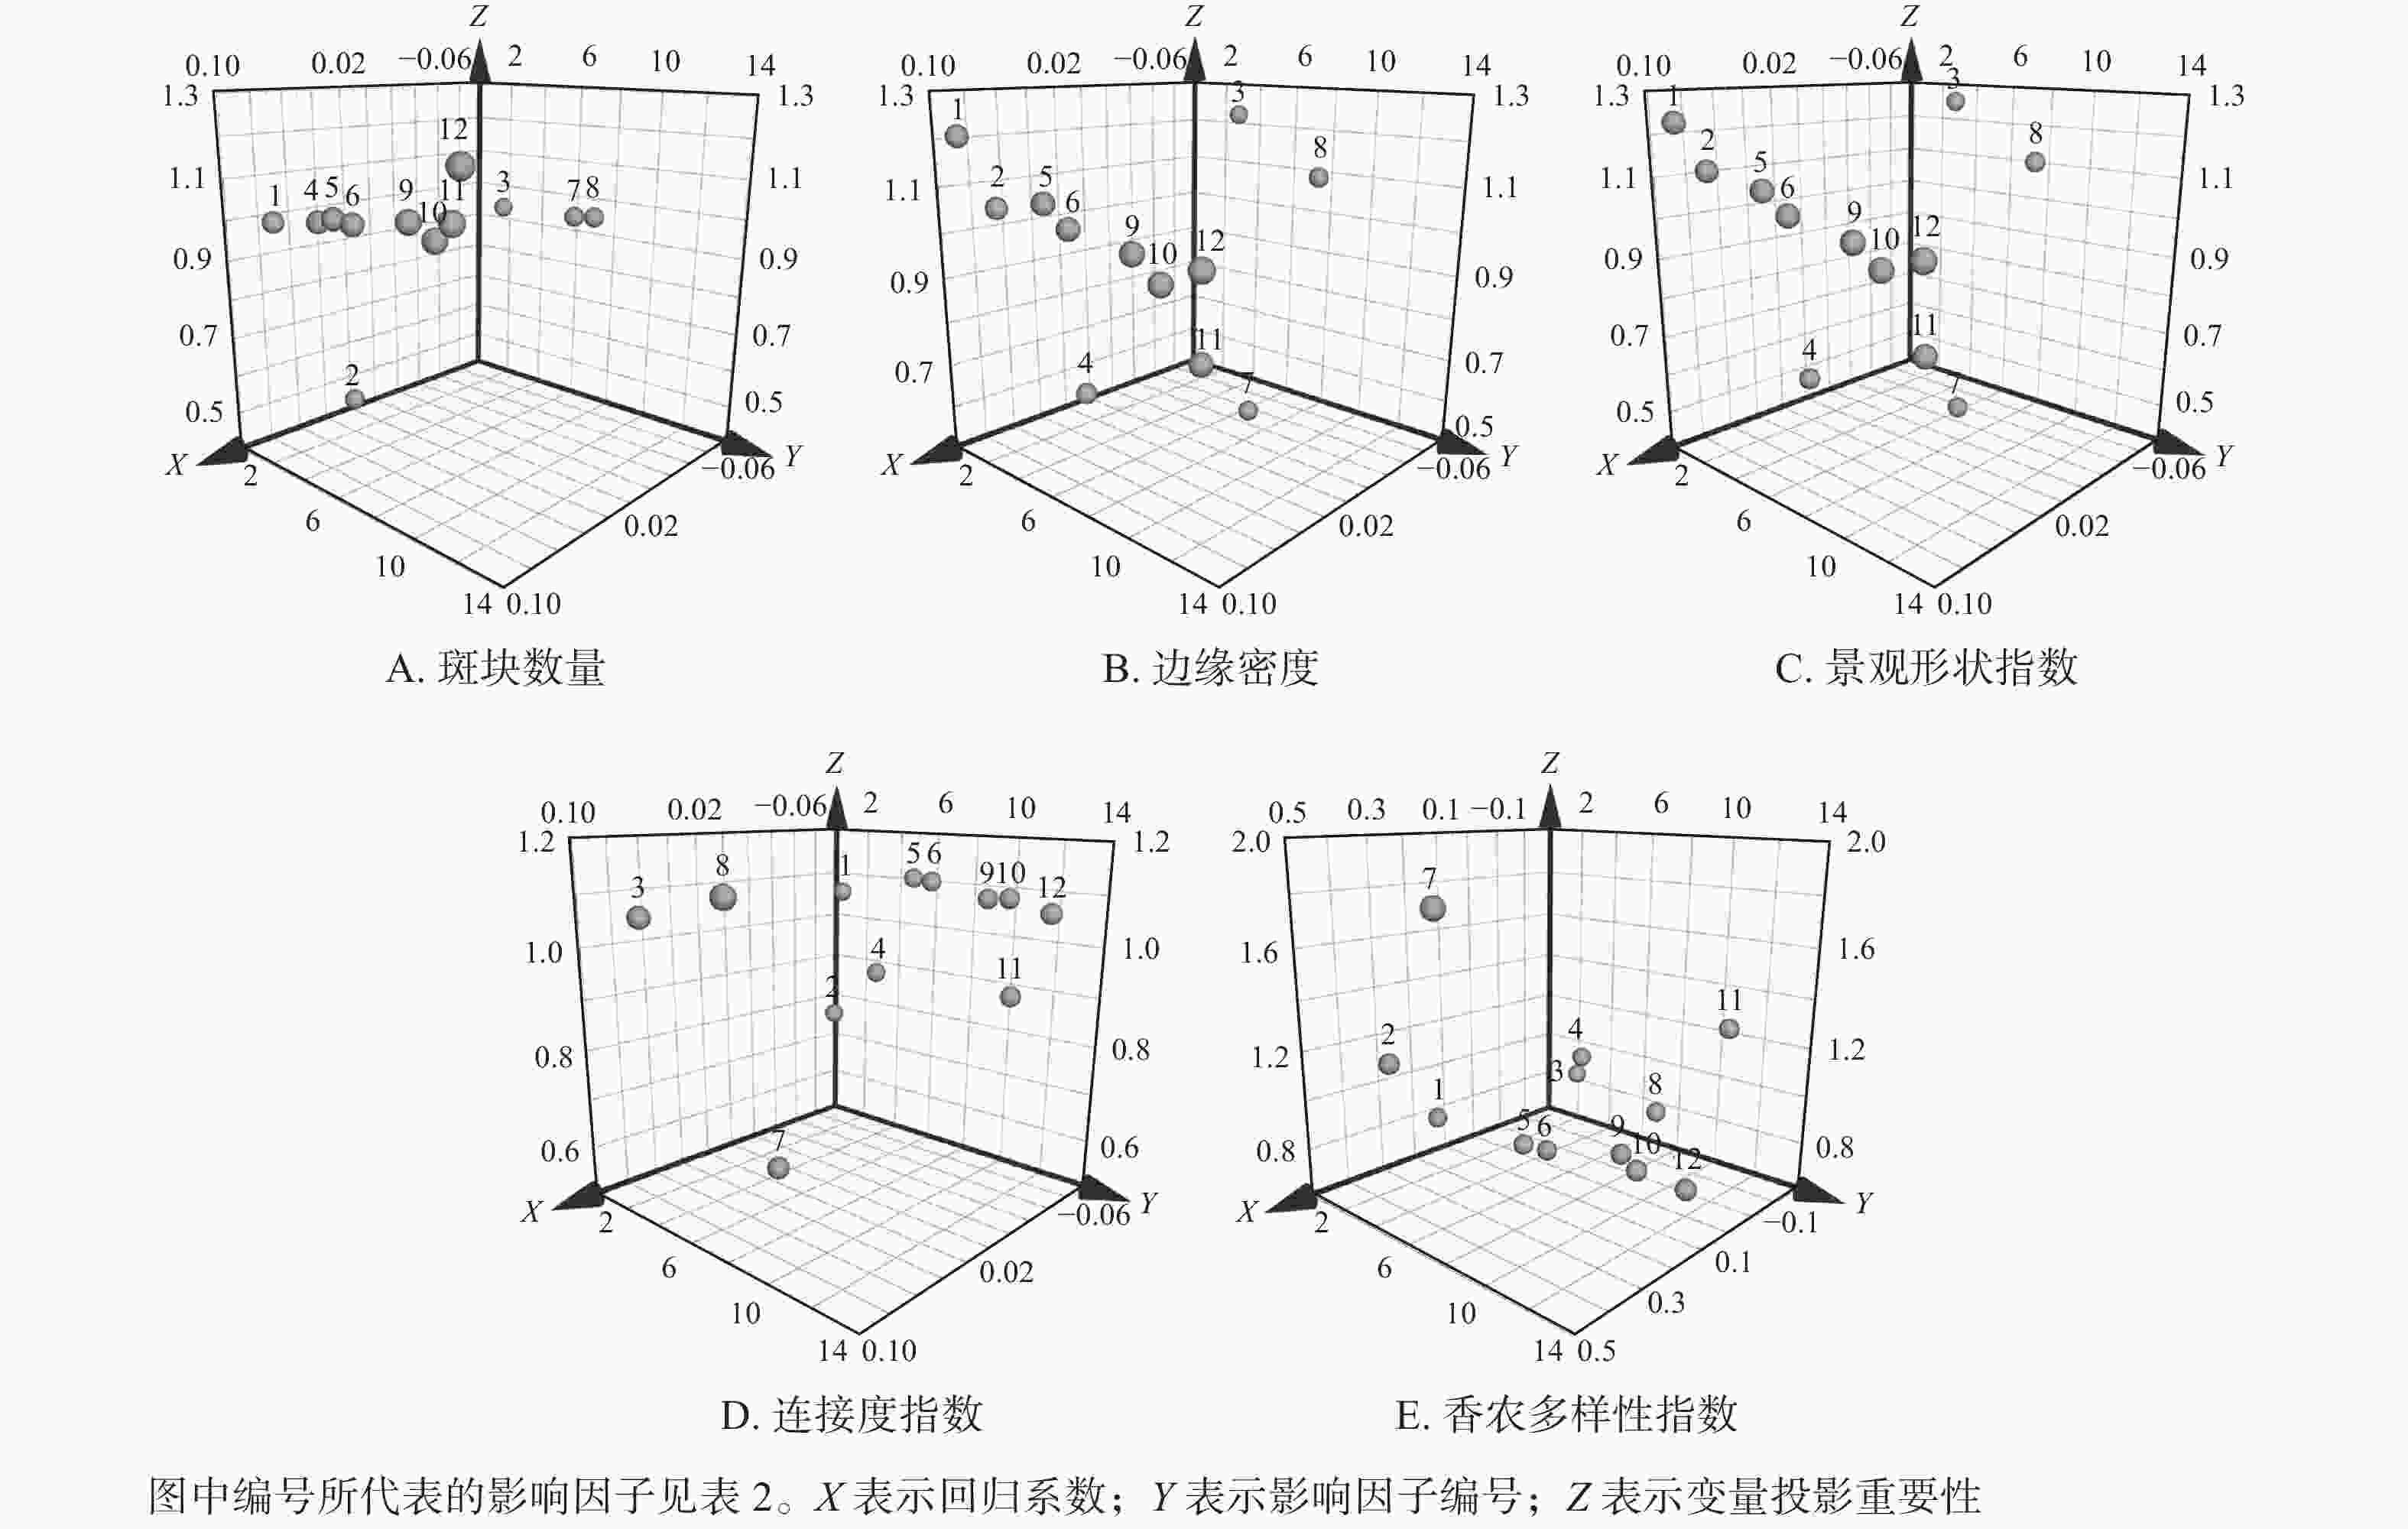
      Figure 5.  PLSR analysis of each influencing factor on the landscape pattern index of Nanjing’s urban green space

      通过南京市域绿地景观格局指数与各影响因素的PLSR结果分析可知:影响南京市域内绿地斑块数量演变的主要影响因子(VIP>1)为总水资源量、地区生产总值、人均GDP、第三产业产值比例、农林牧渔业总产值、建成区绿化面积以及常住人口数量。大部分的社会经济指标均对绿地斑块数量有重要影响,且除了第一产业产值比例以及第二产业产值比例外,其余因子均与绿地斑块数量呈正相关。其中,常住人口数量具有最大相关性,缘于城市人口增加后必然对于生活环境产生要求,市域内的绿地配置也一定会随人民需求及人口流动产生斑块转移。另外,自然环境条件下的总水资源量有较明显相关性,全年日照时长呈负相关性,可以看出城市的旱涝环境以及日照条件对植物生长存在一定影响,从而导致绿地斑块数量的变化。

      影响绿地边缘密度和景观形状指数的主要影响因子(VIP>1)为年平均气温、年降水量、全年日照时长、地区生产总值、人均GDP、第二产业产值比例、第三产业产值比例以及常驻人口数量。由回归系数可知:全年日照时长、第一产业产值比例以及第二产业产值比例等3个影响因子与边缘密度和景观形状指数演变呈负相关(RC<0)。值得一提的是,该2项指标均与自然因素有明显相关性,推测为自然环境对植被生长产生影响所致。根据卫星图像识别提取,俯视视角下的树冠形状也是影响市域绿地边缘密度和景观形状指数的重要因素。社会经济指标中的地区生产总值和第二产业产值比例为最相关因子,这说明人类的经济建设活动,尤其是工业生产活动,在带来城市飞速发展的同时,所导致的市域绿地边界的啃食是不可忽视的问题。

      影响南京市域绿地连接度水平变化的主要影响因子(VIP>1)为年降水量、全年日照时长、地区生产总值、人均GDP、第二产业产值比例、第三产业产值比例、农林牧渔业总产值以及常住人口数量。由回归系数可知:全年日照时长、第一产业产值比例以及第二产业产值比例与南京市域绿地连接度变化呈正相关(RC>0)。大部分社会经济指标因子均与绿地连接度水平有显著相关性,且多呈负相关,说明人类发展活动所带来的城市建设会降低绿地连接性,使绿地更趋破碎化,这将启发规划者在城市当中找到重要生态源点,通过城市添绿工程打通生态廊道,提高市域绿地连通性。

      影响南京市域绿地香农多样性指数产生演变的主要影响因子(VIP>1)为年平均气温、总水资源量、第一产业产值比例以及建成区绿化面积。由回归系数可知:除了全年日照时长、总水资源量、第二产业产值比例以及建成区绿化面积4项影响因子与南京市域绿地香农多样性指数变化呈负相关(RC<0)外,其余8项影响因子均与其演变呈正相关。

    • 南京市域绿地空间格局受到社会经济因素的影响,产业结构转型、人口流动、交通道路拓展以及城镇空间扩展削弱了市域绿地斑块的整体性。因此,在发展过程中应加强“见缝插针”式的小微绿地建设,加强生态修复治理。同时,亟需重视建成区外围的绿带、绿廊、绿网的构建,整合市域各类绿地的破碎斑块并构成有机网络体系,提升市域绿地的生态效益。

      本研究在数据处理阶段采用了IGBP的LUCC分类系统,与《国土空间调查、规划、用途管制用地用海分类指南(试行)》[26]中的土地分类标准相比较,该分类体系中一级类型为耕地、林地、草地、水域、城乡工矿居民用地、未利用土地共6类,其中林地又包含有林地、灌木林、疏林地及其他林地(指未成林造林地、迹地、苗圃及各类园地),使用LUCC分类体系可以很好地识别出以林地为主的城乡绿色空间状态[27]。国土空间视角下,城镇化发展与生态空间的矛盾是南京城乡建设的主要矛盾之一[28]。本研究所采用的Landsat数据精度为30 m,能够较好地识别市域绿地的变化情况,但是,随着郊区、非建成区的建设行为管控和土地的精细化管理要求不断提高[3, 29],今后还需要针对城市外围生态敏感区域提高数据提取精度,对市域绿地的景观连通性与格局优化进行进一步探讨,为城乡生态系统修复、尤其是非建成区生态问题的识别与诊断提出参考性意见。

Reference (29)

Catalog

    /

    DownLoad:  Full-Size Img  PowerPoint
    Return
    Return