Volume 40 Issue 5
Sep.  2023
Turn off MathJax
Article Contents

PAN Ting, WANG Yixiang, LIU Xianzhao, XU Chengli, LIU Zhijun. Land use change and its impact on ecological quality in Xiong’an New Area[J]. Journal of Zhejiang A&F University, 2023, 40(5): 1102-1110. doi: 10.11833/j.issn.2095-0756.20220596
Citation: PAN Ting, WANG Yixiang, LIU Xianzhao, XU Chengli, LIU Zhijun. Land use change and its impact on ecological quality in Xiong’an New Area[J]. Journal of Zhejiang A&F University, 2023, 40(5): 1102-1110. doi: 10.11833/j.issn.2095-0756.20220596

Land use change and its impact on ecological quality in Xiong’an New Area

doi: 10.11833/j.issn.2095-0756.20220596
  • Received Date: 2022-09-16
  • Accepted Date: 2023-03-28
  • Rev Recd Date: 2023-03-07
  • Available Online: 2023-09-26
  • Publish Date: 2023-09-26
  •   Objective  This study, with an investigation into the dynamics of land use change and ecological quality of Xiong’an New Area, is aimed to provide a theoretical basis and data support for the policy making in this area.   Method  With all the three counties of Xiong’an New Area included as the study area, on the basis of three intervals of land use data in 2000, 2017 and 2020, the remote sensing ecological index (RSEI) model was employed in the evaluation of the spatial and temporal changes of ecological quality and the exploration of the potential effects of land use changes on ecological quality.   Result  (1) In the traditional urbanization stage (2000−2017), land use types mainly changed from arable land to construction land or unutilized land whereas in the new area construction stage (2017−2020), the change was mainly from arable land and unutilized land to woodland. (2) From 2000 to 2017, the average value of RSEI in Xiong’an New Area decreased from 0.62 to 0.57, with the overall ecological quality degraded while the average value of RSEI increased to 0.59 in 2020, with the ecological quality improved slightly. (3) With the distribution and changes of land use consistent with ecological quality in space, significant impact was detected of the area changes in woodland and arable land on ecological quality. (4) At the current construction level and 1 km spatial scale, the ecological quality of 13% area ratio was improved with 10% increased area ratio of unutilized land converted to arable land while the ecological quality of 7% area ratio was improved with 10% increased area ratio of unutilized land converted to woodland.  Conclusion  The optimization of quality and quantity of woodland and arable land can not only help maintain the ecological quality of Xiong’an New Area but also contribute to the sustainable and healthy development of this area. [Ch, 4 fig. 6 tab. 29 ref.]
  • [1] WANG Xiangfu, LI Yuanhui, WANG Weifeng, SUN Jiejie, WANG Qian, DONG Wenting, WANG Rongnü, YANG Yaqi.  Impact of land use and climate change on potential suitable habitats of snow leopards (Panthera uncia) in Qinghai Province . Journal of Zhejiang A&F University, 2024, 41(3): 1-9. doi: 10.11833/j.issn.2095-0756.20230259
    [2] MENG Xueyuan, CHEN Gang, ZHENG Zhiyuan.  Spatiotemporal response of ecosystem service value to land use changes in national key ecological functional areas . Journal of Zhejiang A&F University, 2024, 41(): 1-11. doi: 10.11833/j.issn.2095-0756.20230506
    [3] CHEN Xi, YE Kemo, LI Kun, JIN Yang.  Research on land use change and risk-value of “production-living-ecological space” in a resource-based city . Journal of Zhejiang A&F University, 2023, 40(5): 1111-1120. doi: 10.11833/j.issn.2095-0756.20220666
    [4] ZUO Qilin, YU Yang, ZHA Tonggang, ZHANG Hengshuo, LIANG Yipeng, OUYANG Jiahuan.  Soil quality assessment of different land use types in Qingshui River Basin of western Shanxi Province . Journal of Zhejiang A&F University, 2023, 40(4): 801-810. doi: 10.11833/j.issn.2095-0756.20220498
    [5] ZHANG Shiwen, LI Chengrong, WANG Yan, WU Yang.  Evaluation and evolution characteristics of ecological quality in Yunnan based on long-time series satellite remote sensing . Journal of Zhejiang A&F University, 2023, 40(3): 579-588. doi: 10.11833/j.issn.2095-0756.20220439
    [6] ZHOU Siyi, YIN Xiaojie, TANG Ruiquan, WU Pengfei.  Evaluation of eco-environmental quality in typical rocky desertification areas in the upper reaches of the Yangtze River . Journal of Zhejiang A&F University, 2022, 39(4): 783-791. doi: 10.11833/j.issn.2095-0756.20210523
    [7] WANG Cheng, DONG Bin, PENG Wenjuan, CHEN Lingna, HUANG Hui, YE Xiaokang, ZHU Ming, LÜ Dian, NI Yanhua, ZHAO Kangkang, ZHANG Shuangshuang.  Influence of land-use change on the crane habitat and population in Shengjin Lake Wetland . Journal of Zhejiang A&F University, 2018, 35(3): 511-518. doi: 10.11833/j.issn.2095-0756.2018.03.016
    [8] ZHANG Yanru, LIANG Lizhuang, NIU Shukui, HAN Hairong.  Ecological landscape quality of Taiyue Mountain in Shanxi . Journal of Zhejiang A&F University, 2016, 33(4): 599-604. doi: 10.11833/j.issn.2095-0756.2016.04.007
    [9] LI Xianping, FENG Zhongke, YOU Xianxiang, QU Shuai.  Remote sensing dynamic monitoring and driving force analysis of county-cities expansion . Journal of Zhejiang A&F University, 2016, 33(5): 798-806. doi: 10.11833/j.issn.2095-0756.2016.05.011
    [10] WANG Xiaoxue, LIN Tianmiao, WU Xiuqin.  The impact of land use/land cover changes on human settlements in sandylands . Journal of Zhejiang A&F University, 2014, 31(1): 111-116. doi: 10.11833/j.issn.2095-0756.2014.01.017
    [11] BU Tao, ZHANG Shuikui, SONG Xinzhang, JIANG Hong.  Effects of several environmental factors on litter decomposition . Journal of Zhejiang A&F University, 2013, 30(5): 740-747. doi: 10.11833/j.issn.2095-0756.2013.05.017
    [12] ZHANG Tao, LI Yongfu, JIANG Peikun, ZHOU Guomo, LIU Juan.  Research progresses in the effect of land-use change on soil carbon pools and soil respiration . Journal of Zhejiang A&F University, 2013, 30(3): 428-437. doi: 10.11833/j.issn.2095-0756.2013.03.021
    [13] HUI Shu-rong, WANG Jiao, ZHANG Qian, WEI Zhong-ping, LIU Yang.  Soil-water dynamics with different agroforestry planting combinations on sandy lands in northwestern Liaoning Province . Journal of Zhejiang A&F University, 2010, 27(4): 579-584. doi: 10.11833/j.issn.2095-0756.2010.04.017
    [14] WU Jian, PENG Dao-li.  Technology of land use remote sensing information extraction in Duolun County . Journal of Zhejiang A&F University, 2010, 27(3): 417-423. doi: 10.11833/j.issn.2095-0756.2010.03.016
    [15] GU Lei, WU Chun-jun, WANG Xin.  Land utilization pattern changing and driving force analysis based on remote sensing data in Lin’an . Journal of Zhejiang A&F University, 2009, 26(6): 870-876.
    [16] GE Jing-ru,  QIN An-chen,  ZHAO Xiong-wei,  SUN Qiu-hua,  LI Ming,  ZHANG Rui,  JIA Zhe.  Overlay classification and its application in the remote sensing interpretation of land-use types in Taihangshan area, Hebei . Journal of Zhejiang A&F University, 2007, 24(6): 681-685.
    [17] CAO Yin-gui, ZHOU Wei, CHENG Ye, XU Ning, HAO Yin.  A review of land use and land cover changes in China . Journal of Zhejiang A&F University, 2007, 24(5): 633-637.
    [18] LIU Shou-zan, GUO Sheng-li, BAI Yan.  Changes in soil organic carbon under different land use types in slope land in gully region of Loess Plateau . Journal of Zhejiang A&F University, 2005, 22(5): 490-494.
    [19] JIANG Wen-wei, GUAN Yu, LIU Tong, ZHOU Guo-mo, SHEN Zhen-ming.  Forecast of land use pattern change in Anji County of Zhejiang : an application of Markov process . Journal of Zhejiang A&F University, 2004, 21(3): 309-312.
    [20] XIAO Sheng-he, YU Yi-wu, LI Jian, NI Hui-li.  Ecotourism image design of Jincheng Town , Lin,an City . Journal of Zhejiang A&F University, 2003, 20(1): 84-89.
  • [1]
    ZHU Jialei, PENNER J E, YU Fangqun, et al. Decrease in radiative forcing by organic aerosol nucleation, climate, and land use change [J]. Nature Communications, 2019, 10(1): 423.
    [2]
    DAMANIK-AMBARITA M N, BOETS P, THI H, et al. Impact assessment of local land use on ecological water quality of the Guayas river basin (Ecuador) [J]. Ecological Informatics, 2018, 48: 226 − 237.
    [3]
    REN Rongxiu, DU Zhangliu, SUN Yiheng, et al. Soil aggregate and its organic carbon distribution characteristics at different land use patterns in hilly areas of north China [J]. Acta Ecologica Sinica, 2020, 40(19): 6991 − 6999.
    [4]
    DU Xuejun, HUANG Zhonghua. Ecological and environmental effects of land use change in rapid urbanization: the case of Hangzhou, China [J]. Ecological Indicators, 2017, 81: 243 − 251.
    [5]
    HOU Rui, LI Hongbo, GAO Yanli. Ecological risk assessment of land use in Jiangxia district of Wuhan based on landscape pattern [J]. Research of Soil and Water Conservation, 2021, 28(1): 323 − 330.
    [6]
    YUAN Bingyu, GAO Jianhua, CHI Yuan, et al. Cross-scale spatiotemporal characteristics of landscape ecological conditions index in coastal zone of Jiangsu Province, China during 1990−2020 [J]. Chinese Journal of Applied Ecology, 2022, 33(2): 489 − 499.
    [7]
    YUAN Shaofeng, TANG Yiyu, SHENTU Chuning. Spatiotemporal change of land-use transformation and its eco-environmental response: a case of 127 counties in Yangtze River economic belt [J]. Economic Geography, 2019, 39(9): 174 − 181.
    [8]
    ZHAO Ruifeng, JIANG Penghui, CHEN Yaning, et al. Land use/cover change and its eco-environment effect in the main stream of Tarim River [J]. Scientia Geographica Sinica, 2012, 32(2): 244 − 250.
    [9]
    LIU Guilin, ZHANG Luocheng, ZHANG Qian. Spatial and temporal dynamics of land use and its influence on ecosystem service value in Yangtze River Delta [J]. Acta Ecologica Sinica, 2014, 34(12): 3311 − 3319.
    [10]
    LIU Zhifang, TANG Li’na, QIU Quanyi, et al. Temporal and spatial changes in habitat quality based on land-use change in Fujian Province [J]. Acta Ecologica Sinica, 2017, 37(13): 4538 − 4548.
    [11]
    JIN Shengtian, XIAO Wenhai, YANG Shengsu, et al. Land use change and its ecosystem response in the Yangtze River Economic belt [J]. Economic Geography, 2020, 40(7): 166 − 173.
    [12]
    LIU Jikai, ZHONG Shiquan, LIANG Wenhai. Extraction on crops planting structure based on multi-temporal Landsat 8 OLI images [J]. Remote Sensing Technology and Application, 2015, 30(4): 775 − 783.
    [13]
    GUO Li’na, LI Shuai, NIU Zhenguo, et al. Remote sensing investigation of farmland planting structure based on phenological difference and multi-temporal images-taking Yutian in Tangshan as an example [J]. Science of Surveying and Mapping, 2019, 44(10): 50 − 58.
    [14]
    ZHANG Zhijie, ZHANG Hao, CHANG Yuguang, et al. Review of radiometric calibration methods of Landsat series optical remote sensors [J]. Journal of Remote Sensing, 2015, 19(5): 719 − 732.
    [15]
    CHEN Chenxin, HU Changmiao, HUO Lianzhi, et al. Effect of different radiation correction methods of Landsat TM data on land-cover remote sensing classification [J]. Journal of Remote Sensing, 2014, 18(2): 320 − 334.
    [16]
    LIU Liqun, JIANG Kun, HU Zhi, et al. Response characteristics of ecosystem services values in territorial space development of Xiong’an New Area [J]. Acta Geographica Sinica, 2022, 42(6): 1 − 14.
    [17]
    YU Tan, XU Shuwen, ZHOU Xinyu, et al. Semi-automatic extraction of the threshold segmentation of coastline based on coastline type [J]. IOP Conference Series:Earth and Environmental Science, 2021, 690(1): 12012 − 12019.
    [18]
    YUE Hui, LIU Ying. Comparison and analysis of land surface temperature retrieval algorithms based on landsat 8 TIRS [J]. Science Technology and Engineering, 2018, 18(20): 200 − 205.
    [19]
    DING Feng, XU Hanqiu. Comparison of two new algorithms for retrieving land Surface temperature from landsat TM thermal band [J]. Geo-Information Science, 2006, 8(3): 125 − 130.
    [20]
    XU Hanqiu. A remote sensing index for assessment of regional ecological changes [J]. China Environmental Science, 2013, 33(5): 889 − 897.
    [21]
    XU Hanqiu, SHI Tingting, WANG Meiya, et al. Land cover changes in the Xiong’an New Area and a prediction of ecological response to forthcoming regional planning [J]. Acta Ecologica Sinica, 2017, 37(19): 6289 − 6301.
    [22]
    WANG Zhijie, DAI Lei. Assessment of land use/cover changes and its ecological effect in karst mountainous cities in central Guizhou Province: taking Huaxi District of Guiyang City as a case [J]. Acta Ecologica Sinica, 2021, 41(9): 3429 − 3440.
    [23]
    WANG Kailin, LI Haitao, WU Aimin, et al. An analysis of the evolution of Baiyangdian wetlands in Hebei Province with artificial recharge [J]. Acta Geoscientica Sinica, 2018, 39(5): 549 − 558.
    [24]
    MA Yuan. Experience and inspiration of urban forest construction in Xiong’an New Area [J]. Forestry and Ecology, 2019(6): 23 − 25.
    [25]
    YANG Jiangyan, WU Tian, PAN Xiaoyan, et al. Ecological quality assessment of Xiong’an New Area based on remote sensing ecological index [J]. Chinese Journal of Applied Ecology, 2019, 30(1): 277 − 284.
    [26]
    GAO Xing, LIU Zewei, LI Chenxi, et al. Land use function transformation in the Xiong’an New Area based on ecological-production-living spaces and associated eco-environment effects [J]. Acta Ecologica Sinica, 2020, 40(20): 7113 − 7122.
    [27]
    GUAN Yu, CHEN Ying, PAN Xiaoyan, et al. Cross-sensitivity analysis of ecological services based on land use transition: a case study of Xiong’an New Area [J]. Ecological Economy, 2021, 37(3): 153 − 160.
    [28]
    SHI Tingting, XU Hanqiu, SUN Fengqin, et al. Remote-sensing-based assessment of regional ecological changes triggered by a construction project: a case study of Aojiang River Watershed [J]. Acta Ecologica Sinica, 2019, 39(18): 6826 − 6839.
    [29]
    JIN Jiali, WANG Cheng, JIA Baoquan. Coupling analysis of landscape pattern and thermal fields after the afforestation in Beijing plain area [J]. Chinese Journal of Applied Ecology, 2018, 29(11): 3723 − 3734.
  • 加载中
通讯作者: 陈斌, bchen63@163.com
  • 1. 

    沈阳化工大学材料科学与工程学院 沈阳 110142

  1. 本站搜索
  2. 百度学术搜索
  3. 万方数据库搜索
  4. CNKI搜索

Figures(4)  / Tables(6)

Article views(310) PDF downloads(30) Cited by()

Related
Proportional views

Land use change and its impact on ecological quality in Xiong’an New Area

doi: 10.11833/j.issn.2095-0756.20220596

Abstract:   Objective  This study, with an investigation into the dynamics of land use change and ecological quality of Xiong’an New Area, is aimed to provide a theoretical basis and data support for the policy making in this area.   Method  With all the three counties of Xiong’an New Area included as the study area, on the basis of three intervals of land use data in 2000, 2017 and 2020, the remote sensing ecological index (RSEI) model was employed in the evaluation of the spatial and temporal changes of ecological quality and the exploration of the potential effects of land use changes on ecological quality.   Result  (1) In the traditional urbanization stage (2000−2017), land use types mainly changed from arable land to construction land or unutilized land whereas in the new area construction stage (2017−2020), the change was mainly from arable land and unutilized land to woodland. (2) From 2000 to 2017, the average value of RSEI in Xiong’an New Area decreased from 0.62 to 0.57, with the overall ecological quality degraded while the average value of RSEI increased to 0.59 in 2020, with the ecological quality improved slightly. (3) With the distribution and changes of land use consistent with ecological quality in space, significant impact was detected of the area changes in woodland and arable land on ecological quality. (4) At the current construction level and 1 km spatial scale, the ecological quality of 13% area ratio was improved with 10% increased area ratio of unutilized land converted to arable land while the ecological quality of 7% area ratio was improved with 10% increased area ratio of unutilized land converted to woodland.  Conclusion  The optimization of quality and quantity of woodland and arable land can not only help maintain the ecological quality of Xiong’an New Area but also contribute to the sustainable and healthy development of this area. [Ch, 4 fig. 6 tab. 29 ref.]

PAN Ting, WANG Yixiang, LIU Xianzhao, XU Chengli, LIU Zhijun. Land use change and its impact on ecological quality in Xiong’an New Area[J]. Journal of Zhejiang A&F University, 2023, 40(5): 1102-1110. doi: 10.11833/j.issn.2095-0756.20220596
Citation: PAN Ting, WANG Yixiang, LIU Xianzhao, XU Chengli, LIU Zhijun. Land use change and its impact on ecological quality in Xiong’an New Area[J]. Journal of Zhejiang A&F University, 2023, 40(5): 1102-1110. doi: 10.11833/j.issn.2095-0756.20220596
  • 城镇化进程的加快和建设用地的快速扩张,导致城镇区域土地利用结构发生了巨大变化,人地矛盾日益突出,造成植被破坏、水土流失和土地荒漠化等一系列生态问题。如何正确认识土地利用变化对城镇区域生态环境的影响,是国内外研究的一个重要课题。目前有关土地利用变化的生态效应研究多集中于大气环境[1]、水体[2]、土壤[3]等自然环境方面,多采用生态系统服务价值(ESV)[4]、景观生态指数[5-6]、生态环境质量指数(EV)[7]等方法。已有研究发现:快速城镇化导致的土地利用变化会引起水环境恶化、土壤质量改变、植被严重退化等生态环境问题[89];造林绿化和生态修复能降低景观破碎化程度,提高生境质量[10];人工湖泊、湿地公园的增多会降低陆地生态服务功能,增加湿地生态服务功能[11]。当前研究多集中在传统的城镇化扩张对景观格局和生态效应的影响,对于少数新型化城镇建设中土地利用的转变和生态质量影响的研究并不多见。

    雄安新区是承载着“千年大计、国家大事”的创新型城市,始终坚持生态优先、绿色发展的理念,遵循“先植绿、后建城”的建设思路,将森林作为新区有生命的基础设施,设计伴随城市生长的复层、异龄、混交的“千年秀林”,最大限度降低城市建设和发展中建筑不透水面取代地表原有的自然生态系统而形成的生态环境压力。雄安新区城镇化扩张和绿色基底“千年秀林”的建设综合影响着新区的生态环境质量,因此,科学客观地开展生态质量监测评估、评价基础设施建设对生态质量的影响,可为雄安新区后期生态建设和城市管理提供重要依据。本研究以雄安新区3个县为研究区,基于2000、2017和2020年3期土地利用数据,利用遥感生态指数(remote sensing ecological index,RSEI)模型评价生态质量的时空变化特征,剖析土地利用变化对生态质量的影响,揭示土地利用变化的生态效应,以期为优化雄安新区土地利用管理、保护生态环境提供理论支撑。

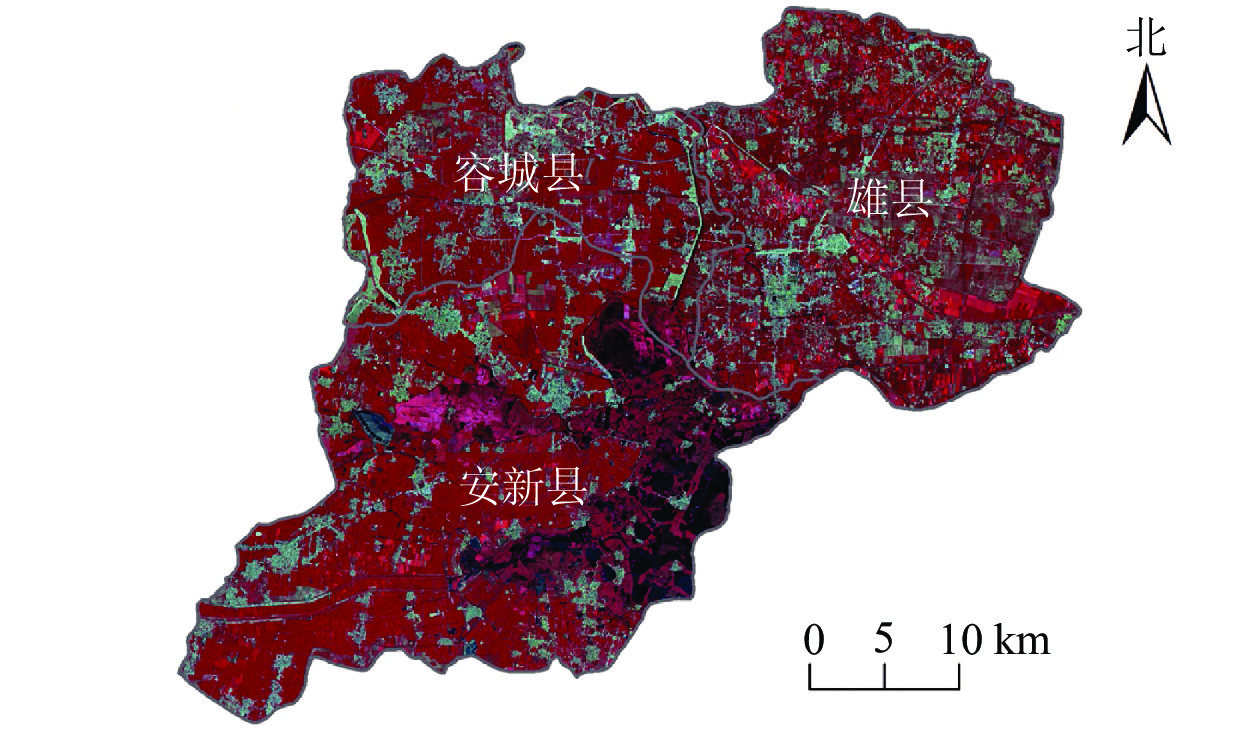
    • 雄安新区地处北京、天津、保定腹地,包括容城、雄县、安新3个县及其周边部分区域,总面积为1 770.00 km2,38°43′~39°10′N、115°38′~116°20′E,四季分明,夏季高温多雨,冬季寒冷干燥,年均气温为12.4 ℃,年均降水量为495.1 mm,属于典型的暖温带季风型半湿润半干旱气候。地处太行山东麓冲洪积平原前缘地带,全境地势西北高,东南低,海拔5~26 m,为缓倾平原,土层深厚,地势开阔。由于白洋淀水域面积较大且影响评价效果,所以本研究剔除雄安新区周边水域,研究区总面积为1 571.69 km2 (图1)。

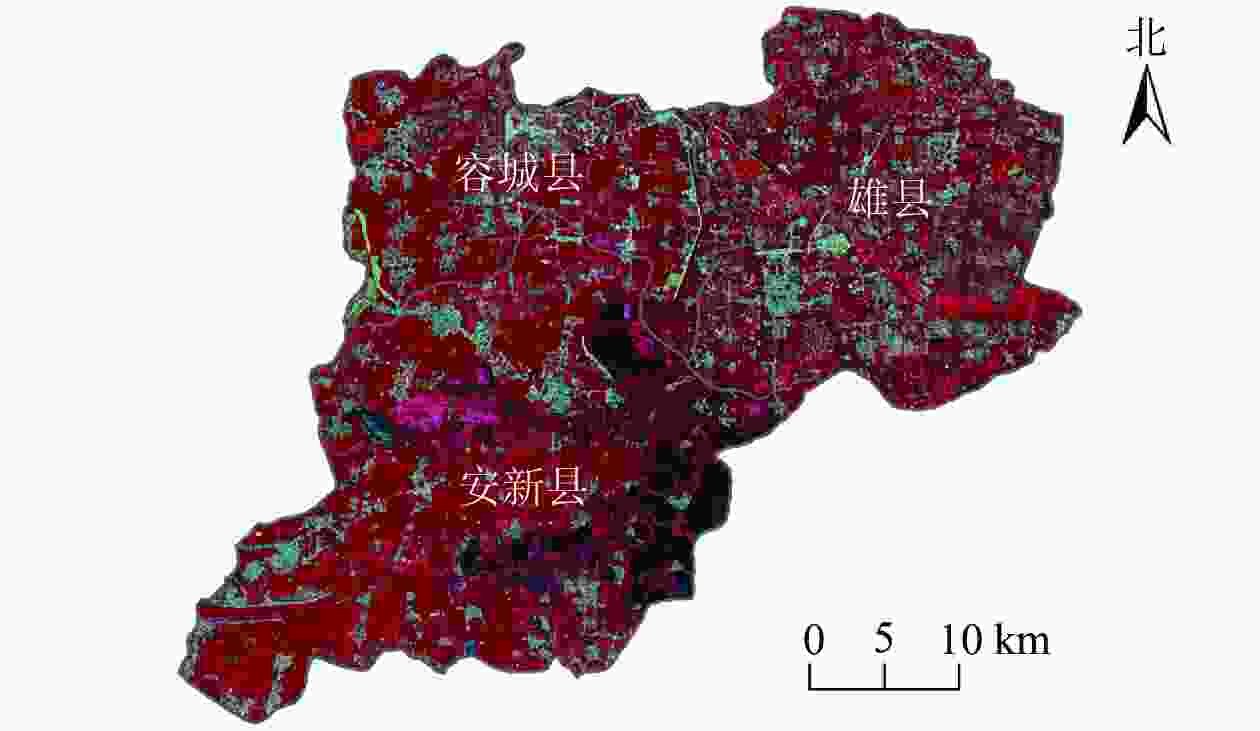
      Figure 1.  Sketch map of three counties of Xiong’an New Area

    • 影像数据来源于地理空间数据云网站(www.gscloud.cn),参照前人的研究结论[1213],4月中下旬至5月上旬为研究区冬小麦Triticum aestivum的拔节生长期,该阶段小麦在遥感影像上表现为“绿地”,且林木在此期间开始展叶生长,因此选取2000年4月22日、2017年5月7日(OLI/TIRS)和2020年4月29日(OLI/TIRS) Landsat遥感影像作为耕地及林地信息提取的数据源,且云量较低(低于10%),质量完好,空间分辨率为30 m。由于地表反射率会受到光照与大气因素的影响,不同时相的影像存在地形上的变化差异,因此,在计算各分量指标前,需要对这3期影像进行辐射定标[14]、大气校正等预处理。为消除因大气吸收和散射造成的辐射误差,利用FLAASH模型进行大气校正[15],最后利用雄安新区行政区划矢量数据裁剪出研究区预处理后的影像。

    • 参照文献[16],基于ENVI 5.3平台,采用最大似然法监督分类方法,将研究区土地利用类型分为未利用地、耕地、林地、建设用地和水域等5类。采用误差矩阵精度评价法,利用谷歌地球(Google Earth)高分辨率影像对分类结果进行检验,3期影像监督分类结果总体精度分别为91.26%、90.89%和92.14%,Kappa系数分别为0.84、0.81和0.85,分类效果较好,精度满足研究需求。

    • 利用2000、2017和2020年Landsat遥感影像数据,提取湿度分量(WET)、归一化植被指数(NDVI)、地表温度(LST)和归一化建筑-裸土指数(NDSI),分别代表湿度、绿度、热度和干度指标,构建遥感生态指数(RSEI),具体方法参照文献[1721],并以像元作为评价单元,对雄安新区生态质量变化状况进行评价分析。运用等间距分级方法,将生态质量指数(RSEI)划分为5个等级,即[0, 0.2)、[0.2, 0.4)、[0.4, 0.6)、[0.6, 0.8)和[0.8, 1.0],分别对应生态质量差、较差、中等、良和优。

    • 为揭示雄安新区土地利用变化与生态质量之间时空变化的定量关系,基于ArcGIS 10.4的Fishnet工具,将研究区按1 km×1 km的大小划分网格,剔除边缘的碎小网格后共1 455个网格,利用分区统计功能统计各网格的信息,具体公式参照文献[22],如下:RLij=ALUij/AGj×100%;RAIj=AEIj/AGj×100%;RADj=AEDj/AGj×100%。其中,RLij为第j个网格内第i种土地利用类型转移方式占网格面积的比例;ALUij为第j个网格内第i种土地利用类型转移方式面积;RAIj(RADj)为第j个网格内生态质量改善(退化)面积占网格面积的比例;AEIj(AEDj)为第j个网格内生态质量改善(退化)面积;AGj为第j个网格的面积。

      运用SPSS 21的相关与回归分析方法,分析显著影响雄安新区生态质量改善(退化)的土地利用转移方式,进而拟合两者之间的关系,RAI=f(RLm)或RAD=f(RLn),揭示土地利用变化的生态质量响应与生态效应。
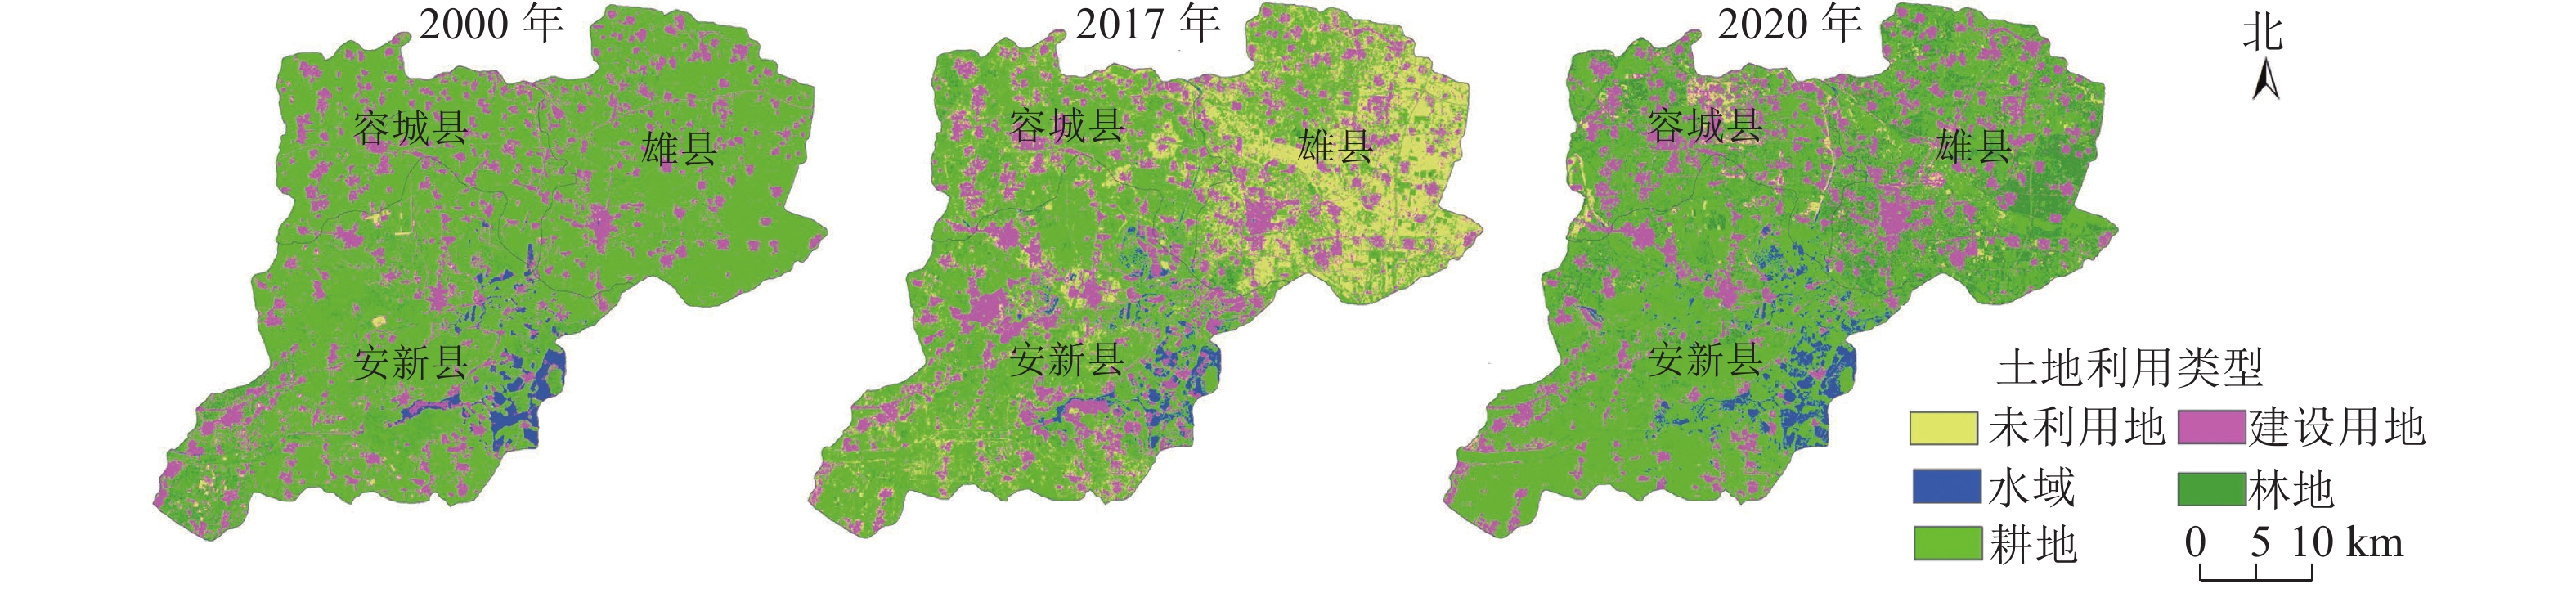
    • 图2表1可见:2000—2017年,雄安新区土地利用变化主要为建设用地和未利用地2类用地面积增加,林地、水域和耕地3类用地面积减少,呈“两增三减”的特征,其中2017年大量耕地调整为未利用地进入后期建设规划,未利用地新增326.30 km2,城镇化扩张也增加了建设用地的面积(46.85 km2)。由于新区规划建设和前期城镇化发展,耕地减少最多(354.15 km2)。随着新区规划建设的快速推进,2017—2020年间新区林地(249.23 km2)、水域(23.22 km2)面积快速增多,未利用地则快速减少(268.66 km2),该阶段林地和水域面积的增加大多与可持续发展,重视生态环境保护,建设千年秀林,南水北调、引黄济淀等水利工程措施保持白洋淀湖体水量有关[2324]

      Figure 2.  Spatial distribution map of land use types of Xiong’an New Area in 2000, 2017 and 2020

      土地利用类型土地面积/km2土地面积变化量/km2
      2000年2017年2020年2000—2017年2017—2020年
      林地  64.7045.85295.08−18.85249.23
      水域  27.4827.3350.55−0.1523.22
      耕地  1 143.04788.89771.45−354.15−17.44
      建设用地327.09373.94387.5946.8513.65
      未利用地9.38335.6867.02326.30−268.66

      Table 1.  Characteristics of land use area change in Xiong’an New Area from 2000 to 2020

    • 表2可以看出:PC1中WET、NDVI为正影响指标,LST、NDSI为负影响指标,且各指标对PC1的贡献度表现为NDVI大于WET,NDSI大于LST,表明NDVI和NDSI对雄安新区生态质量的影响较大。此外,WET和NDVI均值呈先下降后上升的趋势,LST和NDSI均值呈先上升后下降的趋势;RSEI由2000年的0.62下降至2017年的0.57,降幅为8.06%,由2017年的0.57上升至2020年的0.59,增幅为3.5%,表明2000—2020年雄安新区生态质量总体呈先下降后上升的趋势。

      指标PC1PC2PC3PC42000年2017年2020年
      均值±标准差均值±标准差均值±标准差
      WET 0.51 0.47 −0.52 0.51 0.88±0.04 0.58±0.23 0.67±0.11
      NDVI 0.52 −0.02 0.79 0.32 0.65±0.14 0.55±0.26 0.63±0.21
      LST −0.42 0.85 0.31 −0.05 0.82±0.13 0.84±0.21 0.57±0.41
      NDSI −0.55 −0.24 0.04 0.81 0.25±0.18 0.53±0.22 0.43±0.16
      RSEI 0.62±0.14 0.57±0.23 0.59±0.21
        说明:WET为湿度分量,NDVI为归一化植被指数,LST为地表温度,NDSI为归一化建筑-裸土指数,RSEI为遥感生态指数。PC1~PC4为主成分1~4。

      Table 2.  Principal component analysis of remote sensing ecological index in Xiong’an New Area
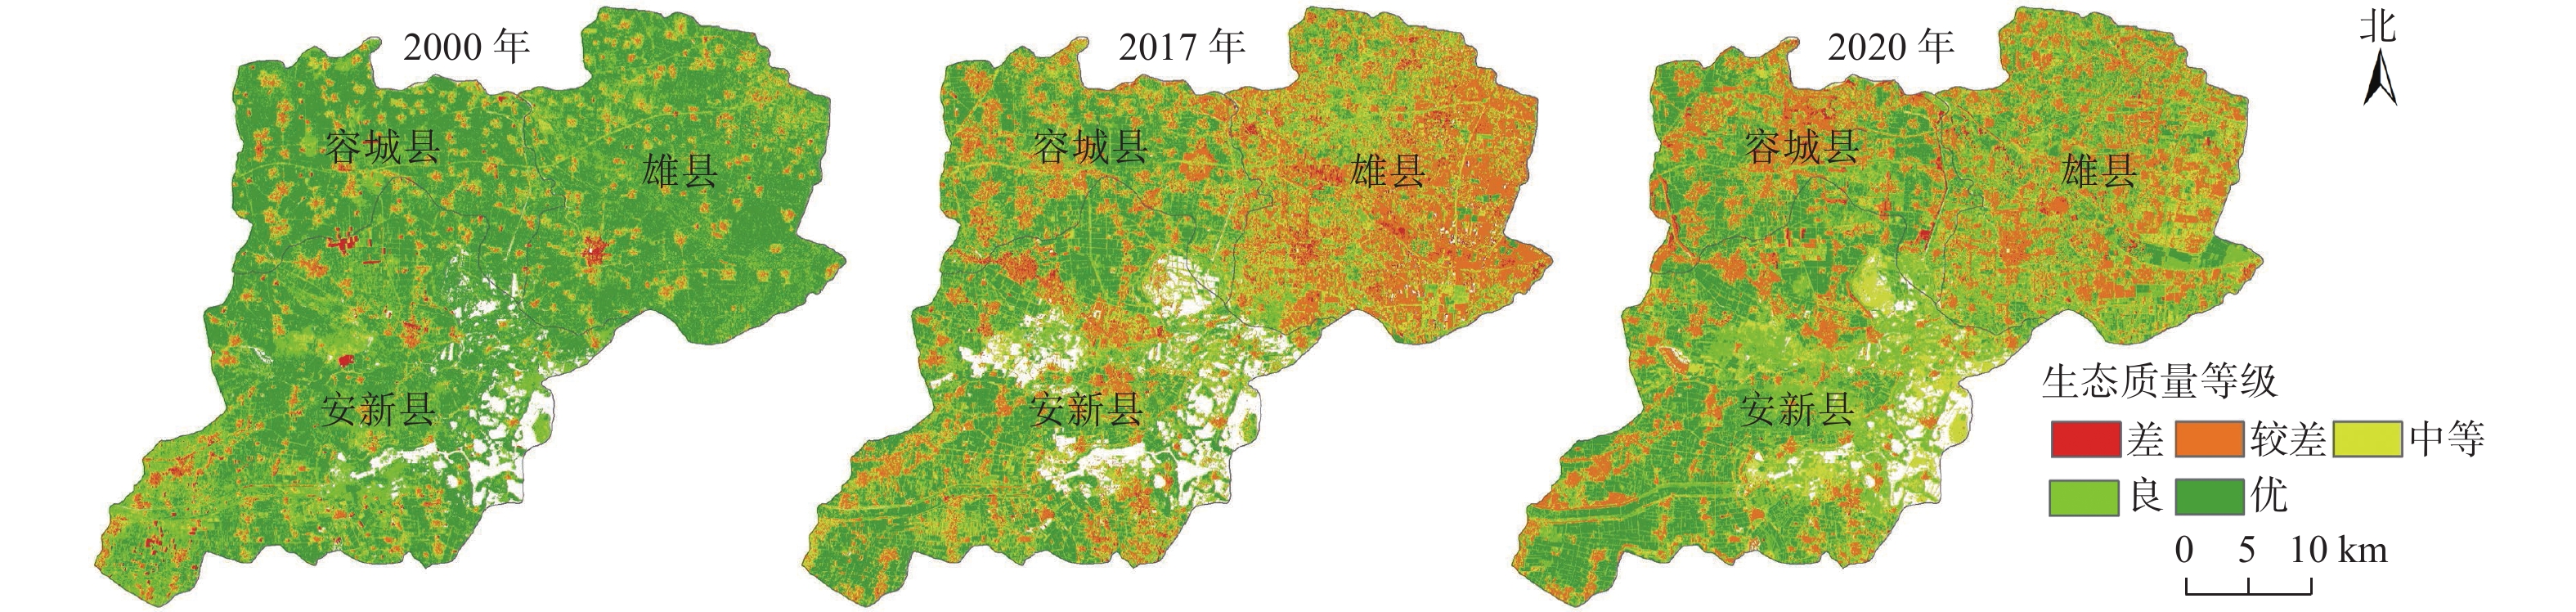
      进一步分析不同生态质量等级的变化情况可以看出(图3表3),2000年生态质量以优为主(55.53%),其次是良(26.19%);2017年以较差为主(30.44%),其次为中等(25.20%),大部分位于雄县;而2020年生态质量差的面积占比仅为0.62%,主要位于容城县。其生态质量的优劣与土地利用使用的结构模式相一致。

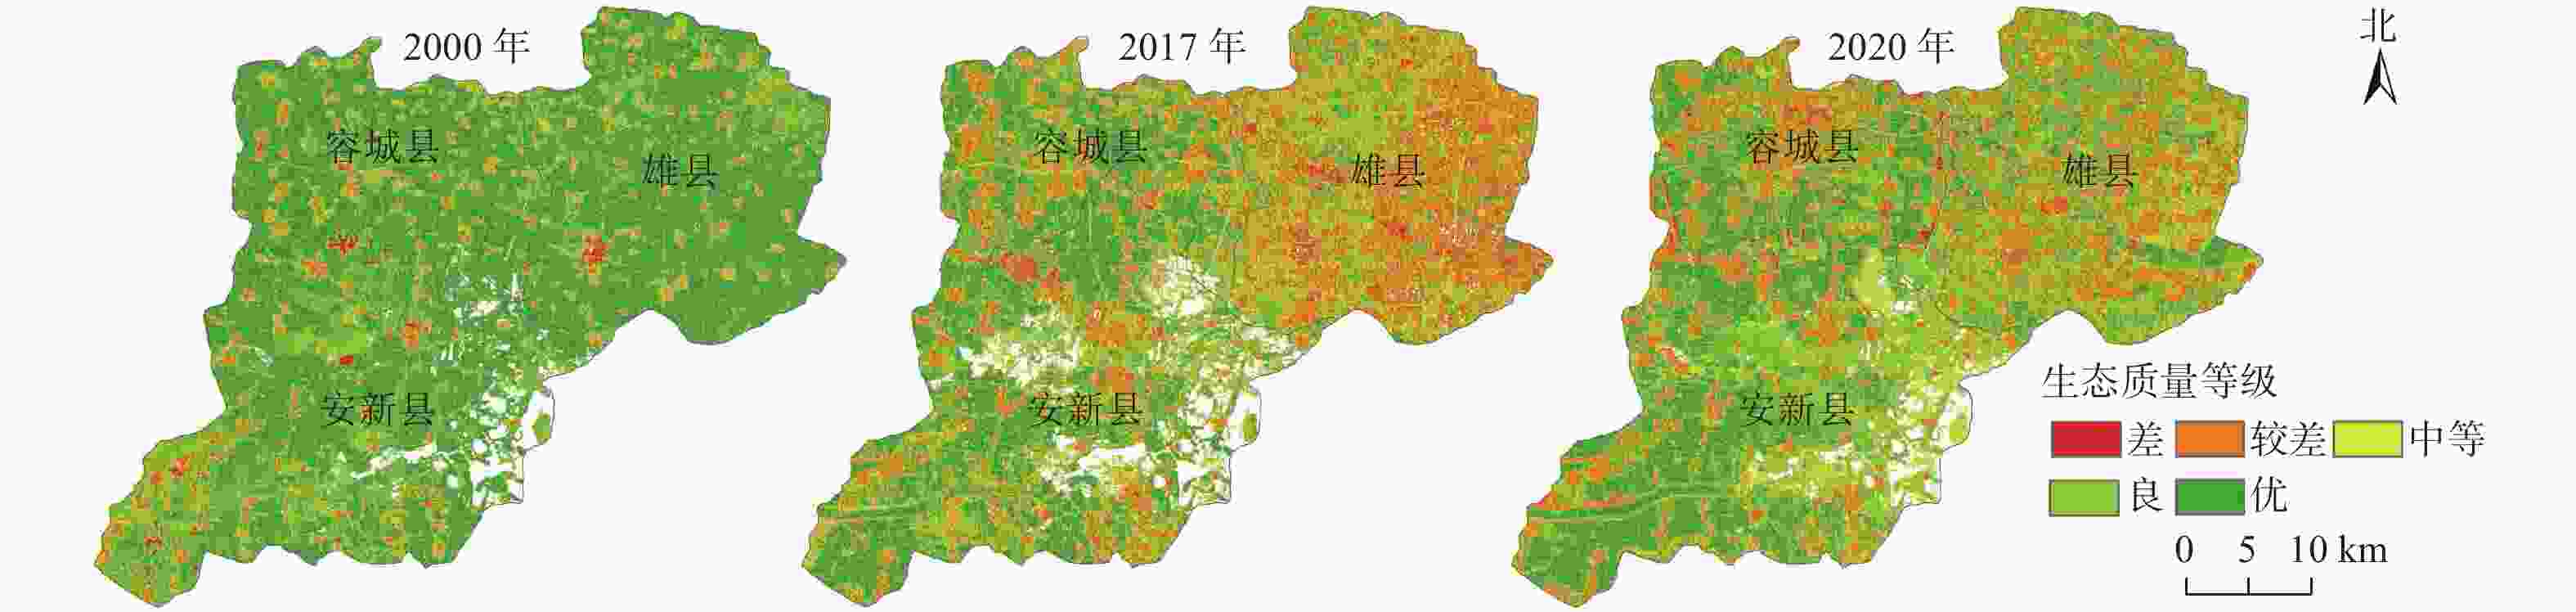
      Figure 3.  Distribution of Ecological Quality Grade of Xiong’an New Area from 2000 to 2020

      RSEI等级2000年2017年2020年
      面积/km2百分比/%面积/km2百分比/%面积/km2百分比/%
      差 11.830.7719.591.349.430.62
      较差105.026.84445.0430.44388.7325.54
      中等163.8910.67368.3325.20336.8522.14
      良 402.3326.19275.4418.84419.6827.58
      优 853.0555.53353.4724.18367.1024.12

      Table 3.  Area statistics of ecological quality grades from 2000 to 2020 in Xiong’an New Area

      2000—2017年,雄安新区生态退化面积最多(845.00 km2),极少区域生态质量改善(142.62 km2),且主要分布在安新县,在空间上呈“总体退化、局部改善”的特征。2017—2020年,新区生态未改变面积最多(647.57 km2),且生态改善面积有所增加(473.44 km2),表明该研究区总体生态质量在这3 a基本维持稳定且有好转趋势。生态质量改善的区域主要分布于雄县,与“千年秀林”的建设有明显关系。该阶段雄安新区更加重视生态保护,生态质量相应改善。

    • 图4表4可见:2000—2017年雄安新区生态质量改善面积比例(RAI)与建设用地转耕地面积比(RLca)呈极显著正相关(R=0.558,P<0.001),与林地转耕地面积比(RLwa)呈极显著正相关(R=0.614,P<0.001);2017—2020年RAI与未利用地转耕地面积比(RLua)呈极显著正相关(R=0.753,P<0.001),与未利用地转林地面积比(RLuw)呈极显著正相关(R=0.488,P<0.001),而RAI与耕地转林地面积比(RLaw)负相关(R=−0.022),但相关性不显著。回归方程为:yRAI=1.257xRLua +0.196 (R=0.753,P=0.000,R2=0.867),yRAI=0.727xRLuw+0.267(R=0.488,P=0.000,R2=0.739)。显示在雄安新区(2017—2020年)建设水平和1 km空间尺度下,未利用地转耕地面积比每增加10%,生态质量改善的面积比约增加13%,未利用地转林地面积比每增加10%,生态质量改善的面积比约增加7%。

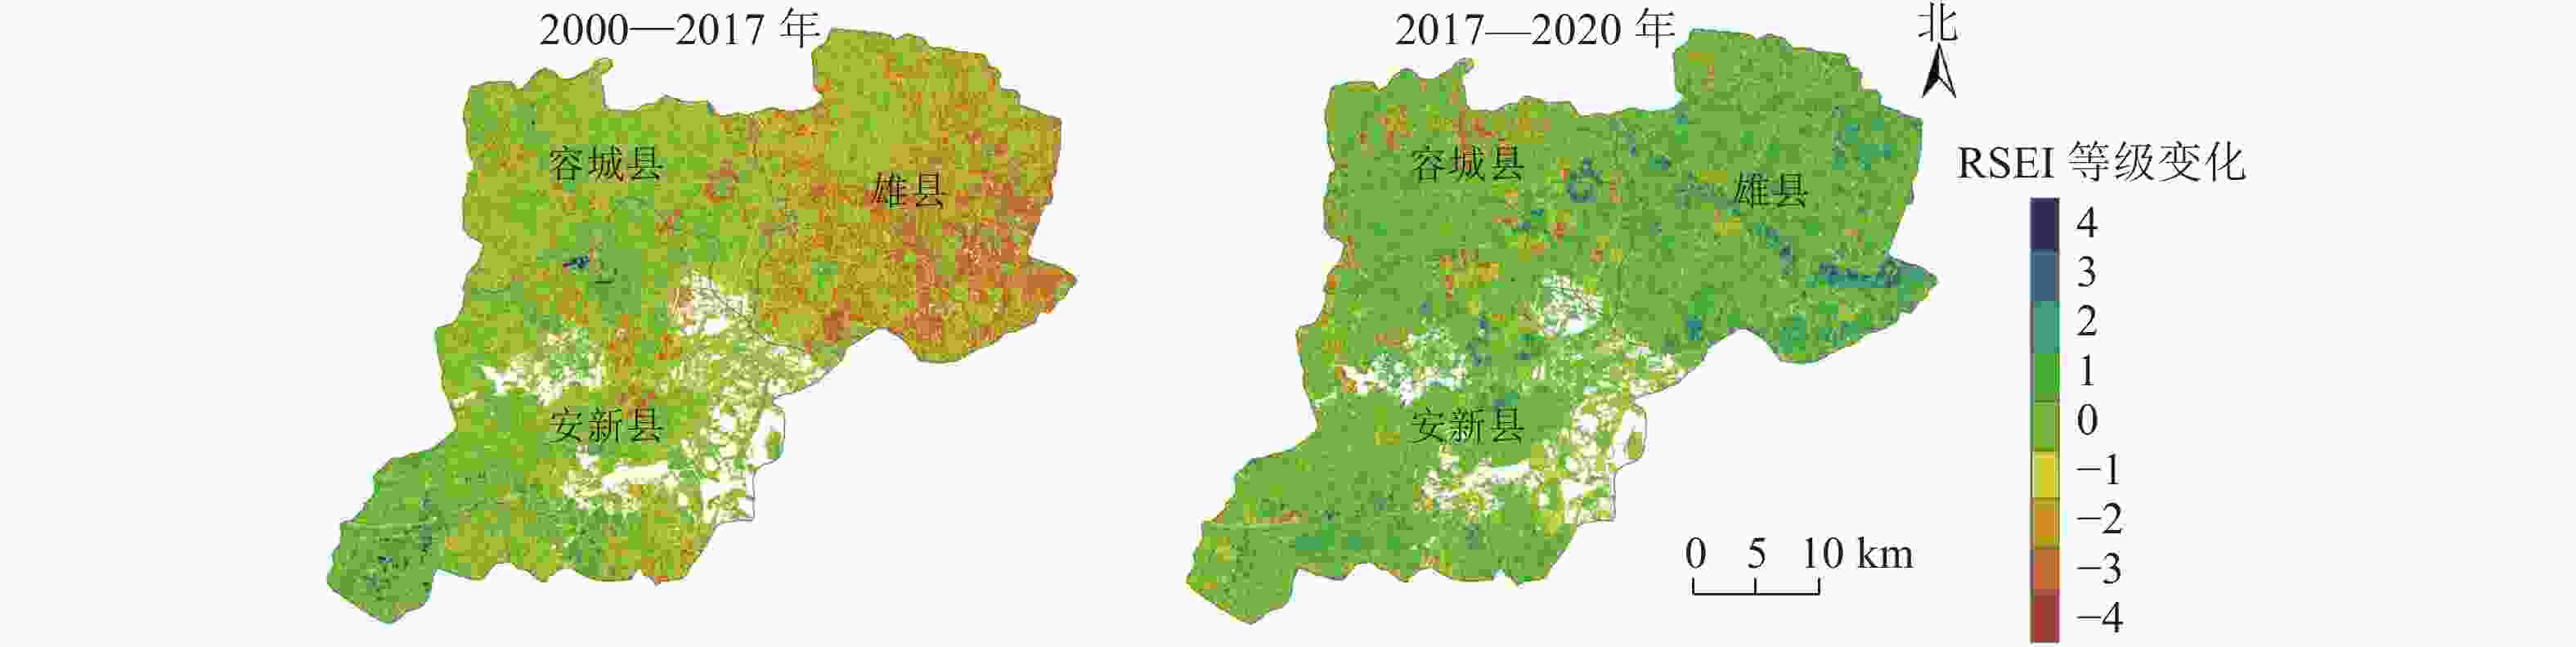
      Figure 4.  Changes of ecological quality from 2000 to 2020 in Xiong’an New Area

      类型级差2000—2017年2017—2020年
      级面积/km2类面积/km2百分比/%级面积/km2类面积/km2百分比/%
      生态退化 −48.28845.0058.182.71335.9923.06
      −3201.2345.77
      −2278.3263.61
      −1357.17223.90
      生态未改变0469.37469.3732.21647.57647.5744.45
      生态改善 1115.70142.629.83285.26473.4432.49
      218.49137.88
      35.6248.28
      42.822.02

      Table 4.  Statistics of ecological quality grade changes in Xiong’an New Area

    • 表5表6可见:2000—2017年雄安新区生态质量退化区面积比例(RAD)与耕地转未利用地面积比(RLau)呈极显著正相关关系(R=0.714,P<0.001),与耕地转建设用地面积比(RLac)呈极显著正相关关系(R=0.289,P<0.001);2017—2020年,RAD与RLac呈极显著正相关关系(R=0.535,P<0.001),与耕地净退化面积比(AEDa)呈极显著正相关关系(R=0.557,P<0.001)。回归方程为:yRAD=0.816xRLau +0.437 (R=0.714,P=0.000,R2=0.851);yRAD=0.696xAEDa +0.124(R=0.557,P=0.000,R2=0.710)。显示在传统城镇化(2000—2017年)建设水平和1 km空间尺度下,耕地转未利用地面积比每增加10%,生态质量的退化面积比约增加8%,而在雄安新区(2017—2020年)建设水平和1 km空间尺度下,耕地面积净退化10%,生态质量退化的面积比约增加7%。

      阶段土地利用类型
      转移方式面积比
      相关
      系数
      双侧显
      著性
      样本数
      2000—2017年RLca0.558**01 455
      RLwa0.614**01 455
      2017—2020年RLua0.753**01 455
      RLaw−0.0220.4031 455
      RLuw0.488**01 455
        说明:RLca指建设用地转耕地面积比;RLwa指林地转耕地面积比;RLua指未利用地转耕地面积比;RLaw指耕地转林地面积比;RLuw指未利用地转林地面积比;**表示极显著相关(P<0.01)。

      Table 5.  Correlation analysis of the area ratio of main land use type transfer mode in improved area of Xiong’an New Area

      阶段土地利用类型
      转移方式面积比
      相关系数双侧显著性样本数
      2000—2017年RLau0.714**01455
      RLac0.289**01455
      2017—2020年RLac0.535**01455
      AEDa0.557**01455
        说明:RLau指耕地转未利用地面积比;RLac指耕地转建设用地面积比;AEDa指耕地净退化面积比;**表示极显著相关(P<0.01)。

      Table 6.  Correlation analysis of the area ratio of main land use type transfer mode in deteriorated area of Xiong’an New Area

    • 本研究采用分辨率为30 m的Landsat遥感影像,并结合Google Earth高分辨率影像对研究区不同时期土地利用分类结果进行修正,3期影像监督分类结果的各类型分类精度和总体精度均>90%,Kappa系数在0.80以上,表明基于30 m空间分辨率的Landsat遥感影像进行土地利用类型变化监测具有非常高的可靠性。

      雄安新区设立前近20 a的生态质量变化趋势与传统城镇化建设带来的生态质量变化趋势相似[25]。雄安新区设立后,生态优先、绿化发展的建设理念使新区从传统的外延扩张模式转变为生态保护与经济社会协调的内敛发展模式,“千年秀林”绿化工程对生态质量的改善起到了很大作用,尤其是雄县东南部区域生态质量提升明显,这与刘礼群等[16]对2014—2020年雄安新区生态系统服务价值增益区域评估一致,安新县由于白洋淀及其周边生态环境的管理严格,生态质量变化相对稳定。土地利用变化会改变区域生态格局并影响生态质量变化,传统城镇建设方式下的土地利用变化会持续造成区域生态环境质量的下降[26]。新区通过未利用地造林、退耕还林等方式建设“千年秀林”绿色基底,显著提高了新区生态质量[27]

      传统城镇化扩张造成建设用地增加,新区成立节点期的耕地转为未利用地,这些都导致了明显的区域生态质量退化。本研究表明:耕地转未利用面积比每增加10%,生态质量的退化面积比约增加8%,这与施婷婷等对建设用地生态评估结果相近[28]

      新区建设阶段,林地的增加、未利用地的减少明显促进了新区生态质量改善,本研究表明:未利用地向林地和耕地的转变能有效提高新区生态质量,这与王志杰等[22]对贵阳花溪的研究结果相近。对于雄安新区而言,生态质量改善是保障生态环境状况的关键原因,植被的恢复与未利用地的合理规划对于雄安新区生态质量的改善具有积极的促进作用。由于新区林地主要由耕地和未利用地转化而来,且新造林时间较短,森林生态系统尚处于早期阶段,土地利用转化带来的生态效益增量还不明显[29],随着“千年秀林”的生长,雄安新区生态质量将会持续改善。

      后续研究将基于Google Earth Engine平台融合多个时相的影像进行信息提取,在分析区域生态质量的影响因素时,应加入生物气候、人类活动等因子,进行全要素分析。

    • 本研究发现:2000—2017年,雄安新区土地利用变化面积呈“两增三减”特征,耕地主要转向建设用地和未利用地;2017—2020年,土地利用变化特征与传统城镇化阶段不同,耕地与未利用地主要转向林地。2000—2017年雄安新区生态质量呈明显退化趋势,RSEI均值由2000年的0.62下降到2017年的0.57,在空间上呈“总体退化、局部改善”的特征;2017—2020年雄安新区生态质量呈轻微改善趋势,RSEI均值由2017的0.57上升到2020年的0.59,该研究区总体的生态质量在这3 a基本维持稳定且有好转趋势。生态质量空间分布及其变化与土地利用类型的分布变化在空间上基本吻合。生态质量较好的区域主要分布在耕地、林地等区域,生态质量退化与耕地、林地面积的退化减少和建设用地、未利用地的增加在空间上有直观的对应关系。在当前建设水平和1 km空间尺度下,未利用地转耕地面积比每增加10%,生态质量改善的面积比约增加13%,未利用地转林地面积比增加10%,生态质量改善的面积比约增加7%。这表明对于雄安新区而言,植被的恢复与建设对于生态质量的好转具有积极的促进作用。

Reference (29)

Catalog

    /

    DownLoad:  Full-Size Img  PowerPoint
    Return
    Return