Turn off MathJax
Article Contents

HUANG Yong, YAN Shuang, YIN Xiaojie. Trends and driving factors of vegetation changes in Chongqing[J]. Journal of Zhejiang A&F University, 2026, 43(X): 1−10 doi:  10.11833/j.issn.2095-0756.20250488
Citation: HUANG Yong, YAN Shuang, YIN Xiaojie. Trends and driving factors of vegetation changes in Chongqing[J]. Journal of Zhejiang A&F University, 2026, 43(X): 1−10 doi:  10.11833/j.issn.2095-0756.20250488

OnlineFirst articles are published online before they appear in a regular issue of the journal. Please find and download the full texts via CNKI.

Trends and driving factors of vegetation changes in Chongqing

DOI: 10.11833/j.issn.2095-0756.20250488
  • Received Date: 2025-09-08
  • Accepted Date: 2026-04-30
  • Rev Recd Date: 2026-04-28
  •   Objective  The evolution of vegetation coverage reflects regional ecological environment changes. This study aims to explore the vegetation restoration status and driving mechanism in the karst rocky desertification area of Chongqing City, so as to provide references for regional ecological protection and sustainable development.   Method  Based on the Google Earth Engine (GEE) cloud computing platform, the spatiotemporal patterns of vegetation coverage in different areas of Chongqing from 2000 to 2020 were analyzed. A Generalized Additive Model (GAM) was employed to investigate the driving mechanism of vegetation changes from both socioeconomic and natural factor perspectives.   Result  (1) In Chongqing, the normalized vegetation index in 93% of the area showed an upward trend, and the areas with remarkable vegetation restoration effects were concentrated in the west and the northeast. (2) Among the socioeconomic factors, GDP had a relatively weak impact on vegetation coverage. The increase in road network density was synchronous with the decrease in vegetation coverage area. The population density had an overall negative impact on vegetation coverage changes, and this impact was significant. (3) Among natural factors, the increase in precipitation and soil layer thickness promoted vegetation restoration to varying degrees, while temperature rise had a negative impact on vegetation growth. Compared to rocky desertification areas, vegetation in non-rocky desertification areas responded more significantly and sensitively to natural driving factors, and soil layer thickness and temperature could better explain changes in vegetation coverage. (4) Over the past 21 years, the rocky desertification area in Chongqing decreased by 5.3%, indicating significant overall improvement. The areas with a notable reduction in rocky desertification area also exhibited a more pronounced increasing trend in vegetation coverage.   Conclusion  The overall restoration effect of vegetation in Chongqing has achieved favorable results, and population density, soil layer thickness, and temperature have a significant impact on the trend of vegetation change. There is a synergistic evolutionary relationship between the reduction in rocky desertification area and the increase in vegetation coverage. In ecological restoration and management, it is essential to consider the mediating role of rocky desertification. Precise, region-specific, and classification-based measures should be implemented. [Ch, 5 fig. 5 tab. 42 ref.]
  • [1] DING Sirui, ZHAO Yihe, ZHAO Tingning, JIANG Qun’ou, JIA Yafan, SU Xinyu, YANG Qing.  Analysis of spatiotemporal evolution characteristics and driving factors of land desertification in Beijing from 1990 to 2020 . Journal of Zhejiang A&F University, doi: 10.11833/j.issn.2095-0756.20250437
    [2] CAO Yaochang, WANG Xu, FENG Hanhua, Baoyinmanda, GUO Hao, ZHOU Guangyi, HE Gongxiu.  Community characteristics and carbon storage of natural forests in rocky desertification areas of Northern Guangdong . Journal of Zhejiang A&F University, doi: 10.11833/j.issn.2095-0756.20250170
    [3] ZHU Wei, GUO Hongying, TAN Qingbi, LUO Yongjun, NIU Lixia.  Spatiotemporal evolution and driving factors of vegetation coverage in the Qingjiang Estuary of Yueqing Bay from 2003 to 2024 . Journal of Zhejiang A&F University, doi: 10.11833/j.issn.2095-0756.20250522
    [4] WANG Yamin, CHEN Caihong, SHE Jiyun.  Spatio-temporal evolution of landscape patterns and their driving factors in Xinhua County based on the POGD-MGWR model . Journal of Zhejiang A&F University, doi: 10.11833/j.issn.2095-0756.20250119
    [5] DING Xinxin, TANG Luyao, ZHANG Bona, YE Linfeng, XIE Jiangbo, WANG Zhongyuan.  Adaptive strategies of twig functional traits in Robinia pseudoacacia along a precipitation gradient and their driving mechanisms . Journal of Zhejiang A&F University, doi: 10.11833/j.issn.2095-0756.20240623
    [6] LAN Mengyao, ZHOU Dezhi, GUAN Yinghui.  Spatiotemporal variation and driving factors of normalized difference vegetation index (NDVI) in Yan’an City . Journal of Zhejiang A&F University, doi: 10.11833/j.issn.2095-0756.20230610
    [7] ZOU Weimin, DING Jun, HUANG Zihao, HUANG Lei, SONG Meixuan, LI Xuejian, DU Huaqiang.  Remote sensing monitoring of subtropical forest disturbance and restoration in Songyang County, Zhejiang Province . Journal of Zhejiang A&F University, doi: 10.11833/j.issn.2095-0756.20230324
    [8] CHEN Qi, ZHANG Chao, TIAN Xiangyun, SHI Xiaorong, ZHANG Yuwei, WANG Yan.  Spatio-temporal evolution process of rocky desertification in Yunnan Province from 2000 to 2020 . Journal of Zhejiang A&F University, doi: 10.11833/j.issn.2095-0756.20210806
    [9] ZHU Zheng, ZHAO Fan, WANG Qiuhua, GAO Zhongliang, DENG Xiaofan, HUANG Penggui.  Driving factors of forest fire and fire risk zoning in Kunming City . Journal of Zhejiang A&F University, doi: 10.11833/j.issn.2095-0756.20210339
    [10] YANG Bo, WANG Shaojun, ZHAO Shuang, ZHANG Lulu, ZHANG Kunfeng, FAN Yuxiang, XIE Lingling, WANG Zhengjun, GUO Zhipeng, XIAO Bo.  Effects of arbuscular mycorrhizal fungi symbiosis on growth and photosynthetic characteristics of Fraxinus malacophylla in rocky desertification habitats . Journal of Zhejiang A&F University, doi: 10.11833/j.issn.2095-0756.20210740
    [11] SHAO Han, WANG Hu, WANG Yan, XU Hongfeng, SU Qian, LIU Yungen.  Effects of different land use modes on soil fertility and heavy metal contents in karst rocky desertification area . Journal of Zhejiang A&F University, doi: 10.11833/j.issn.2095-0756.20210437
    [12] SUI Xiran, WU Lifang, WANG Yan, WANG Ziquan, XIAO Yuxin, LIU Yungen, YANG Bo.  Characteristics of nutrient and enzyme activity in soil aggregates of different rocky desertification levels in central Yunnan Plateau . Journal of Zhejiang A&F University, doi: 10.11833/j.issn.2095-0756.20210168
    [13] ZHOU Siyi, YIN Xiaojie, TANG Ruiquan, WU Pengfei.  Evaluation of eco-environmental quality in typical rocky desertification areas in the upper reaches of the Yangtze River . Journal of Zhejiang A&F University, doi: 10.11833/j.issn.2095-0756.20210523
    [14] XU Li, PENG Haoxian, PAN Ping, OUYANG Xunzhi, YU Xiao, ZHANG Min, ZHOU Qiaoqing.  Vegetation coverage and its spatial pattern changes in Xingguo County, Jiangxi Province . Journal of Zhejiang A&F University, doi: 10.11833/j.issn.2095-0756.20200792
    [15] ZHANG Shuting, WANG Xiaohui, PENG Daoli, JI Ping, LIU Hua, LING Chengxing, HOU Ruixia.  Monitoring of vegetation coverage change in hilly and gully regions on the Loess Plateau . Journal of Zhejiang A&F University, doi: 10.11833/j.issn.2095-0756.20200136
    [16] TIAN Di, LIU Zheng, HU Yalin.  Spatial-temporal characteristics of vegetation coverage and the relationship to topographic factors in Fuzhou City . Journal of Zhejiang A&F University, doi: 10.11833/j.issn.2095-0756.2019.06.013
    [17] LIU Peng, WANG Yan, LIU Zongbin, GUO Yujing, ZHANG Zixia, LI Xiangwang, YANG Bo.  Distribution and division of stony desertification on county scale . Journal of Zhejiang A&F University, doi: 10.11833/j.issn.2095-0756.2019.05.016
    [18] WU Linshi, CAO Fuxiang, PENG Jiqing, CAO Jiwu, XU Yongfu, DONG Xujie, XU Wen.  Plant community and species diversity in rocky desert areas of Southern Hunan . Journal of Zhejiang A&F University, doi: 10.11833/j.issn.2095-0756.2016.02.008
    [19] ZHANG Chao, YU Shu-quan, LI Tu-sheng.  Image analysis of vegetation coverage and changes (1994 - 2007) in Qingyuan County using multi-temporal Landsat remote sensing . Journal of Zhejiang A&F University, doi: 10.11833/j.issn.2095-0756.2011.01.012
    [20] WANG De-lu, ZHU Shou-qian, HUANG Bao-long.  Internal factors influencing Karst rocky desertification . Journal of Zhejiang A&F University,
  • [1]
    PIAO Shilong, WANG Xuhui, PARK T, et al. Characteristics, drivers and feedbacks of global greening[J]. Nature Reviews Earth & Environment, 2020, 1(1): 14−27. DOI: 10.1038/s43017-019-0001-x.
    [2]
    PIAO Shilong, WANG Xuhui, CIAIS P, et al. Changes in satellite-derived vegetation growth trend in temperate and boreal Eurasia from 1982 to 2006[J]. Global Change Biology, 2011, 17(10): 3228−3239. DOI: 10.1111/j.1365-2486.2011.02419.x.
    [3]
    BRANDT M, RASMUSSEN K, PEÑUELAS J, et al. Human population growth offsets climate-driven increase in woody vegetation in sub-Saharan Africa[J]. Nature Ecology & Evolution, 2017, 1(4): 81. DOI: 10.1038/s41559-017-0081.
    [4]
    HUANG Haoben, XU Hailiang, LIN Tao, et al. Spatio-temporal variation characteristics of NDVI and its response to climate change in the Altay region of Xinjiang from 2001 to 2020[J]. Acta Ecologica Sinica, 2022, 42(7): 2798−2809. DOI: 10.5846/stxb202107021768.
    [5]
    WANG Chao, HOU Peng, LIU Xiaoman, et al. Spatiotemporal changes in vegetation cover of the national key ecosystem protection and restoration project areas, China[J]. Acta Ecologica Sinica, 2023, 43(21): 8903−8916. DOI: 10.20103/j.stxb.202303100453.
    [6]
    GAO Lin, WANG Xiaofei, JOHNSON B A, et al. Remote sensing algorithms for estimation of fractional vegetation cover using pure vegetation index values: a review[J]. ISPRS Journal of Photogrammetry and Remote Sensing, 2020, 159: 364−377. DOI: 10.1016/j.isprsjprs.2019.11.018.
    [7]
    SHEN Mingtan, TAN Bingxiang, QI Zhao, et al. Temporal and spatial variation characteristics of vegetation coverage in karst rocky desertification area of southeast Yunnan: a case study of Yanshan County[J]. Forest Inventory and Planning, 2022, 47(5): 1−11. DOI: 10.3969/j.issn.1671-3168.2022.05.001.
    [8]
    XIE Huijun, XIE Yawei, CAO Cong, et al. Spatial-temporal variation characteristics and driving forces of vegetation net primary productivity in Chongqing[J]. Resources and Environment in the Yangtze Basin, 2023, 32(12): 2581−2597. DOI: 10.11870/cjlyzyyhj202312011.
    [9]
    YU Chenyu, XIAO Zuolin, LIU Rui, et al. Analysis of human activities as driving forces of vegetation cover changes in mountainous areas of Southwest China from 2000 to 2020: a case study in Chongqing[J]. Acta Ecologica Sinica, 2022, 42(17): 7177−7186. DOI: 10.5846/stxb202110112857.
    [10]
    LI Zhongfeng, LI Xuemei. Climatic factors variation and its relation with spatio-temporal changes of vegetation cover in Chongqing, China[J]. Journal of Mountain Science, 2014, 32(6): 717−724. DOI: 10.3969/j.issn.1008-2786.2014.06.010.
    [11]
    TIAN Di, LIU Zheng, HU Yalin. Spatial-temporal characteristics of vegetation coverage and the relationship to topographic factors in Fuzhou City[J]. Journal of Zhejiang A&F University, 2019, 36(6): 1158−1165. DOI: 10.11833/j.issn.2095-0756.2019.06.013.
    [12]
    LAN Mengyao, ZHOU Dezhi, GUAN Yinghui. Spatiotemporal variation and driving factors of normalized difference vegetation index (NDVI) in Yan’an City[J]. Journal of Zhejiang A&F University, 2024, 41(6): 1293−1302. DOI: 10.11833/j.issn.2095-0756.20230610.
    [13]
    LIU Xiaoping, HU Guohua, CHEN Yimin, et al. High-resolution multi-temporal mapping of global urban land using Landsat images based on the Google Earth Engine Platform[J]. Remote Sensing of Environment, 2018, 209: 227−239. DOI: 10.1016/j.rse.2018.02.055.
    [14]
    LI Yanlin, HE Yi, ZHANG Yaru, et al. Spatiotemporal evolutionary analysis of rainfall erosivity during 1901−2017 in Beijing, China[J]. Environmental Science and Pollution Research, 2022, 29(2): 2510−2522. DOI: 10.1007/s11356-021-15639-y.
    [15]
    TIAN Yichao, HUANG Yuanlin, ZHANG Qiang, et al. Spatiotemporal distribution of net primary productivity and its driving factors in the Nanliu River basin in the Beibu Gulf[J]. Acta Ecologica Sinica, 2019, 39(21): 8156−8171. DOI: 10.5846/stxb201810182256.
    [16]
    LIU Can. Study on the Effect of Vegetation Restoration on Soil Moisture on the Loess Plateau[D]. Shijiazhuang: Hebei GEO University, 2022.
    [17]
    LAI Jiangshan, TANG Jing, LI Tingyuan, et al. Evaluating the relative importance of predictors in Generalized Additive Models using the gam. hp R package[J]. Plant Diversity, 2024, 46(4): 542−546. DOI: 10.1016/j.pld.2024.06.002.
    [18]
    WOOD S N. Stable and efficient multiple smoothing parameter estimation for generalized additive models[J]. Journal of the American Statistical Association, 2004, 99(467): 673−686. DOI: 10.1198/016214504000000980.
    [19]
    WOOD S N. Fast stable direct fitting and smoothness selection for generalized additive models[J]. Journal of the Royal Statistical Society, Series B (Statistical Methodology), 2008, 70(3): 495−518. DOI: 10.1111/j.1467-9868.2007.00646.x.
    [20]
    ZHOU Ji, FU Shihua, PENG Li, et al. Effect of ozone and PM2.5 on chronic obstructive pulmonary disease deaths and the effect modification by the air temperature[J]. China Environmental Science, 2021, 41(12): 5904−5911. DOI: 10.3969/j.issn.1000-6923.2021.12.047.
    [21]
    ZHANG Ying, ZHANG Jie, WANG Shigong, et al. Interactive effects of the influcening factors on the changes of PM2.5 concentration[J]. China Environmental Science, 2021, 41(10): 4518−4528. DOI: 10.19674/j.cnki.issn1000-6923.2021.0349.
    [22]
    HOU Zihang. Identification and Quantitative Evaluation of Stone Mosensing Based on Deep Learning[D]. Changsha: Central South University of Forestry & Technology, 2021.
    [23]
    LIAO Weihua, WEI Yifang, WEI Zhiyan. Exploring innovative assessment and driving mechanisms for achieving land degradation neutrality in rocky desertification areas: a case study of Yunnan-Guangxi-Guizhou, China[J]. Ecological Informatics, 2025, 90: 103310. DOI: 10.1016/j.ecoinf.2025.103310.
    [24]
    ZHANG Wenyuan, WANG Baitian. Discussion on classification and gradation of karst rocky desertification in Guizhou[J]. Journal of Nanjing Forestry University (Natural Sciences Edition), 2015, 39(2): 148−154. DOI: 10.3969/j.issn.1000-2006.2015.02.026.
    [25]
    YANG Yuxin. Analysis of failure number change based on GAM model[J]. Computer Science and Application, 2019(7): 1255−1265. DOI: 10.12677/CSA.2019.97141.
    [26]
    DU Ying, CUI Erqian, TANG Songbo, et al. Widespread negative impact of daytime warming on vegetation productivity[J]. One Earth, 2025, 8(5): 101284. DOI: 10.1016/j.oneear.2025.101284.
    [27]
    WANG Mingyu, WU Chengyong, CHEN Kelong. Spatiotemporal changes of vegetation greenness and their influencing factors in the Qinghai Lake Basin[J]. Journal of Desert Research, 2025, 45(5): 289−300. DOI: 10.7522/j.issn.1000-694X.2025.00126.
    [28]
    LIU Yinge, HOU Yujun, LIN Maoqi, et al. Temporal and spatial dynamic changes of vegetation NDVI and its driving factors in Loess Plateau of northern Shaanxi Province[J]. Agriculture and Technology, 2025, 45(18): 73−79. DOI: 10.19754/j.nyyjs.20250930017.
    [29]
    LIAO Tao, WEN Zhaofei, ZHOU Xu, et al. Spatial stratified heterogeneity of forest growth and its drivers in the Three Gorges Reservoir Region (Chongqing part), China[J]. Acta Ecologica Sinica, 2022, 42(10): 4076−4090. DOI: 10.5846/stxb202105241351.
    [30]
    HUANG Qi, PENG Li, LI Sainan, et al. Analysis of the nonlinear relationship between karst vegetation cover and driving factors based on GAM[J]. China Environmental Science, 2023, 43(5): 2489−2496. DOI: 10.3969/j.issn.1000-6923.2023.05.041.
    [31]
    ZHANG Maolin, HAO Guang, LIU Qiang, et al. Research on design and construction of chongqingdong railway station comprehensive transportation hub based the concept of station-city integration[J]. Railway Technical Innovation, 2024(3): 110−115. DOI: 10.19550/j.issn.1672-061x.2024.05.09.008.
    [32]
    XU Yong, ZHAO Chun, DOU Shiqing, et al. Dynamic variation of vegetation cover and its relationship with population density in Bohai rim region during 2000—2020[J]. Bulletin of Soil and Water Conservation, 2022, 42(2): 264−274. DOI: 10.13961/j.cnki.stbctb.2022.02.036.
    [33]
    WANG Dianru, XUE Shaobing. The impact of population density on ecosystem in China—based on the two-way fixed effects model[J]. Journal of Hebei GEO University, 2022, 45(5): 97−103. DOI: 10.13937/j.cnki.hbdzdxxb.2022.05.012.
    [34]
    XU Hao, LI Wei, LIU Wei, et al. Spatio-temporal evolution of Nanjing’s urban green space pattern and its influencing factors[J]. Journal of Zhejiang A&F University, 2023, 40(2): 407−416. DOI: 10.11833/j.issn.2095-0756.20220332.
    [35]
    WANG Jialu, LI Weijie, WANG Yong, et al. Spatial-temporal variation of NDVI and its responses to hydrothermal condition in rocky desertification area of Chongqing City from 2005 to 2014[J]. Research of Soil and Water Conservation, 2021, 28(2): 217−223. DOI: 10.13869/j.cnki.rswc.20200904.001.
    [36]
    ZHANG Shihao, XIONG Kangning, MIN Xiaoying, et al. Vegetation vulnerability in karst desertification areas is related to land-atmosphere feedback induced by lithology[J]. CATENA, 2024, 247: 108542. DOI: 10.1016/j.catena.2024.108542.
    [37]
    LI Junqing. Forest Ecology[M]. 3rd ed. Beijing: Higher Education Press, 2017.
    [38]
    LI Qian, WU Qiang. Research on the current situation and development trend of karst rocky desertification control in China[J]. Journal of Green Science and Technology, 2025, 27(10): 50−54, 59. DOI: 6663/j.cnki.lskj.2025.10.034.
    [39]
    XING Yun, LI Zuran, LI Yuan. Recent advances in studies of the effects of plant communities on soil organic carbon and its fractions in Karst areas of China[J/OL]. Journal of Agro-Environment Science, 1−17. 2025-10-11. https://link.cnki.net/urlid/12.1347.S.20251010.1616.002.
    [40]
    LI Qiang. Research hotspots of karst in 2016 based on bibliometrics analysis[J]. Advances in Earth Science, 2017, 32(5): 535−545. DOI: 10.11867/j.issn.1001-8166.2017.05.0535.
    [41]
    JING Yiran. Common Plants and Their High Calcium Adaptation in Rocky Desertification Area in Southwestern Hunan[D]. Changsha: Central South University of Forestry & Technology, 2017.
    [42]
    LIU Liling. Characteristics and Interaction of Vegetation Soil Microorganism of Different Plantations in Rocky Desertification Area[D]. Changsha: Central South University of Forestry & Technology, 2021.
  • 加载中
通讯作者: 陈斌, bchen63@163.com
  • 1. 

    沈阳化工大学材料科学与工程学院 沈阳 110142

  1. 本站搜索
  2. 百度学术搜索
  3. 万方数据库搜索
  4. CNKI搜索

Figures(5)  / Tables(5)

Article views(104) PDF downloads(13) Cited by()

Related
Proportional views

Trends and driving factors of vegetation changes in Chongqing

doi: 10.11833/j.issn.2095-0756.20250488

Abstract:   Objective  The evolution of vegetation coverage reflects regional ecological environment changes. This study aims to explore the vegetation restoration status and driving mechanism in the karst rocky desertification area of Chongqing City, so as to provide references for regional ecological protection and sustainable development.   Method  Based on the Google Earth Engine (GEE) cloud computing platform, the spatiotemporal patterns of vegetation coverage in different areas of Chongqing from 2000 to 2020 were analyzed. A Generalized Additive Model (GAM) was employed to investigate the driving mechanism of vegetation changes from both socioeconomic and natural factor perspectives.   Result  (1) In Chongqing, the normalized vegetation index in 93% of the area showed an upward trend, and the areas with remarkable vegetation restoration effects were concentrated in the west and the northeast. (2) Among the socioeconomic factors, GDP had a relatively weak impact on vegetation coverage. The increase in road network density was synchronous with the decrease in vegetation coverage area. The population density had an overall negative impact on vegetation coverage changes, and this impact was significant. (3) Among natural factors, the increase in precipitation and soil layer thickness promoted vegetation restoration to varying degrees, while temperature rise had a negative impact on vegetation growth. Compared to rocky desertification areas, vegetation in non-rocky desertification areas responded more significantly and sensitively to natural driving factors, and soil layer thickness and temperature could better explain changes in vegetation coverage. (4) Over the past 21 years, the rocky desertification area in Chongqing decreased by 5.3%, indicating significant overall improvement. The areas with a notable reduction in rocky desertification area also exhibited a more pronounced increasing trend in vegetation coverage.   Conclusion  The overall restoration effect of vegetation in Chongqing has achieved favorable results, and population density, soil layer thickness, and temperature have a significant impact on the trend of vegetation change. There is a synergistic evolutionary relationship between the reduction in rocky desertification area and the increase in vegetation coverage. In ecological restoration and management, it is essential to consider the mediating role of rocky desertification. Precise, region-specific, and classification-based measures should be implemented. [Ch, 5 fig. 5 tab. 42 ref.]

HUANG Yong, YAN Shuang, YIN Xiaojie. Trends and driving factors of vegetation changes in Chongqing[J]. Journal of Zhejiang A&F University, 2026, 43(X): 1−10 doi:  10.11833/j.issn.2095-0756.20250488
Citation: HUANG Yong, YAN Shuang, YIN Xiaojie. Trends and driving factors of vegetation changes in Chongqing[J]. Journal of Zhejiang A&F University, 2026, 43(X): 1−10 doi:  10.11833/j.issn.2095-0756.20250488
  • 植被是连接土壤圈、水圈和大气圈的纽带[1],在能量交换和物质循环中扮演关键角色,是生态系统变化的直接或间接驱动力[23]。在干旱、半干旱地区植被在水土保持、防风固沙、气候调节[45]等方面发挥着不可替代的作用。因此,植被变化监测已成为全球气候变化和区域生态环境评价不可或缺的内容[6]

    石漠化发生在喀斯特地区,是由于自然气候变化和不合理的人类活动共同作用下产生的水土流失、植被退化和岩石大面积裸露的土地退化现象[7]。石漠化的严重程度会对植被恢复效果产生重要的影响,植被减少也可能导致石漠化加剧。重庆市作为长江中下游的典型石漠化地区,区域生态环境脆弱,水土流失严重,岩石裸露率高[8]。21世纪以来,随着城镇化快速扩张、产业结构调整、人口流动,以及森林工程、长江两岸绿化工程等一系列生态修复工程的实施,重庆市植被覆盖发生了深刻演变[9]。目前关于植被变化的研究多集中在分析气候等自然因子的影响,深入分析人类活动对植被覆盖变化影响的研究较少[1012],同时也缺乏对植被变化趋势与石漠化两者关系的研究。本研究选择典型石漠化地区重庆市为研究区,使用谷歌地球搜索引擎(Google Earth Engine,GEE)分析植被变化趋势,结合自然、社会因子数据,利用广义可加模型(Generalized Additive Model,GAM),区分石漠化和非石漠化地区,分析植被变化驱动因子,并探讨植被变化与石漠化两者的关系,以期促进重庆市植被保护,为当地生态建设提供理论参考。

    • GEE集成了Landsat、MODIS、Sentinel等30余种卫星数据资源,在生态系统动态分析、农业生产力预测及生物多样性保护等跨学科领域展现显著应用价值[13]。本研究中利用谷歌地球搜索引擎进行石漠化等级划分、植被覆盖度的泰尔-森(Theil-Sen,T-S)趋势分析和曼-肯德尔(Mann-Kendall,M-K)显著性检验。

    • 本研究涉及数据包括:数字高程(DEM)数据、归一化植被指数(NDVI)数据、自然因子数据、社会经济因子数据、研究区行政边界(表1)。气温、降水和归一化植被指数均来源于逐月栅格数据。气温和降水采用全年数据的单日平均作为年值,归一化植被指数则取每年12个月的月最大值。在此基础上,提取以上数据在重庆市各个区(县)范围内的栅格平均值,得到重庆市38个区(县)21年间的逐年数据。其他数据则直接以年为单位按区(县)行政边界求平均值处理后汇总,路网密度根据《重庆市统计年鉴》各区(县)数据直接得到。

      数据名称 时空分辨率 单位 年份 来源
      数字高程 90 m m 2025 地理空间数据云 https://www.gscloud.cn/search
      归一化植被指数 1月/250 m 2000—2020 MOD13A3数据集 https://lpdaac.usgs.gov/products/mod13a3v006/
      土层厚度 1 a/250 m cm 2000—2020 MODIS数据集(GEE调用) https://modis.gsfc.nasa.gov/
      年平均降水量 1月/1 km m 2000—2020 ERA5-Land数据集 https://www.ecmwf.int/en/era5-land
      年平均气温 1月/1 km 2000—2020 国家青藏高原科学数据中心 https://data.tpdc.ac.cn/zh-hans/data/71ab4677-b66c-4fd1-a004-b2a541c4d5bf
      国内生产总值 1 a/1 km 亿元 2000—2019 Scientific Date期刊论文https://www.nature.com/articles/s41597-022-01322-5
      人口密度 1 a/1 km 人∙km−2 2000—2020 LandScan数据集 https://landscan.ornl.gov/
      路网密度 1 a km∙km−2 2011—2020 《重庆市统计年鉴》
      行政边界 2024 国家基础地理信息中心 http://www.webmap.cn/

      Table 1.  Research data and information across disciplines

    • 通过GEE在线编写代码调用MODIS卫星数据集,参考文献[14],使用T-S斜率分析计算时间序列中所有数据对之间斜率的中位数,得到β,分析研究区归一化植被指数变化趋势。β>0表示时间序列存在上升趋势,β<0则相反。

      M-K显著性检验[15]则用于判断变化趋势的统计显著性。该方法通过计算标准化检验统计量Z来评估趋势的置信水平。在本研究中,Z值用于判断β所指示的归一化植被指数增减趋势是否具有统计学意义,并根据|Z|与特定阈值(1.65、1.96、2.58)的比较,将变化趋势划分为不显著、微显著、显著和极显著等不同等级[16]。通过结合β值与Z值(表2),可实现对研究区植被变化趋势及其空间分异特征的全面评估。

      β|Z|趋势类别趋势特征
      β>02.58<Z4极显著增加
      1.96<Z≤2.583显著增加
      1.65<Z≤1.962微显著增加
      Z≤1.651不显著增加
      β=0Z0无变化
      β<0Z≤1.65-1不显著减少
      1.65<Z≤1.96-2微显著减少
      1.96<Z≤2.58-3显著减少
      2.58<Z-4极显著减少

      Table 2.  Classification of trends in Mann-Kendall test

    • 在生态系统的非线性响应机制研究中,由于环境因子与生物学变量常呈现非单调响应、阈值效应等复杂关系,传统参数化线性模型往往难以准确解析此类非线性过程。GAM作为半参数化统计工具[1719],通过引入光滑函数建立响应变量与预测因子的柔性关系式,可以用来解释变量之间的非线性关系。

      本研究基于R4.3.3平台,利用GAM探索植被变化趋势驱动机制的非线性关系,采用mgcv包[20]实现。将研究区38个区(县)的逐年归一化植被指数作为响应变量,土层厚度、年平均气温、年平均降水量3个自然因子和国内生产总值、路网密度、人口密度3个社会经济因子作为解释变量,构建GAM模型,绘制响应曲线。

      GAM模型依靠参考自由度、决定系数(R2)、方差解释率、F统计值和P值来判断解释变量对归一化植被指数的影响程度[21]。其中参考自由度用来判断是否为非线性关系,参考自由度为1时说明解释变量与响应变量为线性关系,当参考自由度>1时解释变量与响应变量为非线性关系,且参考自由度的值越大,解释变量与响应变量的非线性关系越显著。R2的取值范围为0~1,R2越接近于1则表明模型越精确。方差解释率越高,表明拟合效果越优。F值用来判断影响因子的重要性程度,F值越大,表明其相对重要性越大。P值用来判断显著性,P值越小则结果越显著。

    • 通过GEE在线编写代码,调用Landsat数据,参考侯自航[22]、LIAO等[23]的研究,结合重庆市地理特点,选择植被覆盖度、岩石裸露率、坡度作为指标计算石漠化指数(quaternary rocky desertification index,QRI),并以此进行石漠化分级(表3)。植被覆盖度是反映地表覆盖情况的重要指标,与石漠化有着较显著的相关性[22];岩石裸露率表征基岩出露状况,是石漠化的直接视觉标志;坡度则影响水土保持能力和土壤侵蚀速率,是石漠化发生发展的重要地形条件[24]。三者综合能够较全面地刻画喀斯特地区的石漠化程度。

      石漠化等级 石漠化指数 石漠化等级 石漠化指数
      无石漠化 (0.00~0.15] 中度石漠化 (0.30~0.45]
      潜在石漠化 (0.15~0.25] 重度石漠化 (0.45~0.75]
      轻度石漠化 (0.25~0.30] 极重度石漠化 (0.75~1.00]

      Table 3.  Standard of rocky desertification classification

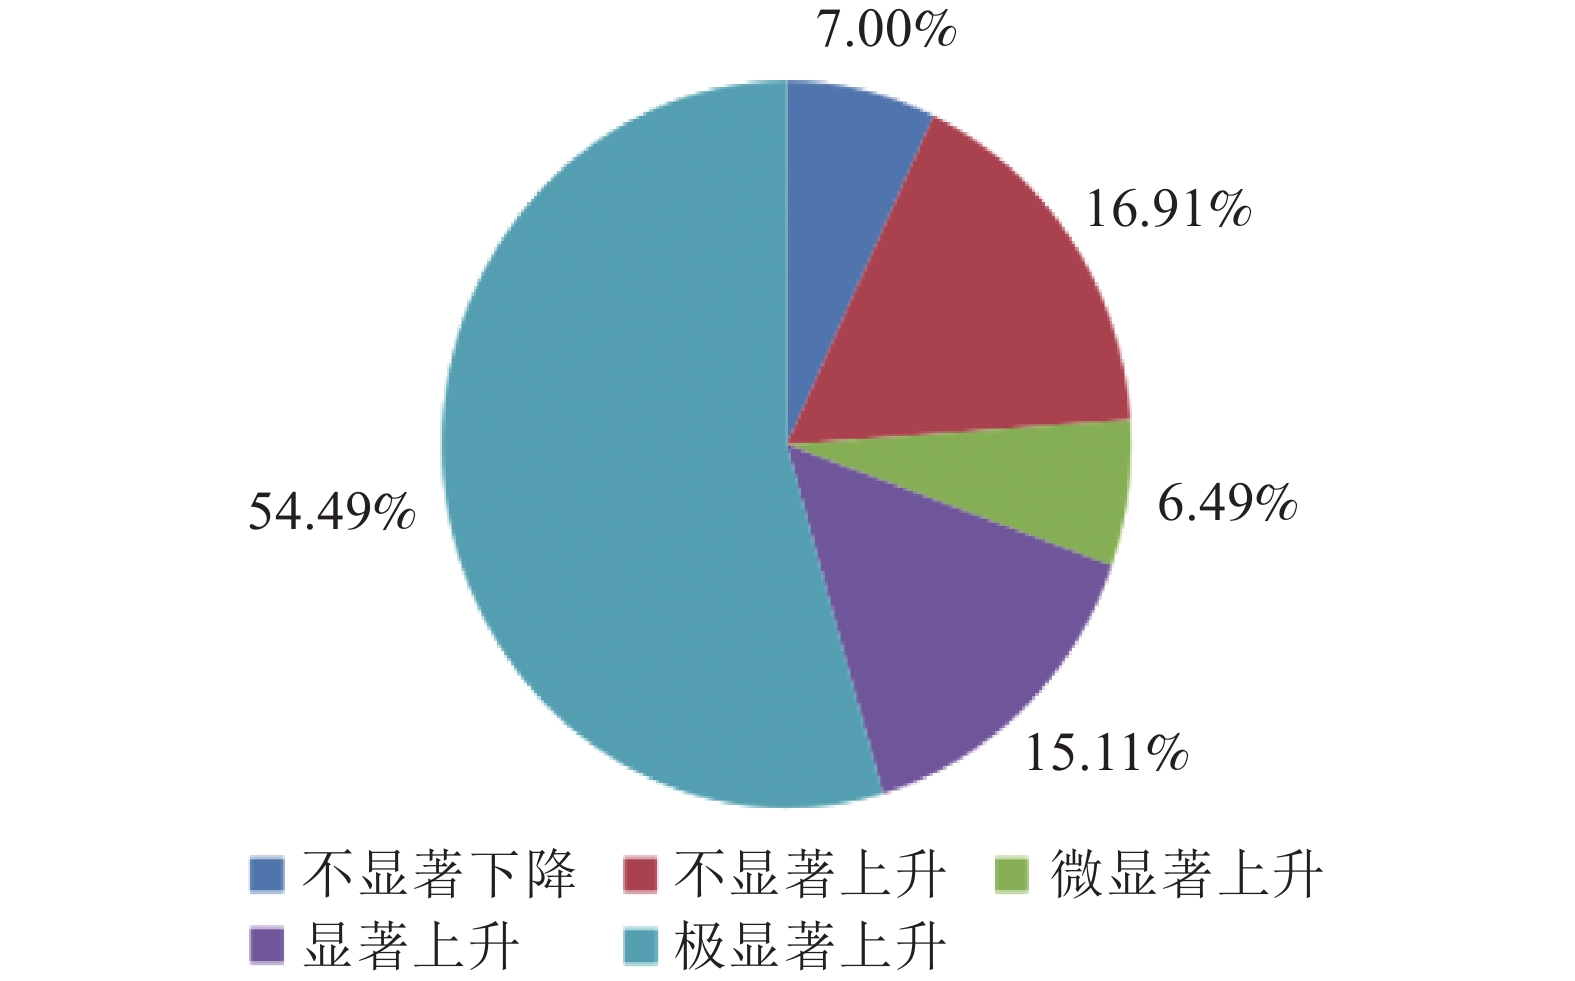
    • 在研究期间,研究区植被整体呈现良好恢复态势,其中西部和东北部部分区域植被恢复最为显著,东南部地区植被恢复程度相对较弱。植被退化区域呈零星分布,中西部存在小范围连片退化区。由图1可知:研究区内93.00%的面积区域内归一化植被指数呈增加趋势,呈现下降趋势的仅为7.00%。根据显著性划分结果判断,69.60%的面积区域内归一化植被指数具有极显著上升或显著上升趋势。这一结果表明,过去21 a间重庆市植被恢复成效显著。

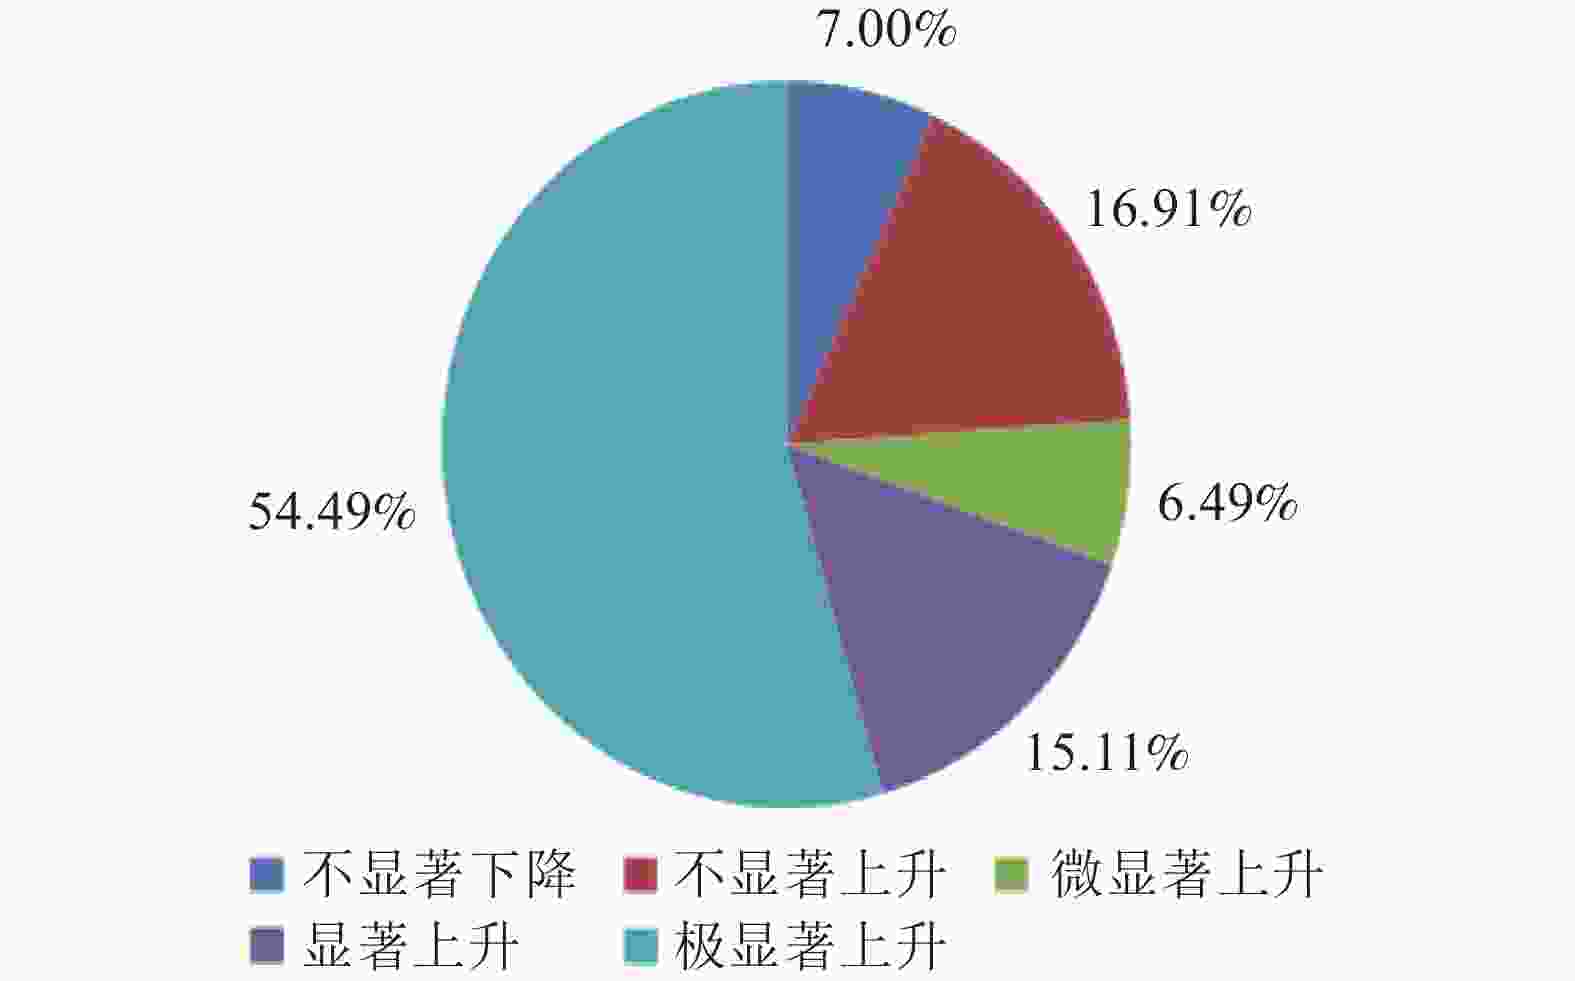
      Figure 1.  Trends of vegetation changes and proportion of significant areas in Chongqing

    • 基于GAM进行了各类参数的假设性检验(表4)。在6个驱动因子中,仅石漠化地区的年平均降水量对归一化植被指数无显著影响,其余驱动因子均在P<0.001水平上对归一化植被指数影响显著。6个驱动因子中,年平均降水量的参考自由度等于1,其与归一化植被指数之间为线性关系,但因GAM是对广义线性模型(aeneralized linear models,GLM)的推广[25],仍能利用GAM模型结果进行解释与分析。社会经济因子中,人口密度的方差解释率较高(88.9%),R2较大,为0.881,作为归一化植被指数的预测变量拟合结果较优。自然因子中,非石漠化地区的土层厚度和年平均气温方差解释率较高,分别为91.3%和50.0%,R2较大,分别为0.912和0.493,作为归一化植被指数的预测变量拟合结果较优。

      因子 参考自由度 R2 方差解
      释率/%
      F P
      国内生
      产总值
      6.383 0.004 5.1 5.79 <0.001
      路网密度 3.806 0.164 17.1 19.33 <0.001
      人口密度 57.530 0.881 88.9 100.70 <0.001
      土层
      厚度
      石漠化 2.692 0.165 17.1 21.59 <0.001
      非石
      漠化
      8.901 0.912 91.3 590.20 <0.001
      年平均
      气温
      石漠化 8.809 0.263 28.4 12.45 <0.001
      非石
      漠化
      8.694 0.493 50.0 56.89 <0.001
      年平均
      降水量
      石漠化 1.000 0.007 1.0 2.99
      非石
      漠化
      1.000 0.140 14.2 80.10 <0.001

      Table 4.  Test results of the GAM hypotheses
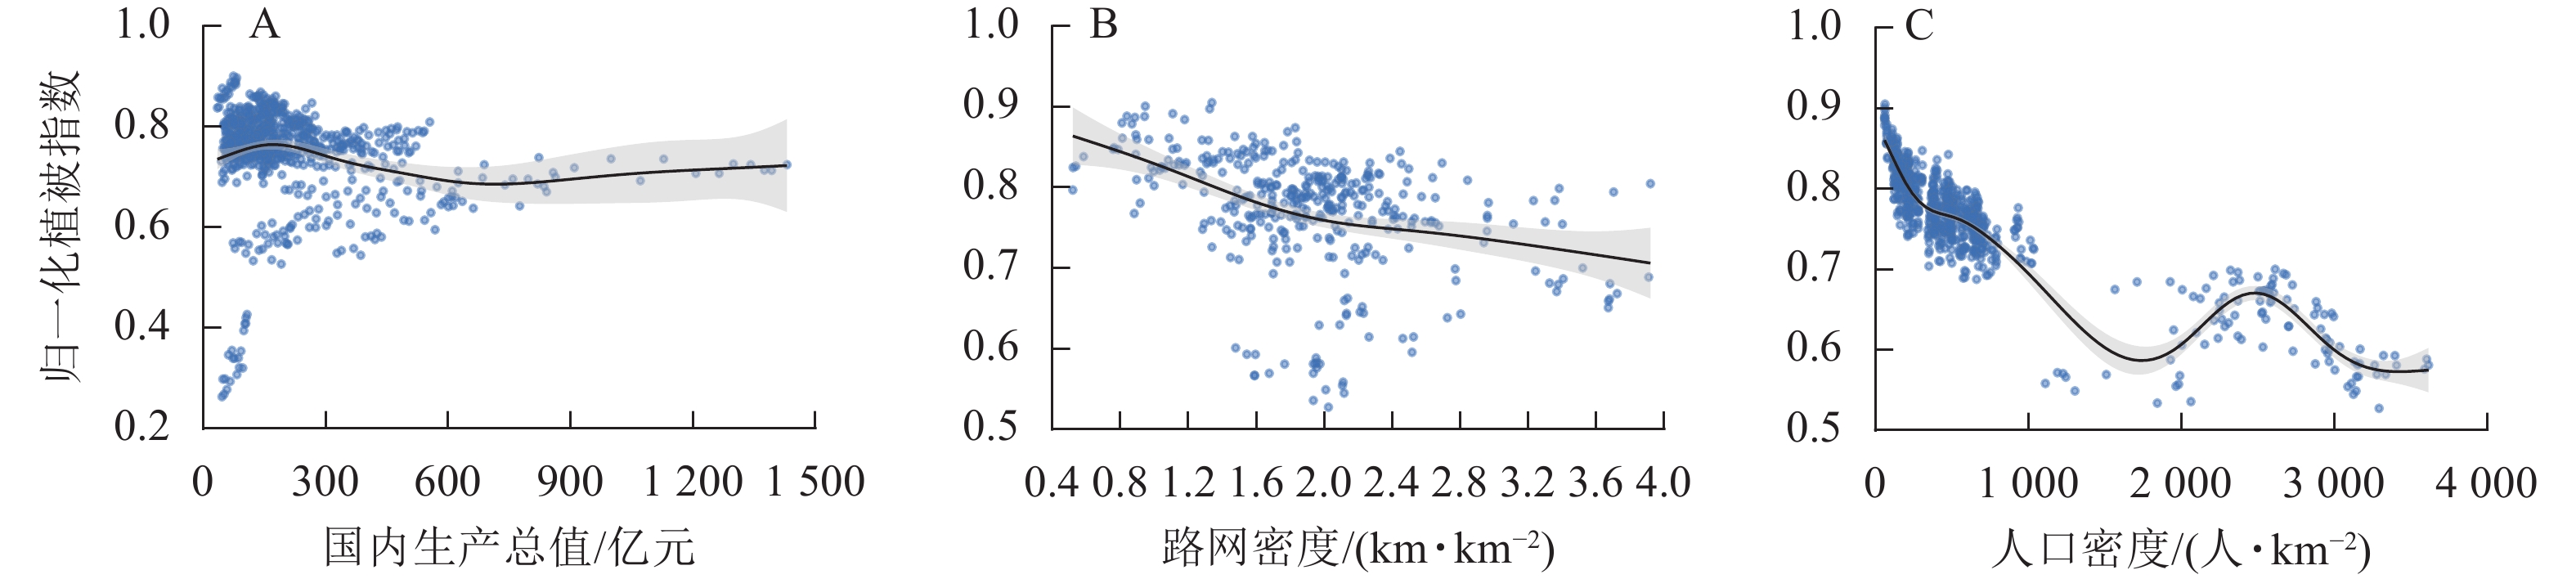
    • 图2A可知:国内生产总值对归一植被化指数变化的整体影响较小,在国内生产总值较低时归一化植被指数呈先小幅度增长再缓慢下降趋势,当国内生产总值超过约600亿元后,曲线趋于平缓。由图2B可以看出:路网密度增加,归一化植被指数逐渐减少,呈现一定同步性,反映出路网密度对植被覆盖存在一定负面影响。由图2C可知:曲线呈波动起伏趋势。在人口密度相对较低时,归一化植被指数随人口增长大幅减少;当人口密度超过约1 800人·km−2后,归一化植被指数开始随着人口增长小幅度上升;在约2 500人·km−2时到达峰值,归一化植被指数约为0.68,之后逐渐下降。

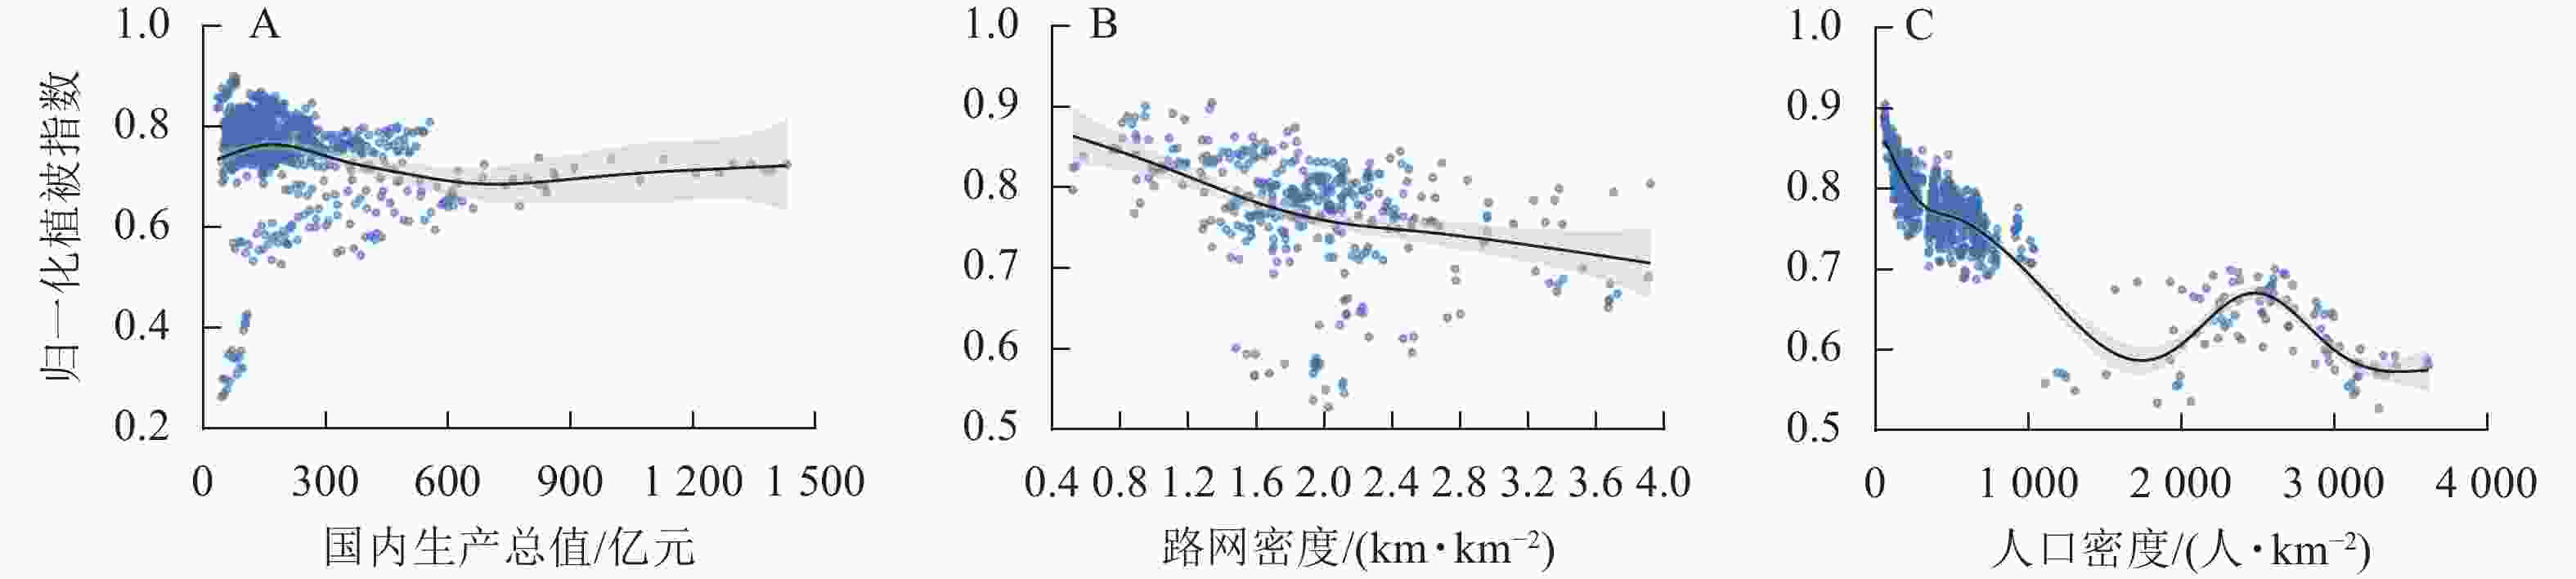
      Figure 2.  NDVI-socioeconomic factors response curve
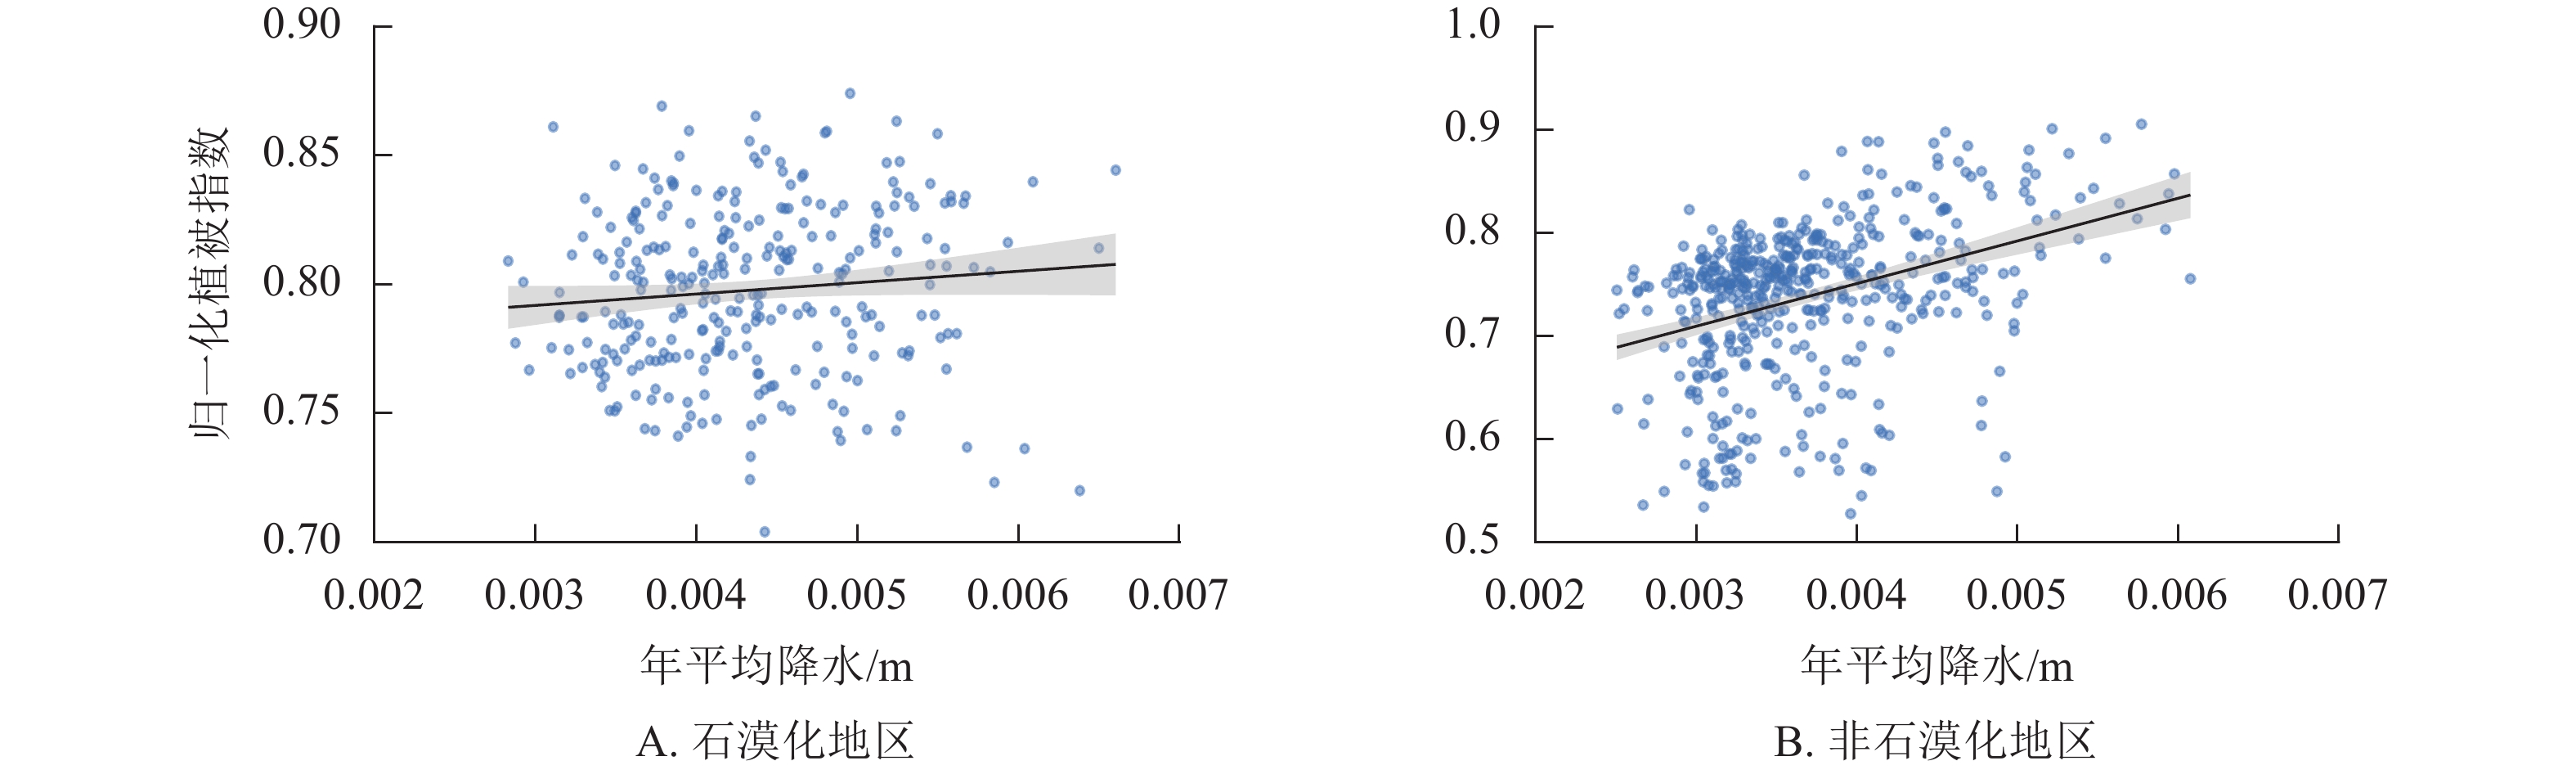
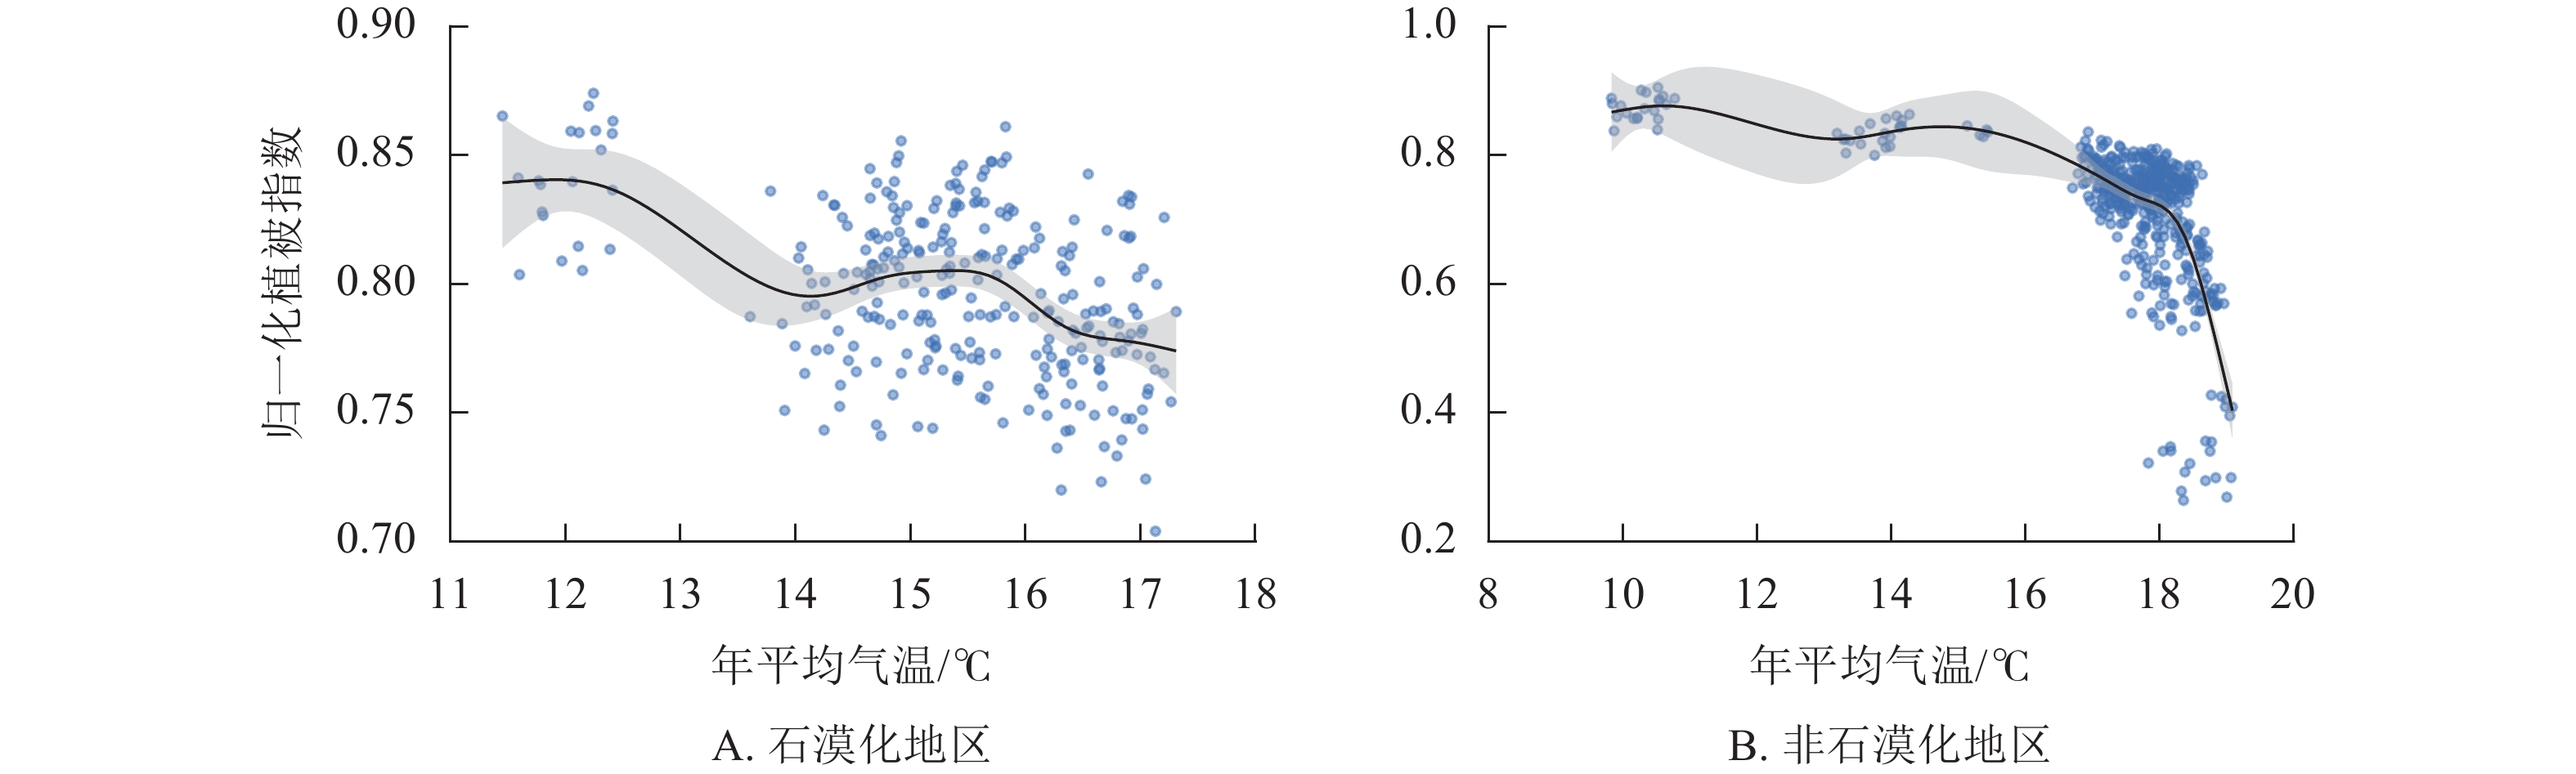
    • 图3可知:归一化植被指数随着年平均降水量的增加缓慢增长,降水促进植被生长的作用较弱。其中,石漠化地区归一化植被指数增加速率低于非石漠化地区,可能与石漠化地区土层保水持水能力弱有关。随着年平均气温的逐渐升高,归一化植被指数呈下降趋势,但在不同气温区间下降速率不同(图4)。石漠化地区归一化植被指数下降速率先急后缓,可能是由于石漠化地区气温升高对植被产生如高温胁迫、光合效率降低等负面影响[26],加之缺少有效水分的补给,对植被生长产生明显负面影响,归一化植被指数先快速下降;但因石漠化地区植被长期生长在逆境下,较强的抗逆性使其能够逐渐适应变化的环境,年平均气温进一步升高后归一化植被指数下降速率变缓。非石漠化地区归一化植被指数随年平均气温的升高,下降速率先缓后急。气温升高后,非石漠化地区植被能够依靠充足的水分产生补偿作用,减少高温毒害,但超过一定范围后补偿作用失效归一化植被指数急剧下降。

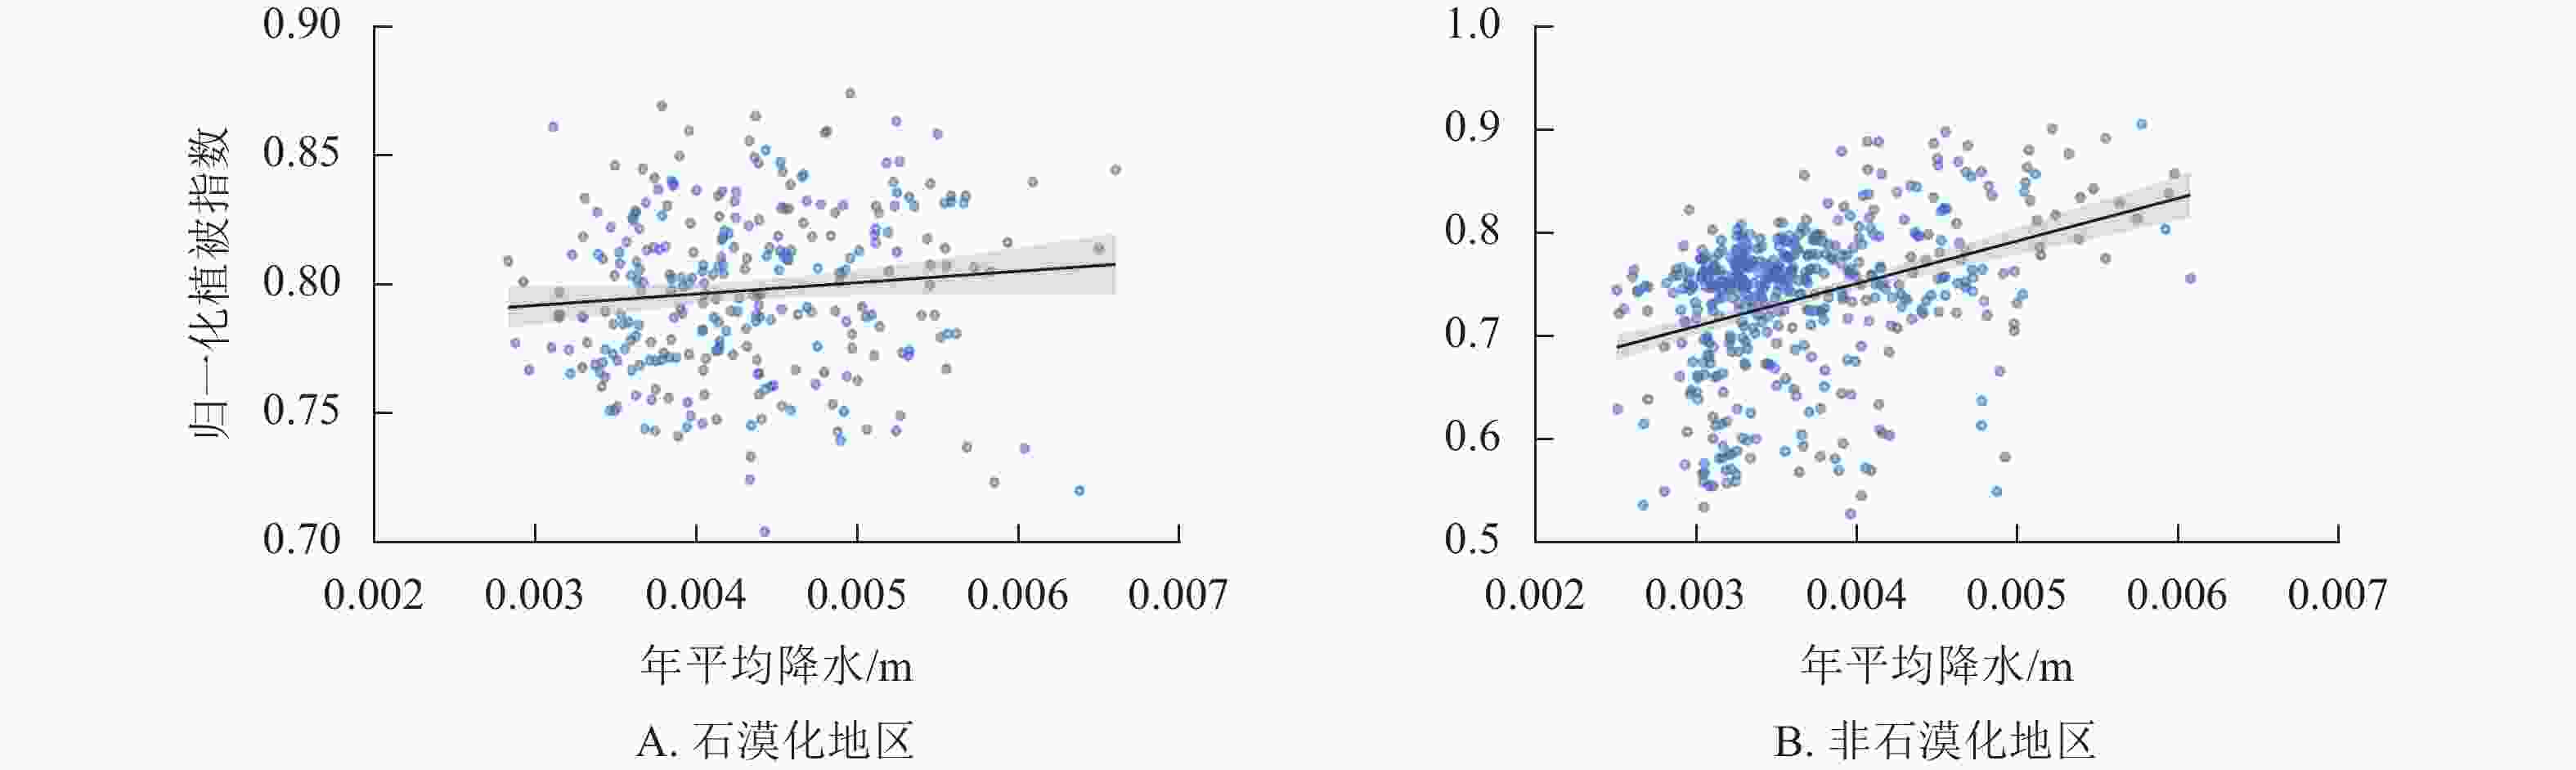
      Figure 3.  NDVI-mean annual precipitation response curve

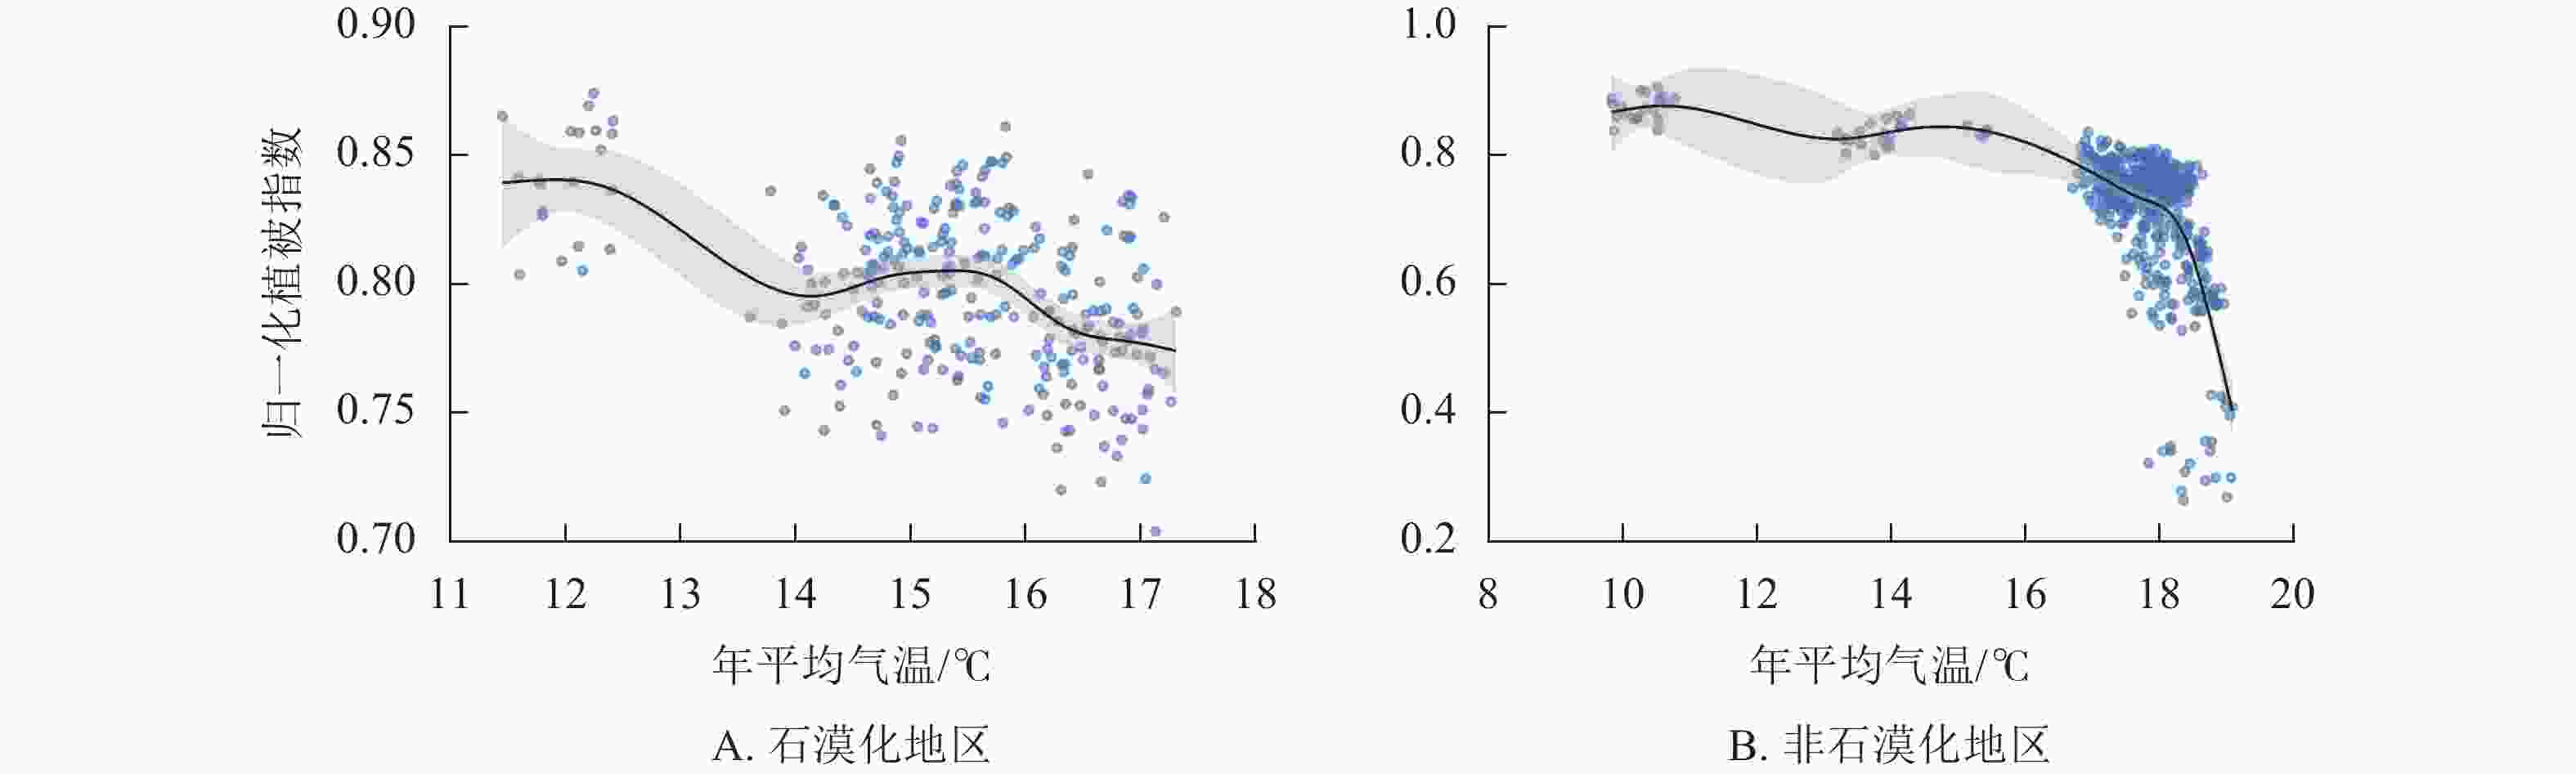
      Figure 4.  NDVI-mean annual temperature response curve
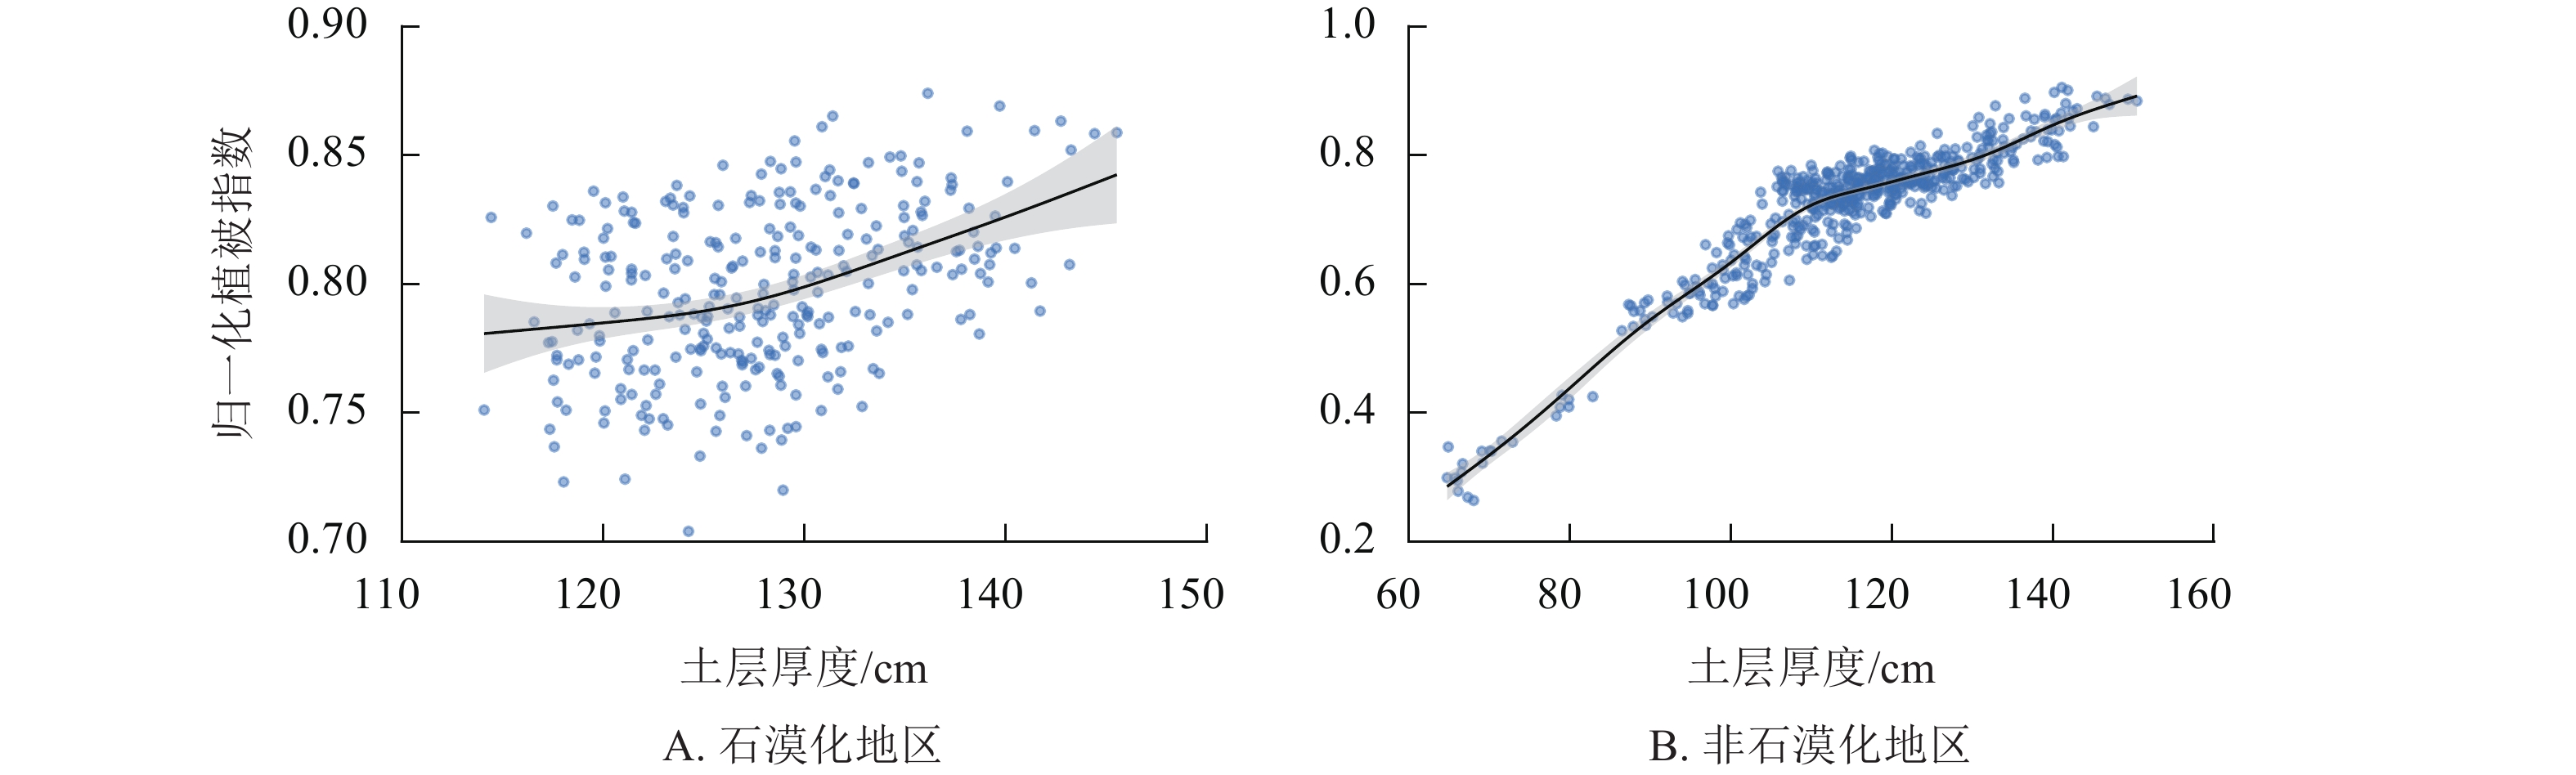
      图5可知,归一化植被指数均随土层厚度增加呈显著的增加趋势。相较于石漠化地区,非石漠化地区曲线变化幅度更大,其归一化植被指数最大值更高,最小值更低。

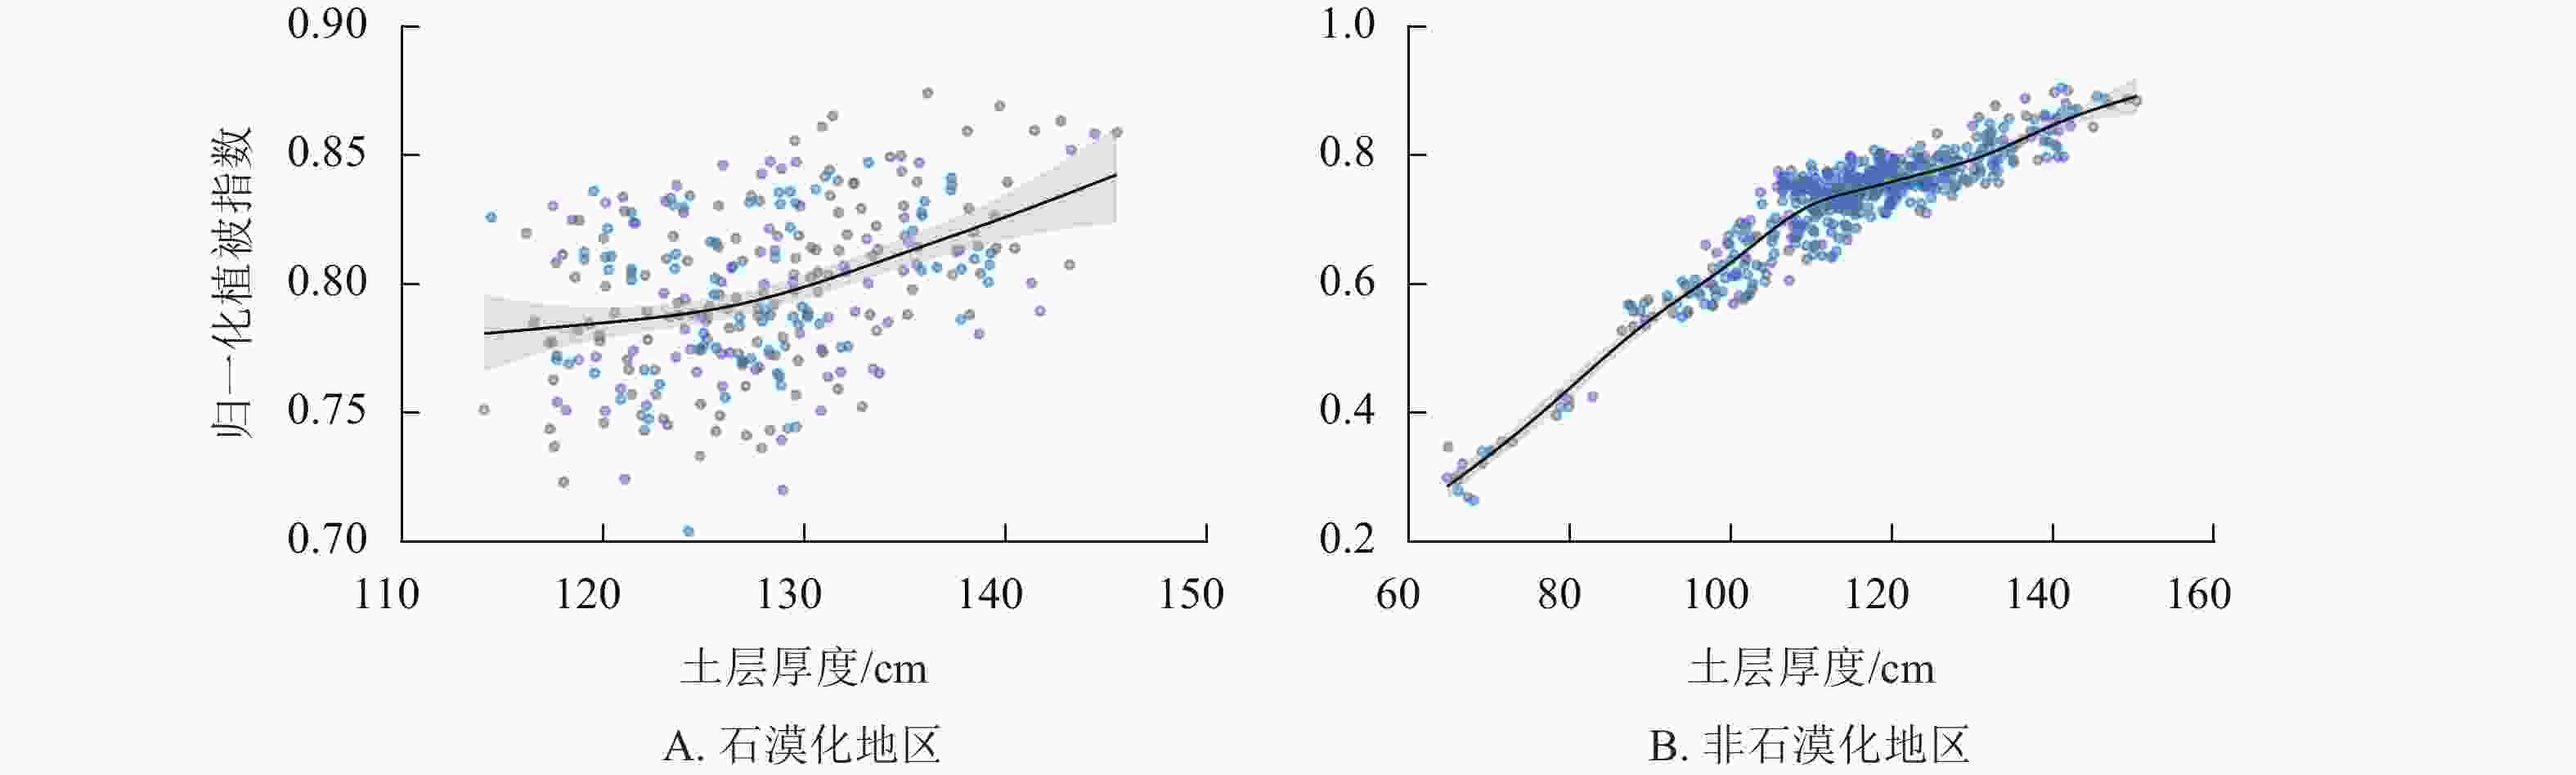
      Figure 5.  NDVI-soil depth response curve

      综合图2~5可以发现:石漠化地区和非石漠化地区归一植被指数的总体变化趋势是一致的,但波动幅度存在一定差异。相较于石漠化地区,非石漠化地区的植被对3类自然驱动因子的响应都更加显著和敏感。驱动植被变化的机制在石漠化和非石漠化地区存在差异,这解释了2.1节中的空间异质性。同时,这个结论强烈暗示了石漠化本身是一个关键的中介力量,石漠化改变了驱动因子(主要是自然因子)的作用方式和强度,因此我们在此基础上直接研究石漠化与植被的关系。

    • 表5可知:2000—2020年重庆市石漠化(轻度、中度、强度、极强度)面积相对较小(占比5.7%~11.0%),且不断下降,其中轻度石漠化、中度石漠化呈波动下降趋势。强度石漠化和极强度石漠化面积虽有所上升,但始终维持在较低水平。

      年份 面积/km2
      无石漠化 潜在
      石漠化
      轻度
      石漠化
      中度
      石漠化
      强度
      石漠化
      极强度
      石漠化
      2000 65 479.42 19 668.25 6 897.85 2 874.56 728.97 24.03
      2005 68 365.34 17 504.76 6 067.28 2 785.17 878.67 47.11
      2010 77 773.61 8 795.35 7 358.26 1 293.43 412.48 31.34
      2015 76 561.59 11 794.49 2 685.73 3 317.77 1 131.33 139.50
      2020 81 012.55 9 185.96 1 991.33 2 452.85 864.01 116.87

      Table 5.  Rocky desertification area in Chongqing from 2000 to 2020

      结合归一化植被指数变化与石漠化动态变化可以发现,21世纪初研究区西部以轻度石漠化为主,之后面积减少迅速,其归一化植被指数也出现了一定的增长,但主城区域存在归一化植被指数下降不显著的情况。研究区东北部和东南部石漠化面积最多。经过20 a的治理后,东南部的石漠化状况得到显著改善,大面积连续石漠化基本消失,其归一化植被指数呈现微显著和显著增加趋势;东北部的石漠化状况也得到了改善,同时其归一化植被指数呈现极显著增加,但依旧存在一定面积的连续石漠化区域,一直是重庆市石漠化最严重的区域。这可能与该区域石漠化治理难度有关。

    • 区域尺度的归一化植被指数是植被覆盖度与植被长势共同作用的结果。一般而言,人类社会活动通过改变土地利用方式,如毁林开荒、退耕还林、城市建设等,直接且剧烈地改变植被覆盖度[2728],而自然因子通过调节植物的生理过程(光合作用、蒸腾作用等)影响植被的长势和生产力[29]。本研究以归一化植被指数作为衡量植被变化趋势的指标。

    • 本研究选取了3个社会经济因子:国内生产总值、路网密度、人口密度。国内生产总值与经济发展、城镇化率存在着较高的关联度,路网密度在一定程度上表征着城市活力[30],人口密度能够直接代表人类活动的强度及其作用于其他因素的强度。

      重庆市统计局公布的数据表明:2000—2020年重庆市第一产业占比不断下降,重庆市经济发展对自然资源的消耗与依赖较小,因此其国内生产总值与归一化植被指数的关联较弱。重庆市是中国中西部的交通枢纽,在经济发展过程中建设了各种交通设施工程[31],不可避免地需要占据一部分森林植被面积,对归一化植被指数生产了一定的负面影响,但未起到决定性作用。人口密度关系着社会发展和资源环境承载力之间的平衡,对植被覆盖变化具有重要意义。人口密度增长主要集中于城市建成区。随着人口密度的增长,城市化进程不断加快,住房、医疗、教育、工作等居民生存和发展所需要的资源不断增加,农业扩张、城市建设等占据了生态用地[3233]。这些会直接导致植被覆盖度大幅降低。本研究中,在人口高密度城市建成区,归一化植被指数维持在较低但稳定的水平。这可以解释为:①植被覆盖度已降至城市环境下的“底线”,可被侵占的自然植被已很少;②此时的归一化植被指数主要反映的是城市绿地(人工植被)的长势,其受到人为养护的支持,受其他因素影响较小。

    • 城市建成区内植被动态主要受城市规划、人口流动与人为管护等社会活动主导[34],对自然因子的变化不敏感,故下面对自然因子的讨论将不适用城市建成区。

      本研究中,重庆市气温常年较高,植物生长所需要的热量较为充足,但高温胁迫也会抑制植被长势[35]。石漠化地区风化层浅薄,失水率增加[36],即使降雨量增加,能够被植被吸收利用的水分也较少,增加的水分难以持续有效地供给植物生长所需,导致降水促进作用有限。

      土层厚度是决定植被生产力的重要因素,它影响着土壤水分、养分的储量和植被根系分布的空间范围[37],决定了植被的潜在长势上限。非石漠化地区响应更敏感。在山地条件下,土层厚度通常与地形、坡度、坡向和坡位有关[38]。因坡度原因,石漠化地区土层厚度常常分布不均匀,造成植被覆盖类型和面积等在不同坡位的分异,导致土层厚度对归一化植被指数变化的解释效果较差。

      非石漠化地区归一化植被指数基数较高。归一化植被指数的饱和效应可能导致对植被变化趋势的评估与实际状况有所偏离。未来研究可结合对饱和效应不敏感的指数,如增强植被指数,进行交叉验证。

    • 在石漠化区,驱动因子首先影响水土流失等石漠化过程,再通过改变生境条件(土壤、水分等),最终影响植被[38]。在非石漠化地区,驱动因子更直接地作用于植被。石漠化状况就是一个“滤镜”或“开关”,它重塑了自然驱动因子对植被的作用格局。生态工程的成功,其本质是通过人为干预打破了石漠化的恶性循环,使系统进入“植被恢复—改善石漠化—生境优化—进一步促植被恢复”的良性循环[3942]。植被变化和石漠化两者实现协同演化。

      在促进植被恢复的过程中,应在宏观政策指引下,对石漠化地区采取“顺应自然,弥补短板”的策略,如集水、采肥等,优先做好石漠化治理,改善立地条件,提升植被覆盖度;对非石漠化地区,则可采取“优化结构,提升功能”的策略,提高植被生产力与质量。

    • 研究区内93%的区域归一化植被指数呈增加趋势,植被状况总体改善,但空间异质性明显,东部地区植被恢复状况整体比西部好。社会经济因子中,国内生产总值对植被覆盖的影响较弱;路网密度增加与植被覆盖减少呈现同步性,但不起决定作用;人口密度增长初期对植被覆盖呈现显著负面影响,超过某一阈值负面影响降低,对植被覆盖变化具有重要意义。自然因子中,降水增加促进植被缓慢恢复,气温升高对植被生长呈负面影响,土层厚度的增加明显改善植被生长状况。相较石漠化地区,非石漠化地区的植被对3类自然驱动因子的响应更加显著和敏感,且气温和土层厚度能够较好地解释植被覆盖变化。研究区石漠化整体呈下降趋势,石漠化面积减少明显的区域,植被覆盖增加趋势也较明显,两者具有一定的协同演化关系。在进行生态恢复与管理时,须考虑石漠化的中介作用,实施分区、分类的精准施策。

Reference (42)

Catalog

    /

    DownLoad:  Full-Size Img  PowerPoint
    Return
    Return