Turn off MathJax
Article Contents

ZHU Wei, GUO Hongying, TAN Qingbi, et al. Spatiotemporal evolution and driving factors of vegetation coverage in the Qingjiang Estuary of Yueqing Bay from 2003 to 2024[J]. Journal of Zhejiang A&F University, 2026, 43(X): 1−10 doi:  10.11833/j.issn.2095-0756.20250522
Citation: ZHU Wei, GUO Hongying, TAN Qingbi, et al. Spatiotemporal evolution and driving factors of vegetation coverage in the Qingjiang Estuary of Yueqing Bay from 2003 to 2024[J]. Journal of Zhejiang A&F University, 2026, 43(X): 1−10 doi:  10.11833/j.issn.2095-0756.20250522

OnlineFirst articles are published online before they appear in a regular issue of the journal. Please find and download the full texts via CNKI.

Spatiotemporal evolution and driving factors of vegetation coverage in the Qingjiang Estuary of Yueqing Bay from 2003 to 2024

DOI: 10.11833/j.issn.2095-0756.20250522
  • Received Date: 2025-09-29
  • Accepted Date: 2026-04-10
  • Rev Recd Date: 2026-03-31
  •   Objective  Yueqing Bay is a typical ecologically sensitive area, harboring the northernmost large-scale mangrove (Rhizophorceae) forests in China. This study aims to investigate the evolution of fractional vegetation cover (F) in this region over the past 22 years and their relationship with climatic factors, which can guide habitat restoration and ecological seawall construction, and provide references for similar areas in dealing with biological invasions and ecological risk management.   Method  Based on Landsat data from 2003 to 2024 and combined with the normalized difference vegetation index (NDVI), the spatiotemporal variation of vegetation coverage and its driving factors were analyzed using the pixel dichotomy model, Theil-Sen Mediam and correlation analysis.   Result  The overall F in the Qingjiang Estuary exhibited a fluctuating growth trend over the past 22 years, rising from 0.601 in 2003 to 0.694 in 2024, with an annual average growth rate of 0.008. The spatial distribution of different vegetation coverage levels exhibited significant area transitions. The combined area proportion of low and medium-low F zones significantly decreased from 30.33% to 11.17%, while that of medium and medium-high F zones exhibited a significant increase, from 27.93% to 54.54%. The annual mean maximum temperature, annual mean minimum temperature, annual precipitation, and annual number of precipitation days all exerted negative effects on F.   Conclusion  From 2003 to 2024, the vegetation coverage level and its spatial pattern in the Qingjiang Estuary demonstrates a positive development trend. The annual mean minimum temperature has the most significant negative impact on F among all the influencing factors. As a region subject to intensive human activities, it has undergone a transition from destruction to restoration. Mangrove rehabilitation, tidal flat management, the eradication of invasive species, and other projects led by man are the key factors driving the increase in vegetation coverage. [Ch, 3 fig. 2 tab. 40 ref.]
  • [1] DING Sirui, ZHAO Yihe, ZHAO Tingning, JIANG Qunou, JIA Yafan, SU Xinyu, YANG Qing.  Analysis of spatiotemporal evolution characteristics and driving factors of land desertification in Beijing from 1990 to 2020 . Journal of Zhejiang A&F University, doi: 10.11833/j.issn.2095-0756.20250437
    [2] DING Xinxin, TANG Luyao, ZHANG Bona, YE Linfeng, XIE Jiangbo, WANG Zhongyuan.  Adaptive strategies of twig functional traits in Robinia pseudoacacia along a precipitation gradient and their driving mechanisms . Journal of Zhejiang A&F University, doi: 10.11833/j.issn.2095-0756.20240623
    [3] LAN Mengyao, ZHOU Dezhi, GUAN Yinghui.  Spatiotemporal variation and driving factors of normalized difference vegetation index (NDVI) in Yan’an City . Journal of Zhejiang A&F University, doi: 10.11833/j.issn.2095-0756.20230610
    [4] LI Wenhan, LIU Feiyang, ZHANG Meng, GU Lei, ZHOU Guomo.  Spatiotemporal evolution law and driving factors of carbon emissions in planting industry in Zhejiang Province . Journal of Zhejiang A&F University, doi: 10.11833/j.issn.2095-0756.20240156
    [5] CAI Mengqing, HUANG Lu, YAN Lijiao.  Temporal and spatial variation characteristics of annual water yield and its influencing factors in Hangzhou based on InVEST model . Journal of Zhejiang A&F University, doi: 10.11833/j.issn.2095-0756.20210170
    [6] LIU Yuqing, ZHANG Huabing, SUN Xiaoxiang, LI Yufeng.  Spatial-temporal variations of landscape pattern and hot spot analysis in the Lixiahe Plain of Jiangsu Province from 1980 to 2018 . Journal of Zhejiang A&F University, doi: 10.11833/j.issn.2095-0756.20210178
    [7] ZHANG Tianran, ZHENG Wenge, ZHANG Yinke, HUANG Fang, LI Xiaolu, YUAN Chuyang, YU Hui, YAN Hai, SHAO Feng.  Pollution characteristics of heavy metals in PM2.5 in four kinds of green space in Lin’an District of Hangzhou City . Journal of Zhejiang A&F University, doi: 10.11833/j.issn.2095-0756.20200558
    [8] XU Li, PENG Haoxian, PAN Ping, OUYANG Xunzhi, YU Xiao, ZHANG Min, ZHOU Qiaoqing.  Vegetation coverage and its spatial pattern changes in Xingguo County, Jiangxi Province . Journal of Zhejiang A&F University, doi: 10.11833/j.issn.2095-0756.20200792
    [9] YAN Zepu, ZHANG Jiaqi, LIANG Bi, WEI Guangli, ZHANG Qixiang, WANG Zhengjia.  Effects of exogenous gibberellin on growth of Carya illinoensis and its metabolic gene expression . Journal of Zhejiang A&F University, doi: 10.11833/j.issn.2095-0756.20190566
    [10] ZHANG Shuting, WANG Xiaohui, PENG Daoli, JI Ping, LIU Hua, LING Chengxing, HOU Ruixia.  Monitoring of vegetation coverage change in hilly and gully regions on the Loess Plateau . Journal of Zhejiang A&F University, doi: 10.11833/j.issn.2095-0756.20200136
    [11] TIAN Di, LIU Zheng, HU Yalin.  Spatial-temporal characteristics of vegetation coverage and the relationship to topographic factors in Fuzhou City . Journal of Zhejiang A&F University, doi: 10.11833/j.issn.2095-0756.2019.06.013
    [12] DAI Aona, LIU Xiaoxiao, WANG Bing, DAI Wei.  Annual spatial and temporal variations of soil organic carbon and its components in Castanopsis fargesii forest . Journal of Zhejiang A&F University, doi: 10.11833/j.issn.2095-0756.2018.03.003
    [13] ZHU Wankuan, CHEN Shaoxiong, Roger ARNOLD, WANG Zhichao, XU Yuxing, DU Apeng.  Temporal and spatial dynamics of soil respiration and influencing factors in Eucalyptus plantations . Journal of Zhejiang A&F University, doi: 10.11833/j.issn.2095-0756.2018.03.004
    [14] JIANG Wen-wei, GUO Yun-xue, YANG Shu-zhen, ZHAO Ming-shui.  Temporal and spatial changes for sap flow velocity of Cryptomeria fortunei stems in National Nature Reserve of Mount Tianmu . Journal of Zhejiang A&F University, doi: 10.11833/j.issn.2095-0756.2012.06.009
    [15] YANG Zi-qing, CHEN Ping-liu, LIU Jian, YU Kun-yong, LIAO Xiao-li, YOU Hao-chen, GONG Cong-hong.  Spatio-temporal variation of distribution patterns in Cunninghamia lanceolata plantations . Journal of Zhejiang A&F University, doi: 10.11833/j.issn.2095-0756.2012.03.008
    [16] ZHANG Chao, YU Shu-quan, LI Tu-sheng.  Image analysis of vegetation coverage and changes (1994 - 2007) in Qingyuan County using multi-temporal Landsat remote sensing . Journal of Zhejiang A&F University, doi: 10.11833/j.issn.2095-0756.2011.01.012
    [17] WU Shang-ying, ZHANG Yang, LIU Ai-rong, XU Tong.  Diversity of endophytic fungi in Rhizophora stylosa and Kandelia candel . Journal of Zhejiang A&F University, doi: 10.11833/j.issn.2095-0756.2010.04.002
    [18] HUANG Xiao-lin, PENG Xin, QIU Jian-biao, CHEN Shao-bo.  Mangrove status and development prospects in southern Zhejiang Province . Journal of Zhejiang A&F University,
    [19] SUN Da,  HUANG Fang,  CAI Rong-rong,  QIN Hua,  ZHUANG Shun-yao,  ZHANG Miao-xian, CAO Zhi-hong.  Temporal and spatial variation of soil phosphorus in Phyllostachys praecox stands under intensive cultivation management . Journal of Zhejiang A&F University,
    [20] CAI Rong-rong, HUANG Fang, SUN Da, QINHua, YANG Fang, ZHUANG Shun-yao, ZHOUGuo-mo, CAO Zhi-hong.  Temporal and spatial variation of soil organic matters in Phyllostachys praecox stands with intensive cultivation management . Journal of Zhejiang A&F University,
  • [1]
    FORZIERI G, MIRALLES D G, CIAIS P, et al. Increased control of vegetation on global terrestrial energy fluxes[J]. Nature Climate Change, 2020, 10(4): 356−362. DOI: 10.1038/s41558-020-0717-0.
    [2]
    MAO Pingping, ZHANG Jing, LI Ming, et al. Spatial and temporal variations in fractional vegetation cover and its driving factors in the Hulun Lake region[J]. Ecological Indicators, 2022, 135: 108490. DOI: 10.1016/j.ecolind.2021.108490.
    [3]
    A Duo, ZHAO Wenji, GONG Zhaoning, et al. Temporal analysis of climate change and its relationship with vegetation cover on the North China plain from 1981 to 2013[J]. Acta Ecologica Sinica, 2017, 37(2): 576−592. DOI: 10.5846/stxb201507301600.
    [4]
    ZHANG Xiuxia, HAN Lisha, DANG Xinghai, et al. Spatiotemporal changes in vegetation coverage in the arid regions of Northwest China over the past 30 years and their response to climatic factors[J]. Arid Zone Research, 2025, 42(6): 1067−1079. DOI: 10.13866/j.azr.2025.06.10.
    [5]
    TANG Zhixiong, ZHOU Zixiang, WANG De, et al. Impact of vegetation restoration on ecosystem services in the Loess plateau: a case study in the Jinghe Watershed, China[J]. Ecological Indicators, 2022, 142: 109183. DOI: 10.1016/j.ecolind.2022.109183.
    [6]
    DING Chen, SHEN Xiangjin, LIU Yiwen, et al. Spatial-temporal variation in fraction of vegetation cover and its response to climate change in marshes of the China[J]. Acta Ecologica Sinica, 2025, 45(6): 2643−2654. DOI: 10.20103/j.stxb.202402020297.
    [7]
    GITELSON A A, KAUFMAN Y J, STARK R, et al. Novel algorithms for remote estimation of vegetation fraction[J]. Remote Sensing of Environment, 2002, 80(1): 76−87. DOI: 10.1016/S0034-4257(01)00289-9.
    [8]
    MA Shuai, WANG Liangjie, JIANG Jiang, et al. Threshold effect of ecosystem services in response to climate change and vegetation coverage change in the Qinghai-Tibet Plateau ecological shelter[J]. Journal of Cleaner Production, 2021, 318: 128592. DOI: 10.1016/j.jclepro.2021.128592.
    [9]
    TUCKER C J, SLAYBACK D A, PINZON J E, et al. Higher northern latitude normalized difference vegetation index and growing season trends from 1982 to 1999[J]. International Journal of Biometeorology, 2001, 45(4): 184−190. DOI: 10.1007/s00484-001-0109-8.
    [10]
    PAN Huijiao, PENG Wenfu, ZHU Cong, et al. Study on temporal variation and natural driving force of fractional vegetation cover in Wenchuan County, Sichuan Province[J]. Jiangsu Agricultural Sciences, 2020, 48(24): 239−243. DOI: 10.15889/j.issn.1002-1302.2020.24.045.
    [11]
    LI Si, XIE Hongxia, ZHOU Qing, et al. The relationships between vegetation coverage and climate factors over multiple scales in Hunan Province[J]. Chinese Journal of Ecology, 2025, 44(1): 260−270. DOI: 10.13292/j.1000-4890.202501.044.
    [12]
    WANG Simeng, LIU Qihang, HUANG Chang. Vegetation change and its response to climate extremes in the arid region of northwest China[J]. Remote Sensing, 2021, 13(7): 1230. DOI: 10.3390/rs13071230.
    [13]
    SONG Xiaolong, MA Mingde, WANG Peng, et al. The spatiotemporal non-stationary characteristics of fractional vegetation coverage during the growing season of different geographical regions in Ningxia[J]. Ecology and Environmental Sciences, 2024, 33(6): 853−868. DOI: 10.16258/j.cnki.1674-5906.2024.06.003.
    [14]
    LUO Xufu, DONG Zhengliang, SUN Yufang. Spatiotemporal variations and influencing factors of vegetation coverage in Sichuan Province[J]. Chinese Journal of Ecology, 2025, 44(7): 2438−2447. DOI: 10.13292/j.1000-4890.202507.018.
    [15]
    JIA Yiyue, QI Xuanxuan, HUANG Rui, et al. Spatiotemporal variation and driving factors of vegetation coverage in Shanxi Province, China[J]. Chinese Journal of Applied Ecology, 2024, 35(4): 1073−1082. DOI: 10.13287/j.1001-9332.202403.023.
    [16]
    XU Li, PENG Haoxian, PAN Ping, et al. Vegetation coverage and its spatial pattern changes in Xingguo County, Jiangxi Province[J]. Journal of Zhejiang A&F University, 2021, 38(6): 1117−1126. DOI: 10.11833/j.issn.2095-0756.20200792.
    [17]
    FENG Zhiying, ZHENG Yiwen, ZHANG Yuanbo, et al. Spatial distribution dynamics of mangroves in yingluo bay from 2013 to 2023[J]. Journal of Guangdong Ocean University, 2025, 45(1): 62−67. DOI: 10.3969/j.issn.1673-9159.2025.01.008.
    [18]
    ZHANG Yan, ZHANG Luoqi, WANG Junyi, et al. Quantitative analysis of NDVI driving factors based on the geographical detector model in the Chengdu-Chongqing region, China[J]. Ecological Indicators, 2023, 155: 110978. DOI: 10.1016/j.ecolind.2023.110978.
    [19]
    WANG Rong, DING Xue, YI Bangjin, et al. Spatiotemporal characteristics of vegetation cover change in the Central Yunnan urban agglomeration from 2000 to 2020 based on Landsat data and its driving factors[J]. Geocarto International, 2024, 39(1): 2316643. DOI: 10.1080/10106049.2024.2316643.
    [20]
    KULAKOWSKI D, BEBI P, RIXEN C. The interacting effects of land use change, climate change and suppression of natural disturbances on landscape forest structure in the Swiss Alps[J]. Oikos, 2011, 120(2): 216−225. DOI: 10.1111/j.1600-0706.2010.18726.x.
    [21]
    OBUCHOWICZ C, POUSSIN C, GIULIANI G. Change in observed long-term greening across Switzerland–evidence from a three decades NDVI time-series and its relationship with climate and land cover factors[J]. Big Earth Data, 2024, 8(1): 1−32. DOI: 10.1080/20964471.2023.2268322.
    [22]
    GAO Xiang, HUANG Xingxing, LO K, et al. Vegetation responses to climate change in the Qilian Mountain Nature Reserve, Northwest China[J]. Global Ecology and Conservation, 2021, 28: e01698. DOI: 10.1016/j.gecco.2021.e01698.
    [23]
    YAN Zhiyuan, ZHANG Shengwei, WANG Yixuan. Spatiotemporal dynamics of fractional vegetation cover and climate response in Inner Mongolia during 1982—2021 based on GEE[J]. Transactions of the Chinese Society of Agricultural Engineering, 2023, 39(15): 94−102. DOI: 10.11975/j.issn.1002-6819.202301033.
    [24]
    CHEN Siyang, LIU Ruijuan, ZHANG Xiaohui, et al. Ecosystem vulnerability assessment of Yueqing Bay based on VSD model[J]. Journal of Applied Oceanography, 2024, 43(3): 579−587. DOI: 10.3969/J.ISSN.2095-4972.20230822002.
    [25]
    LI Miaocong, LIU Wensheng, JIANG Jinhua. Analysis of spatial-temporal variation and nutritional status of environmental quality in the mariculture zone at the Yueqing Bay[J]. Marine Environmental Science, 2021, 40(5): 724−731. DOI: 10.12111/j.mes.20200044.
    [26]
    CHEN Guixiang, GAO Dengzhou, CHEN Gang, et al. Effects of Spartina alterniflora invasion on soil carbon fractions in mangrove wetlands of China[J]. Journal of Soil and Water Conservation, 2017, 31(6): 249−256. DOI: 10.13870/j.cnki.stbcxb.2017.06.039.
    [27]
    HUANG Zhixing, SHEN Hua, PENG Xin, et al. Monitoring of Spartjna alternjflora invasion by using high resolution satellite images in Yueqing Bay, Zhejiang Province[J]. Ocean Development and Management, 2016, 33(10): 63−67. DOI: 10.3969/j.issn.1005-9857.2016.10.014.
    [28]
    LI Miaomiao, WU Bingfang, YAN Changzhen, et al. Estimation of vegetation fraction in the upper basin of Miyun Reservoir by remote sensing[J]. Resources Science, 2004, 26(4): 153−159. DOI: 10.3321/j.issn:1007-7588.2004.04.022.
    [29]
    WANG Donghua, TIAN Yichao, ZHANG Yali, et al. Spatiotemporal evolution and attribution of vegetation coverage in the peak-cluster depression basins[J]. China Environmental Science, 2022, 42(9): 4274−4284. DOI: 10.3969/j.issn.1000-6923.2022.09.035.
    [30]
    TIAN Zhihui, REN Zuguang, WEI Haitao. Driving mechanism of the spatiotemporal evolution of vegetation in the Yellow River Basin from 2000 to 2020[J]. Environmental Science, 2022, 43(2): 743−751. DOI: 10.13227/j.hjkx.202105213.
    [31]
    SAVATOROVA V. Exploring parameter sensitivity analysis in mathematical modeling with ordinary differential equations[J]. CODEE Journal, 2023, 16(1): 1−26. DOI: 10.5642/codee.czkz5996.
    [32]
    WANG Dianlai, SU Aixia, LIU Wenping. Trend analysis of vegetation cover changes based on spearman rank correlation coefficient[J]. Journal of Applied Sciences, 2019, 37(4): 519−528. DOI: 10.3969/j.issn.0255-8297.2019.04.009.
    [33]
    HE Yuchuan, XIONG Junnan, AHEMAITIHALI A, et al. Spatiotemporal pattern and driving force analysis of vegetation variation in Altay prefecture based on google earth engine[J]. Journal of Resources and Ecology, 2021, 12(6): 729−742. DOI: 10.5814/j.issn.1674-764x.2021.06.002.
    [34]
    YANG Qiang, QIN Zhihao, LI Wenjuan, et al. Temporal and spatial variations of vegetation cover in Hulun Buir grassland of Inner Mongolia, China[J]. Arid Land Research and Management, 2012, 26(4): 328−343. DOI: 10.1080/15324982.2012.709215.
    [35]
    ZHAO Feng, ZHANG Huaiqing, LIU Hua, et al. Remote sensing monitoring and protection of mangrove wetland reserve of the Zhangjiang Estuary in Fujian Province[J]. Journal of Northwest Forestry University, 2011, 26(1): 160−165.
    [36]
    WANG Shiwen, HE Hongchang, FU Bolin, et al. Parameter inversion of physiological structure and space-time characteristics of Shankou mangrove forest based on sentinel-2 data[J]. Science Technology and Engineering, 2021, 21(9): 3698−3707. DOI: 10.3969/j.issn.1671-1815.2021.09.039.
    [37]
    DAI Xue, YU Zhongbo, MATHENY A M, et al. Increasing evapotranspiration decouples the positive correlation between vegetation cover and warming in the Tibetan Plateau[J]. Frontiers in Plant Science, 2022, 13: 974745. DOI: 10.3389/fpls.2022.974745.
    [38]
    WU Linsheng, ZHANG Yongguang, ZHANG Zhaoying, et al. Remote sensing of solar-induced chlorophyll fluorescence and its applications in terrestrial ecosystem monitoring[J]. Chinese Journal of Plant Ecology, 2022, 46(10): 1167−1199. DOI: 10.17521/cjpe.2022.0233.
    [39]
    SWAMI P, MUNJAL R, DESWAL K. Targeting photosynthesis under abiotic stress[J]. Journal of Cereal Research, 2021, 14(1): 53−66. DOI: 10.25174/2582-2675/2022/113965.
    [40]
    GAO Ruxue, DAI Quanhou, GAN Yixian, et al. The mechanisms of nutrient output through water flow from sloping farmland with slight rocky desertification in a karst region[J]. Environmental Research Letters, 2020, 15(9): 094085. DOI: 10.1088/1748-9326/ab9d3b.
  • 加载中
通讯作者: 陈斌, bchen63@163.com
  • 1. 

    沈阳化工大学材料科学与工程学院 沈阳 110142

  1. 本站搜索
  2. 百度学术搜索
  3. 万方数据库搜索
  4. CNKI搜索

Figures(3)  / Tables(2)

Article views(20) PDF downloads(3) Cited by()

Related
Proportional views

Spatiotemporal evolution and driving factors of vegetation coverage in the Qingjiang Estuary of Yueqing Bay from 2003 to 2024

doi: 10.11833/j.issn.2095-0756.20250522

Abstract:   Objective  Yueqing Bay is a typical ecologically sensitive area, harboring the northernmost large-scale mangrove (Rhizophorceae) forests in China. This study aims to investigate the evolution of fractional vegetation cover (F) in this region over the past 22 years and their relationship with climatic factors, which can guide habitat restoration and ecological seawall construction, and provide references for similar areas in dealing with biological invasions and ecological risk management.   Method  Based on Landsat data from 2003 to 2024 and combined with the normalized difference vegetation index (NDVI), the spatiotemporal variation of vegetation coverage and its driving factors were analyzed using the pixel dichotomy model, Theil-Sen Mediam and correlation analysis.   Result  The overall F in the Qingjiang Estuary exhibited a fluctuating growth trend over the past 22 years, rising from 0.601 in 2003 to 0.694 in 2024, with an annual average growth rate of 0.008. The spatial distribution of different vegetation coverage levels exhibited significant area transitions. The combined area proportion of low and medium-low F zones significantly decreased from 30.33% to 11.17%, while that of medium and medium-high F zones exhibited a significant increase, from 27.93% to 54.54%. The annual mean maximum temperature, annual mean minimum temperature, annual precipitation, and annual number of precipitation days all exerted negative effects on F.   Conclusion  From 2003 to 2024, the vegetation coverage level and its spatial pattern in the Qingjiang Estuary demonstrates a positive development trend. The annual mean minimum temperature has the most significant negative impact on F among all the influencing factors. As a region subject to intensive human activities, it has undergone a transition from destruction to restoration. Mangrove rehabilitation, tidal flat management, the eradication of invasive species, and other projects led by man are the key factors driving the increase in vegetation coverage. [Ch, 3 fig. 2 tab. 40 ref.]

ZHU Wei, GUO Hongying, TAN Qingbi, et al. Spatiotemporal evolution and driving factors of vegetation coverage in the Qingjiang Estuary of Yueqing Bay from 2003 to 2024[J]. Journal of Zhejiang A&F University, 2026, 43(X): 1−10 doi:  10.11833/j.issn.2095-0756.20250522
Citation: ZHU Wei, GUO Hongying, TAN Qingbi, et al. Spatiotemporal evolution and driving factors of vegetation coverage in the Qingjiang Estuary of Yueqing Bay from 2003 to 2024[J]. Journal of Zhejiang A&F University, 2026, 43(X): 1−10 doi:  10.11833/j.issn.2095-0756.20250522
  • 植被作为生态系统的关键初级生产者,其生长状况能够有效反映区域生态环境的演变特征,在维系土壤-大气-水分循环及表征区域生态健康方面具有重要作用[12]。植被动态演变过程能够清晰呈现自然因素与人为活动之间的相互作用关系和生态响应规律[3]。针对特定区域开展植被分析,科学探究植被的时空格局及其变化特征,并深入理解其与环境驱动因子的响应关系,可为深入理解陆地生态系统中各驱动因子的作用关系提供科学依据,同时能够有效反映植被群落对生态环境演变的适应特征[4]。这将为科学统筹生态保育与社会经济协同发展提供重要的决策依据[5]

    植被覆盖的动态变化不仅是环境变化的敏感指标,更是解析生态演化机制的关键切入点[6]。植被覆盖度(fractional vegetation cover)作为衡量植被生长状态的关键参数,能够客观反映特定区域植被的茂密程度和空间分布特征[78]。归一化植被指数(normalized difference vegetation index,NDVI)作为关键的遥感监测参数,可通过特定波段计算,显著减弱各类环境噪声的干扰,反映植被类型、生长状态、覆盖密度等特征[9]。目前,研究者普遍采用归一化植被指数作为估算植被覆盖度的遥感植被指数。结合归一化植被指数,运用像元二分模型估算植被覆盖度已被众多学者接受并应用[1011]。西北干旱区的归一化植被指数分布和变化趋势反映了极端气候条件下植被覆盖度的变化。归一化植被指数对极端气候事件存在响应滞后,不同植被类型对极端气候事件的响应也不同[12]。在不同地理分区,植被覆盖度差异显著,从大到小依次为山区、灌溉区、干旱带[13]。土地利用类型、地貌类型、气候因子、土壤类型、高程等是植被覆盖度空间分异的主要影响因素。此外,人类活动也是不可忽视的重要影响因素[1416]。基于2013—2023年英罗湾的LandsatL 2A影像,计算了英罗湾红树Rhizophora apiculata林的植被覆盖度和归一化植被指数,对其长时间的变化趋势进行分析,结果表明:除罗英湾东南岸等少数区域外,研究区大部分区域植被状况得到改善或处于良好的稳定状态[17]。众多国内外学者通过计算植被覆盖度探究区域内植被生长状况,分析植被覆盖度变化的影响因子[1821]。不同区域、不同尺度的植被覆盖度及促成植被演化的驱动因子存在差异,因此,针对特定区域、特定时段的植被覆盖度开展研究,探索植被生长状况以及影响因子[22],可为研究区域的生态环境建设和可持续发展战略的制定提供理论指导[23]

    本研究以乐清湾清江口为研究区域,探究该区域2003—2024年植被覆盖度的演变趋势。乐清湾拥有中国成规模分布最北端的红树林带,为典型的生态敏感区域[24]。在《全国重要生态保护系统和修复重大工程总体规划》中,乐清湾被明确列为海峡西岸的重点海湾河口。该区域作为浙江省重要的海水养殖与贝类苗种基地,拥有宽阔滩涂与优良水文条件[25]。近年来互花米草Spartina alterniflora入侵导致的原生红树林退化、生物多样性降低及海岸带防灾能力减弱等问题凸显[2627]。本研究基于Landsat遥感数据,通过计算归一化植被指数,应用像元二分法估算模型,对乐清湾清江口区域的植被覆盖状况进行定量反演与监测,对目标区域2003—2024年植被覆盖度的时空演变规律进行系统分析;采用相关性分析方法,探究气候要素对植被覆盖动态变化的影响机制。研究结果不仅可指导该地生境恢复与生态海堤建设,亦可为同类区域应对生物入侵与生态风险管控提供参考范式。

    • 乐清湾(27°58′56″~28°23′16″N,120°57′29″~121°12′22″E)地处浙江南部沿海,瓯江口北侧,属半封闭海湾地貌,三面环陆,沿岸区域工农业发达,是浙南经济社会发展的核心区[28]。该区域位于亚热带季风气候区,湾内水体盐度梯度显著,底质以粉砂质黏土为主。独特的水文条件与低风浪环境使其成为海洋生物繁育的理想场所。乐清市全域面积为15.31万hm2,其中陆域面积约为12.64万 hm2,海域面积约为2.67万 hm2。20世纪50年代起,乐清开始引进红树中最耐寒的秋茄树Kandelia obovata。根据浙江有记载的10多次红树林引种统计,累积种植面积有1 370 hm2。随着海洋开发以及互花米草的入侵,红树林逐渐被破坏。这批人工种植的红树林保存至今的不足20 hm2。红树林的减少使得台风的破坏加剧,对当地经济和居民安全都带来一定的挑战。因此,2006年起开始在乐清湾进行红树林栽植和补植工作,截至2024年,已完成红树林种植面积超过200 hm2,现共有红树林约470 hm2,占浙江省红树林面积75%以上。

      清江镇因清江流经境内而得名。清江镇海岸线较长,堤塘外海涂辽阔平整,是重要的海水养殖区,海水养殖以牡蛎Crassostrea gigas为主。乐清湾清江口位于28°24′~28°30′N,121°05′~121°15′E,研究区域面积约为1.81万 hm2。自2019年以来,清江镇在沿江区域规模化推进红树林生态修复工程,实施滩涂生态治理,重点清除外来入侵物种互花米草,并依托原有养殖池堤岸系统栽植红树。经过持续的系统修复与管护,红树群落呈现良好生长态势,目前已成为清江沿岸具有标志性的生态景观带。2019年,乐清全面落实《浙江省海岸线整治修复三年行动方案》,对清江入海口两岸等区域实施了生态岸线修复工程。因此,本研究将2019—2024年界定为政策强力干预期,并进行重点剖析。该时间段的选择,旨在最大限度地凸显人为政策信号的效应,从而更清晰地分离政策驱动与自然气候驱动对植被变化的不同贡献。

    • 基于地理空间数据云平台(https://www.gscloud.cn),获取研究区2003—2024年的Landsat影像。为准确表征植被生长季特征,本研究依据亚热带植被的物候规律,将分析时段确定为每年3—9月。在此时间段内,筛选云量低于15%、植被茂盛、质量较高的影像,经辐射定标、大气校正及归一化植被指数计算后提取植被覆盖信息。其中,2003、2007年使用Landsat-5数据集;2010年使用Landsat-7数据集;2015年、2019—2021年使用Landsat-8数据集;2022—2024年使用Landsat-9数据集,共计10景影像。具体而言,选取2003、2007、2010、2015年作为政策实施前的代表性年份,以建立植被覆盖的本底变化趋势;对于2019—2024年政策实施期,则采用逐年数据,以便精确捕捉植被对人为干预的连续响应。这一设计确保了在高效处理数据的同时,能够可靠地揭示自然演变与人为驱动在不同阶段的相对重要性。

    • 2019—2024年乐清的逐日气温数据,从东方天气网(https://tianqi.eastday.com/lishi/yueqing)获取。数据预处理包括逐年计算年平均最高气温和年平均最低气温。降水数据和相对湿度数据为2019—2024年的逐月数据,包括月降水量、月降水日数、月平均相对湿度,从和风天气网(https://www.qweather.com/historical/yueqing-101210707.html)获取。数据预处理包括:①逐年计算年降水量和年降水日数;②计算年平均相对湿度。驱动因素分析的时间范围聚焦于2019—2024年的政策强力干预期,因此本研究所采用的气象数据也选择该时段。

    • 该模型基于归一化植被指数,参考文献[28]计算植被覆盖度(F)。为消除环境等因子的干扰,本研究选取每一年份的归一化植被指数累积频率分布曲线上5%和95%分位点对应的像元值,作为该年份的裸土或无植被覆盖区域的归一化植被指数值(NDVIsoil)、纯植被像元的归一化植被指数值(NDVIveg),进而基于像元二分法原理推算出各像元的植被覆盖度。计算结果范围为0~1,数值越接近1,表示植被覆盖度越高;越接近0,表示植被覆盖度越低。参考相关研究[29],将计算得到的植被覆盖度分为5个等级:低植被覆盖度(0≤F<20%)、中低植被覆盖度(20%≤F<40%)、中植被覆盖度(40%≤F<60%)、中高植被覆盖度(60%≤F<80%)及高植被覆盖度(80%≤F≤100%)。

    • 该方法可显著降低离散数据对整体趋势判断的干扰,尤其适用于长时序数据的趋势特征分析。参考文献[30]计算植被覆盖度变化趋势($ \beta $)。当$ \beta > 0 $时,植被覆盖度呈上升趋势;$ \beta < 0 $时,呈下降趋势;$ \beta =0 $时,基本不变。

    • Spearman相关系数法是一种稳健的非参数统计方法[31],该方法在长时间序列植被覆盖变化趋势分析中具有良好适用性[32]。本研究采用Spearman相关系数法,定量分析不同气候要素对植被覆盖度的潜在影响。用ρ表示相关系数,取值范围为[−1, 1],|$ \rho $|越接近1,代表相关关系越强。

    • 根据乐清湾清江口2003—2024年各年份植被覆盖度均值以及各年份各植被覆盖等级面积,得到研究区植被覆盖度等级面积占比及年均变化序列(表1)。结果表明:乐清湾清江口2003—2024年生长季植被覆盖度平均值为0.670,植被覆盖度年平均增速为0.008,整体呈现波动增长态势。具体而言,2003—2010年缓慢上升,2020年出现快速下降,2021年回升,2021—2024年维持在0.690以上的较高水准。2022年植被覆盖度年平均值最高,达到了0.717。低、中低植被覆盖度区域面积占比呈现减少的趋势,2003年两者的面积之和占比为30.33%,2024年占比降为11.17%。中及中高等级植被覆盖度范围的面积占比表现出上升的态势,2003年两者的面积之和占比为27.93%,2024年占比升至54.54%。植被覆盖度整体表现为低覆盖向高覆盖转变的趋势,表明乐清湾开展的红树林保护和生态修复工作卓有成效,显著改善了清江口地区植被覆盖水平,推动生态环境持续向好发展。

      年份 植被覆盖度各等级面积占比/% 平均植
      被覆盖度
      低植被
      覆盖度
      中低植
      被覆盖度
      中植被
      覆盖度
      中高植
      被覆盖度
      高植被
      覆盖度
      2003 26.37 3.96 8.90 19.03 41.74 0.601
      2007 9.19 18.83 7.40 27.11 37.47 0.646
      2010 16.05 5.11 15.30 19.11 44.43 0.697
      2015 3.10 25.77 6.61 23.00 41.53 0.668
      2019 13.92 9.12 8.65 30.63 37.69 0.674
      2020 16.79 13.55 8.36 26.82 34.48 0.608
      2021 3.86 12.65 13.73 29.80 39.96 0.695
      2022 1.16 11.07 17.66 28.42 41.69 0.717
      2023 2.38 10.14 19.23 31.67 36.58 0.700
      2024 1.72 9.45 23.20 31.34 34.29 0.694

      Table 1.  Area proportions of each fractional vegetation cover class and annual mean values from 2003 to 2024

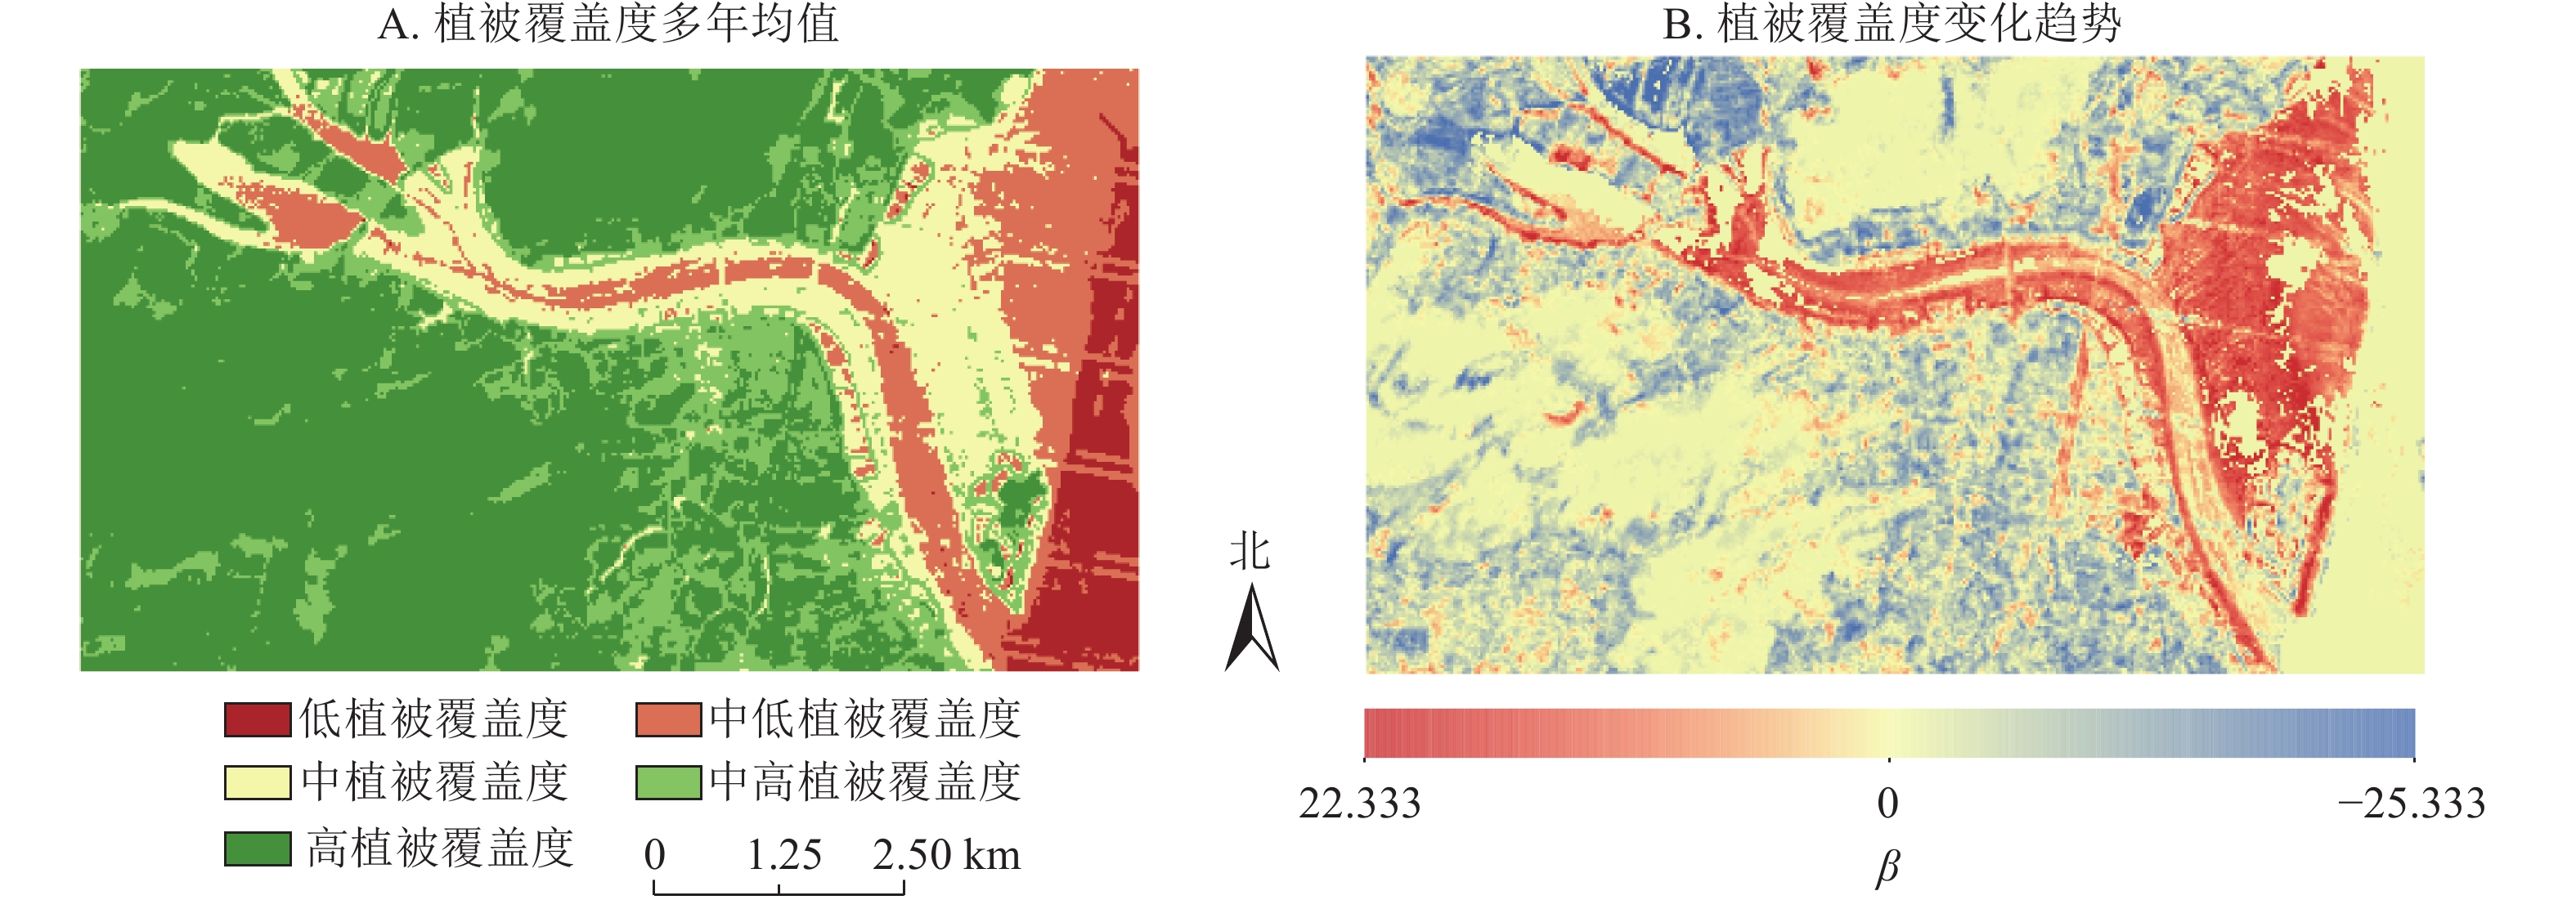
      图1A展示了2003—2024年间乐清湾清江口植被生长季平均覆盖状况的空间格局。研究区域整体植被生长态势优良,中高与高覆盖度等级占据主导地位。东部地带,尤其是沿江区域则主要呈现低及中低覆盖特征。植被空间变化趋势如图1B所示:2003—2024年间,研究区大部分区域植被覆盖度未发生显著变化。植被覆盖度出现显著增加的区域主要是清江国有滩涂、泗塘村和南塘镇;植被覆盖度出现显著减少的区域主要集中在研究区西北部(芙蓉村),田垄村的植被覆盖度也显著降低。总体来说,乐清湾清江口实行生态修复、红树林栽植的区域植被覆盖度显著增加,大部分村镇的植被覆盖度微弱减少。

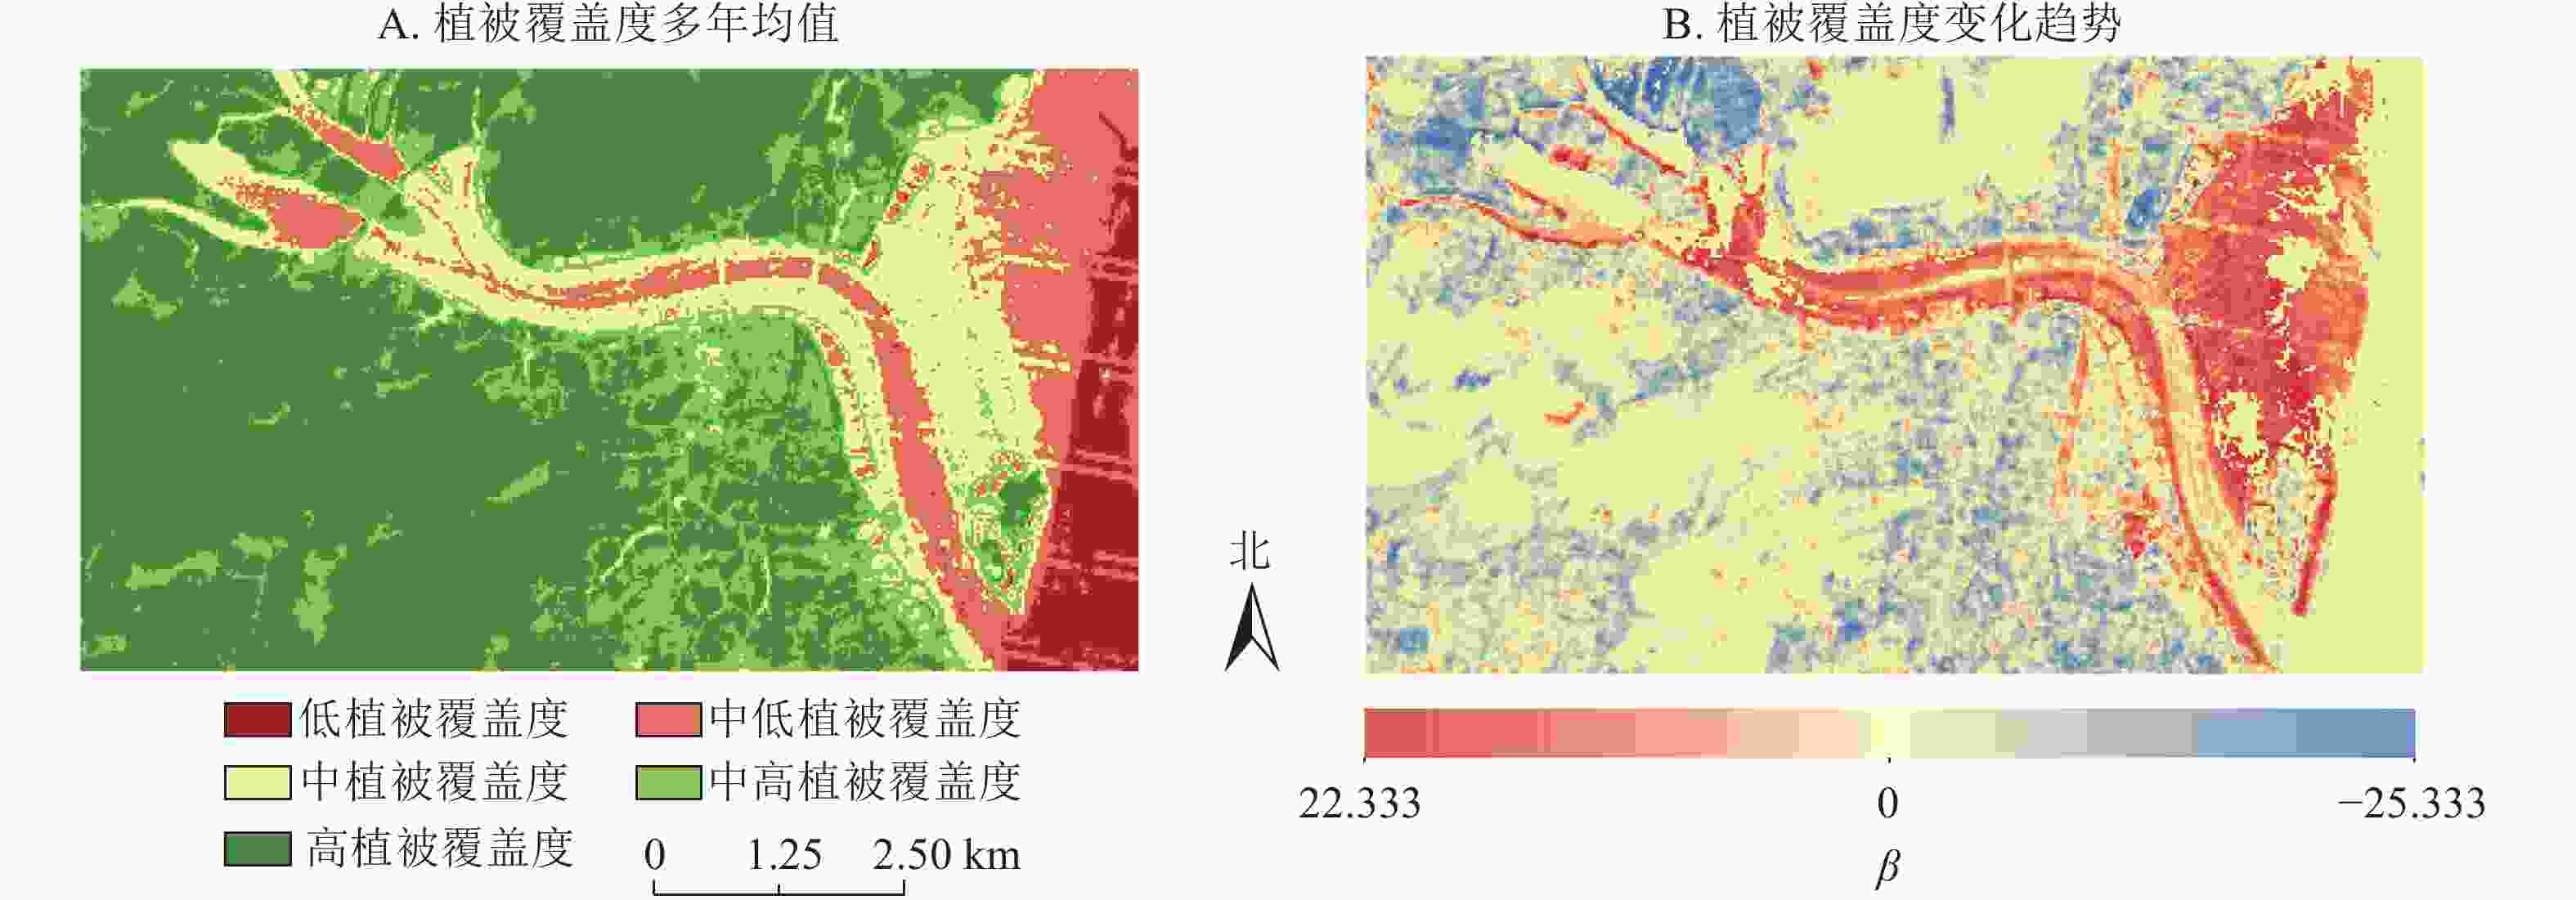
      Figure 1.  Average fractional vegetation cover value and Theil-Sen Median trends of fractional vegetation cover from 2003 to 2024

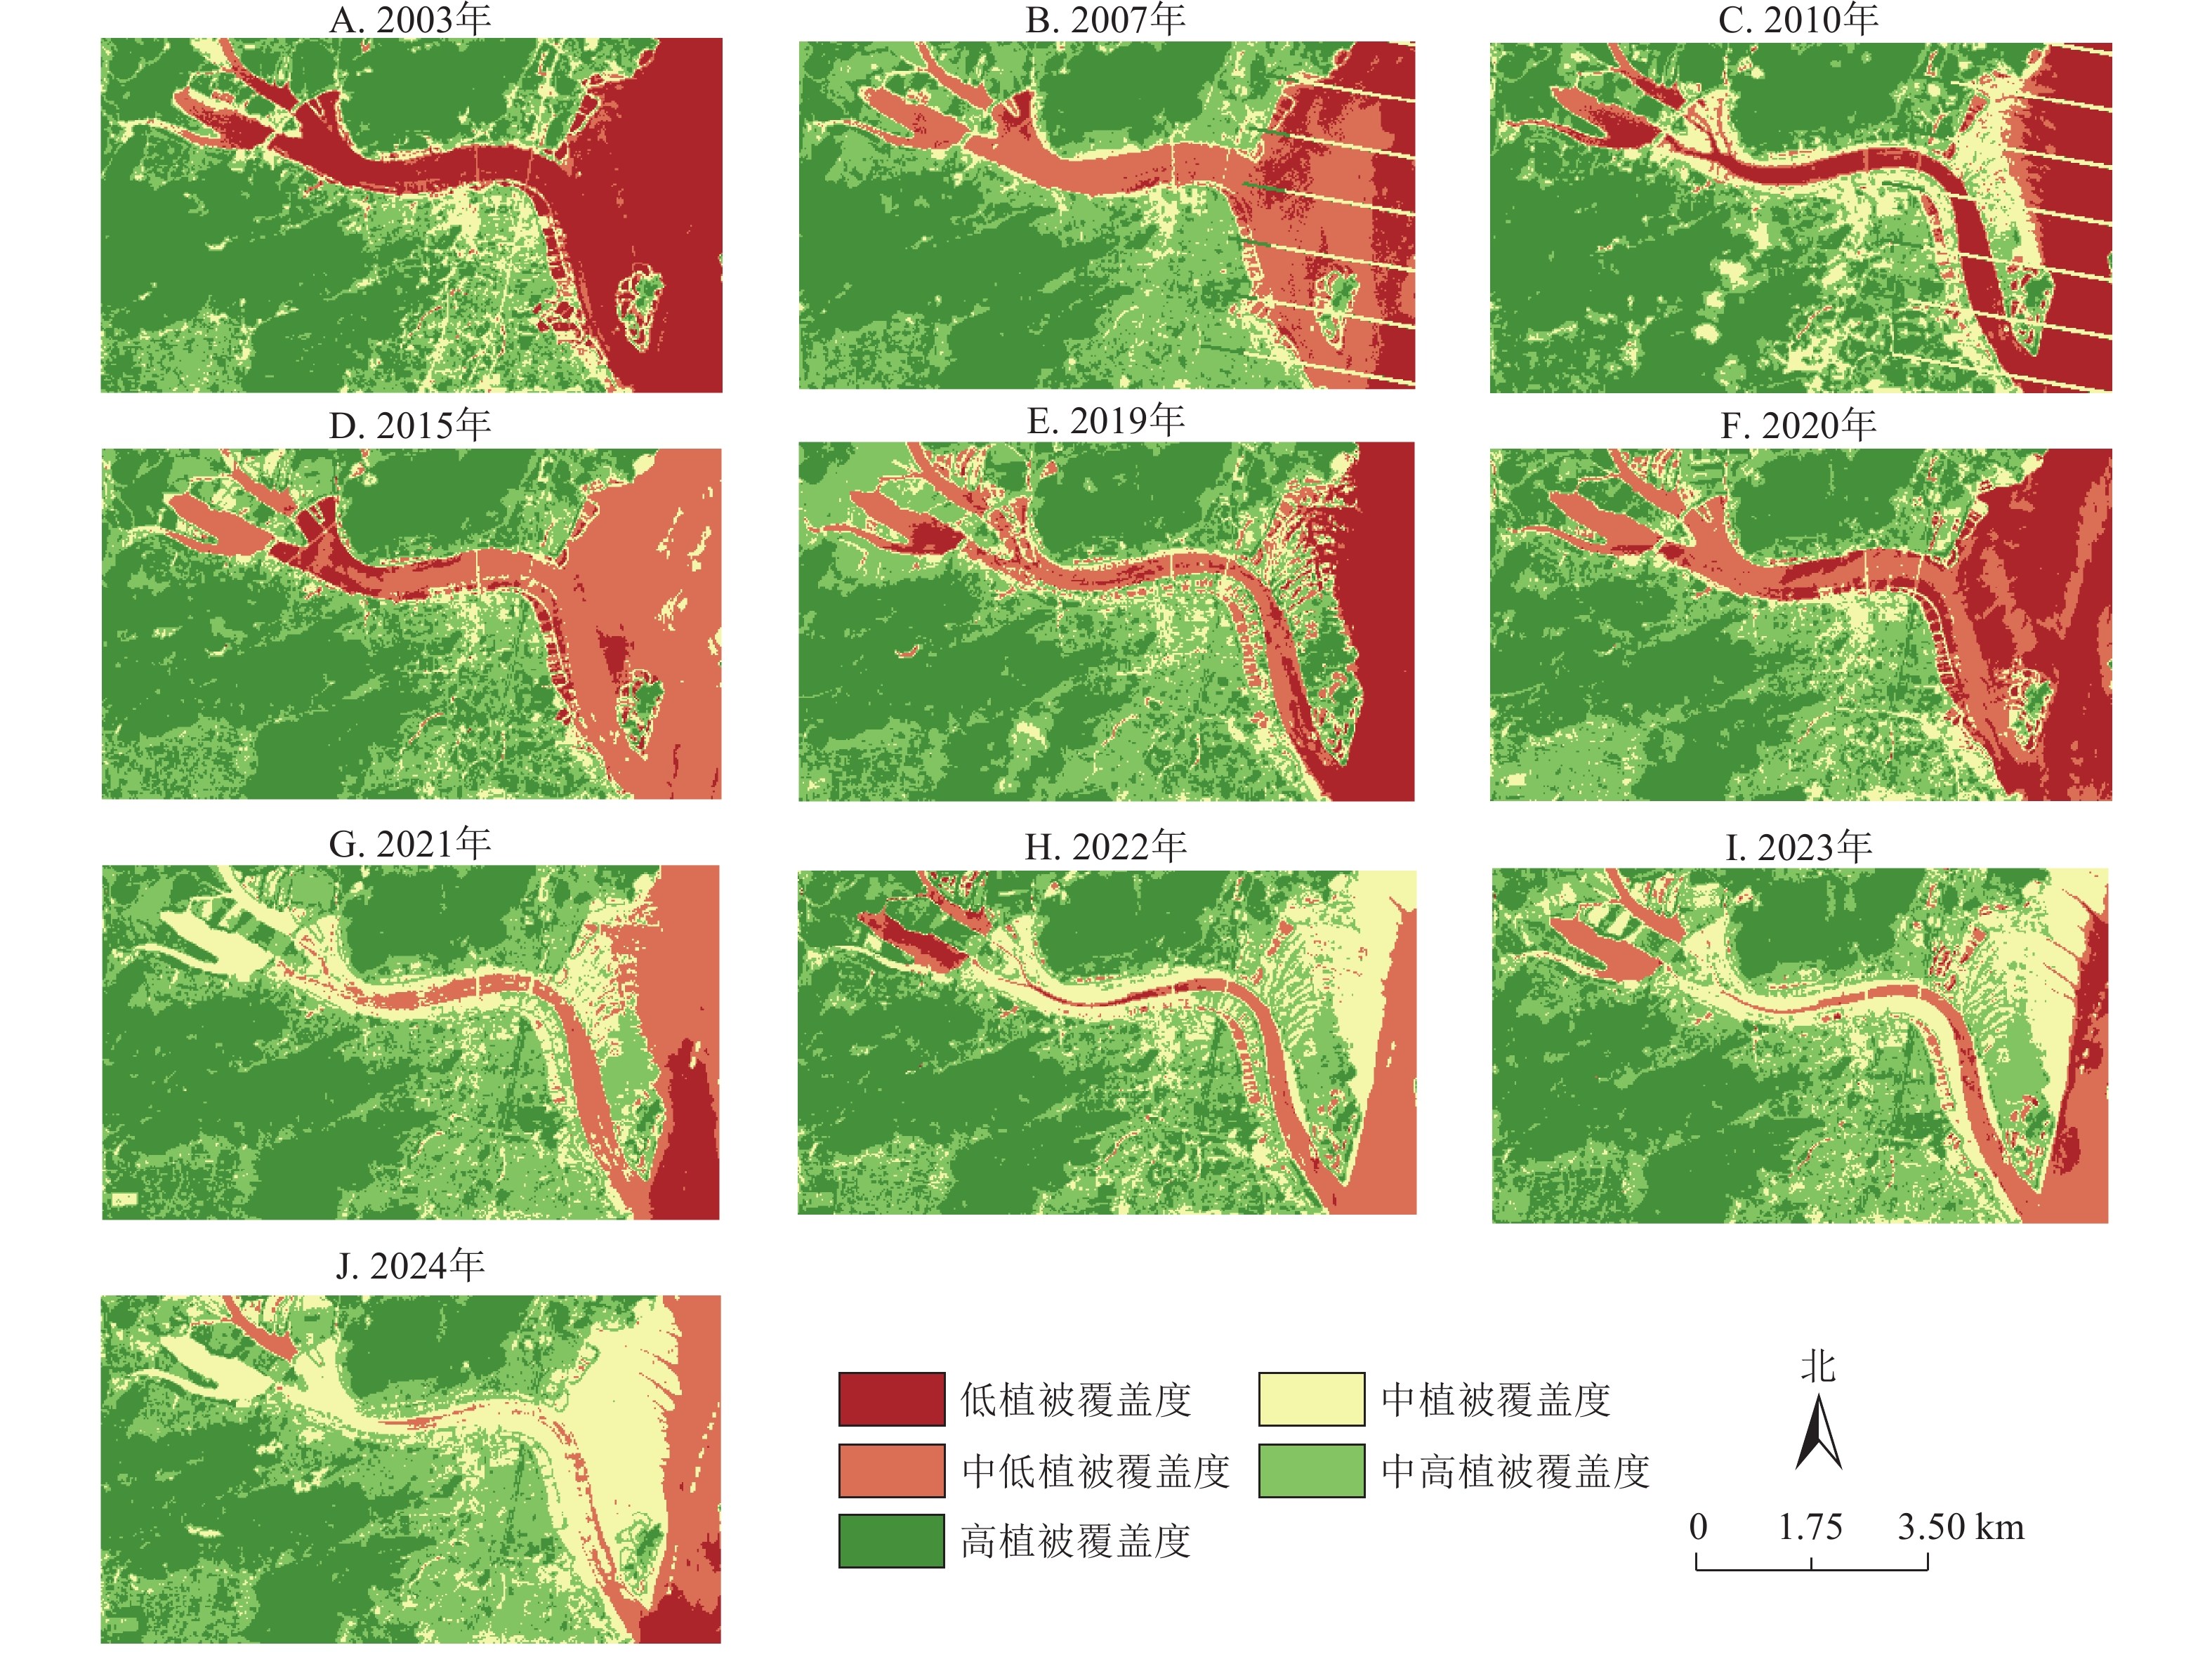
      研究区各年份植被覆盖分布状况如图2所示。2003年,乐清湾清江口的植被覆盖度较低,仅为0.601,低植被覆盖度面积占比较大,研究区东部约三分之一的地区都为低植被覆盖度地区,清江两岸的植被覆盖状况较差。2003—2019年,随着红树林栽植和补植工作的逐步开展,乐清湾清江口的植被覆盖度逐年上升,低植被覆盖度面积逐年减少。东部地区从低植被覆盖区逐步转变为中低植被覆盖区,植被覆盖状情况得到有效改善。2020年,乐清湾清江口植被覆盖度出现骤降,主要原因是清江镇开始大力治理互花米草,清江滩涂区域再次变为低植被覆盖区域。2021年,基本完成滩涂整治,利用养殖塘的塘埂大面积栽植红树林,植被覆盖度开始回升。此后研究区植被覆盖度一直保持在较高水平。2024年,清江滩涂大部分区域植被覆盖度等级为中植被覆盖度,仅有研究区东侧小部分乐清湾水体区域为低植被覆盖度区域和中低植被覆盖度区域。对2020—2024年间不同植被覆盖度等级的面积变化进行分析可知:低、中低植被覆盖区呈现显著减少态势,中、中高植被覆盖区呈现显著增长趋势。

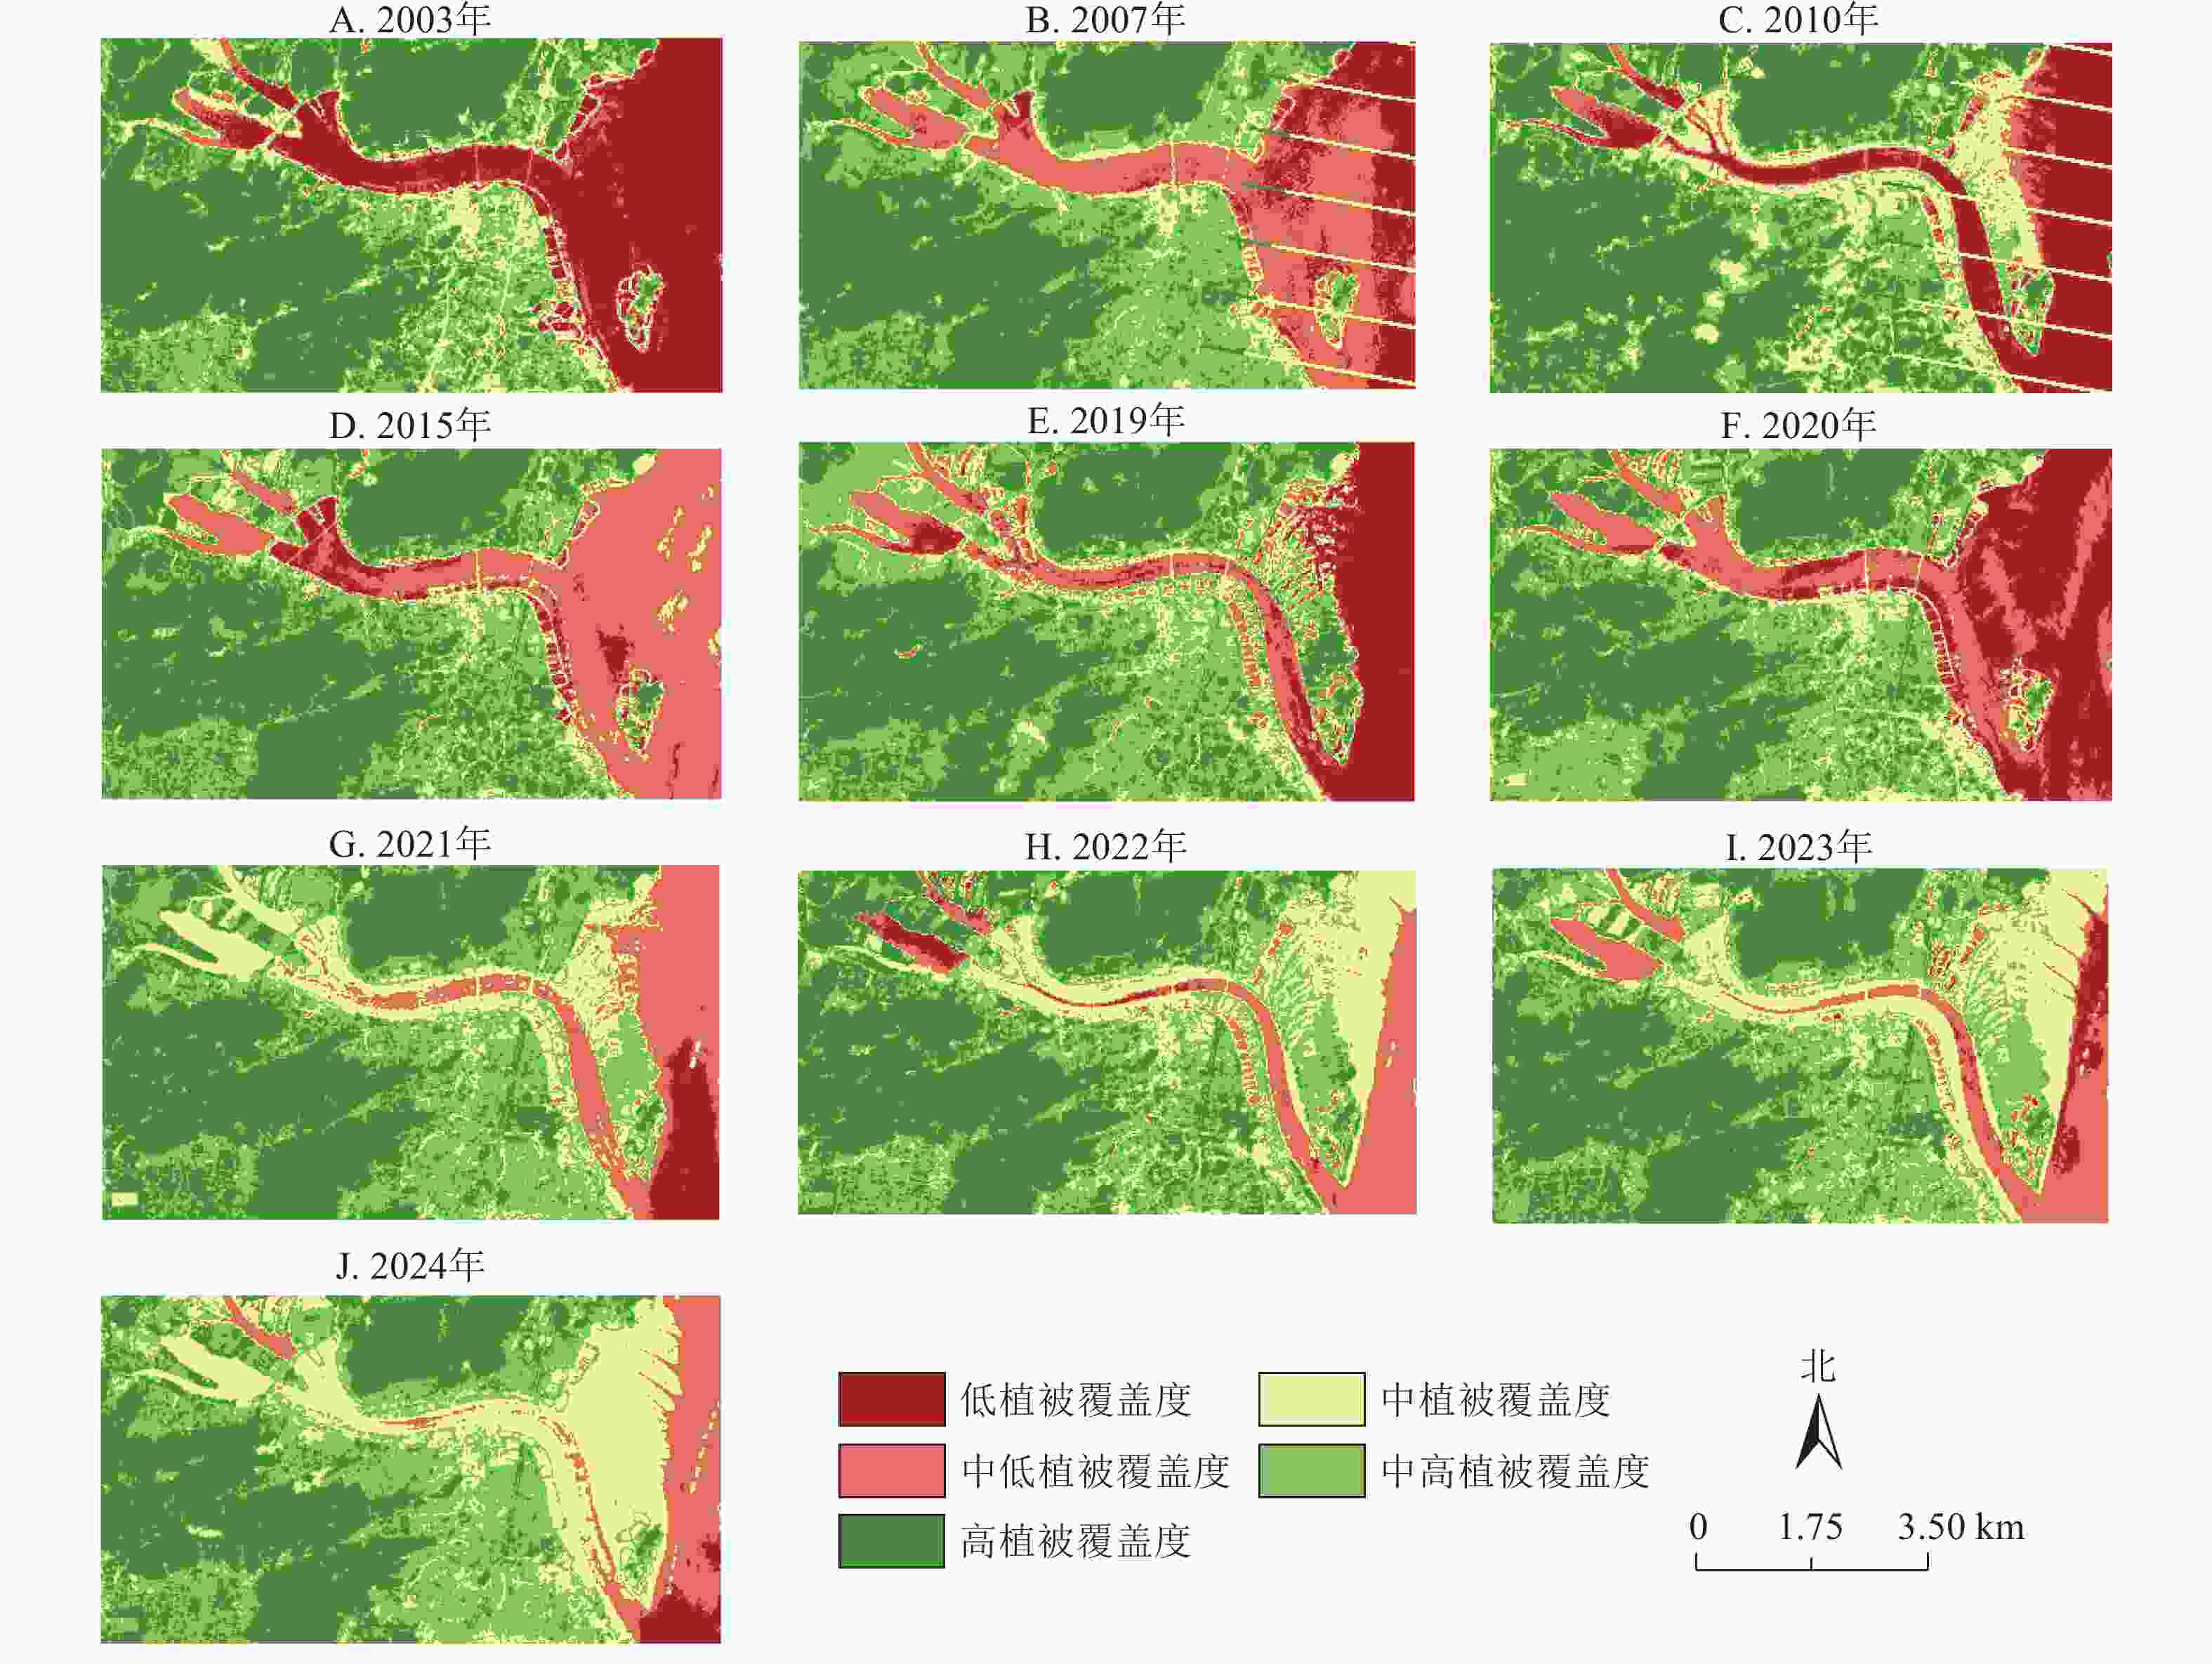
      Figure 2.  Spatial distribution of fractional vegetation cover from 2003 to 2024 in the Qingjiang Estuary

    • 气温、降水、湿度等气候因子是植被生长的重要影响因素,通过影响植被生长所需的水热条件进而影响植被的分布及质量[3334]。2019—2024年乐清年平均最高气候、年平均最低气温、年降水量、年平均相对湿度如图3所示。2019—2024年,除2022年外,研究区年平均最高气温均高于20.0 ℃,年平均最低气温均高于15.0 ℃。2022年气温明显偏低,其年平均最高气温(17.8 ℃)与年平均最低气温(11.6 ℃)均达研究期最低值,较研究期均值分别低2.2和3.4 ℃。2019—2024年研究区年降水量呈现显著年际波动,其中峰值出现在2020年(1 683.7 mm),谷值则出现于2023年(787.9 mm)。年平均相对湿度整体较高,多年平均维持在 70% 以上,年际变化相对较小。

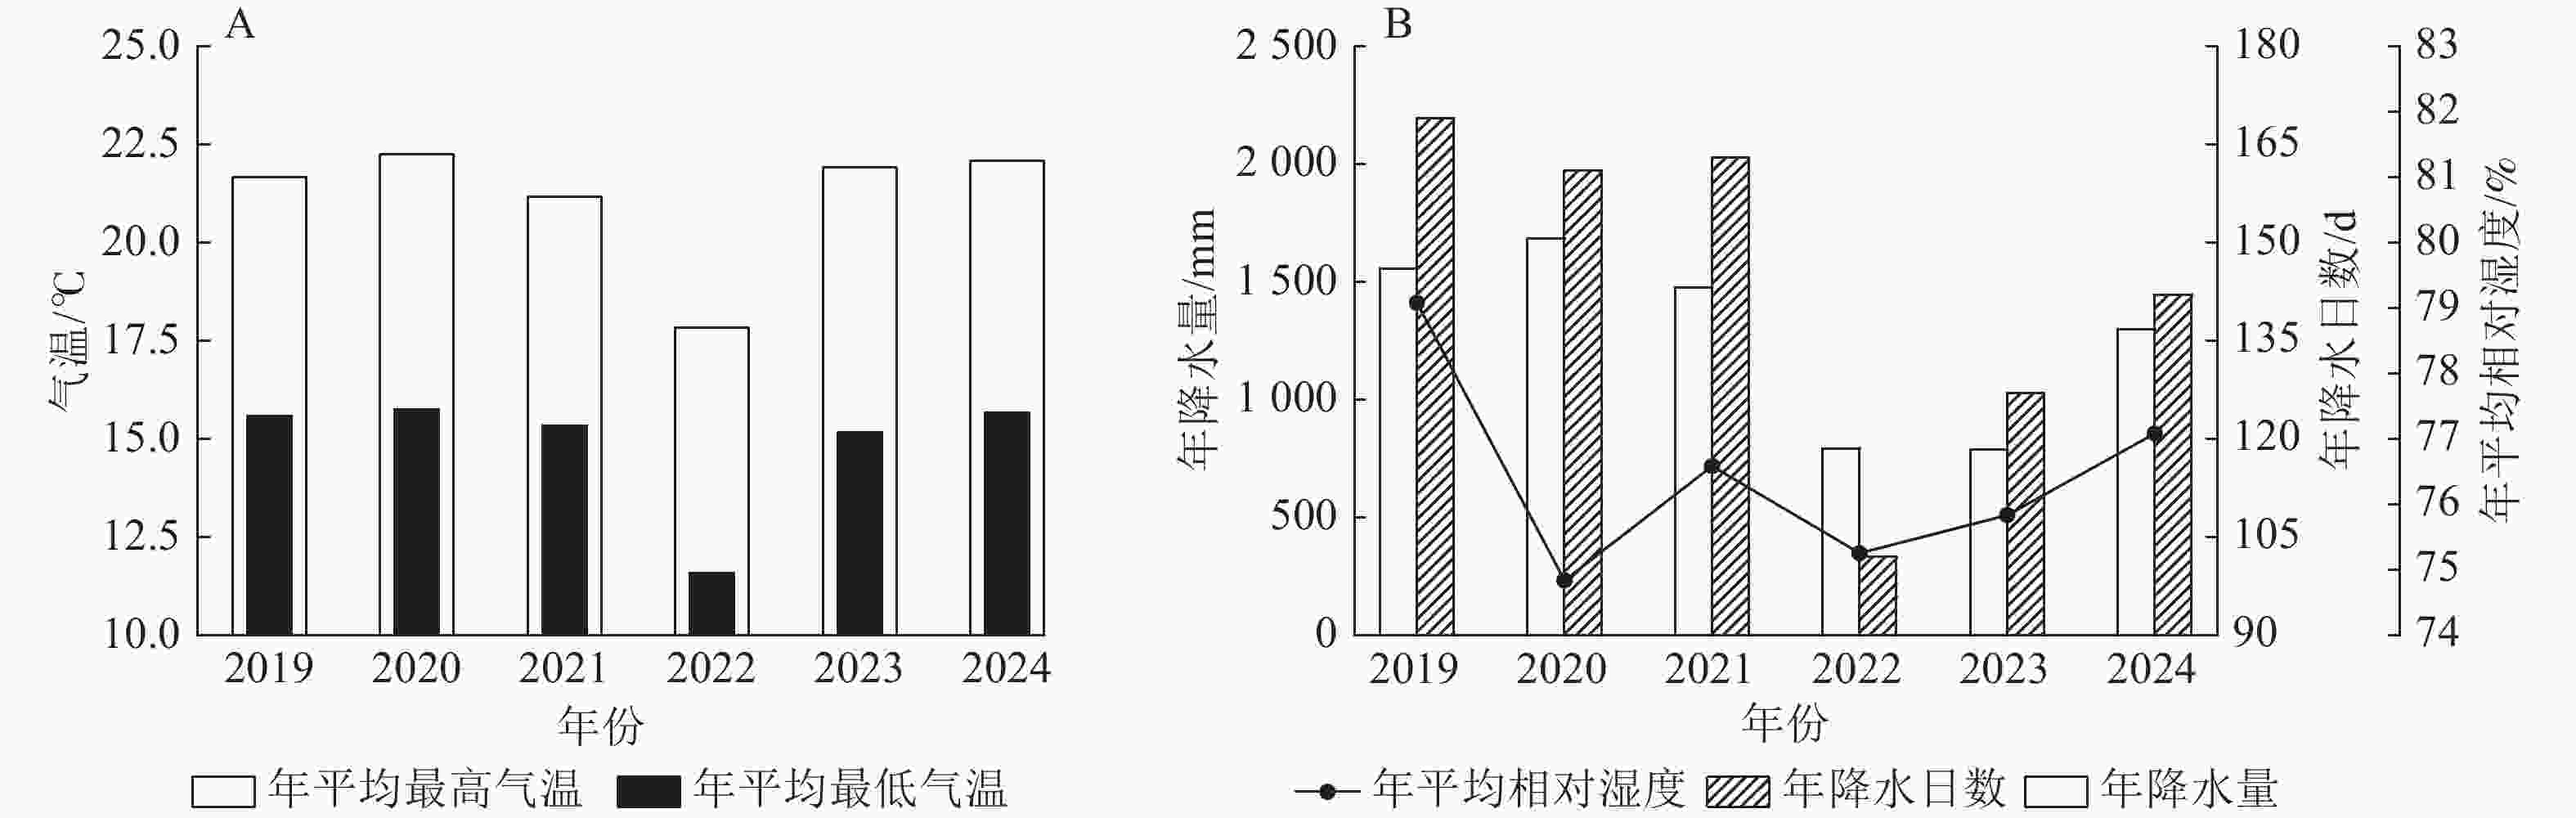
      Figure 3.  Temporal variations in temperature, precipitation, and humidity in Yueqing from 2019 to 2024

      将植被覆盖度与上述气候因子进行Spearman相关性分析(表2)。植被覆盖度与年平均最高气温(ρ=−0.714)和年平均最低气温(ρ=−0.943)均呈负相关,其中年平均最低气温与植被覆盖度达到极显著相关水平(P<0.01)。植被覆盖度与年降水量呈显著负相关(ρ=−0.886, P<0.05),与年降水日数亦呈负相关(ρ=−0.714)。植被覆盖度与年平均相对湿度的相关性较弱且不显著(ρ=−0.143)。

      项目 植被
      覆盖度
      年平均
      最高气温
      年平均
      最低气温
      年降
      水量
      年降水
      日数
      年平均最高气温 −0.714
      年平均最低气温 −0.943** 0.829*
      年降水量 −0.886* 0.371 0.771
      年降水日数 −0.714 0.143 0.543 0.771
      年平均相对湿度 −0.143 −0.143 0.086 0.029 0.543
        说明:*P<0.05; **P<0.01。

      Table 2.  Correlation coefficients between fractional vegetation cover and meteorological factors from 2019 to 2024

    • 本研究表明:2003—2024年乐清湾清江口区域植被覆盖度呈现上升态势,且植被生长状况总体表现优良。植被覆盖等级的空间分布发生显著变化,具体表现为:低及中低覆盖度区域明显缩减,中及中高覆盖度区域呈现持续扩大的态势。

      前期植被覆盖度低主要是由于缺乏有效的植被培育与保护措施。自2006年实施红树林生态修复工程以后,开展了系统性的造林与更新工作,显著改善了生境质量,促进了区域植被覆盖度持续增加。2019年,乐清市对清江入海口两岸等区域实施了生态岸线修复工程[28]。2020年,清江镇开始大力治理互米花草,在治理完成后,开始栽植红树林幼苗。由于当年气候条件较差,持续阴雨低温天气和“黑格比”台风等不利因素对研究区域植被生长有一定程度的负面影响,并且严重影响了红树林幼苗的存活。这些原因导致了研究区植被覆盖度的骤降。此后植被覆盖度的回升,一方面得益于前期红树林栽植形成的生态基础,另一方面可能是加大了对植被保护和修复的投入力度,使得植被能够快速恢复并持续向好发展。鉴于乐清湾清江口区域植被覆盖度的复杂变化情况,应进一步加大对红树林等植被的栽植和保护力度,巩固和提升植被覆盖成果,实现区域生态环境的可持续发展。同时,持续加强对植被生态系统的监测,提前制定应对极端天气等自然灾害的预案,以降低灾害对植被的破坏程度。

      1992—2008年,福建漳江口红树林国家级自然保护区植被覆盖度大于0.400的区域面积占比持续维持在80%以上,其空间格局呈现显著聚集特征[35]。相比之下,广西北海英罗湾红树林在2013—2023年间植被覆盖度值呈现显著波动特征,整体表现为先上升后下降趋势, 植被覆盖度大于0.750的区域面积占比从2013年的46.00%攀升至2018年峰值86.00%,2020年骤降至58.00%,经修复后于2023年恢复至72.00%[17]。进一步分析广西山口红树林保护区研究结果发现,该区植被覆盖度相对较低,不同功能分区植被覆盖度差异显著:核心区均值最大,为0.320,实验区次之,为0.240,缓冲区最小,为0.090[36]。本研究表明:乐清湾清江口的植被覆盖度在亚热带河口湿地中处于中上水平,2019年以来实施的滩涂生境修复工程(包括系统性滩面清理整治、互花米草清除以及红树林种植)成效显著。为巩固现有成果,建议构建“监测-管护-调控”三位一体管理机制:通过遥感监测与地面验证结合,实现植被覆盖度动态追踪;建立潮间带红树苗木补植技术规范,提升植被成活率;开展病虫害的早期预警防控。“监测-管护-调控”机制与《中国红树林保护修复专项行动计划》的“尊重自然,科学修复;因地制宜,有序推进;分级负责,多方参与”原则高度契合。为确保可持续性,建议积极探索将此类管护活动纳入地方生态补偿框架或蓝色碳汇交易体系,为实现红树林资源的长期精准保护与价值实现提供制度保障。

    • 年平均最高气温、年平均最低气温、年降水量、年降水日数均对研究区植被覆盖度产生抑制作用,植被覆盖度对其敏感性均较强。相较而言,年平均相对湿度与植被覆盖度之间几乎不存在相关效应。

      气温是影响研究区植被覆盖度变化的关键气候因子,年平均最低气温对植被生长具有更为显著的调控作用。2022年年平均最高气温和年平均最低气温均为研究期最低,但植被覆盖度却达到最高值。这一现象进一步表明,在本研究区内,较低气温条件可能更有利于植被生长,气温与植被覆盖度之间存在的负向响应关系。这种负相关关系源自自然条件和人类活动共同作用。研究区域处于亚热带季风性海洋气候带,年平均气温维持在15.0 ℃以上。尽管该地区降水总量充足,但其时空异质性显著,且存在明显的年际变异特征。当气温显著升高时,地表蒸发量增大,若同期降水不足或分布不均,会导致土壤墒情下降[37]。土壤条件也是原因之一。乐清沿海平原以海积土为主,高温可能加剧土壤盐碱化,抑制耐盐性较差的植被生长。极端高温的出现会破坏植物的生理机能,可能直接抑制植物光合作用,导致叶片灼伤或蒸腾作用过强[38]。此外,人类活动也是重要因素。乐清市农业高度集约化,如水稻Oryza sativa、铁皮石斛Dendrobium officinale等作物种植依赖人工管理。高温可能增加灌溉需求,加剧水资源竞争。城市化扩张导致植被覆盖减少,热岛效应进一步抬升局部温度,形成恶性循环。

      降水作为植被生长的重要水分来源,对植被的影响同样显著。相关性分析显示,年降水量和年降水日数均与植被覆盖度呈现负相关关系,其中年降水量对植被覆盖度的影响稍大于年降水日数的影响。乐清市具有特殊的地理条件和气候状况,降水量充沛,但若降水日数过多且集中,会导致土壤长期处于过湿状态。长时间阴雨天气会导致光照强度显著降低,植物光合作用效率下降,无法积累足够的碳水化合物[39]。乐清市地形复杂,沿海平原以海积土为主,土壤透水性差,过量降水易引发盐碱化。同时,山区地势陡峭,集中降水会形成快速地表径流,导致水土流失和土壤养分流失,降低土地肥力[40]

      气候因子与植被覆盖度相关性分析的研究结果揭示了气候变化背景下植被生态系统对气温和降水的敏感性响应,为区域生态脆弱性评估提供了重要数据支撑。未来需通过优化灌溉系统和排水设施,推广耐高温且耐涝作物品种,加强生态监测等措施缓解高温和连续阴雨的负面影响。同时,需结合气候预测动态调整管理策略。

      长时间序列植被覆盖度变化表明,2020年是研究区植被覆盖度变化的拐点。尽管在2003—2024年气候因子存在波动,但其变化模式无法解释2019年后研究区植被,特别是清江两岸红树林面积的急剧增加的现象。这一结果强烈显示:存在一个超越自然气候波长的、更强力的驱动因素在2019年后主导了该区域的生态进程,即2019年乐清市启动的海洋岸线整治修复行动是研究区植被恢复的最关键驱动力。2019—2024年生态岸线修复工程实施期内植被的恢复速率和规模,远非2003—2018年这一以自然波动为主的阶段所能比拟。尽管气温和降水等气候因素为植被生长设定了本底条件,但它们在本研究区并非决定性的限制因子。人为的强力干预成功地扭转了原有的生态轨迹,成为主导生态系统演变的新范式。这一结论体现了持续性投入和科学管理不可替代的核心作用。

    • 本研究获得以下研究结论:①在时间尺度上,2003—2024年,乐清湾清江口多年的平均植被覆盖度(0.601~0.694)呈现波动性增长,整体呈现向好态势,年平均增速为0.008,目前稳定在较高水平。②在空间尺度上,2003—2024年,植被覆盖等级的空间分布呈现较为明显的变化特征,具体表现为:低及中低植被覆盖度区域面积之和占研究区总面积的比例明显缩减,由30.33%降至11.17%,中及中高植被覆盖度区域面积之和占比呈现持续扩大的态势,由27.93%升至54.54%。③年平均最高气温、年平均最低气温、年降水量、年降水日数均对植被覆盖度表现出抑制效应。相较而言,年平均最低气温的负向影响更为显著。乐清湾清江口是人类活动的典型区域,且经历了完整的破坏—修复过程。2019年来积极开展红树林修复工作,实施滩涂生态治理,重点清除外来入侵物种互花米草,依托原有养殖池堤岸系统开展红树栽植。红树林修复工程是该区域植被覆盖度增加的主要驱动因素。

Reference (40)

Catalog

    /

    DownLoad:  Full-Size Img  PowerPoint
    Return
    Return