Volume 35 Issue 6
Nov.  2018
Turn off MathJax
Article Contents

WANG Wei, HOU Ping, YAN Shuxian, WANG Yusheng. Atmospheric temperature and pollutants on heavy pollution days in Lin'an, Hangzhou[J]. Journal of Zhejiang A&F University, 2018, 35(6): 997-1006. doi: 10.11833/j.issn.2095-0756.2018.06.002
Citation: WANG Wei, HOU Ping, YAN Shuxian, WANG Yusheng. Atmospheric temperature and pollutants on heavy pollution days in Lin'an, Hangzhou[J]. Journal of Zhejiang A&F University, 2018, 35(6): 997-1006. doi: 10.11833/j.issn.2095-0756.2018.06.002

Atmospheric temperature and pollutants on heavy pollution days in Lin'an, Hangzhou

doi: 10.11833/j.issn.2095-0756.2018.06.002
  • Received Date: 2017-11-25
  • Rev Recd Date: 2018-05-15
  • Publish Date: 2018-12-20
  • To determine the atmospheric temperature and pollutant characteristics during periods of heavy pollution, a statistical analysis using data collected by MTP5 Temperature Profiler and Air Quality Monitoring System was made during serious air pollution incidents in Lin'an over the three years from 2015-2018. A correlation analysis was also conducted, which used statistical time series analysis. Results of the analysis showed that (1) temperature inversions were concentrated in the evening and early morning. When temperature differences between early morning and evening were over 7℃ all day, daytime temperature inversions did not appear. Inversion heights were usually 400 m at the base and 700 m at the top. (2) As for inversion thickness, the maximum was 700 m with an average of 359.9 m. The maximum temperature difference of an inversion was 3.7℃ with average of 0.7℃. The range of temperature had a highly significant correlation with inversion thickness (R2=0.914, P < 0.01). (3) Particulate matter PM2.5 and PM10 were the major pollutants. The concentration of PM2.5 exceeded 115 μg·m-3 and PM10 exceeded 250 μg·m-3. Four gases, SO2, CO, O3, and NO2, always had good quality during the pollution occurrences. (4) The base height of the inversion had highly significant correlations with PM2.5 (P < 0.01) and PM10 (P < 0.01) concentrations; however, no significant correlations were found for the top of the inversion. Thus, the cause of pollution was determined to be a decrease in the temperature inversion and the mass accumulation of particulate matter in the vertical direction.
  • [1] WANG Huilai, WU Dongtao, YE Zhengqian.  Spatial distribution and pollution assessment of heavy metals in typical cultivated soils in southwest Zhejiang Province . Journal of Zhejiang A&F University, 2024, 41(2): 396-405. doi: 10.11833/j.issn.2095-0756.20230389
    [2] XU Huozhong, WU Dongtao, LI Guisong, WU Lintu, YE Chunfu, GUO Bin, MA Jiawei, YE Zhengqian, LIU Dan.  Input and output balance of cadmium (Cd) in cultivated land with moderate pollution in Songyang County . Journal of Zhejiang A&F University, 2021, 38(6): 1231-1237. doi: 10.11833/j.issn.2095-0756.20200728
    [3] SHI Aoao, ZHENG Yi, ZHANG Kun, DENG Zhihua, JIAO Cimei, SUN Shixian.  Remediation potential of Vetiveria zizanioides on the water polluted with prometryn . Journal of Zhejiang A&F University, 2021, 38(6): 1245-1252. doi: 10.11833/j.issn.2095-0756.20200595
    [4] ZHOU Yumiao, HE Ganghui, MA Shaofeng, SHAO Fanglei, FEI Yufan, HUANG Shunyin, ZHANG Haibo.  Ecological effects of microplastics contamination in soils . Journal of Zhejiang A&F University, 2021, 38(5): 1040-1049. doi: 10.11833/j.issn.2095-0756.20200729
    [5] SUN Min, CHEN Jian, LIN Xintao, YANG Shan.  Urban landscape patterns and PM2.5 pollution . Journal of Zhejiang A&F University, 2018, 35(1): 135-144. doi: 10.11833/j.issn.2095-0756.2018.01.018
    [6] XU Weijie, GUO Jia, ZHAO Min, WANG Renyuan, HOU Shuzhen, YANG Yun, ZHONG Bin, GUO Hua, LIU Chen, SHEN Ying, LIU Dan.  Research progress of soil plant root exudates in heavy metal contaminated soil . Journal of Zhejiang A&F University, 2017, 34(6): 1137-1148. doi: 10.11833/j.issn.2095-0756.2017.06.023
    [7] XU Jialin, WU Shuai, LIANG Peng, ZHANG Jin, WU Shengchun.  Heavy metal pollution in rice of Gaohong Town with a health risk assessment . Journal of Zhejiang A&F University, 2017, 34(6): 983-990. doi: 10.11833/j.issn.2095-0756.2017.06.003
    [8] ZHANG Su, LIANG Peng, WU Shengchun, ZHANG Jin, CAO Zhihong.  Temporal and spatial distribution of heavy metal contamination in Gaohong, Lin'an, Zhejiang Province . Journal of Zhejiang A&F University, 2017, 34(3): 484-490. doi: 10.11833/j.issn.2095-0756.2017.03.014
    [9] ZHANG Youqing, LI Kaili, LIU Xingquan, WANG Zhaojun, WU Jun, LU Pin.  Contamination and health risk assessment of dried bamboo shoots in Zhejiang Province . Journal of Zhejiang A&F University, 2017, 34(1): 178-184. doi: 10.11833/j.issn.2095-0756.2017.01.024
    [10] LIU Shenshen, ZHANG Zhen, HE Jinling, MA Youhua, HU Hongxiang, ZHANG Chunge.  Purification effect of aquatic plants on nitrogen, phosphorus and heavy metal polluted water . Journal of Zhejiang A&F University, 2016, 33(5): 910-919. doi: 10.11833/j.issn.2095-0756.2016.05.025
    [11] ZHONG Bin, CHEN Junren, PENG Danli, LIU Chen, GUO Hua, WU Jiasen, YE Zhengqian, LIU Dan.  Research progress of heavy metal phytoremediation technology of fast-growing forest trees in soil . Journal of Zhejiang A&F University, 2016, 33(5): 899-909. doi: 10.11833/j.issn.2095-0756.2016.05.024
    [12] QIAN Li, ZHANG Chao, QI Peng, YU Shuquan.  Sourcing and evaluating heavy metal pollution in the urban topsoil of Yongkang City . Journal of Zhejiang A&F University, 2016, 33(3): 427-433. doi: 10.11833/j.issn.2095-0756.2016.03.008
    [13] HU Yangyong, MA Jiawei, YE Zhengqian, LIU Dan, ZHAO Keli.  Research progress on using Sedum alfredii for remediation of heavy metal-contaminated soil . Journal of Zhejiang A&F University, 2014, 31(1): 136-144. doi: 10.11833/j.issn.2095-0756.2014.01.021
    [14] CHU Shuyi, CHEN Xiaomin, PAN Guowu, XIAO Jibo.  An in situ remediation test for polluted water in the Shangzhuang River . Journal of Zhejiang A&F University, 2014, 31(1): 105-110. doi: 10.11833/j.issn.2095-0756.2014.01.016
    [15] LI Dong-lin, JIN Ya-qin, ZHANG Ji-lin, RUAN Hong-hua.  Heavy metal soil pollution in the Qinhuai River riparian zone . Journal of Zhejiang A&F University, 2008, 25(2): 228-234.
    [16] LIU Xiao-hong, ZHOU Ding-guo.  Hazards and prevention of indoor environment contamination . Journal of Zhejiang A&F University, 2003, 20(3): 297-301.
    [17] CHEN Li-qin.  On environmental pollution related liabilities insurance system . Journal of Zhejiang A&F University, 2003, 20(3): 302-306.
    [18] Huang Yi jiang, Chen Duman, Liu Yuming, Liu Shurong.  Effects of air pollution by sulfur dioxide on masson pine growth . Journal of Zhejiang A&F University, 1998, 15(2): 127-130.
    [19] FanHoubao.  Tree Bark:An Indicator of Air pollution and Precipitation Acidity . Journal of Zhejiang A&F University, 1996, 13(2): 136-140.
    [20] Chen Dongji, Zheng Meizhu.  Effect of Atmospheric Pollution on Growth of Chinese Fir . Journal of Zhejiang A&F University, 1993, 10(2): 169-178.
  • [1]
    POPE R C, DOCKERY D W. Health effects of fine particulate air pollution:lines that connect[J]. J Air Waste Manage Assoc, 2006, 56(6):709-718.
    [2]
    LI Ke, CAI Wenju, LIAO Hong, et al. Weather conditions conducive to Beijing severe haze more frequent under climate change[J]. Nat Clim Change, 2017, 7(4):257-262.
    [3]
    WANG Xiaoping, MAUZERALL D L. Evaluating impacts of air pollution in China on public health:implications for future air pollution and energy policies[J]. Atmos Environ, 2006, 40(9):1706-1721.
    [4]
    YANG Yang, LIU Xiaoyang, LU Zhenghui, et al. Study on depth of atmospheric boundary layerin Gobi Desert regions of the Bosten lake basin[J]. Acta Sci Nat Univ Pekin, 2016, 52(5):829-836.
    [5]
    XU Mimi, XU Haiming, MA Jing. Responses of the East Asian winter monsoon to global warming in CMIP5 models[J]. Int J Climatol, 2016, 36(5):2139-2155.
    [6]
    WANG Huijun, CHEN Huopo, LIU Jiping. Arctic sea ice decline intensified haze pollution in eastern China[J]. Atmos Oceanic Sci Lett, 2015, 8(1):1-9.
    [7]
    WANG Yaoting, LI Wei, ZHANG Xiaoling, et al. Relationship between atmospheric boundary layer and air pollution in summer stable weather in the Beijing urban area[J]. Res Environ Sci, 2012, 25(10):1092-1098.
    [8]
    SORBJAN Z. Structure of the Atmospheric Boundary Layer[M]. Englewood Cliffs:Prentice Hall, 1989:227-227.
    [9]
    YAN Dachun. Zhou Peiyuan's theories of turbulence and their important applications[J]. Sci Sin Phys Mech Astron, 2013, 43(9):1011-1014.
    [10]
    NIEUWSTADT F T M. On the solution of the stationary, baroclinic Ekman-layer equations with a finite boundary-layer height[J]. Boundary-Layer Meteorol, 1983, 26(4):377-390.
    [11]
    CHEN Longxun, ZHOU Xiuji, LI Weiliang, et al. Characteristics of the climate change and its formation mechanism in china in last 80 years[J]. Acta Meteorol Sin, 2004, 62(5):634-646.
    [12]
    WU Dui, LIAO Guolian, DENG Xuejiao, et al. Transport condition of surface layer under haze weather over the pearl river delta[J]. J Appl Meteorol Sci, 2008, 19(1):1-9.
    [13]
    DU Rongguang, QI Bing, GUO Huihui, et al. Characteristics of atmospheric inversion temperature and its influence on concentration of air pollutants in Hangzhou, Zhejiang Province[J]. J Meteorol Environ, 2011, 27(4):49-53.
    [14]
    ZHANG Feiyan, HUANG Zhe, ZHA Ben, et al. The distribution characteristics of AQI in Hangzhou and its correlation analysis with meteorological conditions[J]. J Zhejiang Meteorol, 2016, 37(3):27-32.
    [15]
    JIAN Genmei, ZHU Shaofeng. The relationship between temperature and air pollution in Hangzhou[J]. J Zhejiang Meteorol, 1997, 18(3):44-46.
    [16]
    ZHANG Renhe, LI Qiang, ZHANG Ruonan. Meteorological conditions for the persistent severe fog and haze event over eastern China in January 2013[J]. Sci China Earth Sci, 2014, 57(1):26-35.
    [17]
    MAO Minjuan, LIU Houtong, XU Honghui, et al. The key factor research of haze with the combined application of the multi element data[J]. Acta Sci Circumstantiae, 2013, 33(3):806-813.
    [18]
    ZHOU Tao, RU Xiaolong. Research on the causes and measures of haze weather in Beijing[J]. J North China Electr Power Univ Soc Sci, 2012(2):12-16.
    [19]
    GUO Yufei, LIU Duanyang, ZHOU Bin, et al. Study on haze characteristics in Wuxi and its impact factors[J]. Meteorol Mon, 2013, 39(10):1314-1324.
    [20]
    HONG Ye, MA Yanjun, WANG Xiquan, et al. External influences in the haze episode in the central city group of Liaoning:a case study[J]. Acta Sci Circumstantiae, 2013, 33(8):2115-2122.
    [21]
    PAN Benfeng, WANG Wei, LI Liang, et al. Analysis of the reason of formation and the characteristic of pollutionabout fog or haze at key cities in autumn and winter in China[J]. Environ Sustainable Dev, 2013, 38(1):33-36.
    [22]
    WANG Jing, FU Qingyan, WANG Hanzheng, et al. Study on an infrequent multi-day air pollution episode in Shanghai[J]. Clim Environ Res, 2008, 13(1):53-60.
    [23]
    WANG Yuesai, YAO Li, WANG Lili, et al. Mechanism for the formation of the January 2013 heavy haze pollution episode over central and eastern China[J]. Sci China Ser D:Earth Sci, 2014, 44(1):15-26.
    [24]
    WANG Yuesai, WANG Lili. Sources, influences, and control policies of atmospheric haze pollution[J]. Sci Soc, 2014, 4(2):9-18.
    [25]
    WANG Jing, SHI Runhe, LI Long, et al. Characteristics and formation mechanism of a heavy air pollution episode in Shanghai[J]. Acta Sci Circumstantiae, 2015, 35(5):1537-1546.
    [26]
    XIA Minjie, ZHOU Wenjun, PEI Haiying, et al. Characteristic analysis of lower-level temperature inversion over Nanjing based on L-band radar data[J]. Transac Atmos Sci, 2017, 40(4):562-569.
    [27]
    HUANG Jing, XU Weiping, JIN Xiaocheng. Characteristics analysis of low-altitude temperature inversion layer over Taizhou[J]. Meteorol Environ Sci, 2016, 39(2):113-118.
    [28]
    ZHENG Qingfeng, SHI Jun. Temperature inversion characteristics of lower atmosphere over Shanghai[J]. J Arid Meteorol, 2011, 29(2):195-200, 2.
    [29]
    TONG Yaoqing, YIN Yan, QIAN Ling, et al. Analysis of the characteristics of hazy phenomena in Nanjing area[J]. China Environ Sci, 2007, 27(5):584-588.
    [30]
    LIU Aijun, DU Yaodong, WANG Huiying. Climatic characteristics of haze in Guangzhou[J]. Meteorol Mon, 2004, 30(12):68-71.
    [31]
    SUN Xiaoping, CHEN Yunwei, WANG Tao. Analysis of weather characteristics and prediction method of snow weather in Lin'an[J]. J Zhejiang Meteorol, 2013, 34(4):25-29.
    [32]
    ZHANG Dianguo, WANG Hong, CUI Yaqin, et al. Analysis of atmospheric boundary layer inversion characteristics based on microwave radiometer observations in Ji'nan in 2015[J]. J Arid Meteorol, 2017, 35(1):43-50.
  • 加载中
通讯作者: 陈斌, bchen63@163.com
  • 1. 

    沈阳化工大学材料科学与工程学院 沈阳 110142

  1. 本站搜索
  2. 百度学术搜索
  3. 万方数据库搜索
  4. CNKI搜索

Figures(6)  / Tables(2)

Article views(5017) PDF downloads(560) Cited by()

Related
Proportional views

Atmospheric temperature and pollutants on heavy pollution days in Lin'an, Hangzhou

doi: 10.11833/j.issn.2095-0756.2018.06.002

Abstract: To determine the atmospheric temperature and pollutant characteristics during periods of heavy pollution, a statistical analysis using data collected by MTP5 Temperature Profiler and Air Quality Monitoring System was made during serious air pollution incidents in Lin'an over the three years from 2015-2018. A correlation analysis was also conducted, which used statistical time series analysis. Results of the analysis showed that (1) temperature inversions were concentrated in the evening and early morning. When temperature differences between early morning and evening were over 7℃ all day, daytime temperature inversions did not appear. Inversion heights were usually 400 m at the base and 700 m at the top. (2) As for inversion thickness, the maximum was 700 m with an average of 359.9 m. The maximum temperature difference of an inversion was 3.7℃ with average of 0.7℃. The range of temperature had a highly significant correlation with inversion thickness (R2=0.914, P < 0.01). (3) Particulate matter PM2.5 and PM10 were the major pollutants. The concentration of PM2.5 exceeded 115 μg·m-3 and PM10 exceeded 250 μg·m-3. Four gases, SO2, CO, O3, and NO2, always had good quality during the pollution occurrences. (4) The base height of the inversion had highly significant correlations with PM2.5 (P < 0.01) and PM10 (P < 0.01) concentrations; however, no significant correlations were found for the top of the inversion. Thus, the cause of pollution was determined to be a decrease in the temperature inversion and the mass accumulation of particulate matter in the vertical direction.

WANG Wei, HOU Ping, YAN Shuxian, WANG Yusheng. Atmospheric temperature and pollutants on heavy pollution days in Lin'an, Hangzhou[J]. Journal of Zhejiang A&F University, 2018, 35(6): 997-1006. doi: 10.11833/j.issn.2095-0756.2018.06.002
Citation: WANG Wei, HOU Ping, YAN Shuxian, WANG Yusheng. Atmospheric temperature and pollutants on heavy pollution days in Lin'an, Hangzhou[J]. Journal of Zhejiang A&F University, 2018, 35(6): 997-1006. doi: 10.11833/j.issn.2095-0756.2018.06.002
  • 污染事件发生与大气边界层密切相关[1-7]。20世纪初,边界层理论的提出为这一领域研究奠定了理论基础[8]。1940年,中国学者提出的湍流应力方程,丰富了大气边界层研究内容[9]。20世纪中后期,西方学者提出了局地大气边界层自由对流、大气温度层结等概念[10],陈隆勋等[11]提出大气边界层湍流场结构。进入21世纪,激光雷达和红外技术的运用提高了大气边界层温度研究的精度,发现区域大气污染与逆温出现导致的气流停滞有着密切关系[12-18],强而厚的逆温层和低的逆温层高度将污染物压缩至地面[19-24],可通过大气边界层温度监测为雾霾的预报提供依据[25-28]。由此,大气边界层温度与污染物的关联性成为研究热点问题[29-30]。本研究以杭州市临安区一次严重污染过程作为案例,分析期间近地大气边界层温度变化、逆温产生过程与空气污染出现的关系。

  • 杭州临安(30°15′N,119°43′E),海拔100~150 m,位于浙江省西北部,隶属于杭州市。为亚热带季风性气候,盛行东南季风,年均降水量1 613.9 mm,年平均降水日158.0 d,无霜期年平均237.0 d。临安境内地势自西北向东南倾斜,北、西、南三面环山,东西100 km,南北50 km,总面积3 126.8 km2。西北、西南部山区平均海拔在1 000 m以上,东部河谷平原海拔在50 m以下,东西海拔相差1 770 m[31]。城区空气首要污染物为可吸入颗粒物(PM10)和细颗粒物(PM2.5)。二氧化硫(SO2),二氧化氮(NO2),PM10和PM2.5年日均值分别为8,31,81和45 μg·m-3。2016年空气质量优良天数为312 d,优良率85.2%。

  • 空气质量数据来自中国环境监测总站“全国空气质量实时发布平台”。收集了2015年12月20-25日6 d的临安区人民政府、临安四中2个站点的PM2.5,PM10,二氧化硫(SO2),二氧化氮(NO2),一氧化碳(CO)和臭氧(O3)等逐时数值。评价标准为GB 3095-2012《环境空气质量标准》和HJ 633-2012《环境空气质量指数(AQI)技术规定(试行)》。气温数据由MTP5-HE微波遥感温度廓线仪测定,收集频率为5 min·次-1,接收数据20个·次-1,共收集温度数据34 560个。其工作原理是由一个辐射仪和微波吸收天线,分别发出与吸收微波,测试微波变化,并计算出气温廓线,廓线从地面开始隔50 m测得1个气温数据,点直至1 000 m高处,整个过程由全功能软件完成。

    主要运用统计学中的时间序列分析方法,对测量期间从地面至1 000 m高空中气温变化情况进行分析。由于气温数据量大,采用计算机程序识别逆温状态,筛选出相应特征数据,并通过数据格式转化找出逆温底高、逆温顶高以及对应的气温、逆温厚度和温差等数据。再结合对应时间段内6种污染物变化情况,寻找逆温生成过程与污染演化过程的关系。用SigmaPlot 12.5作图呈现这次严重污染期间气温廓线图。逆温层厚度:ΔH=H2-H1,其中:H1H2分别为逆温层底高、顶高(m);逆温层温度差:ΔT=T2-T1,其中T1T2分别为逆温层底部、顶部温度(℃)[32]

  • 表 1是这次大气污染过程的天气状况。主要特征是阴或小雨、低温和微风,不利于空气扩散。空气湿度大有利于氧化氮类、氧化硫类和氧化碳类气体与水分子结合生成悬浮小颗粒物。

    观测日期 天气状况 T最高/℃ T最低/℃ 风向风力
    2015-12-20 小雨转阴 10.0 5.0 东北风≤3级
    2015-12-21 12.0 6.0 东风≤3级
    2015-12-22 小雨 13.0 8.0 北风≤3级
    2015-12-23 阴转小雨 12.0 8.0 东北风≤3级
    2015-12-24 小雨 10.0 6.0 东北风≤3级
    2015-12-25 阴转多云 11.0 2.0 北风≤3级

    Table 1.  Weather conditions

    表 2是空气质量的日变化过程。主要特征是:连续3 d轻度污染后衍化为1 d的重度污染,随后消弱至中度,之后变为良好,整个过程6 d。主要污染物为PM2.5和PM10。其他指标处在较低状态。

    观测日期 空气质量指数 空气质量等级 PM2.5/(μg·m-3) PM10/(μg·m-3) SO2/(μg·m-3) CO/(μg·m-3) NO2/(μg·m-3) O3/(mg·m-3)
    2015-12-20 120 轻度污染 90.9 128.8 11.4 1.278 57.9 84
    2015-12-21 109 轻度污染 81.8 140 10.4 1.385 68.2 76
    2015-12-22 104 轻度污染 77.1 115.5 9.5 1.418 67.1 78
    2015-12-23 248 重度污染 167.9 294.8 14.1 1.955 78.2 78
    2015-12-24 152 中度污染 106.9 187.6 12.1 1.717 65.1 88
    2015-12-25 67 41.6 77.5 10.2 1.211 45.9 106

    Table 2.  Air quality situation

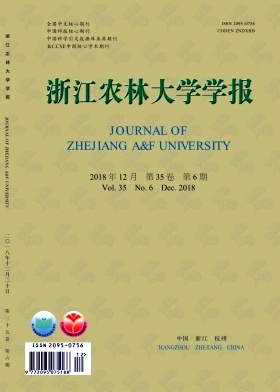
    逆温可分为3个阶段,如图 1~3所示。第1阶段:逆温初始期20日21:00至21日9:00,出现拉长的逆温现象;第2阶段:21日12:00至24日18:00,持续了约40 h的逆温过程,其间22日全天出现持续逆温状态,白天地面气温与空中气温持续升高,距地面高度1 000 m范围内气温基本相同,且距离地面高度700 m处气温持续升高,20:00后距地面高度500 m以下的温度降到8.0 ℃,但700 m高度处气温依然超过10.0 ℃,出现了该次最强烈的逆温温差和最大逆温厚度。连续的逆温使得空气的扩散受阻,酿成了23日严重雾霾。第3阶段:24日20:00以后,逆温逐步消散,25日恢复正常态。

    Figure 1.  Temperature profile on December 20-21, 2015

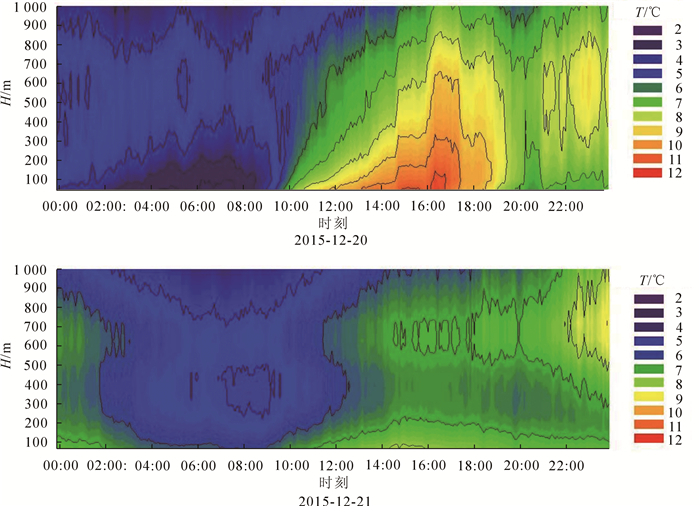
    Figure 2.  Temperature profile on December 22-23, 2015

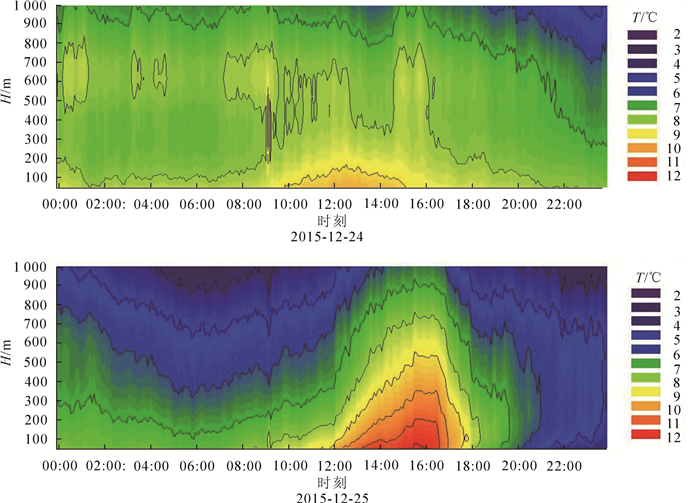
    Figure 3.  Temperature profile on December 24-25, 2015

  • 每日气温层结变化描述如下:20日全天温差为10.0 ℃,最高温度12.0 ℃,最低温度2.0 ℃。当天逆温主要集中在清晨和夜间2个时段。第1阶段(0:00-9:00)共经历9 h,温差小于1.0 ℃,逆温下限与上限分别为400和700 m,平均厚度为350 m。第2阶段,自21:00出现逆温状态,温差小于1.0 ℃,逆温下限与上限为300和800 m,平均厚度为450 m。

    21日全天温差为5.0 ℃,最高温度为9.0 ℃,最低温度为4.0 ℃。全天逆温集中于2个时段:第1阶段(0:00-3:00)共经历3 h,温差小于0.5 ℃,逆温下限与上限处于400和900 m,平均厚度300 m。该阶段内800 m以上温度低于5.0 ℃,200 m以下平均气温度7.0 ℃。第2阶段自14:00以后,温差小于0.5 ℃,逆温厚度不足100 m。18:00起逆温高度处于550~750 m,逆温厚度超过200 m,温差平均为0.8 ℃。20:00后逆温范围不断扩大,逆温厚度逐渐增加,逆温中心温度超过9.0 ℃。

    22日全天出现逆温现象,温差为7.0 ℃,最高温度13.0 ℃,最低温度6.0 ℃。0:00-6:00时间段内,200 m以下平均气温7.0 ℃,700 m处气温10.0 ℃。8:00-16:00距地面高度200 m处气温逐渐升高,平均气温12.0 ℃。700 m处气温自7:00以后超过11.0 ℃且不断升高,逆温厚度从50 m增加到500 m,温差最高达4.0 ℃。10:00-17:00距地面1 000 m高度内气温基本相同且超过11.0 ℃,全过程温差超过1.0 ℃。17:00-19:00地面气温不断下降且低于10.0 ℃,700 m处气温仍高于12.0 ℃且气温不断降低。19:00后700 m处温度逐渐低于12.0 ℃,逆温厚度逐渐减小为200 m,1 h后距地面高度200 m处气温下降至10.0 ℃,700 m处气温下降至11.0 ℃,范围继续缩小。

    23日全天存在逆温现象,温差为5.0 ℃,最高气温11.0 ℃,最低气温6.0 ℃。1:00-4:00近地面温度10.0 ℃,距地面高度700 m气温11.0 ℃。4:00-12:00时间段内300和700 m高度处气温均不断下降,并依然存在温差超过2.0 ℃的逆温现象。12:00后近地面温度开始逐渐升高至11.0 ℃。700 m处气温也开始升高到10.0 ℃。20:00以后距地面200 m以上区域的气温下降至8.0 ℃,200 m以下范围内气温下降至9.0 ℃。

    24日全天温差为6.0 ℃,最高气温10.0 ℃,最低气温4.0 ℃,逆温时段主要集中在11:00前。0:00-8:00距地面高度100 m处气温为8.0 ℃,600~700 m处平均气温8.0 ℃,200~500 m处平均气温7.0 ℃,逆温厚度100 m,温差小于1.0℃。8:00-14:00距地面100 m处气温逐渐升高至10.0 ℃,700 m处气温为8.0 ℃,600 m处个别时段出现气温为10.0 ℃。25日未出现明显逆温现象,温差为8.0 ℃,最高气温12.0 ℃,最低气温4.0 ℃。

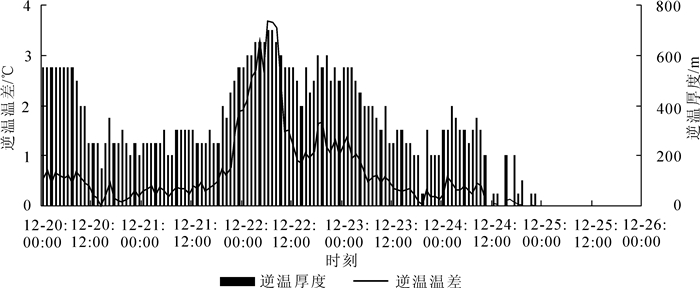
  • 图 4为2015年12月20-25日临安区逐时逆温温差与逆温厚度变化情况。逆温厚度最大值为700 m,平均逆温厚度为359.9 m。逆温温差最大值为3.68 ℃,平均逆温为0.71 ℃。逆温温差最大值与逆温厚度最大值均出现在22日8:00。逆温温差与逆温厚度存在极显著相关(R2=0.914,P<0.01)。

    Figure 4.  Variation between inversion thickness and inversion temperature difference

  • 图 5呈现的是这一过程中临安区人民政府和临安四中2个测点逐时PM2.5和PM10质量浓度与逆温高度变化情况。逆温过程特征为:20日逆温顶高平均高度为600 m,逆温底高从距离地面50 m上升至300 m,全天2种颗粒物质量浓度变化不大。21日18:00后逆温顶高距地面高度由600 m上升至700 m,逆温底高从300 m下降至50 m。22日逆温顶高平均高度700 m,逆温底高平均高度150 m。23日1:00逆温顶高下降为距地面600 m,逆温底高从距离地面150 m上升至450 m,伴随逆温底高上升2种颗粒物质量浓度不断升高。20:00后逆温底高逐渐下降至距地面200 m,2种污染物质量浓度波动下降。24日16:00时后逆温逐渐消散;25日基本不存在逆温现象,2种颗粒物质量浓度处于较低水平。

    Figure 5.  Changes between PM2.5 and PM10 concentration and temperature inversion

    从污染角度看,PM2.5和PM10的发生随逆温而来,又随逆温消散而去,并且伴随逆温过程而积累。PM2.5的变化特征是:总体处在24 h平均75 μg·m-3二级国家标准之上。20-22日夜间PM2.5的空气质量分指数(IAQI)为150,个别时段指数达到200,凌晨和傍晚指数相对较高;23日污染质量浓度达到全过程峰值,临安四中站为284 μg·m-3,区人民政府站为259 μg·m-3,25日迅速下降至50 μg·m-3以下。

    PM10的变化特征是:2个测点的质量浓度变化相差不大,总体处在24 h平均150 μg·m-3二级国家标准之上。20-22日空气质量分指数为150~200,夜间达200。之后2个测点质量浓度波动上升,23日达到整个过程峰值,临安四中站为389 μg·m-3,区人民政府站为395 μg·m-3,25日迅速下降至100 μg·m-3以下。

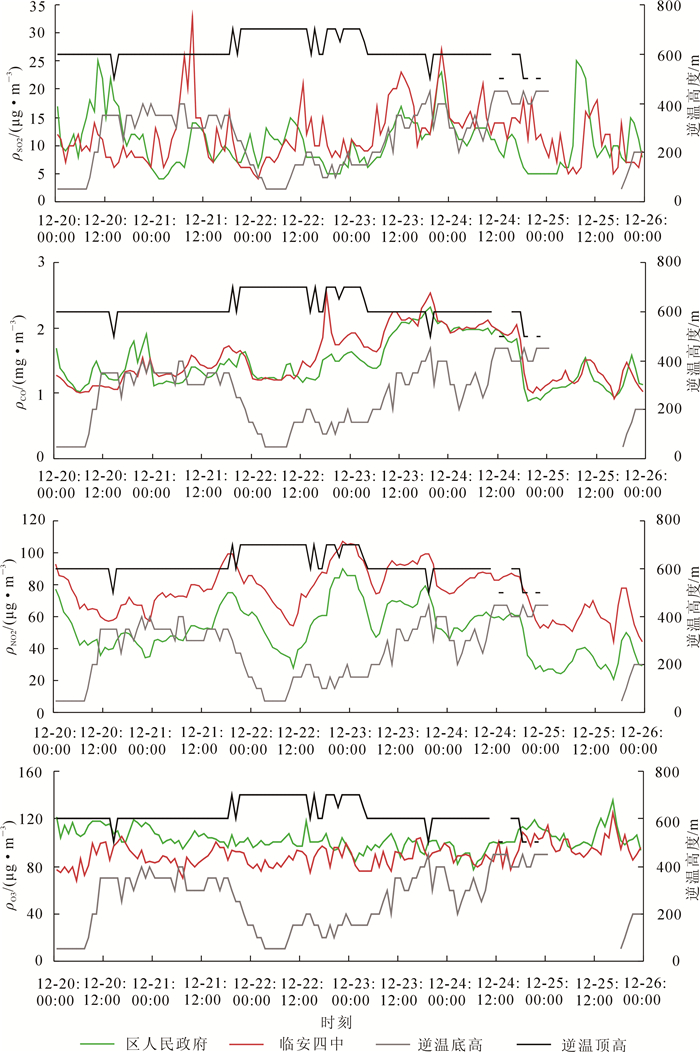
    图 6呈现的是临安区人民政府和临安四中2个测点逐时气体污染物质量浓度与逆温高度变化情况。20日中午临安区人民政府站二氧化硫质量浓度达到当日峰值25 μg·m-3,临安四中站为14 μg·m-3,25日19:00临安区人民政府站出现峰值25 μg·m-3,整个过程二氧化硫质量浓度均低于国家24 h平均50 μg·m-3的一级标准。在一天中早晨质量浓度逐渐升高,中午达到峰值,夜晚降低。

    Figure 6.  Changes between gas pollutant concentration and temperature inversion

    一氧化碳质量浓度在22日23:00达全过程峰值,临安区人民政府站为1.6 mg·m-3,临安四中站为2.5 mg·m-3。23日19:00临安区人民政府站出现峰值为2.3 mg·m-3,临安四中站点为2.5 mg·m-3。全过程在国家一级标准内。

    二氧化氮质量浓度21日19:00到达全天峰值,临安区人民政府站为75 μg·m-3,临安四中站为99 μg·m-3。22日18:00临安区人民政府站和临安四中站质量浓度分别为71和105 μg·m-3。全过程在国家一级标准内。

    2个站臭氧质量浓度变化差异较大,临安四中站平均值优于临安区人民政府站;整个阶段内变化幅度较大。白天出现峰值,夜间降低,全过程在国家一级标准内。

    临安四中站PM10质量浓度与逆温底高极显著相关(R2=0.326,P<0.01),PM2.5质量浓度与逆温底高显著相关(R2=0.101,P<0.05);临安区人民政府站PM10质量浓度与逆温底高显著相关(R2=0.177,P<0.05),PM2.5质量浓度与逆温底高显著相关(R2=0.194,P<0.05)。PM2.5和PM10质量浓度与逆温底高变化基本一致。逆温底高下降使得垂直方向上颗粒物不容易扩散,大量颗粒物聚集造成了严重空气污染事件发生。该结论与杜荣光等[13]和简根梅等[15]结论一致。逆温顶高高度为550~700 m且变化不明显,逆温顶高与2个测站PM2.5和PM10质量浓度不存在显著相关性。PM2.5质量浓度超过115 μg·m-3(对应IAQI为150)和PM10质量浓度超过250 μg·m-3(对应IAQI为150)。二氧化硫、一氧化碳、臭氧和二氧化氮的质量浓度平均值分别为10.7 μg·m-3(σ=4.52),1.5 mg·m-3(σ=0.35),102.7 μg·m-3(σ=8.93),51.5 μg·m-3(σ=15.65)。全过程中前3种气体污染物质量浓度均低于空气质量分指数50对应的质量浓度值150 μg·m-3,5 mg·m-3和160 μg·m-3,二氧化氮质量浓度除个别时间点外也均低于100 μg·m-3(对应IAQI为50)。

  • 研究区逆温现象主要集中在清晨和傍晚,逆温底高和顶高通常为400和700 m。该次雾霾是连续3 d轻度污染后衍化为1 d的重度污染,随后消弱至中度,之后变为良好,整个过程为6 d。污染随逆温而来,又随逆温消散而去,并且伴随逆温过程而积累。

    该次雾霾过程,逆温厚度最大值为700.0 m,平均逆温厚度为359.9 m。逆温温差最大值为3.7 ℃,平均逆温为0.7 ℃。逆温温差与逆温厚度极显著相关(R2=0.914,P<0.01)。

    PM2.5和PM10是主要污染物,该次严重污染期间,两者质量浓度分别超过115和250 μg·m-3;二氧化硫、一氧化碳、臭氧和二氧化氮等4种气体在这次污染过程中始终处在较低的质量浓度状态。

    PM2.5和PM10与逆温底高具有极显著正相关,逆温顶高与2种颗粒物质量浓度不存在显著相关。造成污染的原因是逆温底高度下降,垂直方向上颗粒物扩散受阻而产生大量聚集。

Reference (32)

Catalog

    /

    DownLoad:  Full-Size Img  PowerPoint
    Return
    Return