Volume 37 Issue 5
Oct.  2020
Turn off MathJax
Article Contents

YANG Fan, TANG Mengping. Relationship between site and structure and its influence on biomass in Phyllostachys edulis forest[J]. Journal of Zhejiang A&F University, 2020, 37(5): 823-832. doi: 10.11833/j.issn.2095-0756.20190572
Citation: YANG Fan, TANG Mengping. Relationship between site and structure and its influence on biomass in Phyllostachys edulis forest[J]. Journal of Zhejiang A&F University, 2020, 37(5): 823-832. doi: 10.11833/j.issn.2095-0756.20190572

Relationship between site and structure and its influence on biomass in Phyllostachys edulis forest

doi: 10.11833/j.issn.2095-0756.20190572
  • Received Date: 2019-09-28
  • Rev Recd Date: 2020-04-04
  • Available Online: 2020-10-10
  • Publish Date: 2020-08-20
  •   Objective  The objective of this study is to find out dominant factors affecting the biomass of moso bamboo(Phyllostachys edulis) forest from site factor and stand structure factor, and to analyze the relationship between dominant factors and their effects on stand biomass.  Method  In 10 counties (cities) of Zhejiang Province, 52 sample plots of moso bamboo forest less disturbed by human beings were selected and the dominant factors were obtained by random forest. On this basis, the structural equation model was constructed to analyze the direct, indirect and total effects of each dominant factor on stand biomass.  Result  The results of random forest showed that culm density, average DBH, competition index, soil thickness and altitude were main factors affecting biomass of moso bamboo forest. The results of structural equation model analysis showed that the preset path in the model could be accepted and the collected data could be well reflected. The total effect of culm density, average DBH, competition index and soil thickness was positive, which had positive effect on the biomass of moso bamboo forest. The total effect of altitude was negative, which had negative effect on the biomass of moso bamboo forest. The total effect of average DBH was biggest, which was 0.739. The direct effect of bamboo degree on the biomass of moso bamboo forest was greater than indirect effect. The direct effect of culm density was greater than indirect effect. The indirect effect of soil thickness was biggest, reaching 0.492. Among the site factors, the total effect of soil thickness on the biomass of moso bamboo was greater than that of altitude. The indirect effect of soil thickness, altitude and competition index was greater than the direct effect.  Conclusion  The main component factors of moso bamboo forest, such as culm density and average DBH, are most closely related to the biomass of moso bamboo forest. Altitude, soil thickness and competition index indirectly affect the biomass of moso bamboo forest through the component factors of moso bamboo forest. In the management of moso bamboo forest, the influence of site factors, non-spatial structure, spatial structure and their interrelations on the biomass of moso bamboo forest should be considered comprehensively, and the structure of moso bamboo forest should be adjusted on the basis of making full use of the site potential in order to improve the productivity of moso bamboo forest. [Ch, 3 fig. 3 tab. 40 ref.]
  • [1] DENG Zaichun, ZHANG Chao, ZHU Xiali, FAN Jinming, QIAN Hui, LI Chengrong.  Pinus yunnanensis volume estimation model based on UAV multispectral image . Journal of Zhejiang A&F University, 2024, 41(1): 49-56. doi: 10.11833/j.issn.2095-0756.20230263
    [2] LU Ji, ZHANG Guowei, WU Hao.  Inversion study of above-ground biomass in Taiping Lake Ecological Reserve forests using multi-temporal optical and radar data . Journal of Zhejiang A&F University, 2023, 40(5): 1082-1092. doi: 10.11833/j.issn.2095-0756.20220682
    [3] GONG Yuhao, SUN Yiqun, DONG Chen, HU Yanrong, GAO Weifang.  Site quality evaluation of Cunninghamia lanceolata plantation based on generalized algebraic difference approach and factor selection . Journal of Zhejiang A&F University, 2023, 40(6): 1282-1291. doi: 10.11833/j.issn.2095-0756.20220716
    [4] TAO Shijie, SONG Yandong, WU Qinjiao, WANG Li, ZHOU Ruyi, WU Dian, ZHOU Yufeng, ZHOU Guomo.  Characteristics of volatile organic compounds release in Phyllostachys edulis forests and their relationship with environmental factors . Journal of Zhejiang A&F University, 2023, 40(5): 940-950. doi: 10.11833/j.issn.2095-0756.20230249
    [5] YANG Shaoqin, WANG Xiang, XU Cheng, SHANG Tianqi.  Estimating bamboo forest aboveground biomass based on MODIS time series data . Journal of Zhejiang A&F University, 2022, 39(4): 734-741. doi: 10.11833/j.issn.2095-0756.20210431
    [6] WU Lizhou, WANG Xiaohui, WANG Zhihui, FANG Xin, ZHU Tingyu, DING Lixia.  Crops identification based on hyperspectral data and random forest method . Journal of Zhejiang A&F University, 2020, 37(1): 136-142. doi: 10.11833/j.issn.2095-0756.2020.01.018
    [7] WANG Lei, CUI Ming, LIU Yuguo, ZHOU Mengling, WU Jianhong, ZHOU Taolong.  Relationship between stand growth and impact factors in karst area . Journal of Zhejiang A&F University, 2020, 37(6): 1036-1044. doi: 10.11833/j.issn.2095-0756.20190762
    [8] HE Rongxiao, YANG Fan, CUI Ming.  Urban forest community structure and correlation analysis on the plant diversity index in Haikou City, China . Journal of Zhejiang A&F University, 2019, 36(6): 1142-1150. doi: 10.11833/j.issn.2095-0756.2019.06.011
    [9] DONG Chen, XIA Kai.  Chinese fir forest site association analysis and growth factors in western Zhejiang based on the Apriori algorithm . Journal of Zhejiang A&F University, 2019, 36(4): 741-748. doi: 10.11833/j.issn.2095-0756.2019.04.014
    [10] ZHAO Saisai, TANG Mengping, TANG Sijia, ZHANG Jun, LI Lan, PANG Chunmei, ZHAO Mingshui.  Visualization for a Phyllostachys edulis stands . Journal of Zhejiang A&F University, 2016, 33(5): 826-833. doi: 10.11833/j.issn.2095-0756.2016.05.014
    [11] ZHANG Yang, SHEN Jiahong, ZHANG Fanggang.  Structure and dynamics of forest community in the West Lake Scenic of Hangzhou, China . Journal of Zhejiang A&F University, 2014, 31(4): 589-596. doi: 10.11833/j.issn.2095-0756.2014.04.015
    [12] ZHAO Xiao, LÜ Yulong, WANG Cong, LI Yadan, DU Huaqiang.  Spatial distribution for leaf area index and canopy closure of Phyllostachys edulis stand using Cokriging . Journal of Zhejiang A&F University, 2014, 31(4): 560-569. doi: 10.11833/j.issn.2095-0756.2014.04.011
    [13] ZHANG Lijing, GE Hongli.  Gross primary production in Phyllostachys edulis based on MODIS . Journal of Zhejiang A&F University, 2014, 31(2): 178-184. doi: 10.11833/j.issn.2095-0756.2014.02.003
    [14] CHEN Xiao-chou, LIU Guang-lu, FAN Shao-hui, GUAN Feng-ying, SU Wen-hui, HUANG Jin-hua.  Growth characteristics and biomass distribution of Phyllostachys pubescens stands with changes in fertilization time . Journal of Zhejiang A&F University, 2012, 29(1): 52-57. doi: 10.11833/j.issn.2095-0756.2012.01.010
    [15] CHEN Ya-feng, YU Shu-quan, YAN Xiao-su, YI Li-ta, BAO Chun-quan.  Community structure of three different forests in Tonglu,Zhejiang Province . Journal of Zhejiang A&F University, 2011, 28(3): 408-415. doi: 10.11833/j.issn.2095-0756.2011.03.010
    [16] CUI Rui-rui, DU Hua-qiang, ZHOU Guo-mo, XU Xiao-jun, DONG De-jin, Lü Yu-long.  Remote sensing-based dynamic monitoring of moso bamboo forest and its carbon stock change in Anji County . Journal of Zhejiang A&F University, 2011, 28(3): 422-431. doi: 10.11833/j.issn.2095-0756.2011.03.012
    [17] XU Hui-min, ZHANG Jin-feng, XIANG Hong-mei, GUO Hua.  Sub-alpine forest structure resulting from human disturbances in Shangri-La County,China . Journal of Zhejiang A&F University, 2008, 25(5): 591-596.
    [18] WANG Dong-yun, ZHANG Zhuo-wen, SU Kai-jun, WANG Guang, LEI Yun-fei, LIN Ming-lei, ZHANG Pei, ZHONG Yong.  Hydrology of Phyllostachys pubescens in Liuxihe,Guangdong Province . Journal of Zhejiang A&F University, 2008, 25(1): 37-41.
    [19] HE Ying,  WEI Xin-liang,  CAI Xia,  LI Ke-zhui,  WANG Zhen.  Quantitative analysis of community structure in ecological landscape forests . Journal of Zhejiang A&F University, 2007, 24(6): 711-718.
    [20] YU Yi-wu, WU Jia-sen, JIANG Pei-kun, WU Xiao-hong.  Analysis on nutrient elements in litter under different forests in Huzhou City . Journal of Zhejiang A&F University, 2002, 19(2): 153-156.
  • [1]
    LU Shunbao, RAO Wei, PENG Jiusheng, et al. Effect of site conditions on biomass of Phyllostachys heterocycla var. pubescens [J]. J Zhejiang For Sci Technol, 2008, 28(4): 22 − 27.
    [2]
    QI Lianghua, LIU Guanglu, FAN Shaohui, et al. Effects of different tending measures on carbon density, storage and allocation pattern of Phyllostachys edulis forests in western Fujian Province [J]. J Chin Ecol, 2009, 28(8): 1482 − 1488.
    [3]
    TANG Sijia. Study on Site Classification and Site Quality Evaluation of Phyllostachys pubescen Forest[D]. Hangzhou: Zhejiang A&F University, 2017.
    [4]
    FANG Yeqing, ZHOU Guomo, SHI Yongjun, et al. Relationship of slope aspect and position on biomass and carbon storage in a Phyllostachys edulis stand [J]. J Zhejiang A&F Univ, 2012, 29(3): 321 − 327.
    [5]
    WANG Chen. Effects of Extraneous Factors on the Moso Bamboo Aboveground Biomass and Bamboo Shoots Growth Characteristics[D]. Hefei: Anhui Agriculture University, 2014.
    [6]
    YAO Aijing, ZHU Qingke, ZHANG Yuqing, et al. Present situation and prospect of the study on stand structure [J]. For Invent Plann, 2005, 30(2): 70 − 76.
    [7]
    YU Lin. Study on Density Effect of Phyllostachys edulis Stands in Southern Anhui Province[D]. Beijing: Chinese Academy of Forestry, 2011.
    [8]
    LIU Enbin, SHI Yongjun, LI Yongfu, et al. Non spatial structural characteristic of moso bamboo forest and its dynamics in Zhejiang Province [J]. Sci Silv Sin, 2013, 49(9): 1 − 7.
    [9]
    TANG Mengping, XU Wenbing, CHEN Yonggang, et al. Relationship between spatial structure and biomass of a close-to-nature Phyllostachys edulis stand in Tianmu Mountain [J]. Sci Silv Sin, 2011, 47(8): 1 − 6.
    [11]
    BREIMAN L. Random forests [J]. Mach Learn, 2001, 45(1): 5 − 32.
    [12]
    OLSHEN R A, BREIMAN L, FRIEDMAN J H, et al. Classification and Regression Trees [M]. Chicago: Chapman and Hall, 1984.
    [13]
    LIAW A, WIENER M. Classification and regression by random forest [J]. R News, 2002, 2(3): 18 − 22.
    [14]
    BREIMAN L. Statistical modeling: the two cultures [J]. Stat Sci, 2001, 16(3): 199 − 231.
    [15]
    LIN Nan, WU Baolin, JANSEN R, et al. Information assessment on predicting protein-protein interactions [J]. Bmc Bioinf, 2004, 5(1): 154 − 159.
    [16]
    LIANG Huiling, LIN Yurui, YANG Guang, et al. Application of random forest algorithm on the forest fire prediction in Tahe Area based on meteorological factors [J]. Sci Silv Sin, 2016, 52(1): 89 − 98.
    [17]
    CHEN Liang, ZHOU Guomo, DU Huaqiang, et al. Simulation of CO2 flux and controlling factors in moso bamboo forest using random forest algorithm [J]. Sci Silv Sin, 2018, 54(8): 1 − 12.
    [18]
    CUTLER D R, EDWARDS T C, BEARD K H, et al. Random forests for classification in ecology [J]. Ecology, 2007, 88(11): 2783 − 2792.
    [19]
    WU Zhaolong, DING Xiao. Theory, establishment and application of structural equation model [J]. Sci Technol Manage Res, 2004, 24(6): 90 − 92.
    [20]
    LALIBERTÉ E, TYLIANAKIS J M. Cascading effects of long-term land-use changes on plant traits and ecosystem functioning [J]. Ecology, 2012, 93(1): 145 − 155.
    [21]
    STOMP M, HUISMAN J, MITTELBACH G G, et al. Large-scale biodiversity patterns in freshwater phytoplankton [J]. Ecol, 2011, 92(11): 2096 − 2107.
    [22]
    HUANG Xingzhao, XU Chonghua, XU Jun, et al. Structural equation model analysis of the relationship between environmental and stand factors and net primary productivity in Cunninghamia lanceolata forests [J]. Acta Ecol Sin, 2017, 37(7): 2274 − 2281.
    [23]
    KANG Muyi, DAI Cheng, JI Wenyao, et al. Biomass and its allocation in relation to temperature, precipitation, and soil nutrients in Inner Mongolia grasslands, China [J]. PLoS One, 2013, 8(7): e69561. doi: 10.1370/journal.pone.0069561.
    [24]
    TANG Mengping, XU Wenbing, CHEN Yonggang, et al. Spatial structure optimizing adjustment and control model of Phyllostachys edulis stand [J]. Sci Silv Sin, 2013, 49(1): 120 − 125.
    [25]
    TANG Mengping, CHEN Yonggang, SHI Yongjun, et al. Intraspecific and interspecific competition analysis of community dominant plant populations based on Voronoi diagram [J]. Acta Ecol Sin, 2007, 27(11): 4707 − 4716.
    [26]
    TANG Mengping, LOU Minghua, CHEN Yonggang, et al. Comparative analyses on different mingling indices [J]. Sci Silv Sin, 2012, 48(8): 46 − 53.
    [27]
    ZHOU Guomo. Study on Carbon Storage, Sequestration, Allocation and Distribution in Phyllostachys pubescens Ecosystem[D]. Hangzhou: Zhejiang University, 2006.
    [28]
    FAN Yeqing, ZHOU Guomo, SHI Yongjun, et al. Effects of terrain on stand structure and vegetation carbon storage of Phyllostachys edulis forest [J]. Sci Silv Sin, 2013, 49(11): 177 − 182.
    [29]
    CUI Hongxia, XIONG Deli, ZHANG Wei, et al. Study of effects of different site condition on growth of Phyllostachys pubescens Mazel [J]. Hubei For Sci Technol, 2008(1): 8 − 11.
    [30]
    RCHER K J, KIMES R V. Empirical characterization of random forest variable importance measures [J]. Comput Stat Data Anal, 2008, 52(4): 2249 − 2260.
    [31]
    GRACE J B, ANDERSON T M, SEABLOOM E W, et al. Integrative modelling reveals mechanisms linking productivity and plant species richness [J]. Nature, 2016, 529: 390 − 393.
    [32]
    HOYLE R H. Handbook of Structural Equation Modeling [M]. New York: Guilford Press, 2012.
    [33]
    WANG Yangdong. Current research on bamboo culm form [J]. J Bamboo Res, 2001, 20(4): 28 − 32.
    [34]
    CUI Ka, HE Caiyun, ZHANG Jianguo, et al. Temporal and spatial profiling of internode elongation-associated protein expression in rapidly growing culms of bamboo [J]. J Proteome Res, 2012, 11(4): 2492 − 2507.
    [35]
    NIE Daoping, XU Deying, ZHU Yusheng. Effect of stand structure, site condition and management method on the productivity of bamboo stands [J]. For Res, 1995, 8(5): 564 − 569.
    [36]
    CHEN Cunji. Preliminary study on density effect of mao bamboo plantation [J]. J Fujian For Coll, 1992, 12(1): 98 − 104.
    [37]
    LIN Jianzhong, LIANG Wenbin, CAO Liuqing, et al. Biomass structure change of Phyllostachys pubescens plantation [J]. Hunan For Sci Technol, 2016, 43(1): 86 − 92.
    [38]
    CHENG Xiaoyang, FANG Yuejin, ZHAN Hongzhang, et al. Research on the effect of different environment condition to moso bamboo [J]. World Bamboo Rattan, 2004, 2(4): 26 − 27.
    [39]
    JIANG Hang, GAO Fei, CUI Xiaoyang. Soil organic carbon storage and effects of topographical factors of the secondary forest region of Maoer Mountains [J]. For Eng, 2015, 31(3): 15 − 20.
    [40]
    XU Lin, SHI Yongjun, FANG Huiyun, et al. Vegetation carbon stocks driven by canopy density and forest age in subtropical forest ecosystems [J]. Sci Total Environ, 2018, 631/632: 619 − 626.
  • 加载中
通讯作者: 陈斌, bchen63@163.com
  • 1. 

    沈阳化工大学材料科学与工程学院 沈阳 110142

  1. 本站搜索
  2. 百度学术搜索
  3. 万方数据库搜索
  4. CNKI搜索

Figures(3)  / Tables(4)

Article views(1306) PDF downloads(136) Cited by()

Related
Proportional views

Relationship between site and structure and its influence on biomass in Phyllostachys edulis forest

doi: 10.11833/j.issn.2095-0756.20190572

Abstract:   Objective  The objective of this study is to find out dominant factors affecting the biomass of moso bamboo(Phyllostachys edulis) forest from site factor and stand structure factor, and to analyze the relationship between dominant factors and their effects on stand biomass.  Method  In 10 counties (cities) of Zhejiang Province, 52 sample plots of moso bamboo forest less disturbed by human beings were selected and the dominant factors were obtained by random forest. On this basis, the structural equation model was constructed to analyze the direct, indirect and total effects of each dominant factor on stand biomass.  Result  The results of random forest showed that culm density, average DBH, competition index, soil thickness and altitude were main factors affecting biomass of moso bamboo forest. The results of structural equation model analysis showed that the preset path in the model could be accepted and the collected data could be well reflected. The total effect of culm density, average DBH, competition index and soil thickness was positive, which had positive effect on the biomass of moso bamboo forest. The total effect of altitude was negative, which had negative effect on the biomass of moso bamboo forest. The total effect of average DBH was biggest, which was 0.739. The direct effect of bamboo degree on the biomass of moso bamboo forest was greater than indirect effect. The direct effect of culm density was greater than indirect effect. The indirect effect of soil thickness was biggest, reaching 0.492. Among the site factors, the total effect of soil thickness on the biomass of moso bamboo was greater than that of altitude. The indirect effect of soil thickness, altitude and competition index was greater than the direct effect.  Conclusion  The main component factors of moso bamboo forest, such as culm density and average DBH, are most closely related to the biomass of moso bamboo forest. Altitude, soil thickness and competition index indirectly affect the biomass of moso bamboo forest through the component factors of moso bamboo forest. In the management of moso bamboo forest, the influence of site factors, non-spatial structure, spatial structure and their interrelations on the biomass of moso bamboo forest should be considered comprehensively, and the structure of moso bamboo forest should be adjusted on the basis of making full use of the site potential in order to improve the productivity of moso bamboo forest. [Ch, 3 fig. 3 tab. 40 ref.]

YANG Fan, TANG Mengping. Relationship between site and structure and its influence on biomass in Phyllostachys edulis forest[J]. Journal of Zhejiang A&F University, 2020, 37(5): 823-832. doi: 10.11833/j.issn.2095-0756.20190572
Citation: YANG Fan, TANG Mengping. Relationship between site and structure and its influence on biomass in Phyllostachys edulis forest[J]. Journal of Zhejiang A&F University, 2020, 37(5): 823-832. doi: 10.11833/j.issn.2095-0756.20190572
  • 毛竹Phyllostachys edulis林是中国南方一种重要的森林类型,具有生长快、周期短、产量高、用途广等特点。毛竹生物量的研究历来是竹类研究的一项重要内容,也是研究竹林生态系统物质循环的基础,对于评价毛竹的生产力及提高营林水平和综合利用其产品都有着重要的意义[1]。毛竹林生物量不仅是反映林地生产力的指标,也是度量生态功能如碳储量的重要因子[2]。立地是森林生长发育的重要物质基础[3]。范叶青等[4]研究发现:坡向、坡位对毛竹林分生物量有显著影响。王晨[5]研究表明:不同海拔高度毛竹林的地上生物量存在显著差异。林分结构是林分功能的基础和表现[6]。在一定立地和经营管理条件下,毛竹林生物量取决于竹林结构,合理的竹林结构能够提高竹林的产量[7]。根据是否与毛竹的空间位置有关,毛竹林分结构可分为空间结构和非空间结构。刘恩斌等[8]研究发现:影响毛竹林分生物量的主要非空间结构因子依次是毛竹株数与林分平均胸径。汤孟平等[9]研究发现:近自然毛竹林的空间结构与生物量之间存在不可忽视的关系。以上研究表明立地因子和林分结构与毛竹林生物量有密切的关系。但是,现有研究仅从立地因子、林分非空间结构或空间结构单一方面分析毛竹林生物量的主要影响因子,而关于立地因子、林分空间结构和非空间结构对毛竹林生物量的综合影响研究尚少见报道。分析多因子对因变量的综合影响,应当包括确定主导因子以及分析主导因子的直接和间接影响。目前,主要采用相关分析、回归分析、方差分析等方法,确定影响毛竹林生物量的主导因子。方差分析可以判断各因子对毛竹林生物量是否具有显著影响,但无法评估影响大小[4]。相关分析能够描述各因子与毛竹林生物量之间关系的密切程度,但没有考虑各因子之间的相互关系对生物量的影响[8, 10]。回归分析可以分析因变量与多个自变量的关系,通过回归系数和显著性统计可以揭示各因子对毛竹林生物量的影响大小,但对多重共线性敏感,且理论上的假设限制也较苛刻,如变量独立性、正态性、线性等[10]。随机森林(random forest,简称RF)是由BREIMAN[11]提出的一种基于分类树的算法[12],可以评估解释变量的重要性[13]。由于随机森林在理论上的假设限制较回归分析宽松,且具有不容易陷入过拟合、对变量的多元共线性不敏感、对数据集的适应性强等优点[14],因此,被广泛应用于评估变量的重要性和变量的筛选[15-17]。但将随机森林应用于筛选出立地因子、林分空间结构和非空间结构中影响毛竹林生物量的主导因子研究尚少见报道。随机森林虽然考虑了解释变量之间的交互作用[18],但随机森林依然无法解析解释变量对因变量的直接、间接和总影响。结构方程模型(structural equation model,简称SEM)整合了路径分析、验证性因子分析与一般统计检验方法,可同时分析一组具有因果关系的方程式[19],可以用来揭示解释变量间的复杂关系及其对因变量的直接、间接和总影响[20-21]。近年来,结构方程模型已广泛应用于分析气候、土壤、林分结构等因素对森林生物量的直接、间接和总影响[22-23]。因此,将结构方程模型应用于分析影响毛竹林生物量的主导因子对毛竹林生物量的直接、间接和总影响的研究值得探讨。本研究以浙江省少受人为干扰的毛竹林为对象,通过随机森林从立地因子、林分非空间结构因子和空间结构因子中筛选出影响毛竹林生物量的主导因子。在此基础上,建立毛竹林生物量与主导因子的结构方程模型,揭示主导因子对毛竹林生物量的直接、间接和总影响,旨在为毛竹林可持续经营提供理论依据。

  • 浙江省地处中国东南沿海(27°06′~31°11′N,118°01′~123°10′E),东临东海,南接福建,西与江西、安徽相连,北与上海、江苏接壤。陆地总面积10.18 万km2,约占全国的1.06%,其中:山地和丘陵占70.4%,平原和盆地占23.2%,河流和湖泊占6.4%,故有“七山一水二分田”之说。在全国植被分区上属于中亚热带常绿阔叶林北部亚地带和南部亚地带,主要植被为针叶林、针阔混交林、阔叶林、灌木林和竹林。地带性植被为中亚热带常绿阔叶林。

    根据2017年《浙江省森林资源及其生态功能价值公告》:全省森林605.68 万hm2,森林覆盖率为60.96%。竹林面积91.02 万hm2,占森林面积的15.03%。毛竹林面积79.75 万hm2,占竹林面积的87.62%。

  • 2017−2019年,根据浙江省森林资源一类调查的系统抽样样地中的毛竹林样地分布较多的10个县(市、区)为调查区域(表1),包括:浙江南部的丽水市庆元县和温州市泰顺县,西部的衢州市常山县,中部的金华市武义县和绍兴市诸暨市,东部的宁波市宁海县和台州市黄岩区以及北部的湖州市安吉县、杭州市临安区和宁波市余姚市。在调查区域内,选择少受人为干扰的近自然毛竹林,设置10 m×10 m的样地共52个,对每个样地进行每木调查,测定胸径、年龄、胸高节长等因子。根据样地每木调查结果,按照胸径分布范围,在大、中、小径级各随机选取1株梢头完整且无病虫害的样竹,共156株。用锯子在样竹根颈处将其伐倒,用皮尺测量竹高。自竹秆基部向上,将竹节从小到大依次编号,称之为节号。用围尺测量每一个竹节的竹节长和竹节中央直径。用游标卡尺测量基部、胸高处和1/2高处东、南、西、北的壁厚,取4个方位壁厚的平均值作为对应位置的壁厚。取3株样竹秆形结构因子的平均值作为样地秆形结构指标。在样地中心挖取1个土壤剖面,用围尺量取土层厚度。取表层土样(0~20 cm)作为样地土壤样品,用自封袋保存好土样,将样品带回实验室进行土壤理化性质测定。pH采用电位法测定;土壤有机质采用浓硫酸-重铬酸钾外加热法测定;碱解氮采用碱解扩散法测定;有效磷采用盐酸-氟化铵法测定;速效钾采用火焰分光光度法测定。

    地名纬度(N)经度(E)年均气温/℃年均降水量/mm样地数量/个样竹数量/株
    余姚30°03′121°09′16.21 361824
    临安30°23′118°51′16.41 628412
    诸暨29°43′120°32′16.31 373618
    安吉30°38′119°40′15.81 420412
    宁海29°29′121°25′16.41 480618
    泰顺27°30′119°42′17.91 670412
    黄岩28°38′121°17′17.01 676412
    武义28°54′119°48′17.91 546618
    常山28°51′118°30′16.31 700618
    庆元27°27′119°30′17.41 760412

    Table 1.  Overview of the study area

  • 根据是否与毛竹空间位置有关,毛竹林分结构包括空间结构和非空间结构。本研究选择立竹度(样地株数)、林分平均胸径、郁闭度、年龄均匀度、秆形结构因子作为林分非空间结构指标,以聚集指数、竞争指数和年龄隔离度作为空间结构的基础指标。统计特征见表2

    统计
    指标
    年龄
    均匀度
    林分平均
    胸径/cm
    立竹度/
    (株·hm−2)
    郁闭度竞争
    指数
    年龄
    隔离度
    聚集
    指数
    平均高/m平均
    胸高竹
    节长/cm
    平均
    基部
    壁厚/mm
    平均
    胸高
    壁厚/mm
    平均
    1/2高
    壁厚/mm
    平均
    1/2高
    节号
    均值  0.8610.514 000.000.805.470.590.9414.6022.7016.7412.076.5728.00
    标准差 0.10 1.281 367.970.091.380.110.12 1.68 3.38 1.9912.370.67 2.70
    极小值 0.66 7.081 600.000.602.880.300.7310.8016.4012.49 8.525.2524.00
    极大值 1.0012.948 100.000.958.810.841.2418.4032.0021.9799.228.3339.00
    变异系数0.12 0.12 0.340.110.250.180.13 0.11 0.15 0.12 1.020.10 0.09

    Table 2.  Descriptive statistical characteristics of structure factors of bamboo forests

    统计
    指标
    平均
    竹节数
    平均1/2
    高竹节
    长/cm
    平均最
    长竹节
    长/cm
    海拔
    高度/m
    坡度/
    (°)
    土层厚
    度/cm
    pH土壤
    有机质/
    (g·kg−1)
    碱解氮/
    (mg·kg−1)
    有效磷/
    (mg·kg−1)
    速效钾/
    (mg·kg−1)
    毛竹林
    生物量/
    (t·hm−2)
    均值  60.0034.7035.40 35.4033.6037.005.5430.90242.2421.40 94.65 64.06
    标准差  4.44 3.66 4.20 267.97 6.2014.450.3617.80109.0517.81 56.14 23.47
    极小值 51.0025.9019.00 71.4020.0019.504.5314.00 70.00 3.35 34.00 23.26
    极大值 72.0042.1043.101 243.0046.0088.006.2588.90530.8876.70327.00124.60
    变异系数 0.07 0.11 0.12 0.81 0.18 0.390.07 0.58 0.45 0.83 0.59 0.37
  • 毛竹林分平均胸径计算公式为:

    式(1)中:N为样地中毛竹总株数;di为第i株毛竹的胸径(cm);Dg为毛竹林分平均胸径(cm)。

  • 毛竹是异龄纯林,考虑到平均年龄无法准确描述毛竹林年龄特征,因此,采用不同龄级毛竹株数的分布均匀程度来代表毛竹林的年龄结构[24]。毛竹林各龄级株数分布均匀程度可用Shannon均匀度指数描述[24]。计算公式为:

    式(2)中:S为龄级数;Pi是第i龄级的株数比例;A是年龄均匀度。

  • 聚集指数是检验种群空间分布格局的常用指数。计算公式如下所示:

    式(3)中:ri表示第i株毛竹到其最近邻毛竹的距离;F表示样地面积;N表示样地内毛竹总株数;R是林分聚集指数。

  • 采用基于Voronoi图的Hegyi竞争指数[25]。计算公式如下所示:

    式(4)中:di是第i株对象竹的胸径;dj是第j株相邻竹的胸径;Lij是第i株对象竹到第j株相邻竹的距离;ni是基于Voronoi图的所有相邻竹株数;ICi是第i株对象竹的竞争指数。

    取样地内全部竹子竞争指数的平均值作为林分竞争指数。计算公式为:

    式(5)中:IC表示林分竞争指数;N表示样地内毛竹总株数;ICi表示第i空间结构单元中对象竹的竞争指数。

  • 本研究采用全混交度描述毛竹林的空间隔离度[26]。全混交度的计算公式为:

    式(6)中:Mci表示第i空间结构单元中对象竹的全混交度;Di表示空间结构单位的Simpson指数,$D_{i}=1-\displaystyle\sum\limits_{j=1}^{s_{i}} p_{j}^{2} $Di的取值范围为[0, 1];ci表示对象竹的最近邻竹中成对相邻竹不是同一竹龄的个数;ni表示最近邻竹的株数;$\dfrac{{{c_i}}}{{{n_i}}}$表示最近邻竹的年龄隔离度;Mi表示简单混交度,${M_i} = \dfrac{\,1\,}{\,n\,}\displaystyle\sum\limits_{j = 1}^{{n_i}} {{v_{i,j}}} $,如果第i对象竹和第j最近邻竹年龄相同,${{v_{i,j}}}=$0,否则等于1。

    取样地内全部竹子年龄隔离度平均值作为林分年龄隔离度。计算公式为:

    式(7)中:M表示林分年龄隔离度;N表示样地内毛竹总株数;MCi表示第i空间结构单元中对象竹的年龄隔离度。

  • 竹秆是毛竹的主体,秆形结构是毛竹研究的重要内容之一。本研究选择8个具有代表性秆形结构指标作为毛竹林分结构指标。9个指标分别为平均高、平均竹节数、平均胸高节长、平均1/2高节长、平均1/2高节号、平均最长竹节长、平均基部壁厚、平均胸高壁厚和平均1/2高壁厚。

  • 单株毛竹生物量采用以下公式计算[27]

    式(8)中:W为单株毛竹生物量(kg·株−1);A为单株毛竹年龄(度);D为毛竹胸径(cm)。毛竹林生物量指标是在计算单株毛竹生物量的基础上,累加样地中所有毛竹的生物量求得。

  • 以坡度、坡向、坡位、土层厚度、海拔高度、土壤有机质、碱解氮、有效磷、速效钾和土壤pH作为样地立地指标。坡向与坡位为描述性指标,对其进行数量化。坡位分为3个等级:上坡为1,中坡为2,下坡为3[28]。坡向分为3个等级:阳坡为1,阴坡为2,半阴半阳坡为3[29]。立地因子描述性统计见表2

  • 采用随机森林和结构方程模型相结合的方法,分析毛竹林生物量与立地因子和结构因子之间的关系。首先,采用随机森林,从立地因子和结构因子中筛选出影响毛竹林生物量的主导因子,然后,利用结构方程模型分析主导因子对毛竹林生物量的直接、间接和总影响。

  • 随机森林通过自助法重采样(bootstrap)从n个原始样本集中有放回地重复随机抽取n个样本生成袋内数据,未被采样的数据作为袋外数据(out-of-bag data)。袋外数据作为测试集用于计算袋外误差(out-of-bag error)。袋内数据作为决策树的根节点,在决策树的每个节点处随机选择m个特征(mtry),并在m个特征中选择1个最具有分类能力的特征进行分裂,决策树最大限度地生长,不做任何修剪,所有决策树组合成随机森林。随机森林可以用于分类和回归,当用于回归时,将所有决策树预测值的平均值作为最终值。本研究通过置换检验,根据袋外观测值和模型预测值之间均方误差的增加量(IncMSE)来评估特征变量的重要性[13,30]。根据特征变量的重要性及影响显著性判断影响毛竹林生物量的主导因子。随机森林分析均通过R 3.5.3进行,随机森林的建立基于randomForest包完成,变量的显著性和重要性基于rfPermute包完成。

  • 结构方程模型可以量化变量之间的直接和间接影响,检验整体模型是否具有统计学意义,并提供对数据的准确描述。结构方程模型分析过程主要包括以下3个步骤。①模型设定:基于已有知识和理论分析,预设因子之间的关系,构造初始模型。②模型估计:在估计拟合指标时采用卡方检定,估计参数时采用极大似然估计法。为更好满足结构方程模型的正态性和线性假设,结构方程模型分析所用数据均进行自然对数转换[23]。③模型评价与修正:根据卡方统计量相对应的P值、拟合优度指数(goodness of fit,IGFI)、相对拟合指数(comparative fit index,ICFI)和标准化残差均方根(standardized root mean square residual,RSRMR)来评价模型,具体的准则为P≥0.05,IGFI>0.95,ICFI>0.95,RSRMR<0.08[31-32]。若模型拟合效果不佳,根据路径修正系数和理论分析对模型进行修正。结构方程模型的建立及运算均通过软件AMOS 21.0完成。

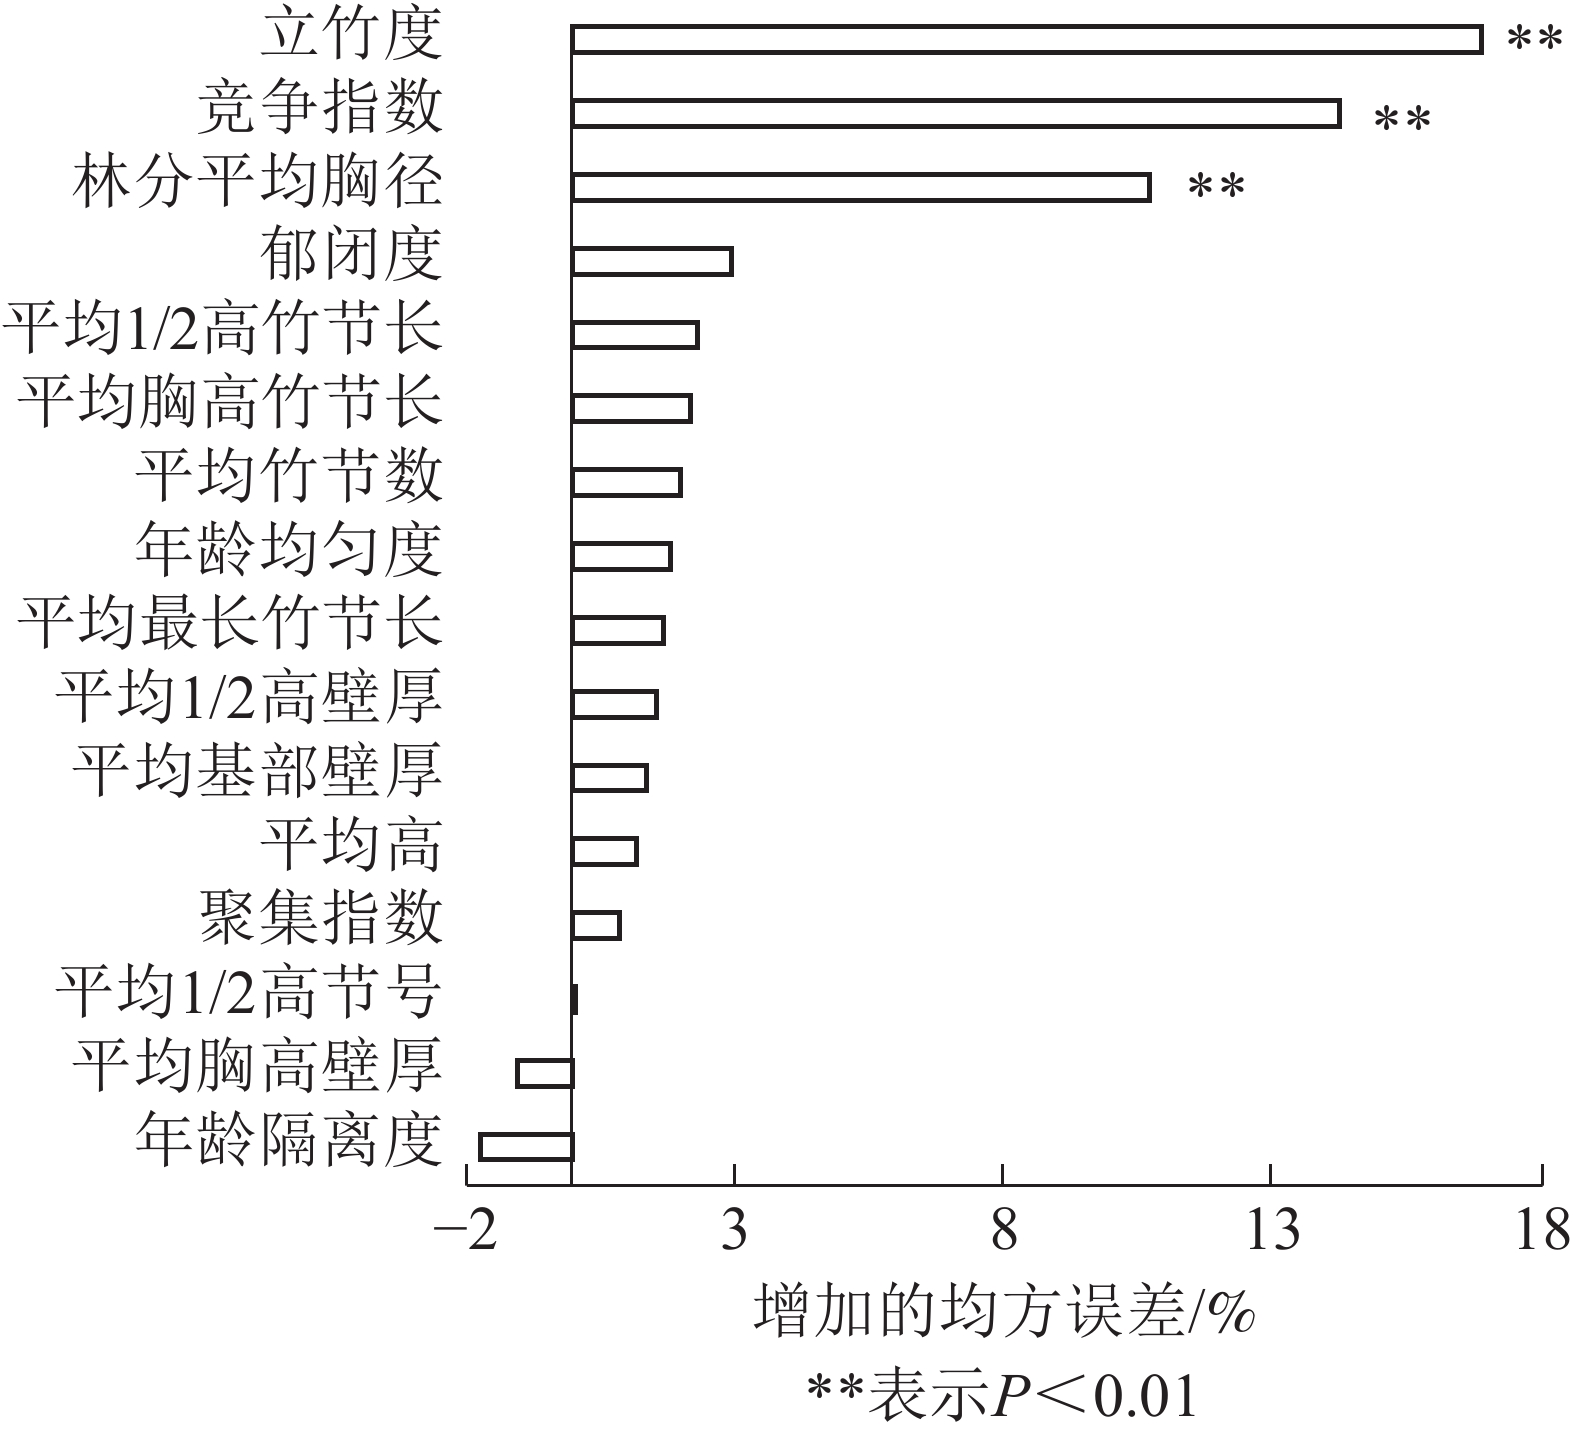
  • 采用随机森林,从立地因子和结构因子中分别筛选出影响毛竹林生物量的主导因子。各特征变量的重要性及影响显著性如图1图2所示。由图1可见:结构因子中立竹度、竞争指数和林分平均胸径对毛竹林生物量的影响达极显著水平(P<0.01),3个特征变量的均方误差增加量分别为16.89%、14.25%和10.68%。由图2可见:立地因子中海拔高度和土层厚度对毛竹林生物量的影响达显著(P<0.05)或极显著水平(P<0.01),2个特征变量的均方误差增加量分别为3.52%和9.33%。这表明立竹度、林分平均胸径、竞争指数、土层厚度和海拔高度是立地因子和结构因子中影响毛竹林生物量的主导因子。随机森林分析结果表明:毛竹秆形结构因子对毛竹林生物量影响较小,可能的原因是受物种遗传特性影响,毛竹林整体秆形结构因子差异较小[33-34],因此对毛竹林生物量影响较小。

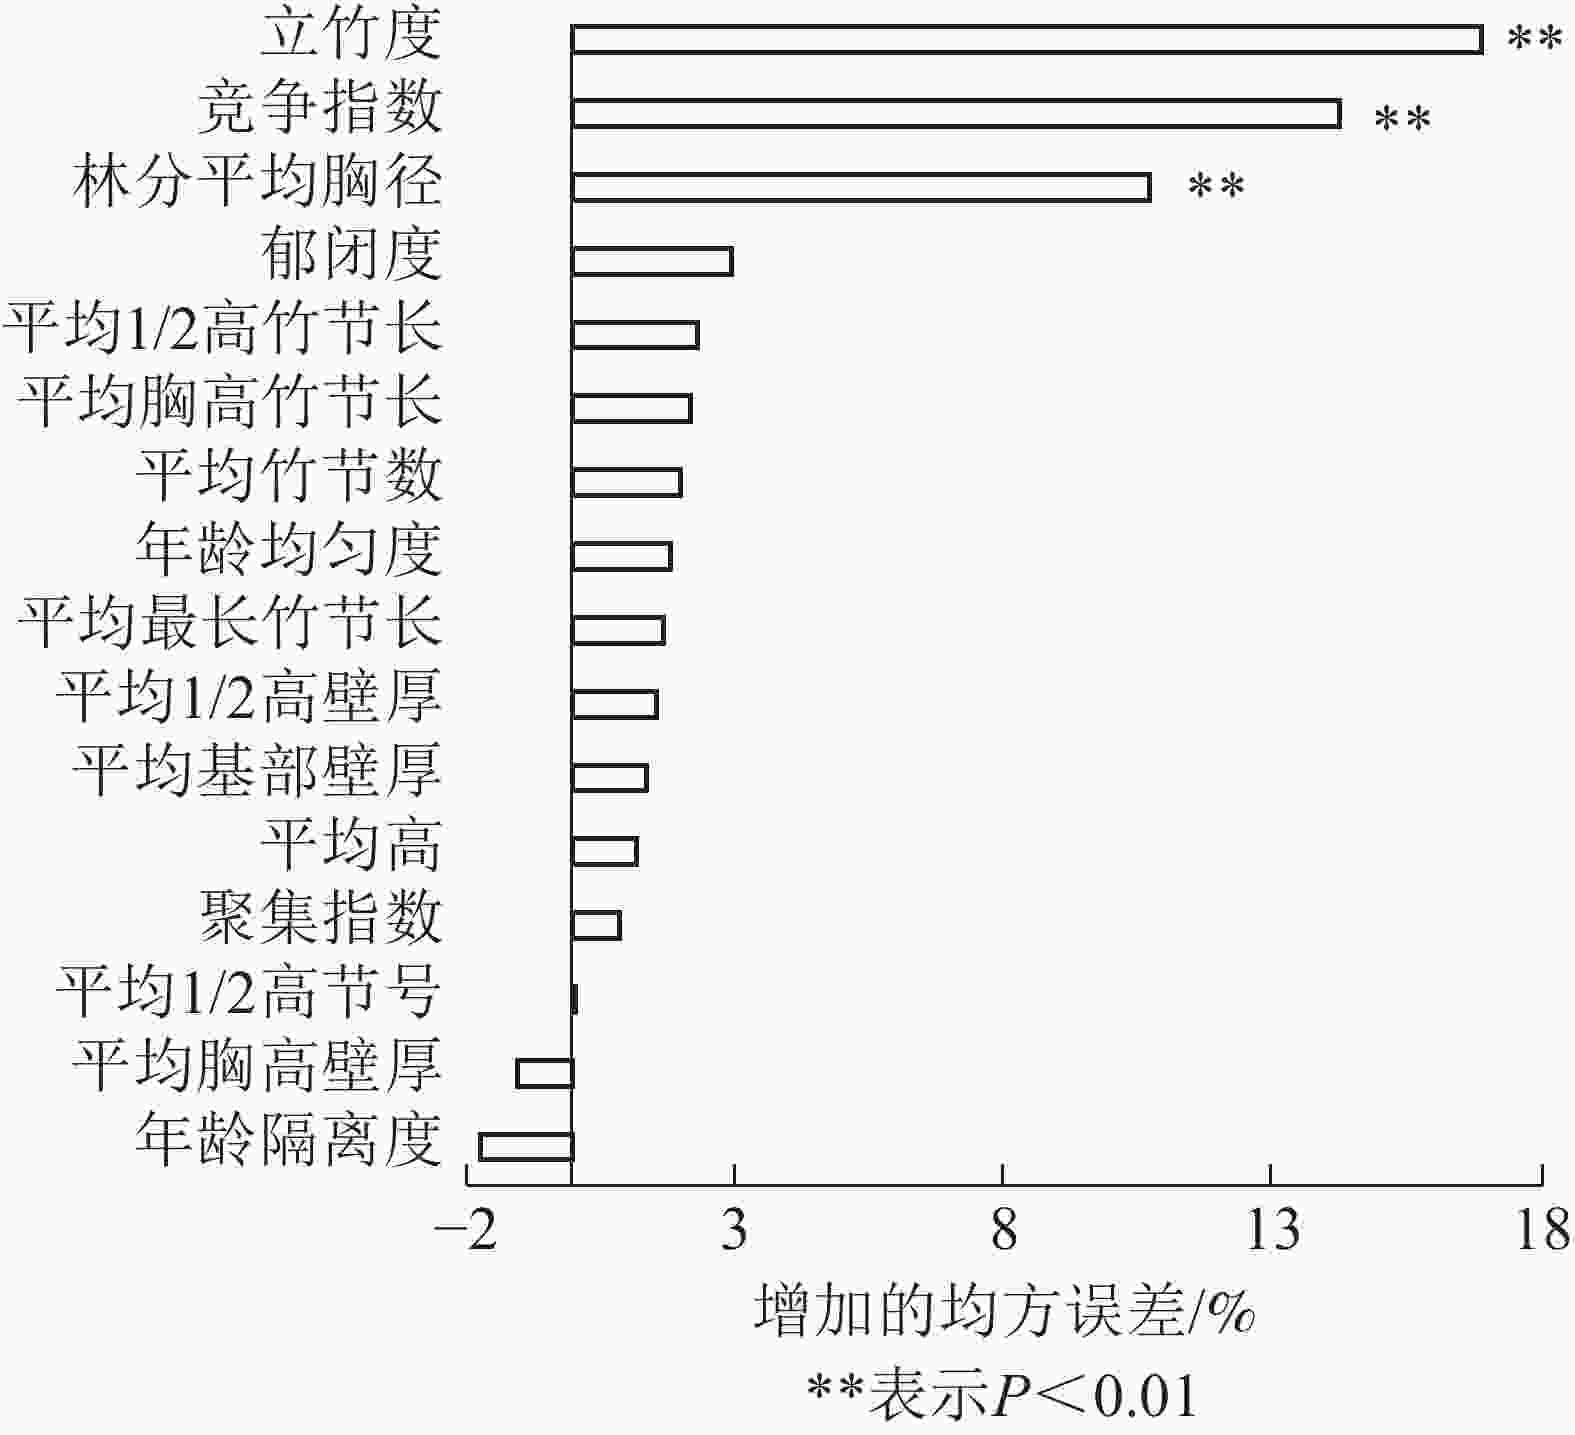
    Figure 1.  Ranking importance of structure factor

    Figure 2.  Ranking importance of site factor

  • 立地因子对林分结构有一定的影响[1, 35],林分结构之间也存在一定的关系[36-37]。在此基础上,预设5个主导因子之间的影响路径,建立主导因子与生物量关系的结构方程模型,初始模型如图3A所示,模型运行结果见图3B。根据模型评价及检验指标(${\chi ^2}$=4.888,P=0.180,RSRMR=0.083 8,ICFI=0.994 0,IGFI=0.969 0)。可见,初始模型中所预设的路径能够被接受,也能较好体现所采集的数据。由图3B可知:立竹度、林分平均胸径和海拔高度对毛竹林生物量有显著的直接影响,它们之间的标准化通径系数分别为0.914(P<0.001)、0.739(P<0.001)和−0.069(P<0.001)。土层厚度和竞争指数对毛竹林生物量没有显著的直接影响,但通过显著影响其他因子间接影响毛竹林生物量。土层厚度通过显著影响立竹度和林分平均胸径间接影响毛竹林生物量。竞争指数通过显著影响林分平均胸径间接影响毛竹林生物量。竞争指数和立竹度之间的路径系数为0.871(P<0.001),说明通过挖笋、伐竹等手段是调节林分竞争水平的有效方式之一。

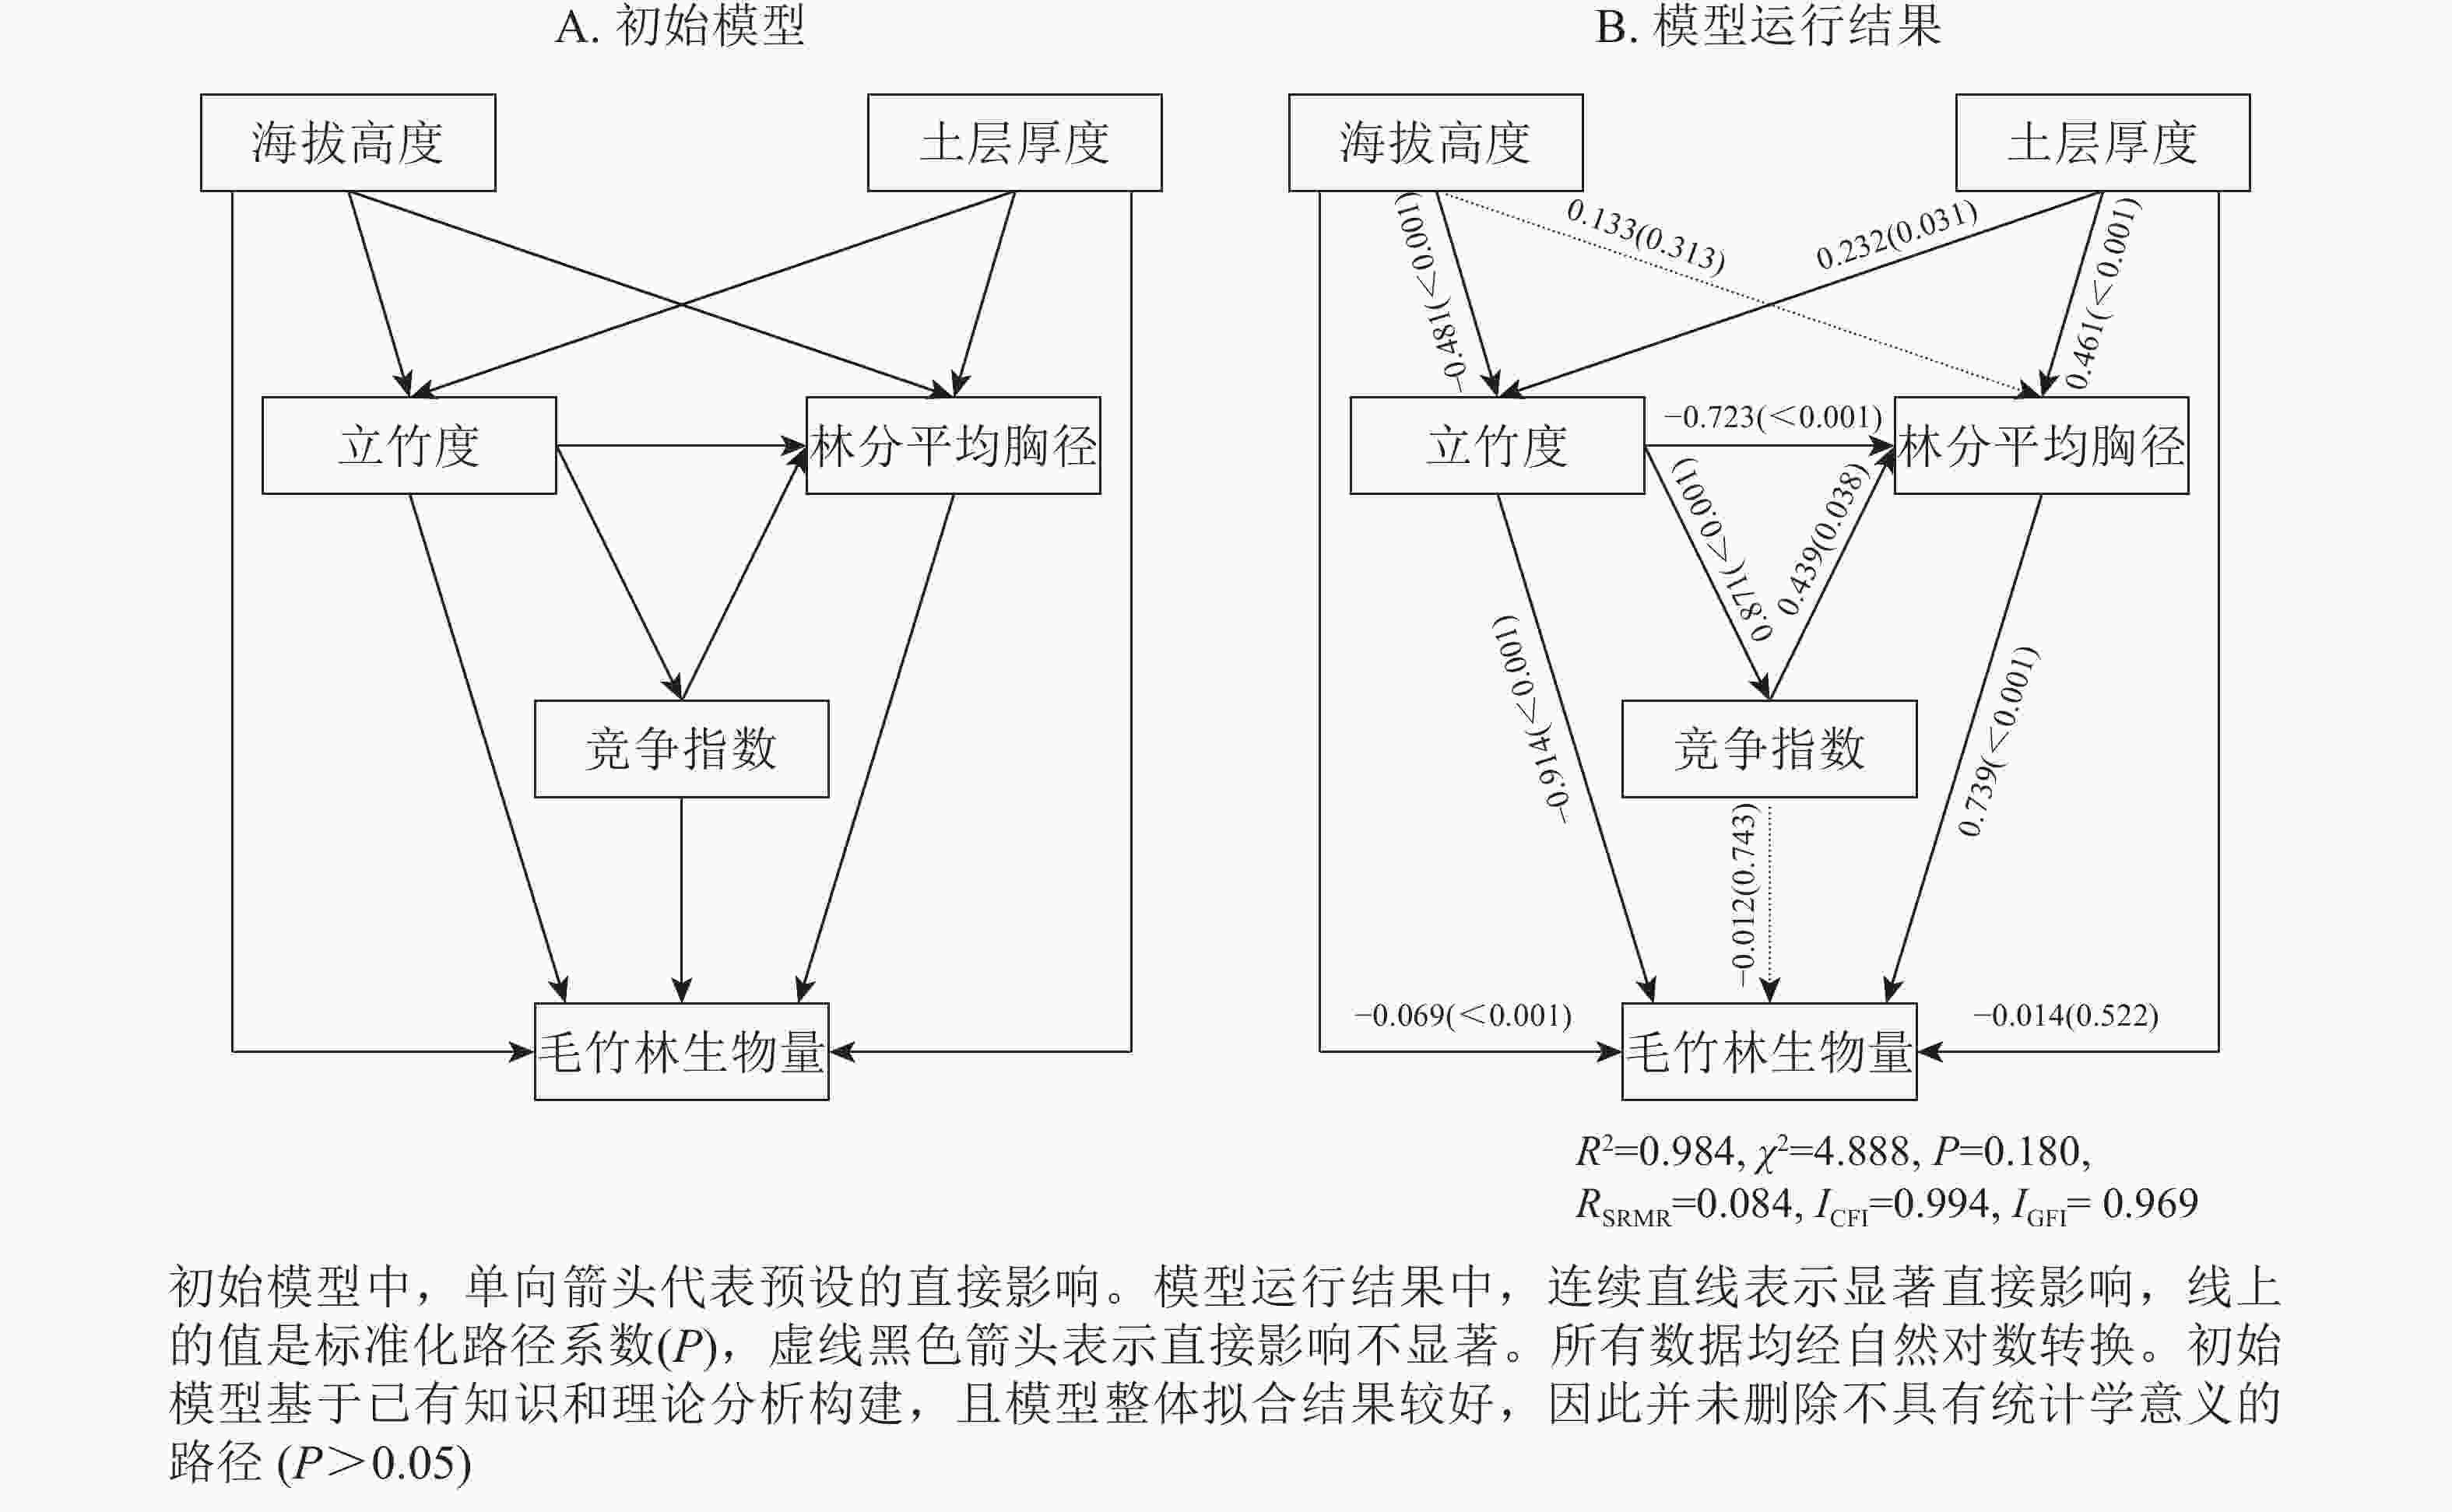
    Figure 3.  Intial model and result between stand biomass and predominant factors

    表3可见:林分平均胸径对毛竹林生物量的总影响最大,达0.739;立竹度对毛竹林生物量的直接影响最大,达0.914;土层厚度对毛竹林生物量的间接影响最大,达0.492;海拔高度、土层厚度和竞争指数对毛竹林生物量的间接影响大于直接影响;海拔高度对毛竹林生物量的总影响为负,即随着海拔的增大,毛竹林生物量逐渐减小,这一结论与范叶青等[28]研究结果一致;土层厚度对毛竹林生物量的总影响为正,即随着土层厚度的增大,毛竹林生物量逐渐增大,这与许多研究结论一致[1, 35]。土层厚度越大,土壤含水量越高[38],有机质含量越高[39],毛竹生长发育所需的养分供给越充分,故毛竹林生物量越大;立竹度和林分平均胸径对毛竹林生物量的总影响为正。说明立竹度和林分平均胸径越大,毛竹林生物量越大,这一结论与刘恩斌等[8]和范叶青等[4]研究结论一致;立竹度通过竞争指数、林分平均胸径对毛竹林生物量产生负间接影响,间接影响为−0.262。说明随着立竹度的增加,林木内争夺阳光、养分等变得激烈,林分平均胸径呈下降趋势,这一结论与林建忠等[37]研究结论一致。立地因子对毛竹林生物量的总影响弱于结构因子(表3),可能是浙江省优越的水热条件削弱了毛竹林生物量在立地因子间的差异[40]

    潜变量显变量直接影响间接影响总影响
    毛竹林生物量土层厚度  −0.014 0.492 0.478
    海拔    −0.069−0.215−0.284
    立竹度    0.914−0.262 0.652
    林分平均胸径 0.7390 0.739
    竞争指数  −0.012 0.325 0.312

    Table 3.  Standardized direct, indirect and total effect of predominant factors on stand biomass

  • 立地条件是影响林木生长的重要因素。为揭示立地条件与毛竹林生物量的关系,以往的研究采用方差分析[4-5]、偏相关分析[4]等方法分析立地因子与毛竹林生物量的直接关系,忽视了立地因子对毛竹林生物量的间接影响。本研究通过结构方程模型解析立地因子对毛竹林生物量的影响路径,表明立地因子主要通过影响毛竹林生物量的构件因子(立竹度、林分平均胸径)间接影响毛竹林生物量。

    林分结构因子及其相互关系是竹林生产经营过程结构调整的重要依据。刘恩斌等[8]采用相关分析对立竹度和毛竹林生物量的关系进行了研究,认为立竹度和毛竹林生物量密切相关。本研究中,立竹度与毛竹林生物量之间的路径系数达0.914,表明立竹度对毛竹林生物量的直接影响最大,此结论与刘恩斌等[8]研究结论一致,但与刘恩斌等[8]研究方法不同。本研究考虑了林分结构之间的相互影响,并应用结构方程模型量化了立竹度对毛竹林生物量的间接影响,立竹度通过林分平均胸径和竞争指数对毛竹林生物量产生负的间接影响(图3B),因而总影响(0.652)弱于直接影响(0.914)。说明仅研究立竹度与毛竹林生物量的直接关系,在一定程度上会高估立竹度对毛竹林生物量的正向影响。竞争指数对毛竹林生物量没有显著的直接影响,但通过林分平均胸径对毛竹林生物量产生有正向的间接影响,即毛竹林生物量随着竞争强度增大而增大。可能的原因是,缺乏人工管理的近自然毛竹林其竞争水平普遍较低,而过低的竞争压力毛竹林无法达到高产。维持在适当强度竞争状态,毛竹林生物量才有可能高产[9]

    毛竹林具有大小年周期的动态变化特征。随着时间的推移,影响毛竹林生物量的主导因子可能发生变化。在进一步研究中,有必要设置固定标准地进行长期监测,建立多个结构方程模型,准确解析主导因子动态变化及其对毛竹林生物量的影响。

  • 本研究以少受人为干扰的毛竹林为研究对象,通过随机森林筛选立地因子和结构因子中影响毛竹林生物量的主导因子。在此基础上,通过构建毛竹林生物量和主导因子的结构方程模型,进一步解析了主导因子对毛竹林生物量的直接、间接和总影响,得出以下主要结论:①毛竹林生物量的形成是一个复杂的过程,受立地、非空间结构和空间结构多因素共同影响,各因素之间并非相互独立,而是存在一定内在联系,共同影响毛竹林的生物量。②采用随机森林,揭示了立地因子和结构因子中影响毛竹林生物量的主导因子,包括:立竹度、林分平均胸径、竞争指数、土层厚度和海拔高度。③结构方程模型表明,立地因子是通过影响林分结构因子对毛竹林生物量产生间接影响,林分结构因子之间的互相影响也对毛竹林生物量有间接影响。④非空间结构因子立竹度和林分平均胸径作为毛竹林生物量的主要构件因子与毛竹林生物量的关系最为密切,立地因子海拔高度、土层厚度和空间结构因子竞争指数主要通过影响毛竹林生物量的构件因子而间接影响毛竹林生物量。⑤在毛竹林经营中,应当在考虑立地因子对毛竹林生物量影响的前提下,调整并保持合理立竹度,调节林分竞争水平,以提高毛竹林生物量。

Reference (40)

Catalog

    /

    DownLoad:  Full-Size Img  PowerPoint
    Return
    Return