Volume 38 Issue 6
Dec.  2021
Turn off MathJax
Article Contents

XU Li, PENG Haoxian, PAN Ping, OUYANG Xunzhi, YU Xiao, ZHANG Min, ZHOU Qiaoqing. Vegetation coverage and its spatial pattern changes in Xingguo County, Jiangxi Province[J]. Journal of Zhejiang A&F University, 2021, 38(6): 1117-1126. doi: 10.11833/j.issn.2095-0756.20200792
Citation: XU Li, PENG Haoxian, PAN Ping, OUYANG Xunzhi, YU Xiao, ZHANG Min, ZHOU Qiaoqing. Vegetation coverage and its spatial pattern changes in Xingguo County, Jiangxi Province[J]. Journal of Zhejiang A&F University, 2021, 38(6): 1117-1126. doi: 10.11833/j.issn.2095-0756.20200792

Vegetation coverage and its spatial pattern changes in Xingguo County, Jiangxi Province

doi: 10.11833/j.issn.2095-0756.20200792
  • Received Date: 2020-12-19
  • Rev Recd Date: 2021-06-22
  • Available Online: 2021-12-08
  • Publish Date: 2021-12-08
  •   Objective  With an analysis of the change characteristics of vegetation coverage and its spatial patterns, this study is aimed to provide reference for ecological environment construction and land use.  Method  Taking Xingguo County in Jiangxi Province as the study area, with the six phases of Landsat TM/OLI remote sensing data employed, under the guidance of the pixel dichotomy model of normalized difference vegetation index and the principle of landscape ecology, an investigation has been conducted of the characteristics of vegetation coverage and spatial pattern evolution in different periods from 1988 to 2019.  Result  (1) The annual vegetation coverage of Xingguo County has witness an increase from 63.89% in 1988 to 79.16% in 2019 with the growth area accounting for 72.18% of the total area (mainly due to the the increase of woodland and agricultural land) whereas the decline area accounting for 11.30% (mainly due to the increase of construction land) and the vegetation coverage at all levels was mainly featured with the evolution towards a higher-level coverage. (2) The vegetation coverage was featured with a smaller distribution in the center and south of the county and a larger distribution in the east, west and north of the county, which was generally consistent with the altitude and over the 31 years, the areas with a significant increase in vegetation coverage were mainly towns in the southern area including Longkou Township, Jiecun Township and Shefu Township while the areas with a significant decline were mainly towns in the center such as Lianjiang Township and Changgang Township. (3) From 1988 to 2019, the vegetation coverage witnessed a changing trend featured with fragmentation, heterogeneity, decreased diversity, uneven spatial distribution as well as enhanced aggregation and in terms of the spatial pattern under different coverage levels, the heterogeneity of patches covered by extremely low, low, medium and high vegetation decreased, and the shape of patches is featured as increasingly simpler; at the same time, the high and extremely high vegetation coverage was dominant, with its shape becoming irregular whereas the extremely high vegetation coverage was mainly distributed in a concentrated contiguous form.  Conclusion  The vegetation coverage and its spatial pattern of Xingguo County generally develop in a benign direction, which is conducive to the sustainable development of the region. Also, land use types, altitude, human activities and other factors have an important impact on the vegetation spatial pattern. [Ch, 5 fig. 2 tab. 35 ref.]
  • [1] WU Genghong, WANG Yiru, LIU Tiedong, GONG Wenfeng, LIN Shiping, CHEN Chong.  Evaluation of landscape pattern evolution and spatial configuration of urban park green space in Haikou City based on SEDMs model . Journal of Zhejiang A&F University, 2023, 40(5): 1093-1101. doi: 10.11833/j.issn.2095-0756.20220702
    [2] LI Zimo.  Spatial pattern and impact mechanism of national forest villages in Jiangxi Province . Journal of Zhejiang A&F University, 2023, 40(6): 1292-1299. doi: 10.11833/j.issn.2095-0756.20230148
    [3] LIU Julian, WEI Boliang, WU Yannan, ZHENG Yingmao, LIU Jinliang, NI Jian, YU Mingjian, ZHENG Zihong.  Size structure and spatial association of different species of an evergreen broad-leaved forest in Jiulong Mountain, Zhejiang Province . Journal of Zhejiang A&F University, 2023, 40(3): 598-607. doi: 10.11833/j.issn.2095-0756.20220521
    [4] ZHANG Chenghu, LIU Ju, HU Baoqing, CHEN Xiufen.  Spatial pattern and its influencing factors of water conservation services in Xijiang River Basin, Guangxi . Journal of Zhejiang A&F University, 2022, 39(5): 1104-1113. doi: 10.11833/j.issn.2095-0756.20210616
    [5] LI Guixiang, CHAI Yong, HE Liping, ZHAO Xinfeng, BI Bo, MA Saiyu, CHEN Jianhong.  Natural regeneration of Alcimandra cathcartii in south section of Gaoligong Mountain . Journal of Zhejiang A&F University, 2021, 38(1): 219-224. doi: 10.11833/j.issn.2095-0756.20200268
    [6] ZHANG Shuting, WANG Xiaohui, PENG Daoli, JI Ping, LIU Hua, LING Chengxing, HOU Ruixia.  Monitoring of vegetation coverage change in hilly and gully regions on the Loess Plateau . Journal of Zhejiang A&F University, 2020, 37(6): 1045-1053. doi: 10.11833/j.issn.2095-0756.20200136
    [7] ZHANG Zhaopeng, LI Zengyuan, TIAN Xin.  Precise identification of forest land types based on high resolution remotely sensed imagery . Journal of Zhejiang A&F University, 2019, 36(5): 857-867. doi: 10.11833/j.issn.2095-0756.2019.05.003
    [8] TIAN Di, LIU Zheng, HU Yalin.  Spatial-temporal characteristics of vegetation coverage and the relationship to topographic factors in Fuzhou City . Journal of Zhejiang A&F University, 2019, 36(6): 1158-1165. doi: 10.11833/j.issn.2095-0756.2019.06.013
    [9] ZHOU Jingping, LI Cunjun, HU Haitang, TAO Huan, PENG Dailiang, XIE Chunchun, GE Yan.  Optimal resolution selection for monitoring forest vegetation using remote sensing images . Journal of Zhejiang A&F University, 2018, 35(4): 716-723. doi: 10.11833/j.issn.2095-0756.2018.04.017
    [10] WANG Cheng, DONG Bin, PENG Wenjuan, CHEN Lingna, HUANG Hui, YE Xiaokang, ZHU Ming, LÜ Dian, NI Yanhua, ZHAO Kangkang, ZHANG Shuangshuang.  Influence of land-use change on the crane habitat and population in Shengjin Lake Wetland . Journal of Zhejiang A&F University, 2018, 35(3): 511-518. doi: 10.11833/j.issn.2095-0756.2018.03.016
    [11] XIANG Anmin, LIU Fengling, YU Baoyi, LI Chonggui.  Forest stock volume estimation based on the k-NN method and GF remote sensing data . Journal of Zhejiang A&F University, 2017, 34(3): 406-412. doi: 10.11833/j.issn.2095-0756.2017.03.004
    [12] DONG Xinyu, FAN Wenyi, TIAN Tian.  Object-based forest type classification with ZY-3 remote sensing data . Journal of Zhejiang A&F University, 2016, 33(5): 816-825. doi: 10.11833/j.issn.2095-0756.2016.05.013
    [13] CHEN Li, LIN Hui, SUN Hua.  Remote sensing of a Mikania micrantha invasion in alien species with WordView-2 images . Journal of Zhejiang A&F University, 2014, 31(2): 185-189. doi: 10.11833/j.issn.2095-0756.2014.02.004
    [14] DING Xuejiao, HAN Hong, PANG Caiju, MA Yuxin, CUI Dalian, FAN Caicai.  Spatial distribution pattern with fractal theory for Carex kobomugi and Parapholis incurva populations . Journal of Zhejiang A&F University, 2013, 30(2): 220-225. doi: 10.11833/j.issn.2095-0756.2013.02.010
    [15] GUO Hui-hui, JIANG Wen-wei, MEI Yan-xia.  Landscape pattern analysis of Yinzhou new city zone based on high spatial resolution aerial photos . Journal of Zhejiang A&F University, 2012, 29(3): 344-351. doi: 10.11833/j.issn.2095-0756.2012.03.005
    [16] CHEN Chun-lei, WU Gang.  Choice of optimal scale for multi-source remote sensing images . Journal of Zhejiang A&F University, 2011, 28(1): 164-172. doi: 10.11833/j.issn.2095-0756.2011.01.027
    [17] WU Chun-zheng, FENG Yi-ming, SHU Qing-tai, LI Zeng-yuan, WU Hong-gan, CHE Teng-teng.  Designing and realizing the forestry sub-compartment remote sensing division system based on high-spatial resolution images . Journal of Zhejiang A&F University, 2011, 28(1): 40-45. doi: 10.11833/j.issn.2095-0756.2011.01.007
    [18] ZHANG Chao, YU Shu-quan, LI Tu-sheng.  Image analysis of vegetation coverage and changes (1994 - 2007) in Qingyuan County using multi-temporal Landsat remote sensing . Journal of Zhejiang A&F University, 2011, 28(1): 72-79. doi: 10.11833/j.issn.2095-0756.2011.01.012
    [19] GUO Zheng, JIANG Hong, CHEN Jian, CHENG Miao-miao, JIANG Zi-shan, YU Shu-quan, LI Tu-sheng.  Forest landscape analysis with remote sensing data for Yuhang,Zhejiang Province . Journal of Zhejiang A&F University, 2010, 27(1): 36-43. doi: 10.11833/j.issn.2095-0756.2010.01.006
    [20] ZHANG Gen-long, FENG Yi-ming, JIA Jian-hua, WU Hong-gan, LI Zeng-yuan.  Sub-compartment division based on SPOT-5 remote sensing images . Journal of Zhejiang A&F University, 2010, 27(2): 299-303. doi: 10.11833/j.issn.2095-0756.2010.02.023
  • [1]
    de COCA C C, GARCIA-HARO J, GILABERT M A, et al. Vegetation cover seasonal changes assessment from TM imagery in a semi-arid landscape [J]. Int J Remote Sensing, 2004, 25(17): 3451 − 3476.
    [2]
    SUN Leigang, LIU Jianfeng, XU Quanhong. Remote sensing based temporal and spatial analysis of vegetation cover changes in Bashang area of Hebei Province [J]. Remote Sensing Land Resour, 2014, 26(1): 167 − 172.
    [3]
    YANG Hongbing, DONG Jihong, CHEN Jianqing, et al. Research progress of vegetation coverage model [J]. Anhui Agric Sci, 2012, 40(12): 7580 − 7585.
    [4]
    GAO Guolin, WANG Shiying, JIANG Rong, et al. Remote sensing analysis on vegetation cover and landscape patterns change in Cuiping [J]. Res Soil Water Conserv, 2013, 20(3): 104 − 109.
    [5]
    ABURAS M M, ABDULLAH S H, RAMLI M F, et al. Measuring land cover change in Seremban, Malaysia using NDVI index [J]. Procedia Environ Sci, 2015, 30: 238 − 243.
    [6]
    AMIRI F, RASHID A M S. Using remote sensing data for vegetation cover assessment in semi-arid rangeland of center province of Iran [J]. World Appl Sci J, 2010, 11(12): 1537 − 1546.
    [7]
    ZHANG Xianfeng, LIAO Chunhua, LI J, et al. Fractional vegetation cover estimation in arid and semi-arid environments using HJ-1 satellite hyperspectral data [J]. Int J Appl Earth Obs Geoinf, 2013, 21(1): 506 − 512.
    [8]
    LI Yagang, LI Wenlong, LIU Shangru, et al. Grassland vegetation dynamics over the years based on remote sensing technology in Gannan pastoral area [J]. Pratacultural Sci, 2015, 32(5): 675 − 685.
    [9]
    XU Kaijian, ZENG Hongda, REN Jie, et al. Spatial and temporal variations in vegetation cover in an eroded region of substropical red soil and its relationship with the impact of human activity [J]. Acta Ecol Sin, 2016, 36(21): 6960 − 6968.
    [10]
    WANG Yonghua, SU Zhiyao, CHEN Beiguang. Analysis on the landscape pattern of the vegetation in Baiyunshan Scenic Spot, Guangzhou [J]. Chin J Eco-Agric, 2005, 13(1): 45 − 48.
    [11]
    BOGAERT J, ZHOU L, TUCKER C J, et al. Evidence for a persistent and extensive greening trend in Eurasia inferred from satellite vegetation index data [J]. J Geophys Res, 2002, 107(D11): 4119. doi: 10.1029/2001JD001075.
    [12]
    LÜ Danhong, JIANG Qigang, WANG Dejun, et al. Estimation of vegetation cover and analysis of landscape pattern base on Landsat data [J]. Sci Surv Mapp, 2018, 43(11): 157 − 164.
    [13]
    LEPRIEUR C, VERSTRAETE M M, PINTY B. Evaluation of the performance of various vegetation indices to retrieve vegetation cover from AVHRR data [J]. Remote Sensing Rev, 1994, 10(4): 265 − 284.
    [14]
    ZHANG Chao, YU Shuquan, LI Tusheng. Image analysis of vegetation coverage and changes (1994−2007) in Qingyuan County using multi-temporal Landsat remote sensing [J]. J Zhejiang A&F Univ, 2011, 28(1): 72 − 79.
    [15]
    GAMON J A, PENUELAS J, FIELD C B. A narrow-waveband spectral index that tracks diurnal changes in photosynthetic efficiency [J]. Remote Sensing Environ, 1992, 41(1): 35 − 44.
    [16]
    LI Hengkai, LIU Xiaosheng, LI Bo, et al. Vegetation coverage variations and correlation with geomorphologic factors in red soil region: a case in south Jiangxi Province [J]. Sci Geogr Sin, 2014, 34(1): 103 − 109.
    [17]
    JANSSEN L L F, VANDERWEL F J M. Accuracy assessment of satellite derived land-coer data: a review [J]. Photogramm Eng Remote Sensing, 1994, 60(4): 410 − 432.
    [18]
    ZHOU Yunkai, BAI Xiuling. Dynamic changes of landscape pattern in Poyang Lake region over the recent 17 years [J]. Ecol Environ Sci, 2011, 20(11): 1653 − 1658.
    [19]
    FENG Shanshan, FAN Fenglei. Spatiotemporal changes of landscape pattern using impervious surface in Guangdong-Hong Kong Greater Bay Area, China [J]. Chin J Appl Ecol, 2018, 29(9): 2907 − 2914.
    [20]
    ZHANG Dangyu, SUN Zhigao, CHEN Bingbing, et al. Variations of wetland landscape pattern in the Xinghua Bay of Fujian Province in recent ten years and its driving factors [J]. J Fujian Norm Univ Nat Sci Ed, 2020, 36(1): 104 − 116.
    [21]
    LI Miaomiao, WU Bingfang, YAN Changzhen, et al. Estimation of vegetation fraction in the upper basin of Miyun reservoir by remote sensing [J]. Resour Sci, 2004, 26(4): 153 − 159.
    [22]
    JIANG Meichen, TIAN Shufang, ZHENG Zhaoju, et al. Human activity influences on vegetation cover changes in Beijing, China, from 2000 to 2015 [J]. Remote Sensing, 2017, 9(3): 271. doi: 10.3390/rs9030271.
    [23]
    YANG Ran, LI Xiaoyan, MAO Dehua, et al. Examining fractional vegetation cover dynamics in response to climate from 1982 to 2015 in the amur river basin for SDG 13 [J]. Sustainability, 2020, 12(14): 5866. doi: 10.3390/su12145866.
    [24]
    LIU Qijing, WANG Hongqing. Monitoring of ecological restoration by satellite remote sensing: a case study in Xingguo County, Jiangxi Province [J]. Jiangxi Sci, 2003, 21(3): 147 − 150.
    [25]
    QI Yaxiao, ZHANG Fei, CHEN Rui, et al. Vegetation coverage dynamics in northern slope of Tianshan Mountains from 2001 to 2015 [J]. Acta Ecol Sin, 2020, 40(11): 3677 − 3687.
    [26]
    ZHANG Shuting, WANG Xiaohui, PENG Daoli, et al. Monitoring of vegetation coverage change in hilly and gully regions on the Loess Plateau [J]. J Zhejiang A&F Univ, 2020, 37(6): 1045 − 1053.
    [27]
    WANG Jing, WANG Kelin, ZHANG Mingyang, et al. Temporal-spatial variation in NDVI and drivers in hilly terrain of southern China [J]. Resour Sci, 2014, 36(8): 1712 − 1723.
    [28]
    XIN Zhongbao, XU Jiongxin, WEI Zheng. Spatiotemporal variations of vegetation cover on the Chinese Loess Plateau (1981−2006): impacts of climate changes and human activities [J]. Sci China Series D Earth Sci, 2008, 51(1): 67 − 78.
    [29]
    WU Zemin, WU Youwen, GAO Jian, et al. Analysis of urban forest landscape pattern in Hefei [J]. Chin J Appl Ecol, 2003, 14(12): 2117 − 2122.
    [30]
    FAN Hongchao, YAO Wei, FU Qing. Segmentation of sloped roofs from airborne LiDAR point clouds using ridge-based hierarchical decomposition [J]. Remote Sensing, 2014, 6(4): 3284 − 3301.
    [31]
    YANG Heng, SHEN Runping, WU Liye, et al. Temporal and spatial analysis of remotely sensed vegetation coverage changes in Jiangxi Province based on S-G filter [J]. Sci Technol Eng, 2014, 14(22): 101 − 106.
    [32]
    ZENG Guanglin. Research on the Change of Vegetation Coverage and Carbon Storage based on Remote Sensing: Take Ganzhou City as an Example[D]. Ganzhou: Jiangxi University of Science and Technology, 2017.
    [33]
    WANG Ke, GUO Yiqiang, ZHANG Jianjun, et al. Evaluation on the implementation effect of the pilot project for ecological protection and restoration of multi ecological elements based on spatiotemporal analysis: a case study of Ganzhou [J]. Acta Ecol Sin, 2019, 39(23): 8867 − 8877.
    [34]
    DING Song, YING Xueliang, LÜ Dan, et al. Effects of understory vegetation coverage on soil quality of aerial seeding Pinus massoniana stands in south of Jiangxi Province [J]. Res Soil Water Conserv, 2014, 21(3): 31 − 36.
    [35]
    TANG Yongsen. Situation of soil and water losses of Ganzhou City and its control measures [J]. Res Soil Water Conserv, 2000, 7(3): 81 − 84, 114.
  • 加载中
通讯作者: 陈斌, bchen63@163.com
  • 1. 

    沈阳化工大学材料科学与工程学院 沈阳 110142

  1. 本站搜索
  2. 百度学术搜索
  3. 万方数据库搜索
  4. CNKI搜索

Figures(5)  / Tables(2)

Article views(1235) PDF downloads(62) Cited by()

Related
Proportional views

Vegetation coverage and its spatial pattern changes in Xingguo County, Jiangxi Province

doi: 10.11833/j.issn.2095-0756.20200792

Abstract:   Objective  With an analysis of the change characteristics of vegetation coverage and its spatial patterns, this study is aimed to provide reference for ecological environment construction and land use.  Method  Taking Xingguo County in Jiangxi Province as the study area, with the six phases of Landsat TM/OLI remote sensing data employed, under the guidance of the pixel dichotomy model of normalized difference vegetation index and the principle of landscape ecology, an investigation has been conducted of the characteristics of vegetation coverage and spatial pattern evolution in different periods from 1988 to 2019.  Result  (1) The annual vegetation coverage of Xingguo County has witness an increase from 63.89% in 1988 to 79.16% in 2019 with the growth area accounting for 72.18% of the total area (mainly due to the the increase of woodland and agricultural land) whereas the decline area accounting for 11.30% (mainly due to the increase of construction land) and the vegetation coverage at all levels was mainly featured with the evolution towards a higher-level coverage. (2) The vegetation coverage was featured with a smaller distribution in the center and south of the county and a larger distribution in the east, west and north of the county, which was generally consistent with the altitude and over the 31 years, the areas with a significant increase in vegetation coverage were mainly towns in the southern area including Longkou Township, Jiecun Township and Shefu Township while the areas with a significant decline were mainly towns in the center such as Lianjiang Township and Changgang Township. (3) From 1988 to 2019, the vegetation coverage witnessed a changing trend featured with fragmentation, heterogeneity, decreased diversity, uneven spatial distribution as well as enhanced aggregation and in terms of the spatial pattern under different coverage levels, the heterogeneity of patches covered by extremely low, low, medium and high vegetation decreased, and the shape of patches is featured as increasingly simpler; at the same time, the high and extremely high vegetation coverage was dominant, with its shape becoming irregular whereas the extremely high vegetation coverage was mainly distributed in a concentrated contiguous form.  Conclusion  The vegetation coverage and its spatial pattern of Xingguo County generally develop in a benign direction, which is conducive to the sustainable development of the region. Also, land use types, altitude, human activities and other factors have an important impact on the vegetation spatial pattern. [Ch, 5 fig. 2 tab. 35 ref.]

XU Li, PENG Haoxian, PAN Ping, OUYANG Xunzhi, YU Xiao, ZHANG Min, ZHOU Qiaoqing. Vegetation coverage and its spatial pattern changes in Xingguo County, Jiangxi Province[J]. Journal of Zhejiang A&F University, 2021, 38(6): 1117-1126. doi: 10.11833/j.issn.2095-0756.20200792
Citation: XU Li, PENG Haoxian, PAN Ping, OUYANG Xunzhi, YU Xiao, ZHANG Min, ZHOU Qiaoqing. Vegetation coverage and its spatial pattern changes in Xingguo County, Jiangxi Province[J]. Journal of Zhejiang A&F University, 2021, 38(6): 1117-1126. doi: 10.11833/j.issn.2095-0756.20200792
  • 地表植被覆盖度及其变化信息对了解植物群落在气候、水文和地球化学循环中的作用至关重要,对分析地表空间变化规律、评价区域生态系统及生态环境变化有重大作用,直接关系到区域生态环境的稳定性和安全性[1-2]。监测植被覆盖度的方式一般包括实测法和遥感测量法,与实测法相比,遥感测量法因投入成本低、观测面积大等优点而广泛运用。遥感测量法一般有植被指数法、光谱梯度差模型法、像元分解模型等。植被指数法是依据植被光谱特征和植被覆盖度的相关关系,构造植被指数模型进行估测的方法,精度较高,但限制条件较多;光谱梯度差模型法中,有关角度特征对植被覆盖度的影响有待改进[3];像元分解模型主要通过解析光谱波段和植被指数信息进行遥感提取,是国内外研究的重要方法。其中像元二分法是像元分解模型法中运用较广泛的植被覆盖度评估方法,主要选取归一化植被指数(NDVI)进行估测,该指数对监测植被生长状态和植被覆盖等信息非常灵敏,涵盖了90%以上的植被信息,是借助遥感技术探究不同时期、特定区域植被覆盖度的重要指标之一[4-5],AMIRI等[6]研究发现:相比其他植被指数,基于NDVI提取的植被覆盖度精度最高。ZHANG等[7]采取NDVI的像元二分法监测植被覆盖度,并结合实测数据展开检验,其相关系数达86%。李亚刚等[8]基于不同实测盖度对像元二分法盖度提取结果进行了精度评价,平均误差为11.86%。徐凯健等[9]采取NDVI的像元二分法估测了福建省长汀县植被覆盖度,系统误差表明该模型的反演精度大于95%。植被覆盖空间格局能够充分表现植被的空间结构、空间组成及其动态变化[10],通过对植被空间格局的分析,有助于了解人类活动对植被空间演变产生的影响。如BOGAERT等[11]研究表明:1981−1999年欧亚大陆植被景观连通性增大且覆盖度增加,北美洲植被景观存在破碎化趋势;吕丹红等[12]基于福建省泉州市2001−2016年Landsat数据对植被覆盖度的景观格局变化趋势进行了研究,发现区域植被生态环境趋好。中国南方长江下游丘陵地区有着丰富的水热资源,植被覆盖较高,但地形、地貌等较为复杂,研究其长时间序列下的植被覆盖格局有利于了解区域生态环境演变特征。江西省兴国县植被破坏程度大、水土流失严重,曾被称为“中国江南沙漠”。20世纪70−90年代初,为恢复植被控制水土流失,兴国县相继开展飞播马尾松Pinus massoniana种子造林活动,同时,经过几十年林业工程项目的实施及社会经济的发展,兴国县植被覆盖度和空间格局发生了较大变化。本研究基于Landsat TM/OLI遥感数据,采用像元二分法,对1988−2019年兴国县植被覆盖度及其空间格局变化进行了研究,为生态环境保护和土地利用研究等提供参考。

  • 兴国县(26°03′~26°44′N,115°01′~115°52′E)地处江西省中南部,赣州市北部,面积为3 215 km2。地貌以低山、丘陵为主,土壤类型主要为红壤。属于亚热带东南季风气候,年均气温为18.9 ℃,年均降水量为1 522.3 mm。森林覆盖率达72.2%,地带性植被为亚热带针叶林、常绿阔叶林,其中针叶林主要树种有马尾松、湿地松Pinus elliottii及杉木Cunninghamia lanceolata等,常绿阔叶林的主要树种有木荷Schima superba、枫香Liquidambar formosana等。

  • 研究选用Landsat TM/OLI卫星影像,空间分辨率为30 m。一般来说研究对象为植被时,宜选取6−8月植被最茂盛且云量少的遥感影像,但由于此时期兴国县影像数据极少,且多为高云量,综合考虑影像的质量与获取性,以及考虑到研究区森林植被多为常绿类型,秋季的影像与6−8月的影像在反映植被覆盖情况方面相差不大,因此选取了1988年10月16日、1994年10月1日、2000年9月15日、2006年11月3日、2013年10月5日(由于2012年Landsat 7数据条带丢失,且修复效果较差,因此选择了2013年Landsat 8影像)、2019年9月20日的共6期Landsat TM/OLI遥感影像,其云量均低于5%。

    利用ENVI 5.3软件进行预处理,因Landsat TM/OLI卫星影像已经过几何校正,所以只需辐射定标和大气校正处理,以减少因地形阴影、太阳高度角、大气散射等噪声产生的误差。最后根据兴国县矢量数据对预处理后的影像进行裁剪。

  • 采用像元二分模型评估方法,假定利用遥感传感器所监测的光谱信息可分为2个部分:绿色植被和无植被覆盖(岩石、裸土等)信息[13-14]。归一化植被指数(NDVI)与植被的分布密度有着极好的线性相关关系,且在一定程度上能减少因辐射引起的误差[15]。基于NDVI的像元二分法提取兴国县的植被覆盖度($ {\mathit{F}}_{\mathbf{C}} $)计算公式为:

    式(1)~(2)中:INDV为归一化植被指数;$ {\rho }_{\mathrm{N}\mathrm{I}\mathrm{R}} $为近红外波段反射率;$ \;{\rho }_{\mathrm{R}\mathrm{e}\mathrm{d}} $为可见光红波段反射率;${I}_{\mathrm{N}\mathrm{D}\mathrm{V}\mathrm{s}\mathrm{o}\mathrm{i}\mathrm{l}} $为全裸土覆盖的$ {I}_{\mathrm{N}\mathrm{D}\mathrm{V}} $值;$ {I}_{\mathrm{N}\mathrm{D}\mathrm{V}\mathrm{v}\mathrm{e}\mathrm{g}} $为全绿色植被覆盖的$ {I}_{\mathrm{N}\mathrm{D}\mathrm{V}} $值。以1%的置信度取得$ {I}_{\mathrm{N}\mathrm{D}\mathrm{V}\mathrm{s}\mathrm{o}\mathrm{i}\mathrm{l}} $$ {I}_{\mathrm{N}\mathrm{D}\mathrm{V}\mathrm{v}\mathrm{e}\mathrm{g}} $

    对于植被覆盖度等级的划分不同学者不尽相同,如徐凯健等[9]将植被覆盖度划分为6个等级,一般认为
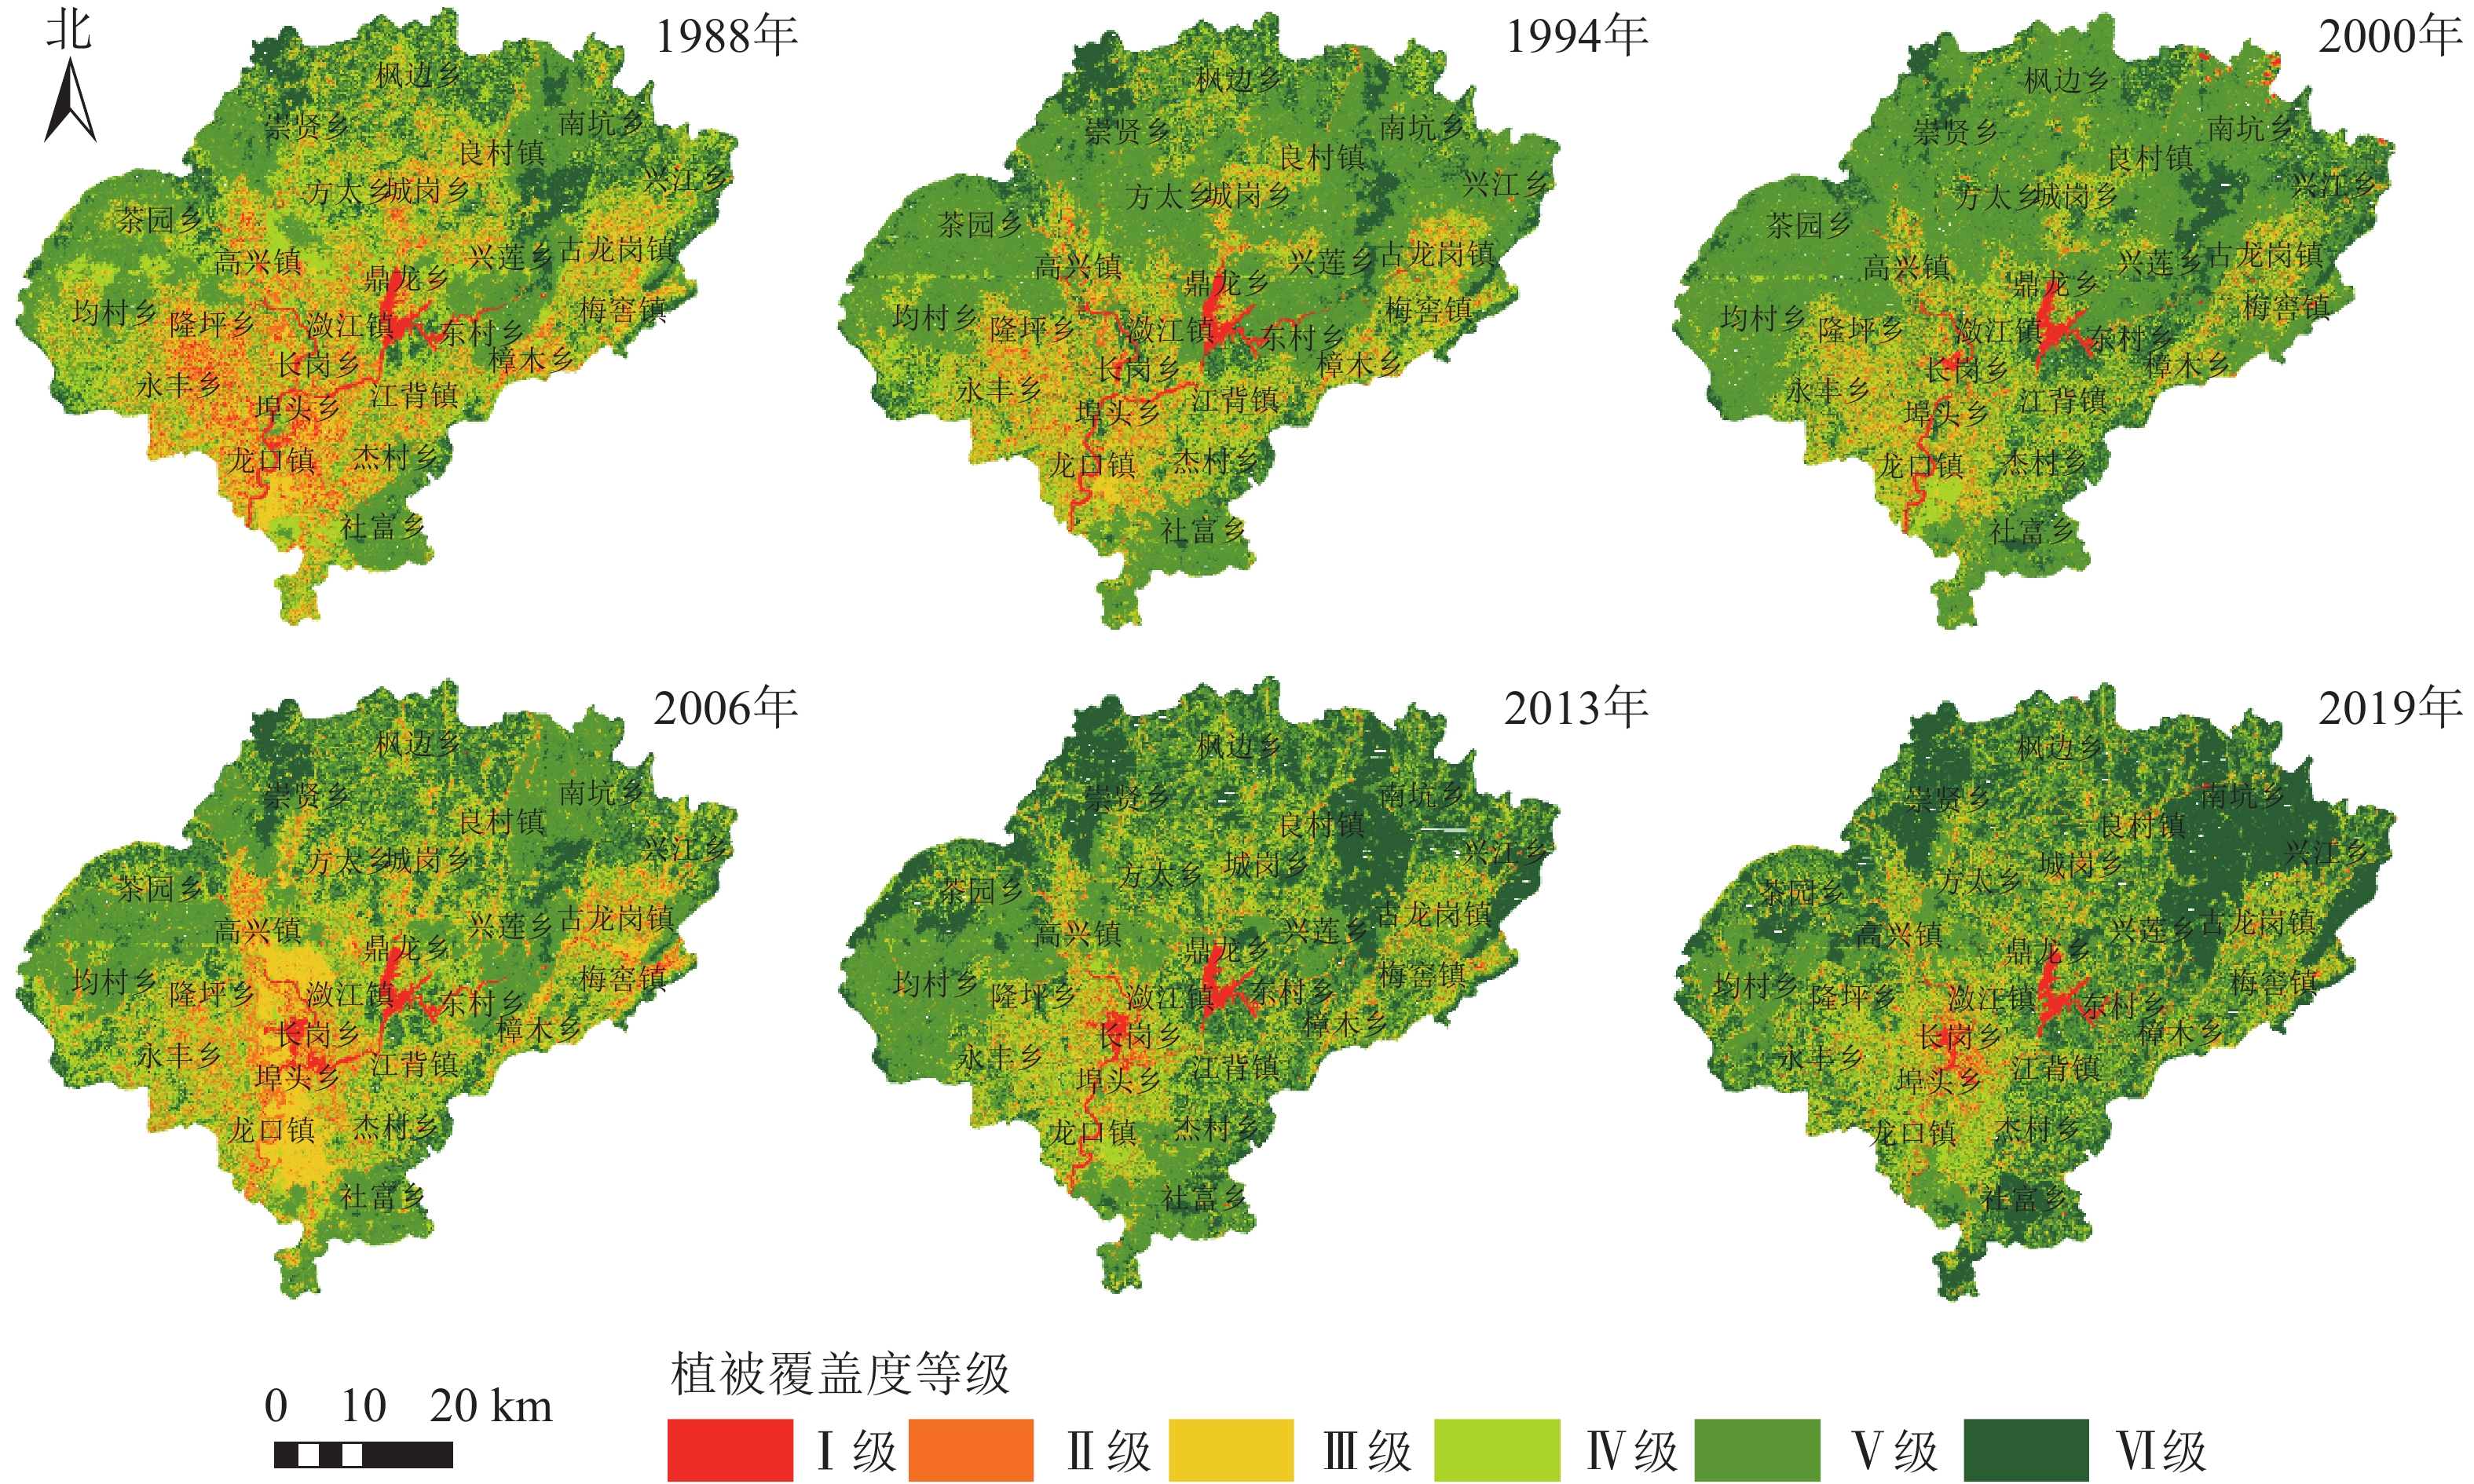
$ {F}_{\mathrm{C}} $≥70%为高植被覆盖度[16]。本研究考虑到兴国县主要以高覆盖度为主,为更好地突出1988−2019年不同等级植被覆盖度的变化情况,将高植被覆盖度进一步划分为2个等级,即植被覆盖度划分成6个等级:极低植被覆盖度(Ⅰ级,0≤$ {F}_{\mathrm{C}} $<10%),低植被覆盖度(Ⅱ级,10%≤$ {F}_{\mathrm{C}} $<30%),中植被覆盖度(Ⅲ级,30%≤$ {F}_{\mathrm{C}} $<50%),中高植被覆盖度(Ⅳ级,50%≤$ {F}_{\mathrm{C}} $<70%),高植被覆盖度(Ⅴ级,70%≤$ {F}_{\mathrm{C}} $<90%),极高植被覆盖度(Ⅵ级,90%≤$ {F}_{\mathrm{C}} $≤100%)。1988−2019年兴国县的植被覆盖度分级结果见图1

    Figure 1.  Characteristics of fractional vegetation coverage at different levels in the period from 1988 to 2019 in Xingguo County

  • 以森林资源二类调查数据与谷歌地球(Google Earth)影像为参考,通过随机选取若干样本,对1988和2019年遥感数据进行土地利用/覆被分类,将其划分为水体、建设用地、林地、农地、草地、其他。并通过分类混淆矩阵和Kappa指数进行精度验证,得到的Kappa指数均在80%以上,满足最低辨别精度0.7的条件[17]

  • 参考相关文献[18-20]并结合兴国县的特点,选取主要反映破碎化、形状和异质性特征等方面的相关指数。不同时期植被盖度空间格局分析选取边缘密度、形状指数、平均分维数、香农多样性指数、香农均匀度指数和聚集度指数;不同植被盖度等级的空间格局分析选取边缘密度、最大斑块指数、形状指数、散布与并列指数。

  • 经计算,1988、1994、2000、2006、2013、2019年的归一化植被指数均值分别为58.09%、65.22%、65.77%、61.32%、68.63%、70.69%,植被覆盖度均值分别为63.89%、71.20%、75.37%、66.91%、78.07%、79.16%,归一化植被指数与植被覆盖度变化趋势相近。兴国县植被覆盖度总体呈上升趋势,仅2006年有所下降,可能与2006年自然灾害严重有关。

    将植被覆盖度动态变化值(D)划分为7个等级(图2),分别为极度增加(0.3<D≤1.0),占21.74%;中度增加(0.10<D≤0.30),占39.07%;轻微增加(0.05<D≤0.10),占11.36%;稳定区(−0.05≤D≤0.05),占16.52%;极度减少(−1.00≤D<−0.30),占2.72%;中度减少(−0.30≤D<−0.10),占5.79%;轻微减少(−0.10≤D<−0.05),占2.79%。呈极度增加的区域主要是位于南部的龙口镇、杰村乡、社富乡等,这与这些乡镇曾多次进行了飞播马尾松造林有关;呈极度减少的区域主要位于县城所在的潋江镇以及长岗乡,可能因为这2个乡镇的城镇化发展快、经济发达,建筑用地增加等导致植被覆盖度减小;稳定区域主要为水域和边沿地区。植被覆盖度总体呈增加(0.05<D≤1.00)的面积为2 319.78 km2,占总面积的72.18%;而呈减少(−1.00≤D<−0.05)的面积为363.13 km2,占总面积的11.30%,表明兴国县植被覆盖度主要呈增加趋势。

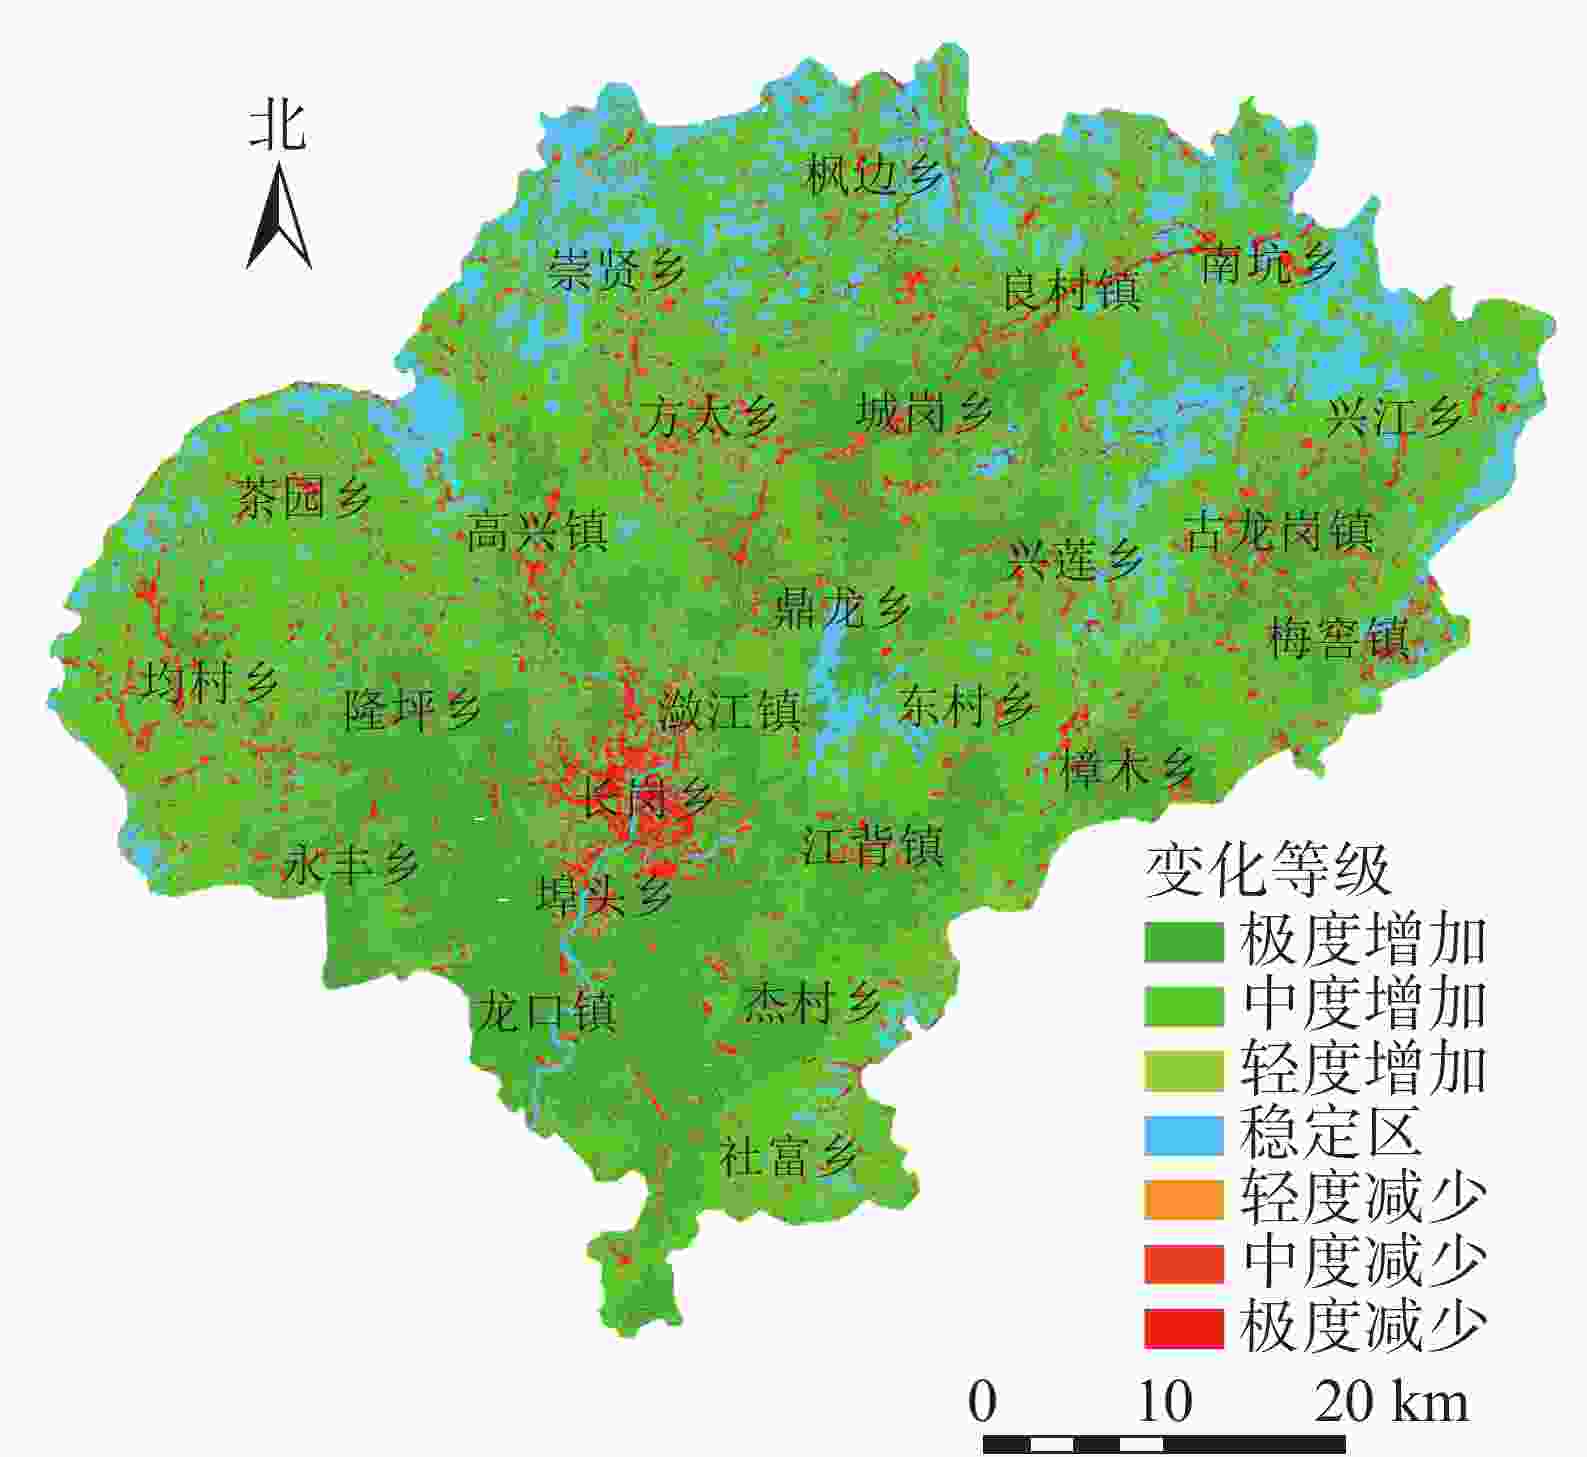
    Figure 2.  Change of fractional vegetation coverage from 1988 to 2019 in Xingguo County

    基于1988与2019年土地利用/覆被栅格图,分别统计研究区植被覆盖度呈增加(0.05<D≤1.00)、稳定(−0.05≤D≤0.05)、减少(−1.00≤D<−0.05)变化区域的土地利用面积转移矩阵。结果表明:与1988年相比,2019年植被覆盖度呈增加趋势。一方面是因为水体、建设用地、草地、其他转为林地、农地,从而带来植被覆盖度“质”的变化,即由无覆盖转为有植被覆盖;另一方面是因为林地与农地面积的增加,从而引起植被覆盖度“量”的增加。稳定区各类用地存在不同方向的转移且变化较小,因此植被覆盖度变化不大。植被覆盖度呈减少主要是因为其他土地类型转为建设用地。
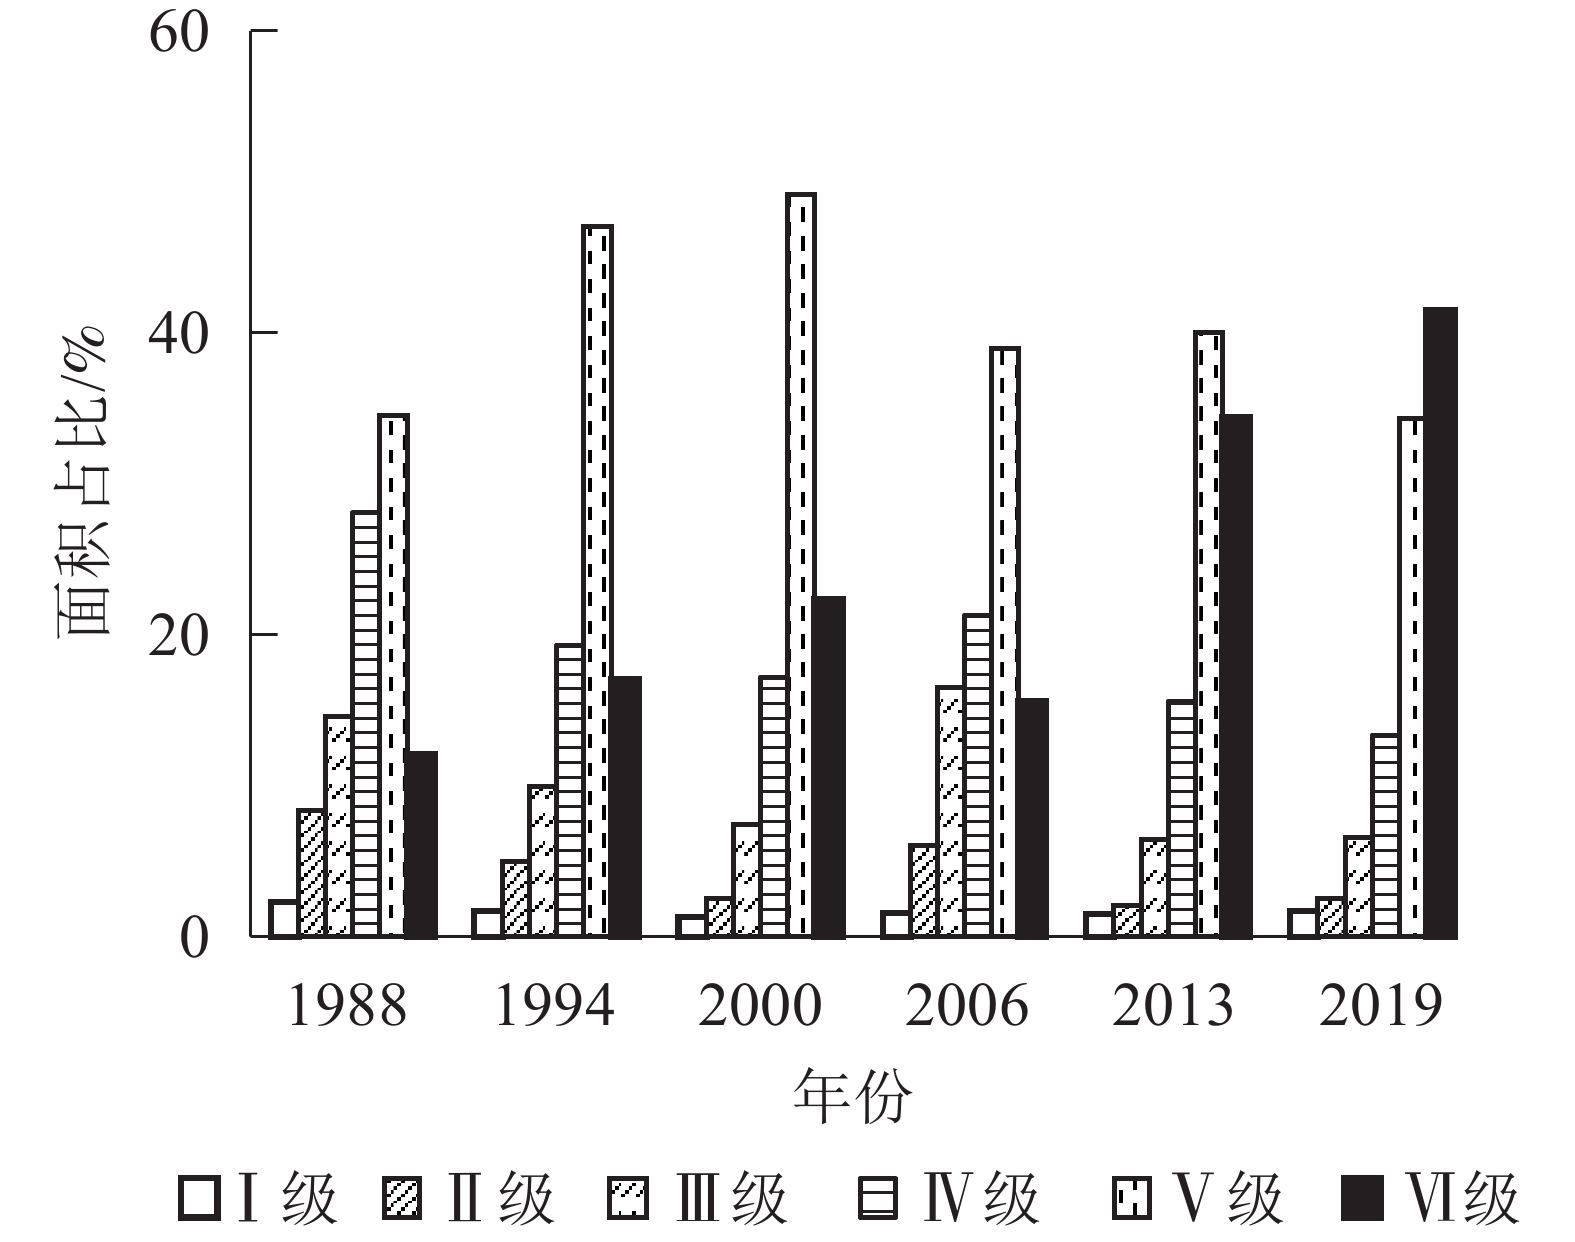
  • 图3可见:1988、1994、2000、2006、2013年植被覆盖度均以Ⅴ级为主,分别占研究区总面积的34.53%、47.05%、49.17%、38.99%、40.01%;2019年以Ⅵ级植被为主,占研究区总面积的41.51%。与1988年相比,2019年Ⅰ级、Ⅱ级、Ⅲ级、Ⅳ级、Ⅴ级植被面积都有不同程度的减少,分别减少了0.61%、5.84%、8.06%、14.76%、0.19%,而Ⅵ级植被面积增加了29.44%。1988−2019年各级植被面积变化趋势有所不同,表明各级植被间发生了不同程度的转移。

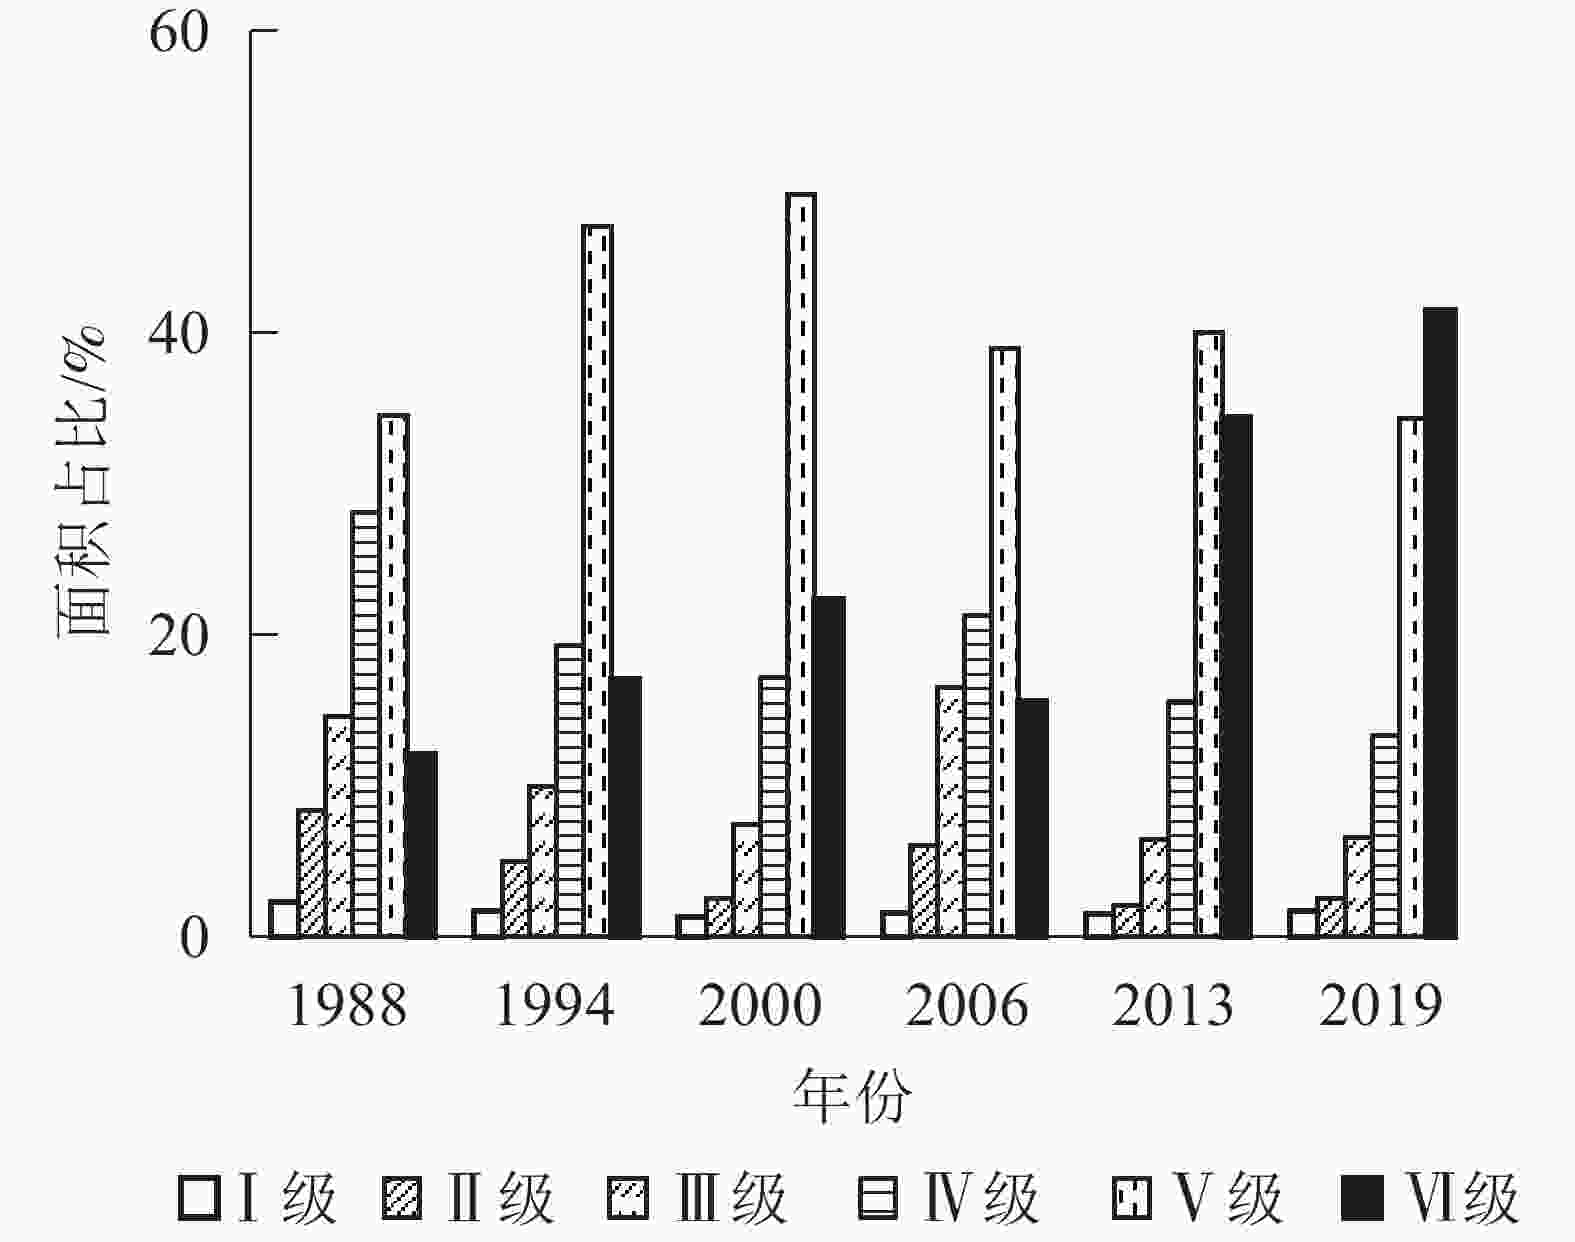
    Figure 3.  1988−2019 vegetation coverage area proportion

    基于图1计算不同时期不同等级植被覆盖度面积转移矩阵得出:1988−2019年各级植被覆盖度总体表现为从低级向更高级转移,Ⅵ级植被转移量较少,多为向Ⅴ级转移,2000−2006年以Ⅳ级转Ⅲ级、Ⅴ级转Ⅳ级为主,这也是2006年植被覆盖度比2000年小的原因之一。1988−1994年各级植被转出面积从小到大依次为Ⅰ级、Ⅱ级、Ⅲ级、Ⅳ级,1994−2019年各级植被转出面积从小到大依次为Ⅰ级、Ⅱ级、Ⅲ级、Ⅳ级、Ⅴ级;1988−2000年与2006−2013年,Ⅰ级、Ⅱ级、Ⅲ级、Ⅳ级植被转出面积多于转入,Ⅴ级和Ⅵ级植被转入面积多于转出,表明植被覆盖结构逐渐朝高覆盖度发展。

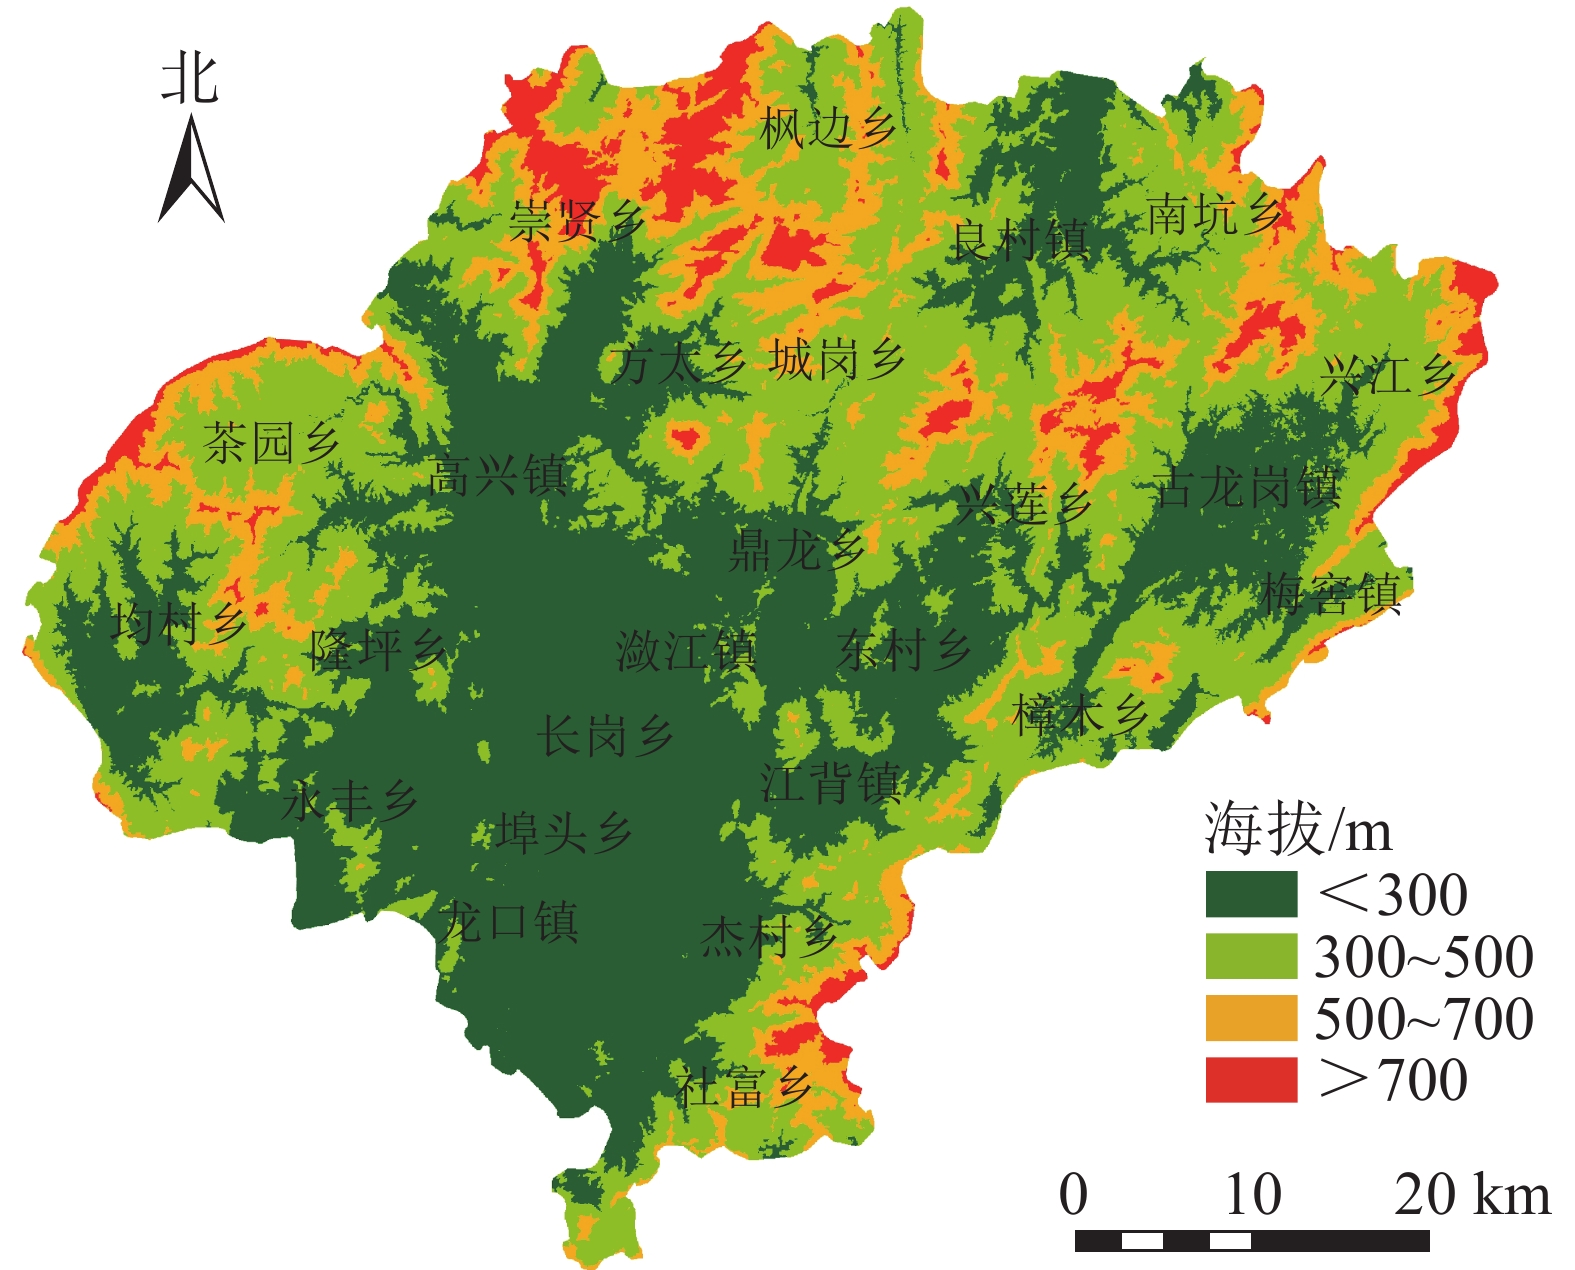
  • 在像元尺度上计算植被覆盖度的多年平均值,并结合30 m分辨率的数字高程模型(DEM)数据,分析植被覆盖度在不同海拔的分布状况。将DEM数据以200 m为间隔划分成5个等级(图4)。兴国县80%以上的区域位于海拔500 m以下,中部与南部地势比较低,而东、西、北边缘地带地势较高。

    Figure 4.  Altitude distribution of Xingguo County

    表1可见:海拔300 m以下及300~500 m的区域,以Ⅳ级和Ⅴ级植被占绝对优势,分别占该区域的75.31%、77.59%;海拔500~700 m及700 m以上的区域,主要以Ⅴ级和Ⅵ级植被为主,分别占该区域的89.82%、93.87%。总的来看,随海拔的升高,Ⅰ级、Ⅱ级、Ⅲ级、Ⅳ级植被面积减少,Ⅴ级、Ⅵ级植被区域面积增加,且以更高等级的植被覆盖度为主。一方面可能是由于随海拔增大,人口密度减小,植被生长受到人类活动的干扰减少,植被覆盖度增加;另一方面可能是因为海拔高度不同,水热分布条件、养分移动堆积等特点不同,影响了植被的生长与分布。

    等级海拔<300 m海拔300~500 m海拔500~700 m海拔>700 m
    面积/km2占比/%面积/km2占比/%面积/km2占比/%面积/km2占比/%
    27.80 1.98 1.12 0.09 0.04 0.01 0.01 0.01
    54.60 3.88 8.62 0.70 1.05 0.24 0.09 0.07
    233.93 16.62 54.93 4.48 8.13 1.85 0.98 0.71
    534.65 38.00 230.19 18.76 35.50 8.08 7.35 5.34
    524.99 37.31 722.04 58.84 204.37 46.50 44.09 32.05
    31.13 2.21 210.30 17.14 190.37 43.32 85.06 61.82

    Table 1.  Changes in average vegetation coverage area at different altitudes from 1988 to 2019

  • 表2可见:在31 a间,仅聚集度增大,其余各指数都有所减小。边缘密度由1988年的41.13 m·hm−2减小至2019年的36.89 m·hm−2,形状指数由59.96减小至53.98,表明景观边界的分割减少,异质性水平降低,斑块形状朝简单化发展,平均分维数略有减小,也进一步证明景观形状趋向简单,这可能是外界干扰强度增大影响的。香农多样性指数由1988年的1.55减小到2019年的1.34,而香农均匀度指数则由0.87降到0.75,表明区域内各景观要素面积所占比例差距增大,往更不均匀方向发展,优势景观要素更为明显,景观异质性有所降低。与此同时,与1988年相比,2019年聚集度有较明显的增大,说明小斑块开始逐渐形成大斑块,景观斑块的团聚性、连通性增强,趋向聚集分布。

    年份边缘密度/(m·hm−2)形状指数平均分维数香农多样性指数香农均匀度指数聚集度/%
    198841.1359.961.031.550.8740.50
    199440.1658.591.031.420.7941.86
    200039.1657.181.031.330.7443.28
    200639.5457.701.031.520.8542.20
    201336.6553.631.021.340.7546.93
    201936.8953.981.021.340.7546.56

    Table 2.  Changes in landscape index in different periods

  • 图5可见:1988−2019年,边缘密度从大到小依次为Ⅴ级、Ⅳ级、Ⅲ级、Ⅱ级、Ⅰ级,其中Ⅰ级植被变化较小,而Ⅱ级、Ⅲ级、Ⅳ级植被主要呈减小趋势,表明这些等级的植被破碎化程度减小,异质性水平降低;Ⅴ和Ⅵ级植被边缘密度增大,表明斑块边界的分割加强,异质性增大。

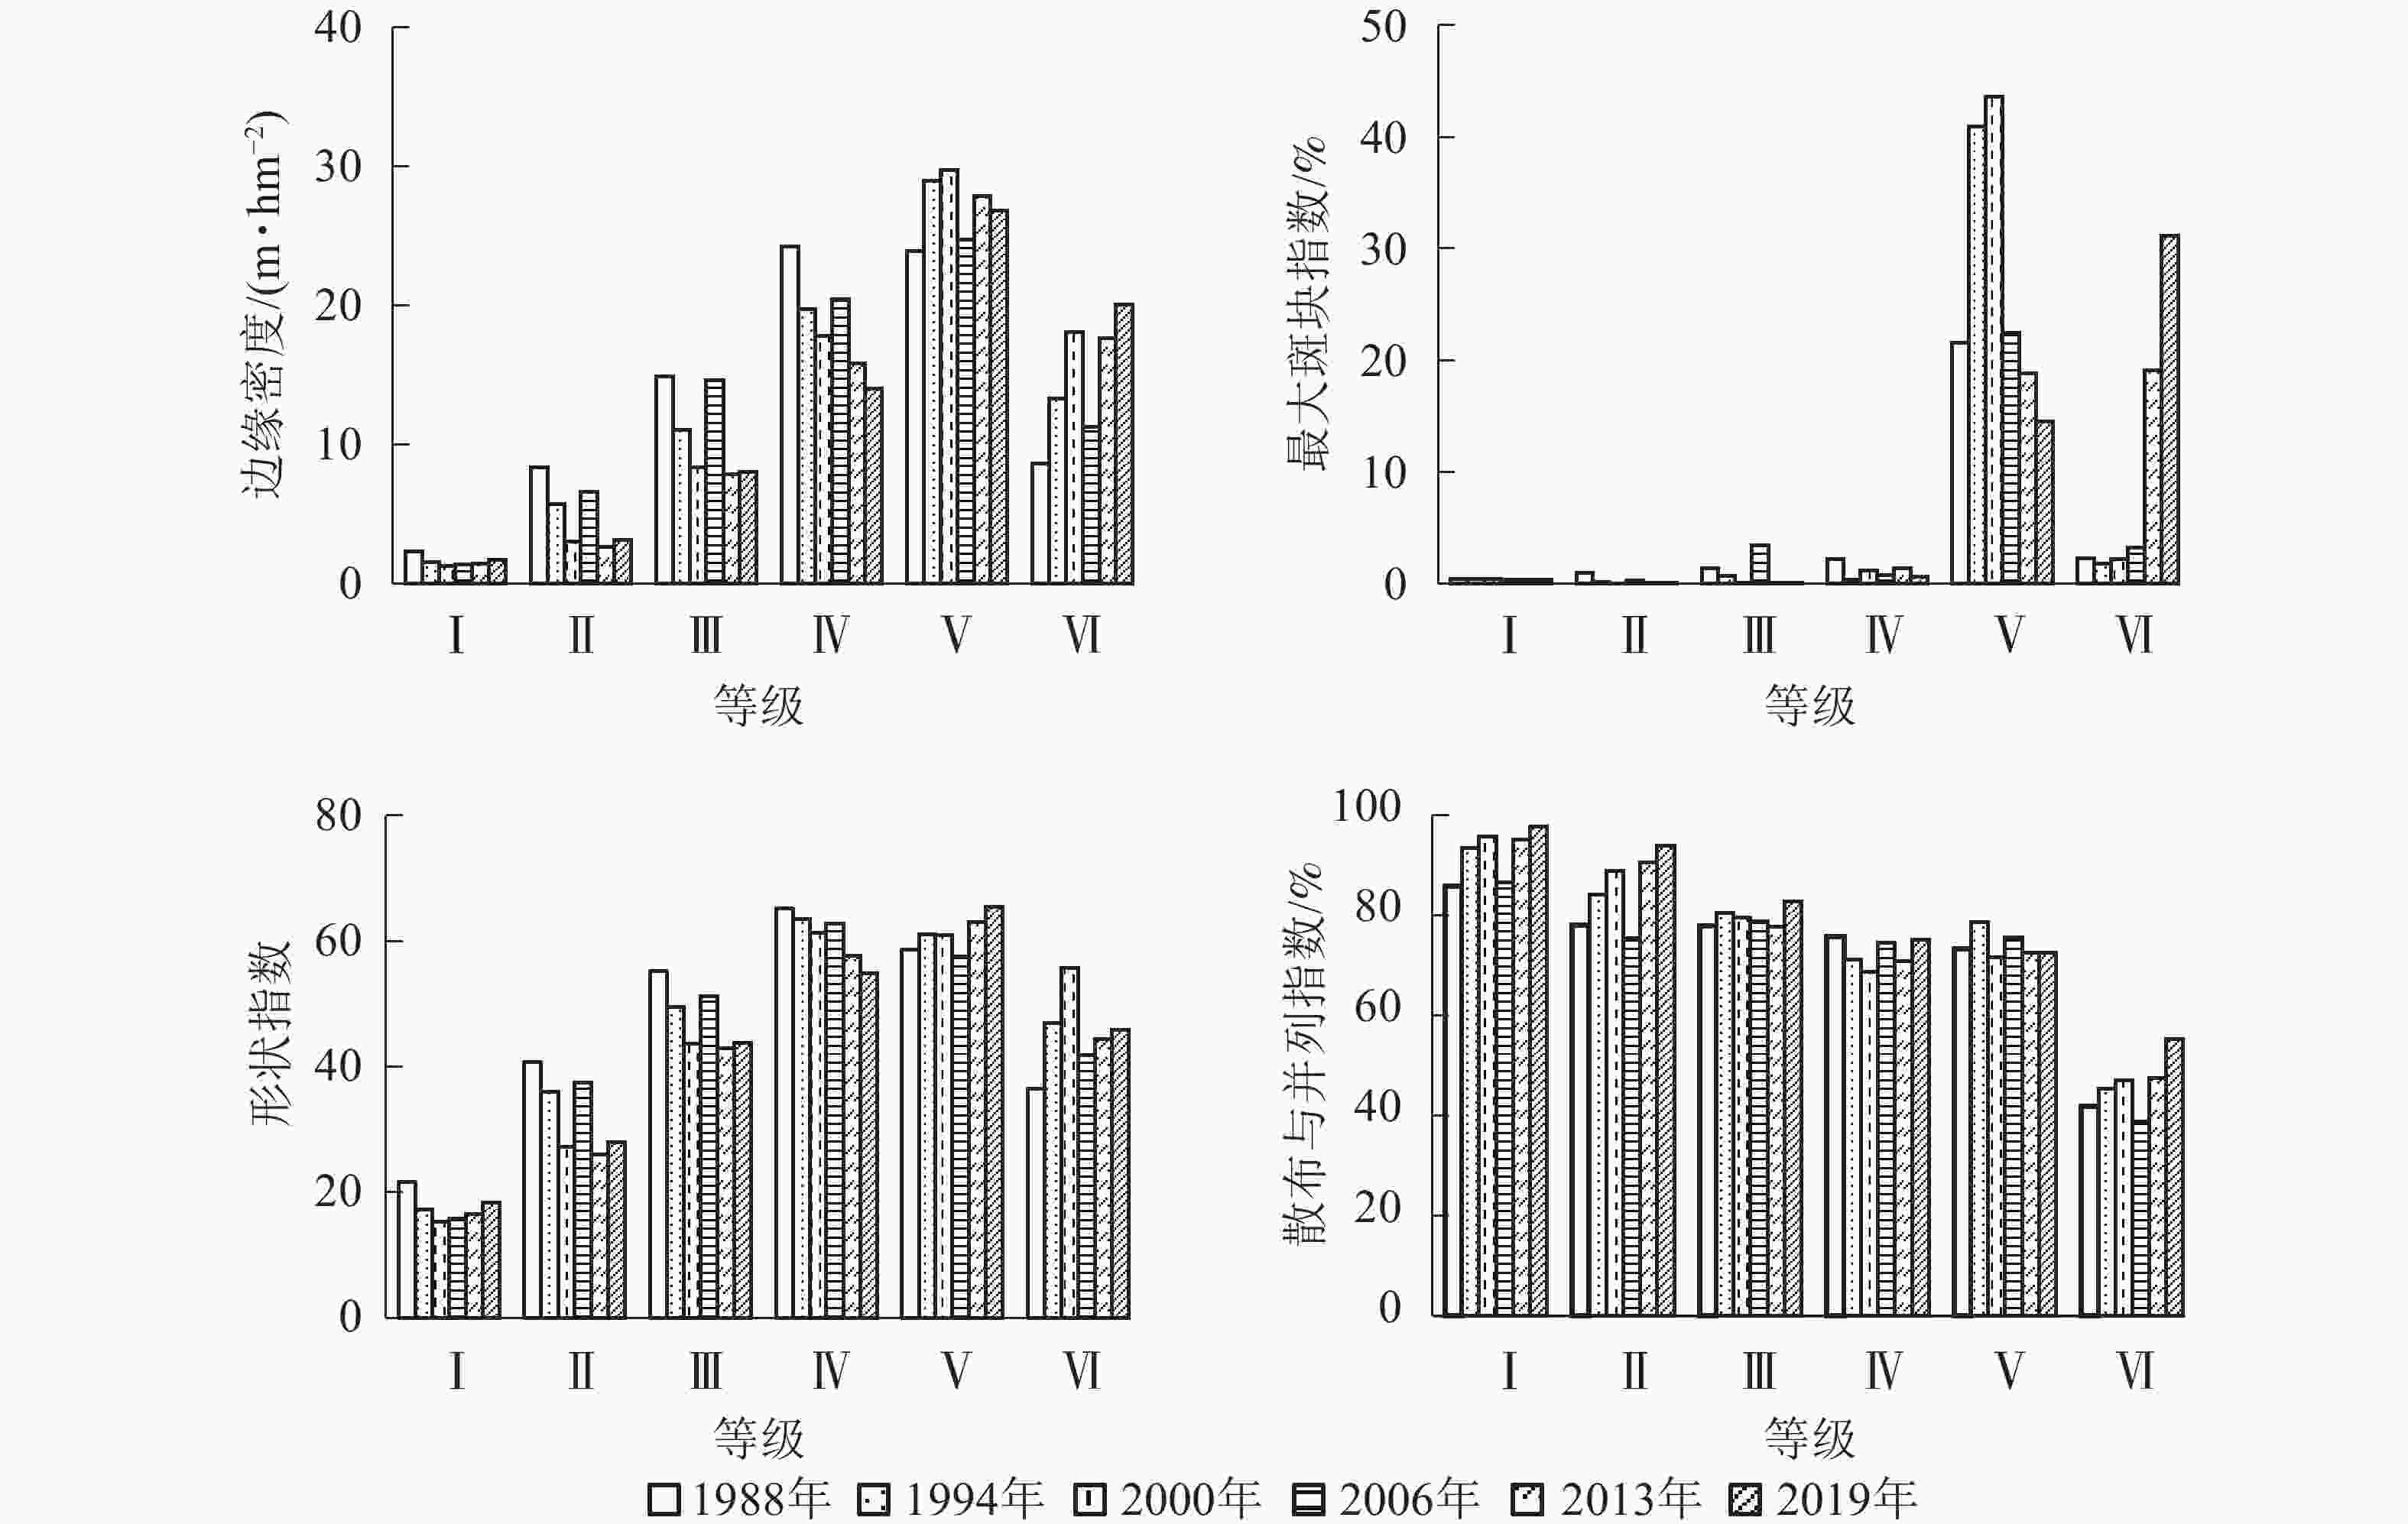
    Figure 5.  Changes of landscape index under different vegetations’ coverage

    最大斑块指数在研究区的优势植被类型(Ⅴ和Ⅵ级)中变化较大。其中Ⅴ级植被在2000年达到最大,为43.62%,而Ⅵ级植被在2019年达到最大,为31.14%。尤其自2013年以后,Ⅵ级植被最大斑块指数有较大程度的增大,说明周边小斑块区域植被覆盖度从低等级进一步向极高等级转化,成为新的优势植被景观类型。其余植被类型中,最大斑块指数较小且变化不大。

    形状指数变化幅度较小,与1988年相比,2019年Ⅰ级、Ⅱ级、Ⅲ级、Ⅳ级植被的形状指数呈减小趋势,表明在人为有目的的经营活动下,这些等级植被的形状趋于简单化。而Ⅴ和Ⅵ级植被形状指数有所增大,表明其形状趋于复杂,植被由较低级向较高级演替,这可能与较少的人类活动有关。

    散布与并列指数从大到小依次为Ⅰ级、Ⅱ级、Ⅲ级、Ⅳ级,Ⅴ与Ⅳ级植被的散布与并列指数较为接近,Ⅵ级植被的数值最小。1988−2019年,Ⅰ级、Ⅱ级、Ⅲ级植被的散布与并列指数均呈增大—减小—增大变化趋势,表明各斑块与其他各植被景观有较好的等量相邻,各斑块交替出现规律明显;Ⅳ和Ⅴ级植被散布与并列指数虽较大,但波动较小;Ⅵ级植被则明显小于其他植被景观,表明与其相邻的植被景观较少,主要以较为集中的连片形式分布。

  • 植被覆盖度是进行区域生态系统评估的重要定量指标,采取归一化植被指数的像元二分法监测植被覆盖度,削弱了各种环境因子产生的干扰,该方法操作简单,相关参数易获取,可用于不同植被类型的植被覆盖度监测[21]。但关于全裸土覆盖的NDVI和全绿色植被覆盖的NDVI取值,不同研究采取的置信度水平存在差异[22-23],由此可能造成结果不同。本研究利用NDVI的像元二分法,对兴国县1988−2019年不同时期植被覆盖度进行了估算,发现植被覆盖度由1988年的63.89%增至到2019年的79.16%,虽然在2006年有所降低,但总体植被覆盖度呈增大趋势,这与刘琪璟等[24]、李恒凯等[16]的研究结论一致,也表明利用NDVI的像元二分法是可行的。

    一般把植被从低等级朝高等级的转移视为进化演变,相反则视为退化演变。本研究表明:虽然研究区在1988−2019年不同时期各等级植被覆盖度区域的面积表现出不同的增减变化,但极低、低、中、中高、高植被覆盖主要朝更高级覆盖转移,其植被覆盖已转变成极高植被覆盖度为主的结构,总体上,研究区的植被为进化演变。这可能主要是由森林植被变化所导致的,在31 a间,研究区经过林业上的“灭荒”工程、林业产权制度改革调动造林的积极性以及一系列林业工程项目等的实施,提高了森林植被覆盖及其质量。同时,本研究表明:研究区的植被覆盖度的高低总体上与海拔高低较为吻合,中部、南部海拔较低,其植被覆盖度也相对较低,而东、西、北边海拔相对较高,其植被覆盖度则以高、极高等级为主,表明海拔影响植被生长[25-26]。除此之外,31 a间,植被覆盖度极度增加区域主要集中在南部的龙口镇、杰村乡、社富乡等,极度减少区域主要在中部县城所在的潋江镇和长岗乡,表明植被覆盖的变化可能还与人口密度、土地利用类型结构等有关[27-28]

    本研究表明:兴国县的植被覆盖度存在破碎化、异质性及多样性降低、空间分布向不均匀变化的趋势,而聚集度呈增大趋势。景观聚集性增大表明斑块空间连通性增强,这有利于促进生态系统的稳定性,景观异质性水平的减小和聚集度的增加在某种程度上象征着区域景观受人类活动影响程度的减小[18],表现出景观类型构成和空间格局向自然演替发展的趋势。不同植被盖度等级下的斑块形状在人为干预下趋于简单化,与其他斑块有着较好的等量相邻,这有助于保持良好的整体生态系统[29];研究区高、极高植被覆盖增大,且其形状指数有所增大,极高植被覆盖主要以较为集中的连片形式分布,表明人类干扰程度减弱,自然恢复植被逐渐起主导作用,高、极高植被覆盖对整个研究区的控制作用加大,主导着区域的整体功能、结构及生态过程,31 a间研究区植被空间格局总体上向良性方向发展,有利于区域的可持续发展。

    中国植被覆盖度整体上呈逐渐绿化的趋势[30],江西省植被覆盖度整体上呈改善增加的趋势[31]。政策等因素对植被覆盖度及景观格局变化有着重要影响,如曾广林 [32]研究表明:赣州市1999年后的退耕还林、绿化造林与森林生态植被保护等政策促使了林地面积大幅增长,其中高植被覆盖度与极高植被覆盖度的面积增大;王柯等[33]对赣州市生态保护与修复试点工程的实施效果进行了评估,表明2015−2018年赣州市森林、农田生态系统面积增加,且有超过40%的草地生态系统转变为森林生态系统,其归一化植被指数稳定在0.7以上并呈增长趋势。兴国县植被覆盖度及空间格局变化除受海拔等自然因素影响外,实施的一系列绿化工程等政策因素以及人们生态保护意识的提高也对其产生重要影响,如在20世纪70−90年代先后对21个乡镇进行了大面积马尾松飞播造林活动[34],1989年启动的“消灭荒山”和跨世纪绿色工程、长江防护林、珠江防护林等造林绿化工程的推动,极大地促进了兴国县植被覆盖的提高及生态环境的改善;同时,2003−2015年实施了61.85 km2的退耕还林工程以及2016年开始实施了180.98 km2的天然林保护工程,在一定程度也增加了研究区的植被覆盖,促进了植被覆盖度向更高级转变。除此之外,自20世纪80年代初,兴国县全面施行水土保持重点防治工程,1988年以后的水土流失面积逐年降低[35],也有利于植被生长,植被覆盖质量提高。

Reference (35)

Catalog

    /

    DownLoad:  Full-Size Img  PowerPoint
    Return
    Return