Volume 39 Issue 1
Feb.  2022
Turn off MathJax
Article Contents

LI Chen, GAO Binpin, WU Yingmei, ZHENG Kejun, WU Yan. Dynamic simulation of landscape ecological risk in mountain towns based on PLUS model[J]. Journal of Zhejiang A&F University, 2022, 39(1): 84-94. doi: 10.11833/j.issn.2095-0756.20210237
Citation: LI Chen, GAO Binpin, WU Yingmei, ZHENG Kejun, WU Yan. Dynamic simulation of landscape ecological risk in mountain towns based on PLUS model[J]. Journal of Zhejiang A&F University, 2022, 39(1): 84-94. doi: 10.11833/j.issn.2095-0756.20210237

Dynamic simulation of landscape ecological risk in mountain towns based on PLUS model

doi: 10.11833/j.issn.2095-0756.20210237
  • Received Date: 2021-03-22
  • Rev Recd Date: 2021-09-06
  • Available Online: 2022-02-14
  • Publish Date: 2022-02-14
  •   Objective  With an exploration of the spatiotemporal evolution characteristics of landscape ecological risks in key mountainous development zones as well as the the simulation and prediction of the changing trends of landscape ecological risks, this study is aimed to provide support for the alleviation of the conflicts between ecological protection and construction, so as to promote the sustainable use of land resources, giving full play to the regional central function and furthering the high-quality regional development in small and medium-sized towns.  Method  Based on the land cover data of 2000, 2010 and 2020, a model of risk assessment on landscape ecology was constructed on the basis of the landscape index to examine the spatiotemporal variations of landscape ecological risk in Anning in Yunnan Province. Then, a prediction was made of the spatial distribution characteristics and trends of landscape ecological risks in different contexts in Anning in 2030 employing the PLUS model which was improved from the FLUS model.  Result  From 2000 to 2020, the area of artificial surfaces in the study area showed an upward trend, while the area of cultivated land, grassland, shrubland and water bodies showed a downward trend, with the area of forest land staying relatively stable. The spatial agglomeration state of landscape ecological risk values was significant, yet with its degree on the decline and the landscape ecological risk was mainly at medium and high levels in Anning taking up 59.76%−52.95% of the total area. Under the ecological protection scenario in 2030, the area of high ecological risk zone will be the smallest deterioration zone taking up an even smaller share while the area of low ecological risk zone will be the largest.  Conclusion  The contradiction between ecological risk control and the construction of small and medium-sized towns in mountainous areas was obvious. The spatiotemporal distribution characteristics of landscape ecological risks were closely related to the intensity of human activity intervention, and the higher ecological risk regions were mainly distributed in the fringes of the urban areas. Therefore, focus should be laid on the dynamic changes in the structure of landscape types and their ecological risks as a result of urban land expansion. It was also found that the spatial distribution characteristics and change trends of landscape ecological risk under the ecological protection scenario are closer to the optimization path of ecological security pattern and this scenario is more consistent with the high-quality development of regional economy and society in Anning. [Ch, 5 fig. 5 tab. 30 ref.]
  • [1] SUN Jingyu, SUN Xiangyang, LI Suyan, WANG Chenchen, YUE Zongwei.  Sources and contamination assessment of heavy metals in the green land soils in Tongzhou District, Beijing . Journal of Zhejiang A&F University, 2024, 41(3): 517-525. doi: 10.11833/j.issn.2095-0756.20230435
    [2] DING Jinhua, SUN Qi.  Multi-scenario simulation and prediction of blue-green spatial pattern in the southern Jiangsu water network area . Journal of Zhejiang A&F University, 2024, 41(1): 202-210. doi: 10.11833/j.issn.2095-0756.20220741
    [3] WU Genghong, WANG Yiru, LIU Tiedong, GONG Wenfeng, LIN Shiping, CHEN Chong.  Evaluation of landscape pattern evolution and spatial configuration of urban park green space in Haikou City based on SEDMs model . Journal of Zhejiang A&F University, 2023, 40(5): 1093-1101. doi: 10.11833/j.issn.2095-0756.20220702
    [4] WANG Hui, LIU Yuan, SHI Yan, DING Zhifan, JIANG Hongchao.  Scenario simulation and prediction of Qinhu National Wetland Park based on PLUS Model . Journal of Zhejiang A&F University, 2023, 40(6): 1311-1321. doi: 10.11833/j.issn.2095-0756.20230163
    [5] CHEN Xi, YE Kemo, LI Kun, JIN Yang.  Research on land use change and risk-value of “production-living-ecological space” in a resource-based city . Journal of Zhejiang A&F University, 2023, 40(5): 1111-1120. doi: 10.11833/j.issn.2095-0756.20220666
    [6] WEI Zilu, ZHU Junyi, PAN Chenhang, WANG Yiying, HU Qinqin, ZHOU Ying, JIN Shuihu.  Investigation and risk assessment of alien invasive plants in Ningbo, Zhejiang Province . Journal of Zhejiang A&F University, 2021, 38(3): 552-559. doi: 10.11833/j.issn.2095-0756.20200351
    [7] SHEN Peng, LI Gongquan.  Risk assessment of Bursaphelenchus xylophilus in Hubei Province based on ecological niche factor analysis model . Journal of Zhejiang A&F University, 2021, 38(3): 560-566. doi: 10.11833/j.issn.2095-0756.20200365
    [8] CUI Yanglin, GAO Xiang, DONG Bin, WEI Huimin.  Landscape ecological risk assessment of county . Journal of Zhejiang A&F University, 2021, 38(3): 541-551. doi: 10.11833/j.issn.2095-0756.20200461
    [9] DAI Qilin, ZHANG Chao, SHANG Kerong, ZHOU Yan, QIU Lei, YU Shuquan.  Rational annual cutting volume of forest management units based on FSOS . Journal of Zhejiang A&F University, 2020, 37(5): 833-840. doi: 10.11833/j.issn.2095-0756.20190651
    [10] WANG Tao, XIAO Caixia, LIU Jiao, LU Xin.  Dynamic evolution and landscape ecological risks assessment of Qilu Lake in Yunnan Plateau . Journal of Zhejiang A&F University, 2020, 37(1): 9-17. doi: 10.11833/j.issn.2095-0756.2020.01.002
    [11] PENG Chenchen, CAI Yumei, BIAN Zhenxing.  Delineating an ecological red line in Yantai, Shandong Province . Journal of Zhejiang A&F University, 2018, 35(5): 818-828. doi: 10.11833/j.issn.2095-0756.2018.05.005
    [12] LIANG Licheng, YU Shuquan, ZHANG Chao, QIAN Li, QI Peng.  Spatial distribution and ecological risk assessment of heavy metals in Yongkang City . Journal of Zhejiang A&F University, 2017, 34(6): 972-982. doi: 10.11833/j.issn.2095-0756.2017.06.002
    [13] WEN Guojing, LIU Yungen, WANG Yan, HOU Lei, WANG Yanxia, GUO Yujing.  Temporal and spatial evolution of landscape patterns and ecological risk in the Puzhehei Lake basin . Journal of Zhejiang A&F University, 2017, 34(6): 1095-1103. doi: 10.11833/j.issn.2095-0756.2017.06.018
    [14] PENG Weiliang, GU Lei, HU Chenpei, ZHOU Pengfei, HONG Minghui, LI Cuiqin.  A research on consumers’ willingness to pay for low-carbon floor to the scenario simulation of carbon labeling floor . Journal of Zhejiang A&F University, 2015, 32(5): 655-660. doi: 10.11833/j.issn.2095-0756.2015.05.001
    [15] YI Wuying, SU Weici, ZHOU Wenlong, TANG Jingang, ZHANG Fengtai.  An ecological security early warning simulation city based on the CA Model in Huaxi District of Guiyang City, China . Journal of Zhejiang A&F University, 2015, 32(3): 369-375. doi: 10.11833/j.issn.2095-0756.2015.03.006
    [16] WANG Qiuhua, XU Shengji, LI Shiyou, QU Haibin, WAN Chun, WEN Canming, ZHANG Xiaoming.  Fire environment of spot fires in a Pinus yunnanensis forest . Journal of Zhejiang A&F University, 2013, 30(2): 263-268. doi: 10.11833/j.issn.2095-0756.2013.02.017
    [17] ZHANG Ting-ting, XU Hua-chao, JIANG Ting.  Survey and risk analysis of forest pests in Nanhu District,Jiaxing City . Journal of Zhejiang A&F University, 2012, 29(4): 621-625. doi: 10.11833/j.issn.2095-0756.2012.04.022
    [18] LI Jun-ying, YAN Hong-wei, TANG Qiang, ZHU Yue.  A scenic beauty estimation model for a natural secondary forest . Journal of Zhejiang A&F University, 2010, 27(6): 923-927. doi: 10.11833/j.issn.2095-0756.2010.06.020
    [19] SONG Yu, JIANG Hong, YUShu-quan, ZHOUGuo-mo.  Landscape ecological analysis of soil erosion . Journal of Zhejiang A&F University, 2007, 24(3): 342-349.
    [20] ZHAN Xiao-yun, WANG Sheng-kui, L Xian-zhong, ZENG Yan-ru.  Establishment of a model for optimized development of ecotourist resources in Linan and its application . Journal of Zhejiang A&F University, 2006, 23(5): 570-574.
  • [1]
    CAO Qiwen, ZHANG Xiwen, MA Hongkun, et al. Review of landscape ecological risk and an assessment framework based on ecological services: ESRISK [J]. Acta Geogr Sin, 2018, 73(5): 843 − 855.
    [2]
    GAO Binpin, LI Chen, WU Yingmei, et al. Landscape ecological risk assessment and influencing factors in ecological conservation area in Sichuan-Yunnan Provinces, China [J]. Chin J Appl Ecol, 2021, 32(5): 1603 − 1613.
    [3]
    PENG Jian, DANG Weixiong, LIU Yanxu, et al. Review on landscape ecological risk assessment [J]. Acta Geogr Sin, 2015, 70(4): 664 − 677.
    [4]
    BAI Xuemei, SHI Peijun, LIU Yansui. Realizing China’s urban dream [J]. Nature, 2014, 509(1799): 158 − 160.
    [5]
    LANDIS W G, WIEGERS J A. Design considerations and a suggested approach for regional and comparative ecological risk assessment [J]. Human Ecol Risk Assess Int J, 1997, 3(3): 287 − 297.
    [6]
    KAPUSTKA L A, GALBRAITH H, LUXON M, et al. Using landscape ecology to focus ecological risk assessment and guide risk management decision-making [J]. Toxicol Ind Health, 2001, 17(5): 236 − 246.
    [7]
    RENETZEDER C, SCHINDLER S, PETERSEIL J, et al. Can we measure ecological sustainability? Landscape pattern as an indicator for naturalness and land use intensity at regional, national and european level [J]. Ecol Indic, 2010, 10(1): 39 − 48.
    [8]
    WEN Guojing, LIU Yungen, WANG Yan, et al. Temporal and spatial evolution of landscape patterns and ecological risk in the Puzhehei Lake basin [J]. J Zhejiang A&F Univ, 2017, 34(6): 1095 − 1103.
    [9]
    LIU Jiping, GAO Jia, DONG Chunyue. Regional differentiation and factors influencing changes in swamps in the Sanjiang Plain from 1954 to 2015 [J]. Acta Ecol Sin, 2019, 39(13): 4821 − 4831.
    [10]
    ZHANG Wen, CHANG W J, ZHU Z C, et al. Landscape ecological risk assessment of Chinese coastal cities based on land use change [J/OL]. Appl Geogr, 2020, 117: 102174[2021-03-20]. doi: 10.1016/j.apgeog.2020.102174.
    [11]
    LOU Ni, WANG Zhijie, HE Songtao. Assessment on ecological risk of Aha Lake National Wetland Park based on landscape pattern [J]. Res Soil Water Conserv, 2020, 27(1): 233 − 239.
    [12]
    GONG Jie, ZHAO Caixia, XIE Yuchu, et al. Ecological risk assessment and its management of Bailongjiang watershed, southern Gansu based on landscape pattern [J]. Chin J Appl Ecol, 2014, 25(7): 2041 − 2048.
    [13]
    CUI Yanglin, DONG Bin, WEI Huimin, et al. Granularity effect of landscape index at the county scale [J]. J Zhejiang A&F Univ, 2020, 37(4): 778 − 786.
    [14]
    MA Sheng, LIANG Xiaoying, LIU Di, et al. Multi-scale landscape ecological risk assessment in ecologically fragile regions: a case study in Gaoqu Town in Mizhi County, Shaanxi Province [J]. Chin J Ecol, 2018, 37(10): 3171 − 3178.
    [15]
    DARVISHI A, YOUSEFI M, MARULL J. Modelling landscape ecological assessments of land use and cover change scenarios. application to the Bojnourd Metropolitan Area (NE Iran) [J/OL]. Land Use Policy, 2020, 99: 105098[2021-03-20]. doi: 10.1016/j.landusepol.2020.105098.
    [16]
    LI Weiqi, LAN Zeying, CHEN Dequan, et al. Multi-scenario simulation of land use and its spatial-temporal response to ecological risk in Guangzhou city [J]. Bull Soil Water Conserv, 2020, 40(4): 204 − 210.
    [17]
    YANG Yang, HUANG Yixiong, LI Xiao, et al. Land use change simulation and landscape ecological risk assessment of Haitan Island [J]. Bull Soil Water Conserv, 2017, 37(6): 146 − 151.
    [18]
    LIANG Xun, GUAN Qingfeng, CLARKE K C, et al. Understanding the drivers of sustainable land expansion using a patch-generating land use simulation (PLUS) model: a case study in Wuhan, China [J/OL]. Comput Environ Urban Syst, 2021, 85: 101569[2021-03-20]. doi: 10.1016/j.comenvurbsys.2020.101569.
    [19]
    SHI Mingjie, WU Hongqi, FAN Xin, et al. Trade-offs and synergies of multiple ecosystem services for different land use scenarios in the Yili River Valley, China [J/OL]. Sustain, 2021, 13(3): 1577[2021-03-20]. doi: 10.3390/su13031577.
    [20]
    XIE Xiaoping, CHEN Zhicong, WANG Fang, et al. Ecological risk assessment of Taihu Lake basin based on landscape pattern [J]. Chin J Appl Ecol, 2017, 28(10): 3369 − 3377.
    [21]
    XIE Hualin. Spatial characteristic analysis of land use eco-risk based on landscape structure: a case study in the Xingguo County, Jiangxi Province [J]. China Environ Sci, 2011, 31(4): 688 − 695.
    [22]
    HAN Xiaojia, LIU Xiaopeng, WANG Yajuan, et al. Ecological risk assessment and its management of oasis in arid area based on landscape pattern: a case study in Qingtongxia [J]. Res Soil Water Conserv, 2017, 24(5): 285 − 290.
    [23]
    WANG Tao, XIAO Caixia, LIU Jiao, et al. Dynamic evolution and landscape ecological risks assessment of Qilu Lake in Yunnan Plateau [J]. J Zhejiang A&F Univ, 2020, 37(1): 9 − 17.
    [24]
    WANG Hong, LIU Xingming, ZHAO Chuanyan, et al. Spatial-temporal pattern analysis of landscape ecological risk assessment based on land use/land cover change in Baishuijiang National Nature Reserve in Gansu Province, China [J/OL]. Ecol Indic, 2021, 124: 107454[2021-03-20]. doi: 10.1016/j.ecolind.2021.107454.
    [25]
    WANG Jie, BAI Wanqi, TIAN Guohang. Spatiotemporal characteristics of landscape ecological risks on the Tibetan Plateau [J]. Resour Sci, 2020, 42(9): 1739 − 1749.
    [26]
    LIU Mengzhu, WANG Yanfang, PEI Hongwei. Landscape ecological risk assessment in Bashang area of Hebei Province based on land use change [J]. Bull Soil Water Conserv, 2020, 40(4): 303 − 311, 345.
    [27]
    WANG Xu, MA Bowen, LI Dan, et al. Multi-scenario simulation and prediction of ecological space in Hubei Province based on FLUS Model [J]. J Nat Resour, 2020, 35(1): 230 − 242.
    [28]
    WANG Baosheng, LIAO Jiangfu, ZHU Wei, et al. The weight of neighborhood setting of the FLUS model based on a historical scenario: a case study of land use simulation of urban agglomeration of the Golden Triangle of Southern Fujian in 2030 [J]. Acta Ecol Sin, 2019, 39(12): 4284 − 4298.
    [29]
    WU Changyan, CHEN Bowen, HUANG Xianjin, et al. Effect of land-use change and optimization on the ecosystem service values of Jiangsu province, China[J/OL]. Ecol Indic, 2020, 117: 106507[2021-03-20]. doi: 10.1016/j.ecolind.2020.106507.
    [30]
    ZHANG Jingdu, MEI Zhixiong, LÜ Jiahui, et al. Simulating multiple land use scenarios based on the FLUS model considering spatial autocorrelation [J]. J Geoinf Sci, 2020, 22(3): 531 − 542.
  • 加载中
通讯作者: 陈斌, bchen63@163.com
  • 1. 

    沈阳化工大学材料科学与工程学院 沈阳 110142

  1. 本站搜索
  2. 百度学术搜索
  3. 万方数据库搜索
  4. CNKI搜索

Figures(5)  / Tables(5)

Article views(1814) PDF downloads(143) Cited by()

Related
Proportional views

Dynamic simulation of landscape ecological risk in mountain towns based on PLUS model

doi: 10.11833/j.issn.2095-0756.20210237

Abstract:   Objective  With an exploration of the spatiotemporal evolution characteristics of landscape ecological risks in key mountainous development zones as well as the the simulation and prediction of the changing trends of landscape ecological risks, this study is aimed to provide support for the alleviation of the conflicts between ecological protection and construction, so as to promote the sustainable use of land resources, giving full play to the regional central function and furthering the high-quality regional development in small and medium-sized towns.  Method  Based on the land cover data of 2000, 2010 and 2020, a model of risk assessment on landscape ecology was constructed on the basis of the landscape index to examine the spatiotemporal variations of landscape ecological risk in Anning in Yunnan Province. Then, a prediction was made of the spatial distribution characteristics and trends of landscape ecological risks in different contexts in Anning in 2030 employing the PLUS model which was improved from the FLUS model.  Result  From 2000 to 2020, the area of artificial surfaces in the study area showed an upward trend, while the area of cultivated land, grassland, shrubland and water bodies showed a downward trend, with the area of forest land staying relatively stable. The spatial agglomeration state of landscape ecological risk values was significant, yet with its degree on the decline and the landscape ecological risk was mainly at medium and high levels in Anning taking up 59.76%−52.95% of the total area. Under the ecological protection scenario in 2030, the area of high ecological risk zone will be the smallest deterioration zone taking up an even smaller share while the area of low ecological risk zone will be the largest.  Conclusion  The contradiction between ecological risk control and the construction of small and medium-sized towns in mountainous areas was obvious. The spatiotemporal distribution characteristics of landscape ecological risks were closely related to the intensity of human activity intervention, and the higher ecological risk regions were mainly distributed in the fringes of the urban areas. Therefore, focus should be laid on the dynamic changes in the structure of landscape types and their ecological risks as a result of urban land expansion. It was also found that the spatial distribution characteristics and change trends of landscape ecological risk under the ecological protection scenario are closer to the optimization path of ecological security pattern and this scenario is more consistent with the high-quality development of regional economy and society in Anning. [Ch, 5 fig. 5 tab. 30 ref.]

LI Chen, GAO Binpin, WU Yingmei, ZHENG Kejun, WU Yan. Dynamic simulation of landscape ecological risk in mountain towns based on PLUS model[J]. Journal of Zhejiang A&F University, 2022, 39(1): 84-94. doi: 10.11833/j.issn.2095-0756.20210237
Citation: LI Chen, GAO Binpin, WU Yingmei, ZHENG Kejun, WU Yan. Dynamic simulation of landscape ecological risk in mountain towns based on PLUS model[J]. Journal of Zhejiang A&F University, 2022, 39(1): 84-94. doi: 10.11833/j.issn.2095-0756.20210237
  • 生态风险是指由外界自然变化及人为活动而产生的压力源对生态系统及其组分的可持续性和稳定性所产生负面影响的可能及其损失[1]。重视景观生态风险评价,防范化解生态环境领域重大风险,警惕预测潜在生态风险危害,成为生态文明建设的迫切要求[2]。土地自身就是地表景观的宏观表征方式[3],基于土地覆被的景观生态风险评价能够反映人类活动干扰对生态环境与景观格局交互作用产生的负面影响,是景观生态风险评价的重要分支。随着城镇化进程的快速推进,中小城镇建设用地需求扩大,人地关系紧张,资源环境矛盾突出,生态系统脆弱性增强[4],给城镇生态安全带来了极大的挑战。因此,揭示快速发展的中小城镇景观生态风险时空演变特征,模拟预测不同情景下景观生态风险的动态变化趋势,提出中小城镇土地利用结构优化方式,对促进未来中小城镇区域经济社会高质量发展显得尤为重要。景观生态风险评价是国内外相关研究领域的热点。LANDIS等[5]利用相对风险模型(RRM)评估土地利用生态风险;KAPUSTKA等[6]基于景观生态理论提出土地利用生态环境管控流程;RENETZEDER等[7]分析了奥地利景观格局变化特征及对生态可持续性的影响。国内对景观生态风险评价的研究主要集中于流域[8]、生态重要地区[2]、湿地[9]、城市[10],并运用景观格局指数、暴露-响应等多种方法构建生态风险评价模型[11-12],研究景观生态风险的时空分布、多尺度变化、影响因素等[13-14]。计算机及地理信息技术的广泛运用,土地变化动态建模研究迅速发展,有力支撑并极大推进了基于土地利用预测的生态环境评价研究进程,但现有的景观生态风险预测多运用CA-Markov[15]、FLUS[16]、CLUE-S[17]等模型展开,本研究针对云南省安宁市景观格局快速剧烈变化的特征,采用基于FLUS模型改进的斑块生成土地利用变化模拟模型(patch-generating land use simulation, PLUS)模拟未来山区城镇景观格局并评估其生态风险。该模型更关注揭示多种景观类型变化的潜在驱动因素及模拟景观类型的斑块级演变[18-19],使之更符合山区城镇景观格局复杂的实际情况。本研究基于2000、2010及2020年安宁市土地覆被数据,剖析景观类型变化特征,探究景观生态风险时空演变规律,运用PLUS模型模拟3种不同情景下的安宁市景观生态风险发展趋势,指出生态环境保护情景方案,以期为山地中小城镇建设开发和生态保护协调发展提供方法论视角和区域实践依据。

    • 安宁市位于云南省昆明市西南(24°31′~25°06′N,102°10′~102°37′E),辖连然、金方、太平新城等9个街道办事处,总面积1 301.81 km2;以山地为主,平均海拔1 800 m。2019年,全市地区国内生产总值(GDP)575.14亿元,常住人口38.9万人,城镇化率78.3%,是云南省最大的冶金、盐、磷、石化工基地。

      作为云南省转型升级样板区和滇中绿色发展示范区以及“一带一路”建设先行先试区,安宁市承担了滇中城市群新型城镇化空间拓展和长江上游生态安全屏障的双重使命。协调好城镇快速发展与生态环境保护的关系,成为了安宁市高质量发展的重要命题。

    • 土地覆被数据来源于2000、2010和2020年Globeland 30全球地表覆被数据库(http://www.globallandcover.com),空间分辨率为30 m×30 m,区内土地覆被类型包括耕地、林地、草地、灌木地、水体、人造地表等6种。高程数据来自地理空间数据云(http://www.gscloud.cn);国内生产总值、人口空间分布数据来源于中国科学院资源环境科学与数据中心(http://www.resdc.cn);夜光遥感数据来源于Luojia1-01数据(http://59.175.109.173:8888/index.html),并采用ENVI 5.3校正;道路数据来源于OSM数据集(https://www.openstreetmap.org);河流、湖泊数据来源于全国地理信息资源目录服务系统(https://www.webmap.cn)。

    • ①景观生态风险评价单元划分。利用ArcGIS 10.8对土地利用数据进行1 km×1 km网格化,将安宁市划分为1 310个评价单元;利用Fragstats 4.2软件分别计算每一评价单元的景观生态风险指数值,以此作为样地中心点的生态风险值。②景观生态风险指数构建[20]。从景观格局的角度出发,借鉴已有研究成果[21],构建景观生态风险指数。计算公式为:

      其中:IERk为第k个样本单元内的景观生态风险指数;Aki为第k个样本单元内景观类型i的面积;Ak为第k个样本单元的面积;Ri为景观类型i的景观损失度指数。

      其中:Ei为景观干扰度指数,通过景观破碎度Ci、景观分离度Si和景观优势度Di构建,abc为相应各景观指数的权重,且a+b+c=1,根据已有研究成果及实际情况[22-23],分别赋值为0.5、0.3、0.2;Fi为景观脆弱度指数,结合已有研究成果[24],通过专家打分法对6类景观类型赋值,将水域赋为6,耕地赋为5,草地赋为4,灌木地赋为3,林地赋为2,人造地表赋为1,最后进行归一化处理得到各类景观的脆弱度指数(Fi)值,分别为0.29、0.24、0.19、0.14、0.10、0.05。③探索性空间数据分析。运用ArcGIS地统计分析模块对样地中心点数据进行半变异函数拟合,得到最佳拟合模型;选取指数克里金插值法分别对2000、2010和2020年3期数据进行空间插值[25],采用自然间断点法划分景观生态风险等级。通过Geoda软件计算全局空间自相关莫兰指数(I),来表征景观生态风险指数在空间分布模式及其集聚效应[26]I值为−1~1。I>0表示正相关,I<0表示负相关,I=0表示不相关。

    • PLUS模型集成了基于土地扩张分析的规则挖掘方法和基于多类型随机种子机制的元胞自动机(CA)模型2个模块,对各类土地利用变化的影响因素解释性更好,模拟结果精度更高[18]。模型通过提取2期土地变化中各类用地扩展部分,运用随机森林算法获取各类用地的发展概率,再利用基于多类随机斑块种子的CA模型对未来景观格局进行模拟预测。首先,根据安宁市实际情况及数据的可获取性,从自然因素、社会经济因素和可达性3个方面选取高程、坡度、地形起伏度、公里网格GDP、人口密度、夜光遥感、距道路距离、距城镇距离、距湖泊距离和距河流距离等10个影响因子,栅格化后统一成与土地覆被数据相同的投影坐标系及空间分辨率。其次,利用用地扩张分析策略(LEAS)模块运算得到研究区各景观类型的发展概率。最后,结合未来各类用地的目标像元数、转移成本矩阵、随机斑块种子的概率及邻域因子等相关参数,基于多类随机斑块种子的CA模型实现研究区景观类型变化模拟。本研究运用Markov模型进行未来景观类型的需求预测,在已有基础上[16, 27-28]结合研究区景观类型转移情况,反复调试各参数,确定景观类型转移成本矩阵,将随机斑块种子的概率设定为0.01(参数范围0~1,越接近1表示越容易产生新的斑块),耕地、林地、草地、灌木地、水域及人造地表邻域因子参数设定为0.7、0.4、0.3、0.3、0.2、0.9(参数范围0~1,越接近1表示景观类型的扩张能力越强)。选择Kappa系数和FOM(Figure of Merit)系数进行模拟结果的精度评估,其中Kappa系数为0~1,大于0.7表示模拟结果一致性较高,精度较高[29];FOM系数由实际土地变化与预测的变化的交集与两者并集的比值确定,其值为0~1,值越高表示模拟结果的精度越高[30]

    • 2000—2020年,安宁市景观类型以林地、耕地和草地为主(表1)。其中,林地是最主要的景观类型,占研究区总面积的43.46%;其次为耕地,占总面积的24.94%,与社会经济关系最为紧密的人造地表占比9.63%。全区的景观类型变化特征表现为人造地表面积持续增加,耕地、灌木地面积持续减少,林地、草地面积先增加后减少,水域面积先减少后增加。人造地表面积呈上升趋势,耕地、灌木地、草地、水域面积总体呈下降趋势,林地面积较为稳定。其中,人造地表面积增加幅度最大,共增加8 464.36 hm2,占总变化量的49.92%;耕地面积减少幅度最大,共减少5 274.19 hm2,占总变化量的31.10%。2000—2010年,各景观类型面积变化最明显的是林地,增加1 358.30 hm2,占总变化量的33.06%;2010—2020年,各景观类型面积变化最明显的是人造地表,增加8 175.00 hm2,占总变化量的48.89%。

      景观类型面积/hm2景观变化动态度/%
      2000年2010年2020年2000—2010年2010—2020年2000—2020年
      耕地  37 735.4036 893.0632 461.21−0.22−1.20−0.67
      林地  56 576.3057 934.6056 590.200.24−0.230.00
      草地  25 994.1126 400.8024 044.900.16−0.89−0.37
      灌木地 4 798.303 939.193 709.99−1.79−0.58−1.13
      水域  1 002.43649.53835.89−3.522.87−0.83
      人造地表4 074.464 363.8112 538.820.7118.7310.39

      Table 1.  Area and dynamics of landscape types, 2000−2020

      2000—2020年,人造地表扩张速度变化最快,主要由耕地、草地、灌木地转入;2010—2020年土地动态度明显高于2000—2010年,其中2000—2010年减少速度较快的景观类型为灌木地和水域,灌木地主要转移为林地;水域主要转移为耕地、林地和草地;2010—2020年人造地表增加速度明显,城镇的快速扩展占用了大量的耕地、林地和草地。城镇化进程中以人造地表景观扩张为主,并由此产生山水林田湖草等生态景观面积减少,景观结构发生剧烈变化,生态系统稳定性减弱。
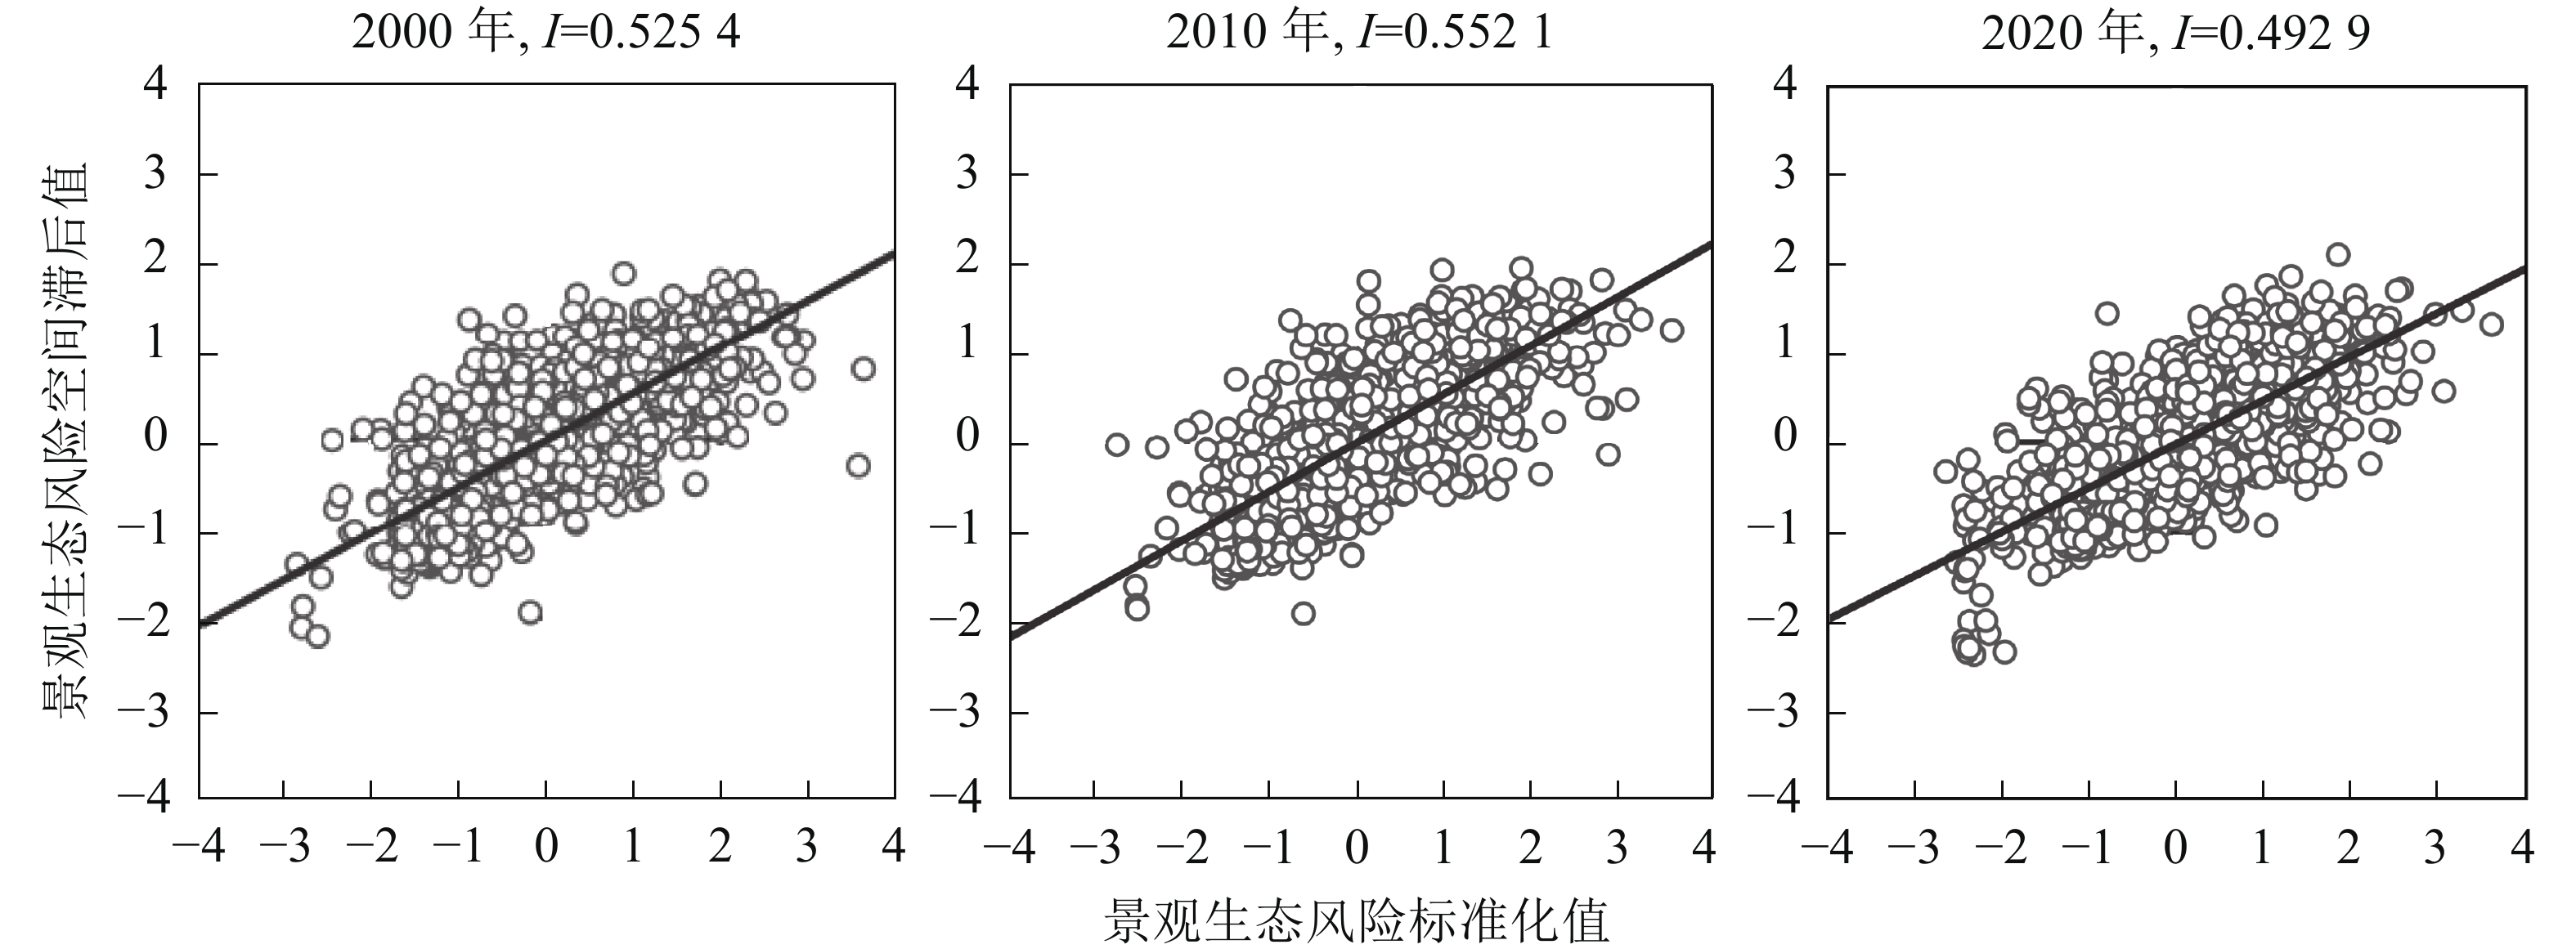
    • 图1可知:安宁市2000、2010和2020年景观生态风险的莫兰指数(I)分别为0.525 4、0.552 1和0.492 9,均表现出显著的空间正自相关性(P<0.01),说明景观生态风险值在空间上表现为聚集分布,且相互之间存在影响。2000—2010年,景观生态风险的I值上升,2010—2020年下降,整体呈下降趋势,表明安宁市景观生态风险值在空间分布上的依赖性减弱,空间趋同性逐渐降低,人类活动影响着生态风险指数的空间格局,并导致其空间分布由聚集向均匀过渡。

      Figure 1.  Landscape ecological risk Moran’s I scatter diagram in Anning, 2000−2020

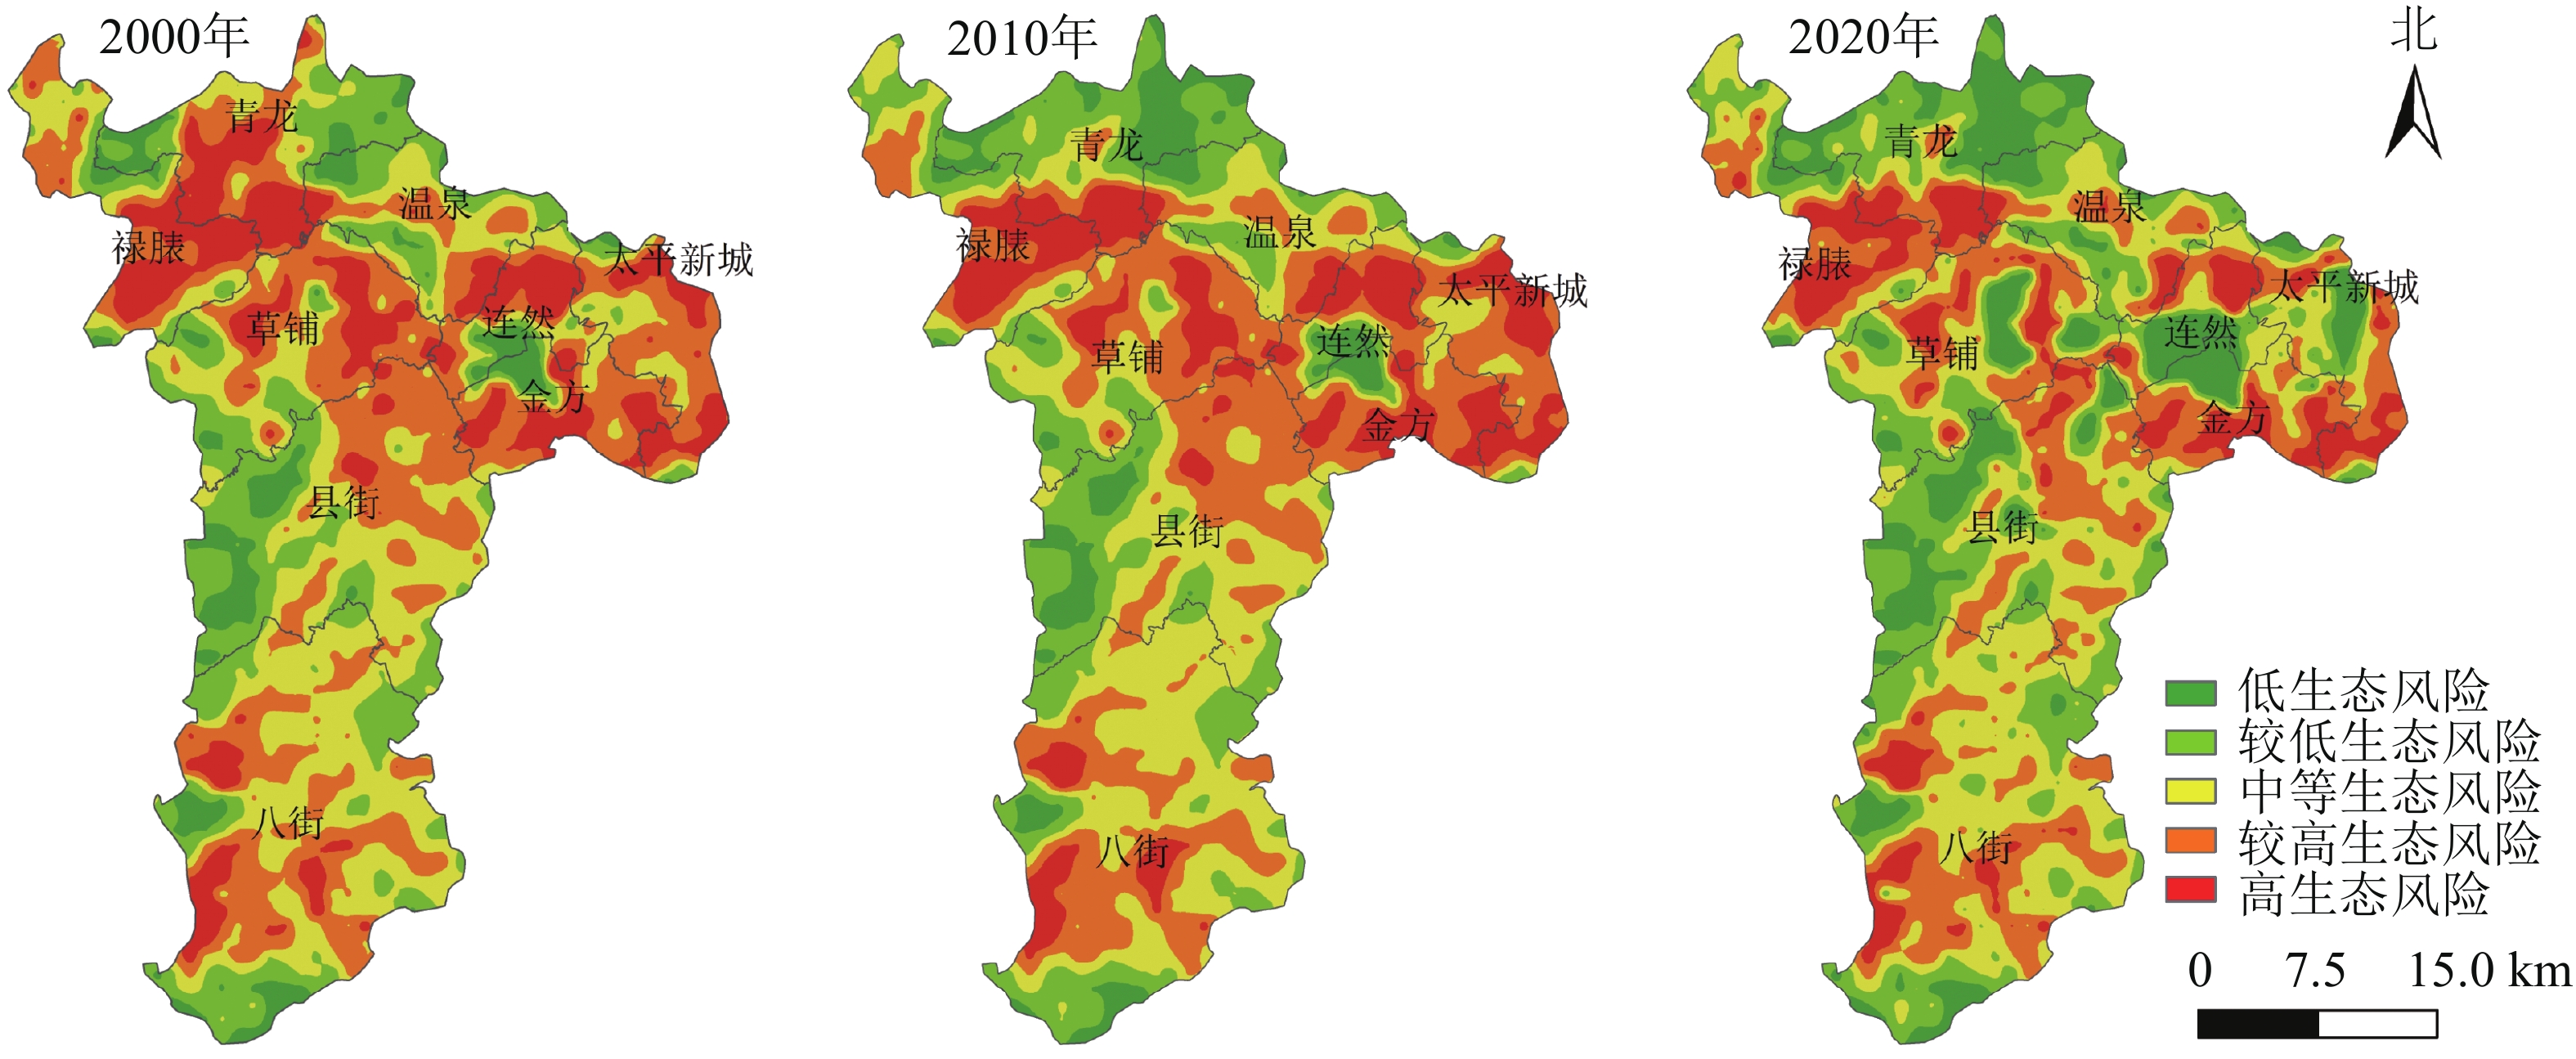
      运用指数克里金插值法得到安宁市各年生态风险值,基于自然断点法将2020年研究区生态风险值分为低生态风险(IER<0.151 1)、较低生态风险(0.151 1≤IER<0.177 8)、中等生态风险(0.177 8≤IER<0.202 6)、较高生态风险(0.202 6≤IER<0.230 3)、高生态风险(IER≥0.230 3)。其他各期数据均采用2020年的分级区间,便于各期数据的比较分析,得到安宁市景观生态风险等级空间分布图(图2)。

      Figure 2.  Spatial distribution of landscape ecological risk level in Anning, 2000−2020

    • 表2可知:2000—2020年安宁市景观生态风险整体以中等风险和较高风险区为主,占研究区景观生态风险等级总面积的52.95%~59.76%。结合图2来看,低生态风险区主要分布在研究区南北两端以及中西部山地地带,景观类型主要为林地、草地,人为干扰较少,景观损失度较低;研究期内面积总体上升,主要为青龙、连然、金方、太平新城等街道组成的中心城区的低生态风险面积增加。这是由于青龙街道在此期间建成国家园林城镇,林地等景观面积增加,生态环境改善;随着城镇化的推进,中心城区城镇拓展有序,人造地表景观集中成片,稳定性强,外界干预影响较少。此外,县街和草铺街道作为安宁市重要的工业基地,为打造绿色工业城市的景观风貌,建设了麒麟现代工业景观分区和职业教育景观风貌分区,景观斑块的连接度增强,景观生态风险得到有效防控,低生态风险区面积增加。较低生态风险区面积持续上升,主要分布在低生态风险区的周围。中生态风险区主要分布于八街和县街街道,以及其余各街道耕地景观周边;该区以耕地景观为主,多分布于山地丘陵地带,景观形态复杂,水网密布,林地、草地、灌木地和人造地表景观等相互交错,破碎化程度较高,生态风险加剧,但研究期内该区整体面积变化相对稳定。较高生态风险区分布较为广泛,主要分布于高生态风险区向中等生态风险区过渡区域,研究期内面积占比降低,共降低6.94%。高生态风险区主要分布于各街道城镇扩展的边缘地带,研究期内总面积呈下降趋势,各时期占比分别为15.28%、14.47%、10.64%;说明城镇快速扩张对各类景观类型干扰度较大,尤其在城市边缘地带建设用地较为分散,人文景观与自然景观交替频繁,打断了生态系统的整体,使得景观破碎度高、分离度明显上升,加大了生态风险;其中禄脿街道整体处于高生态风险等级,作为集磷矿工业、特色农业、交通枢纽、特色农业等多种功能的混合街道,景观破碎度和分离度大,高生态风险区面积较多且呈现长期稳定的高风险状态。应用转移矩阵进一步分析研究区景观生态风险各等级间的转移特征,根据表3可以看出:2000—2020年,较低生态风险区主要转移为低生态风险区,中等风险区主要转移为较低、低生态风险区,较高生态风险区主要转移为中等生态风险区,高生态风险区主要转移为较高生态风险区。各等级生态风险区均主要表现为向次级生态风险区转移的特征。由此可以看出,研究区整体生态安全保障水平有所提高,城市经济发展与环境保护逐渐向着良性发展的态势转变。

      生态风险等级2000年2010年2020年
      面积/hm2占比/%面积/hm2占比/%面积/hm2占比/%
      低 7 668.095.899 071.576.9717 098.0413.13
      较低24 811.5919.0627 087.8820.8130 309.3423.28
      中等37 116.4428.5136 556.2028.0837 280.9328.64
      较高40 688.0331.2538 622.9229.6731 643.4424.31
      高 19 896.8515.2818 842.4214.4713 849.2510.64

      Table 2.  Area and proportion of landscape ecological risk level in Anning, 2000−2020

      生态风险等级2020年
      低/hm2较低/hm2中等/hm2较高/hm2高/hm2总面积/hm2
      2000年低/hm2  7 560.44107.660.000.000.007 668.09
      较低/hm2 4 481.4219 479.31850.860.000.0024 811.59
      中等/hm2 2 461.225 938.7726 779.171 937.280.0037 116.44
      较高/hm2 2 063.853 781.977 979.1425 351.211 511.8540 688.03
      高/hm2  531.111 001.631 671.774 354.9412337.4019 896.85
      总面积/hm217 098.0430 309.3437 280.9331 643.4413 849.25130 181.00

      Table 3.  Transfer matrix of landscape ecological risk level in Anning, 2000−2020

    • 为验证PLUS模型对景观类型模拟结果的可靠性,本研究以2010年土地覆被数据为基础,结合各景观类型发展概率,并设置相关参数,得到2020年景观类型空间格局模拟结果,并与2020年景观类型现状进行对比,精度验证计算求得总体精度为89.84%,Kappa系数为0.856,FOM值为0.247,表明模型具有较高的可信度,故基于PLUS模型对安宁市未来景观类型变化进行模拟预测。依据安宁市历史年份的景观类型变化特征,利用Markov模型构建3种不同情景下安宁市2030年景观类型。其中自然发展情景以2020年景观类型现状数据为基础,预测2030年各景观类型的面积及空间分布情况;考虑安宁市正处于快速发展的重大战略机遇期,云南石化治理、滇中新区建设等相关政策进一步推进,势必带来建设用地的快速增长,因此城镇发展情景将耕地、林地、草地、灌木地向人造地表的转移概率增加20%,人造地表向除耕地外的其他景观类型转移概率降低30%;考虑安宁市是长江上游生态安全格局的重要组成部分,为了进一步打造全国“工业城市中生态最好,生态城市中工业最强”城市,未来的景观类型变化中要进一步加强对生态用地的保护,在生态保护情景设置中,将耕地、林地向人造地表的转移概率降低30%,草地、灌木地、水域向人造地表的转换概率降低20%,人造地表向林地的转移概率增加10%,并严禁生境退化,将区域各个水库、湖泊作为约束条件,限制其任意转换。

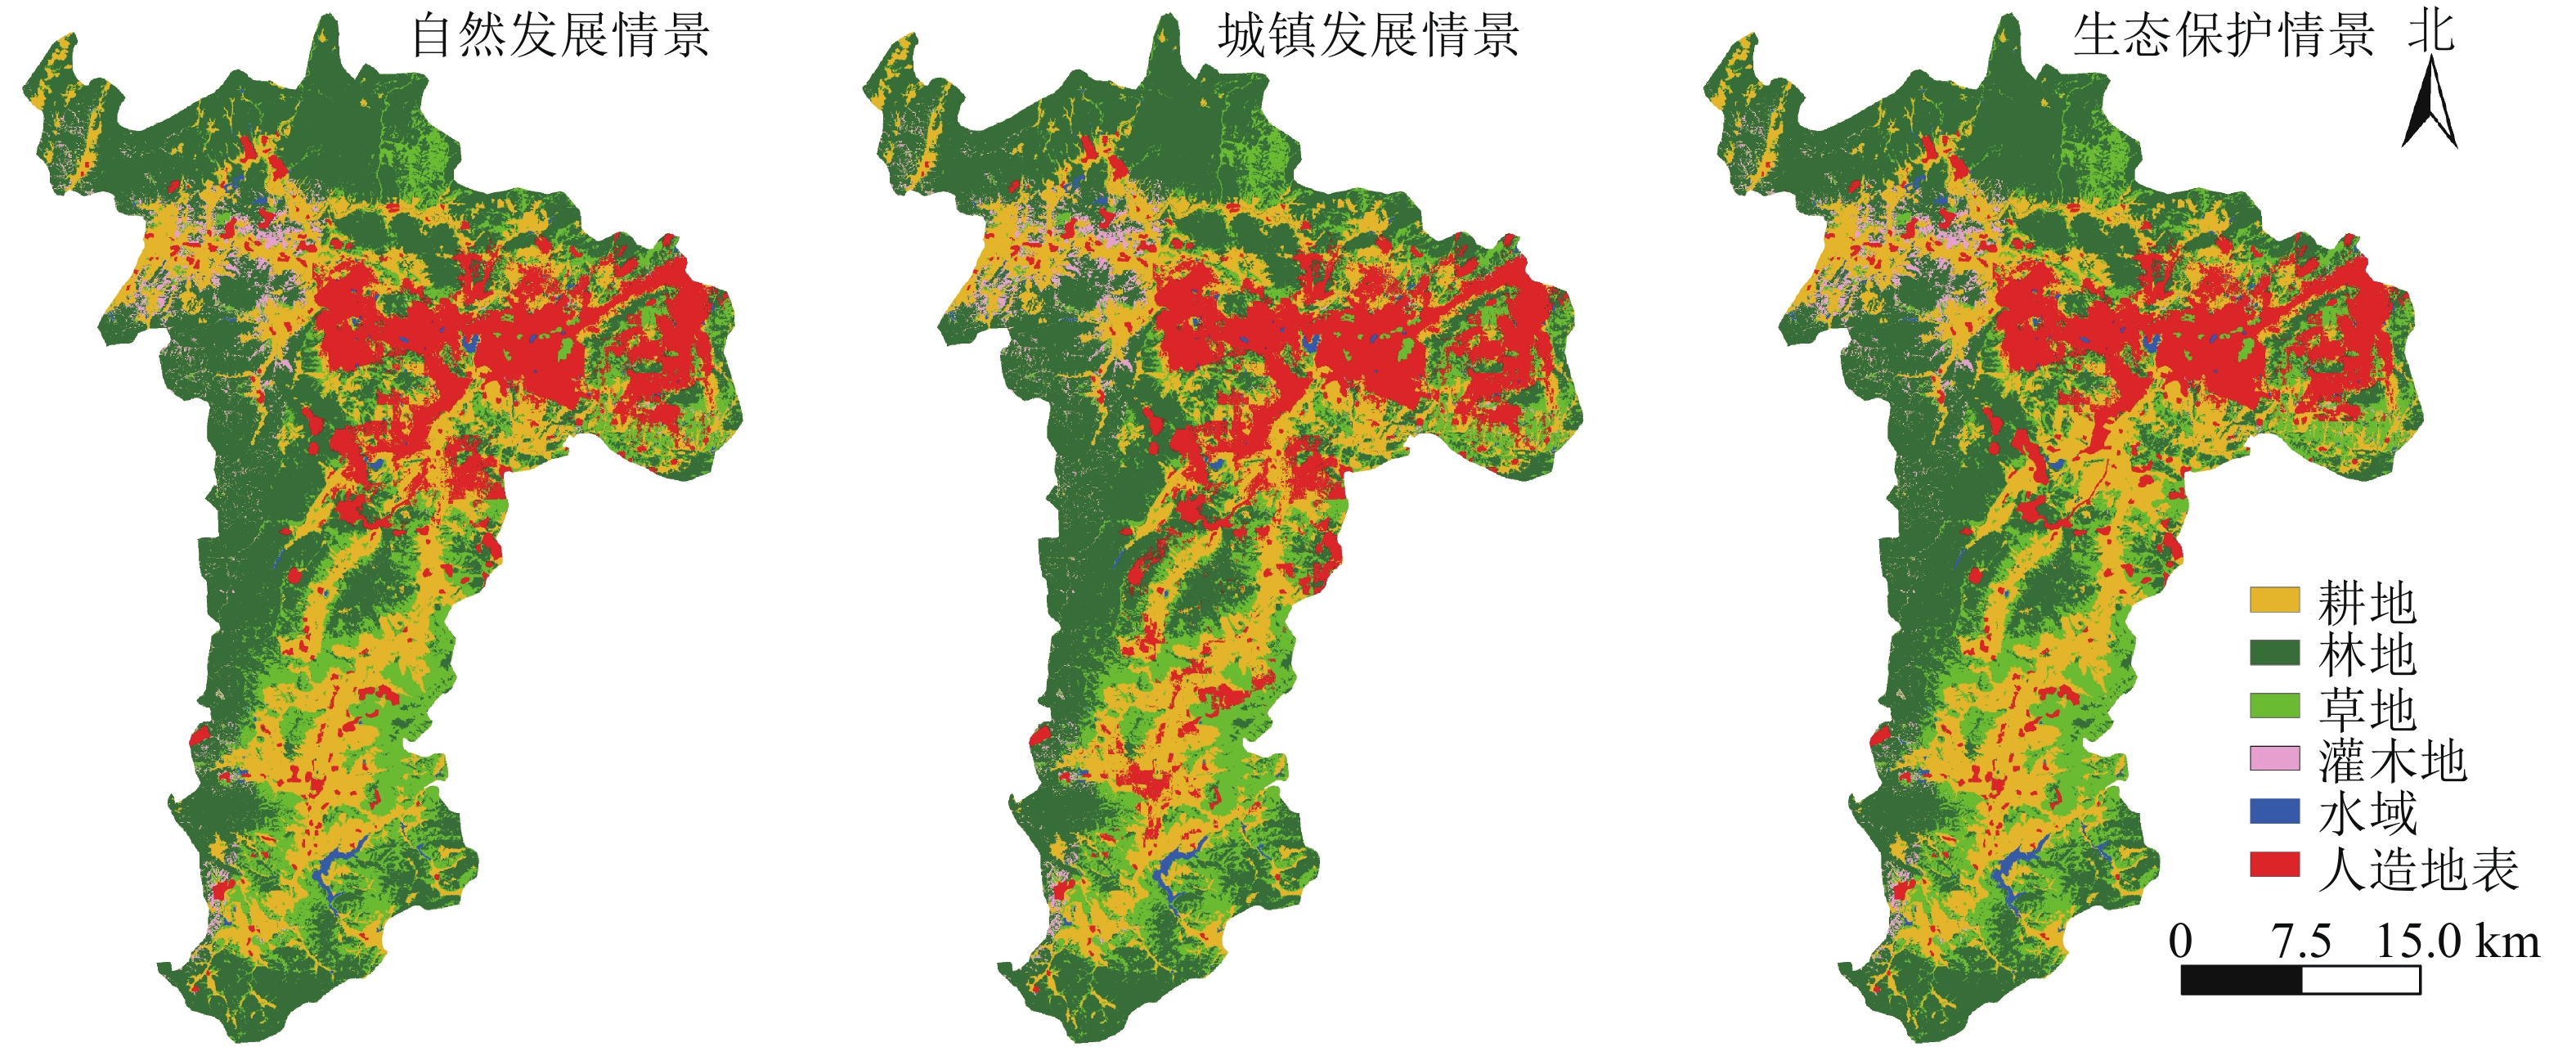
    • 综合2020年景观类型现状和各影响因子数据,运用PLUS模型模拟预测得到安宁市2030年自然发展情景、城镇发展情景和生态保护情景下景观类型空间分布格局。由图3可知:与2020年景观类型现状数据相比,安宁市2030年3种情景下各景观类型面积呈现不同程度的变化(表4),人造地表、水域的面积持续增加,耕地、林地、草地、灌木地面积持续减少。具体来看,自然发展情景下,安宁市各景观类型发展趋势发生转变,各街道城镇中心的人造地表均有一定扩张。城镇发展情景下,人造地表面积进一步增加,与自然发展情景相比,八街(农业中心)、县街(城市综合服务中心)等街道明显扩张。生态保护情景下,人造地表扩张幅度明显缩小,相比自然发展情景和城镇发展情景,人造地表分别下降2 076.06和3 704.97 hm2,耕地、林地、草地、灌木地面积减少幅度有所缓和,生态用地得到保护。

      Figure 3.  Spatial distribution of the landscape types in 2030 under different scenarios in Anning

      年份情景耕地/hm2林地/hm2草地/hm2灌木地/hm2水域/hm2人造地表/hm2
      2020   32 461.2156590.2024 044.903 709.99835.8912 538.82
      2030   自然发展情景28 993.5255 320.3722 054.373 519.86869.7719 423.11
      城镇发展情景28 137.8355 033.9721 600.533 477.91879.3621 051.40
      生态保护情景30 130.1555 693.1822 452.913 563.07995.2617 346.44
      2020—2030自然发展情景−3 467.69−1 269.83−1 990.53−190.1233.886 884.29
      城镇发展情景−4 323.39−1 556.23−2 444.37−232.0843.478 512.58
      生态保护情景−2 331.07−897.02−1 591.99−146.92159.384 807.62

      Table 4.  Comparison of landscape types and areas under different scenarios in Anning in 2020 and 2030

    • 图4可知:2030年3种情景下安宁市景观生态风险空间分布与2020年相似,整体上仍以中等生态风险区、较高生态风险区为主,但高生态风险区和低生态风险区面积均有上升。与2020年相比,自然发展情景下的较低、中等及较高生态风险区面积有所下降,而高生态风险区的面积增长幅度较大(表5),增加了2 436.66 hm2,低生态风险区也有一定的增加,扩大了1 227.79 hm2。城镇发展情景下,较低生态风险区、较高生态风险区面积下降,较高生态风险区和高生态风险区面积均得到扩张,分别增大2 189.08和2 779.71 hm2;相比其他情景,低生态风险区面积最小,较高、高生态风险区面积最大。这是由于按照现有发展趋势,建设用地面积将会进一步提高,各景观类型均发生变化,人造地表持续外延式扩张,侵占周边耕地、林地等生态景观,各景观的连通性、稳定性下降,导致较高、高生态风险面积增加。生态保护情景下,高生态风险区面积增幅明显下降,低生态风险区显著增加,与其他情景相比,高生态风险区面积最小,景观生态风险等级面积差异显著;主要原因一方面是由于生态保护情景约束了人造地表扩张,减缓了城镇边缘地区景观破碎度、分离度的升高;另一方面该情景设置了水域限制区,保护了水域的稳定性,约束了城镇扩展,增强了新增人造地表空间结构的整合性,进而增强了景观稳定性,使得生态保护区的低生态风险区面积明显上升。

      Figure 4.  Spatial distribution of landscape ecological risk level in 2030 under different scenarios in Anning

      年份情景低风险区/hm2较低风险区/hm2中等风险区/hm2较高风险区/hm2高风险区/hm2
      2020   17 098.0430 309.3437 280.9331 643.4413 849.25
      2030   自然发展情景18 325.8329 487.2534 972.3731 109.6316 285.91
      城镇发展情景18 080.1328 247.6333 391.7633 832.5116 628.96
      生态保护情景18 471.0529 213.5935 858.7230 954.1115 683.54
      2020—2030自然发展情景1 227.79−822.08−2 308.57−533.802 436.66
      城镇发展情景982.09−2 061.70−3 889.172 189.082 779.71
      生态保护情景1 373.00−1 095.75−1 422.22−689.331 834.29

      Table 5.  Comparison of landscape ecological risk level area under different scenarios in Anning in 2020 and 2030

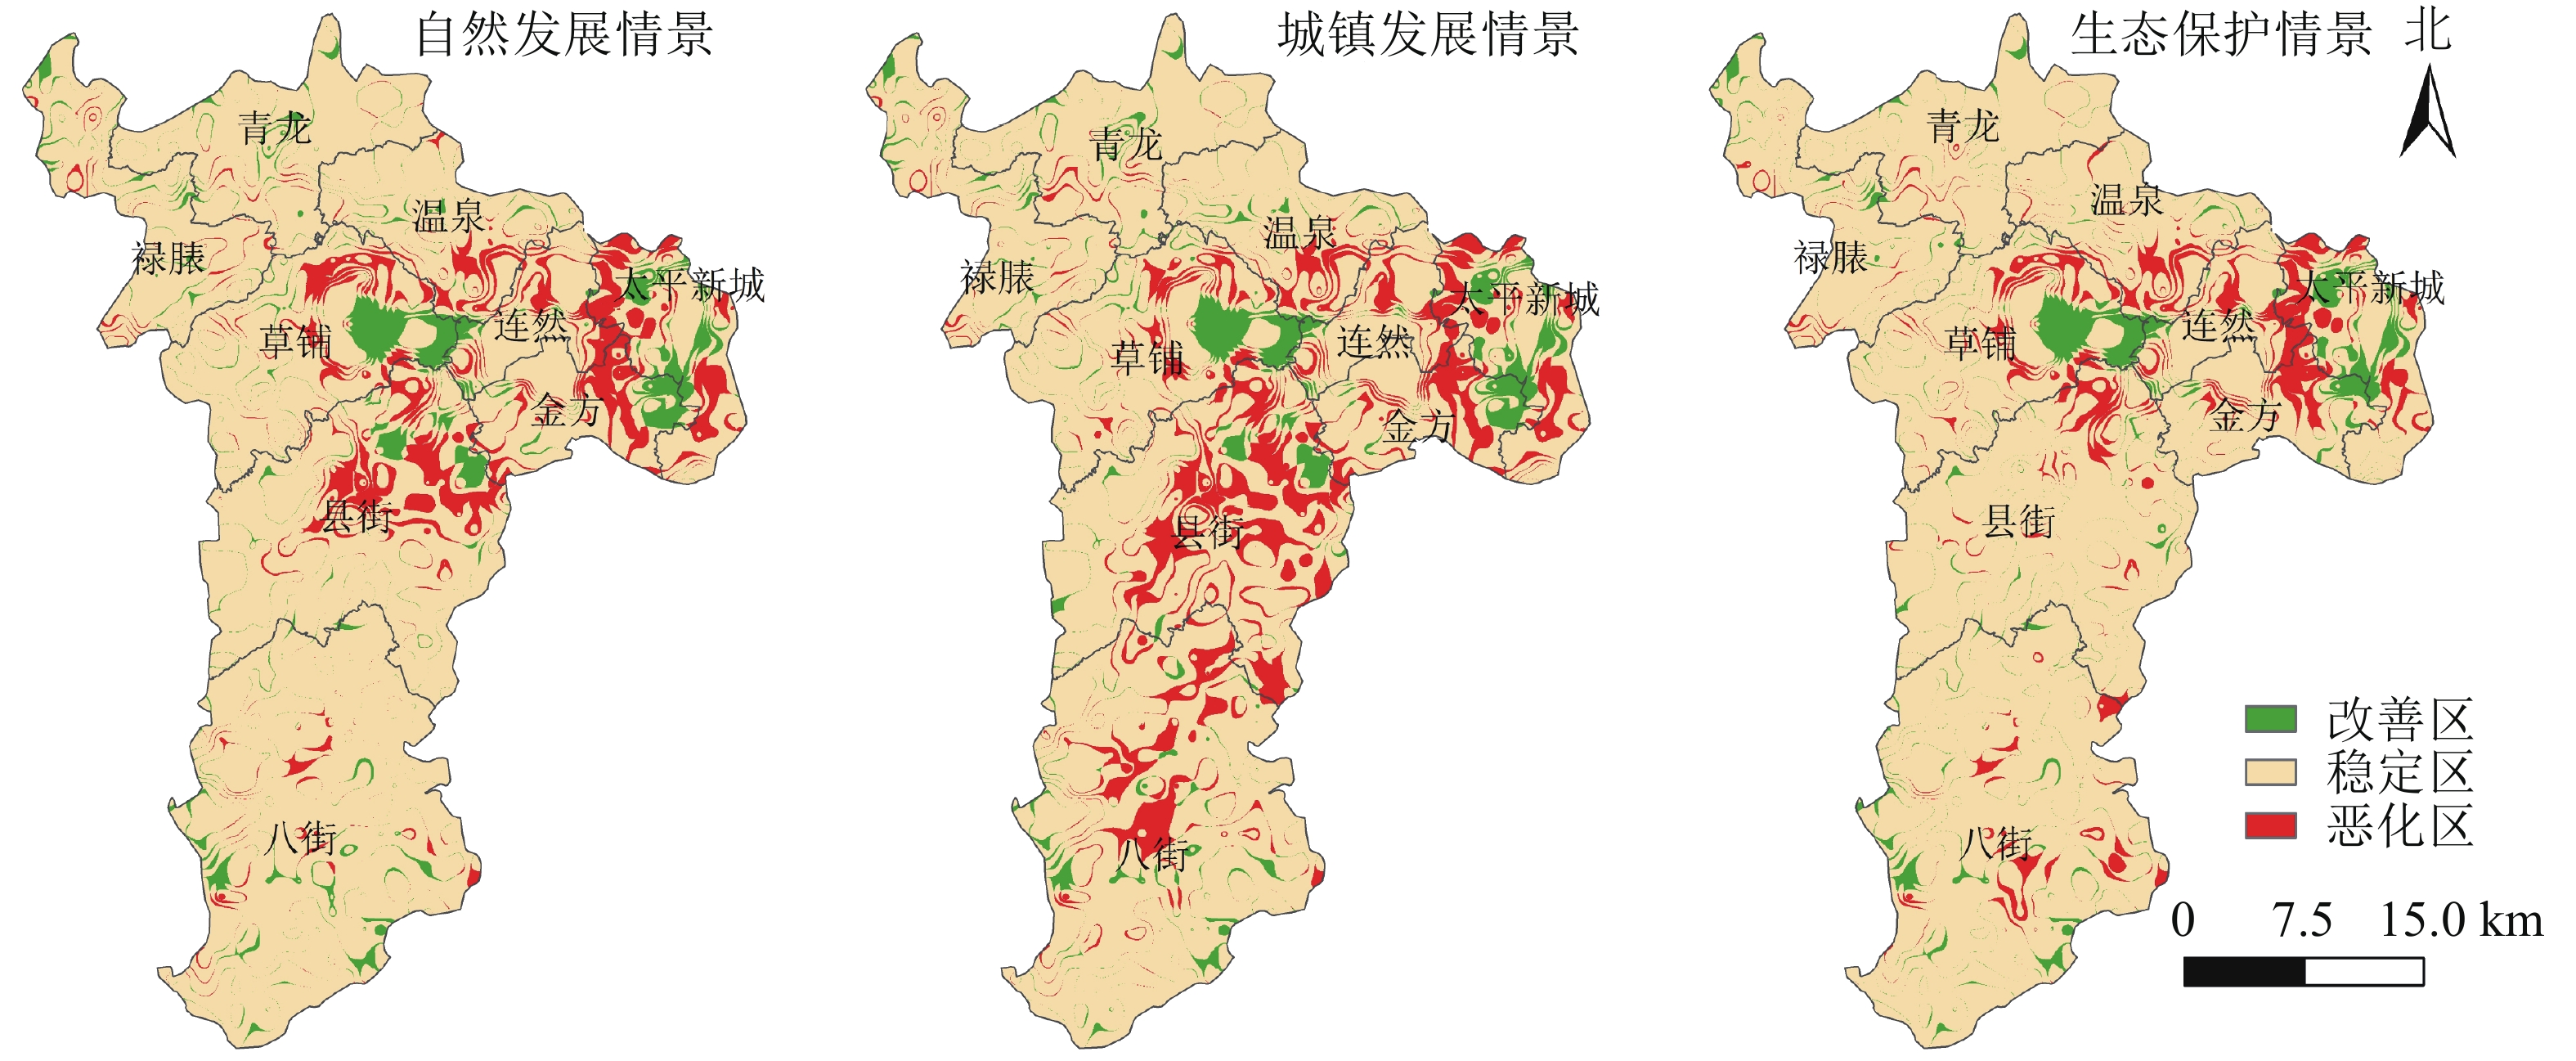
      利用ArcGIS空间分析中的栅格计算器进行图层运算,将生态风险等级降低的区域命名为改善区,生态风险等级提升的区域命名为恶化区,生态风险等级未发生改变的区域命名为稳定区,得到安宁市景观生态风险变化图(图5)。3种情景下,景观生态风险改善区空间分布类似,主要分布在草铺、太平新城、县街、八街街道,零散分散于其他街道。不同情景下恶化区空间分布差异较为显著,城镇发展情景下恶化区面积明显高于其他情景,主要分布于连然、温泉、草铺、县街及八街街道;生态保护情景下恶化区有明显约束,八街街道的恶化区明显少于城镇发展情景,县街街道的恶化区明显少于城镇发展情景和自然发展情景。综合来看,人类活动显著影响未来景观生态风险的变化,在城镇合理发展的同时,对城镇建设用地发展进行管控,对生态保护区有效保护,能显著改善景观生态风险。生态保护情景充分考虑了城镇经济建设与生态环境保护协同发展,有利于形成有序的国土资源空间管控局面,更符合安宁市未来生态安全格局的发展。

      Figure 5.  Change of landscape ecological risks under different scenarios in Anning, 2020−2030

    • 本研究通过景观生态风险评价模型分析安宁市2000—2020年景观生态风险时空演变特征,并采用PLUS模型对2030年不同情境下安宁市景观生态风险空间分布特征和变化趋势进行模拟预测,结果表明:①安宁市景观类型以林地、耕地和草地为主,人造地表面积呈上升趋势,耕地、灌木地、草地、水域面积总体呈下降趋势,林地面积相对较为稳定。其中,人造地表面积变化最为显著,主要以耕地、灌木地、草地转移入为主。城镇化进程中以人造地表景观扩张为主,并由此产生山水林田湖草等生态景观面积减少,生态系统稳定性减弱。②2000—2020年,安宁市景观生态风险值空间集聚状态明显,但聚集程度呈下降趋势。景观生态风险等级以中等生态风险区、较高生态风险区为主,低、较低生态风险区面积持续增加,高、较高生态风险区面积持续减少,生态环境状况整体向好;高生态风险区主要分布于各城镇扩展的边缘地带;生态风险的空间分布规律与安宁市人类活动干预强度的空间分布规律密切相关,应重点关注城镇用地扩张所导致的景观类型结构及其生态风险的动态变化。③2030年安宁市3种情景下各景观类型呈现不同程度的变化,景观生态风险空间分布特征与2020年相似,但高生态风险区和低生态风险区面积均有上升。3种情景中,生态保护情景下的高生态风险区面积最小、低生态风险区面积最大、恶化区最少。该情景约束了人造地表的扩张,保护了水域等生态用地,减缓了城镇边缘地区景观破碎度、分离度的升高;使新增人造地表空间结构的整合性增强,提高了景观的稳定性。

    • 安宁市是云南省转型升级样板区、滇中绿色发展示范区。研究期间安宁市景观生态风险等级整体呈下降趋势,表明全国长期坚持生态文明建设和云南省打造世界一流的“绿色能源”“绿色食品”“健康生活目的地”3张牌取得了一定的成效,为城镇生态安全格局的改善提供了良好的条件。中小城镇发展转型过程中,城镇的快速扩张显著影响景观生态风险的演变。不同情境下2030年安宁市景观生态风险空间分布和变化趋势预测模拟中高生态风险区均有明显上升,恶化区多为城镇扩张的边缘区域,控制人造地表对耕地、林地、灌木地的侵占是防控景观生态风险的重要环节。结合研究区现状和未来不同情境下模拟的景观生态风险评价结果,重视城镇在经济转型快速发展过程中不同土地利用格局结构和功能对生态风险区变化的影响,安宁市生态风险防范和生态环境治理提出以下建议:①针对高和较高生态风险区,一方面要做好城镇国土空间规划,严格管控城镇开发边界、永久基本农田保护和生态保护红线,科学布局城镇空间、农业空间和生态空间,按照集约适度、绿色发展的要求有序扩张城镇用地,加强对城镇扩张而导致的边缘区域耕地、林地、灌木地的破碎化的整体性保护与修复。另一方面,协调好工业发展、城镇发展与生态环境之间的关系, 坚持安宁市工业总体规划中工业“点—轴—组团”的空间结构,集约利用工业用地;同时开展各工业区、城市区之间的生态隔离区、生态协调区和生态保护区建设,做好各分区景观生态系统综合整治和自然修复。②针对中等生态风险区,加强区域土地整理,增加林草覆被,减少景观破碎程度,加强生态系统稳定性。特别是农业用地的土地整理,协调耕地与生态景观和城镇景观之间的关系,构建“山水林田湖草”一体化生态保护修复新格局,加快“三产”融合,持续推进高原特色农业发展,力争使中等生态风险区转变为低、较低生态风险区。③针对低和较低生态风险区,避免在城镇开发建设中对林地、人造地表景观整体性的破坏,通过合理调整城镇总体规划,在保持现有良好自然环境的基础上,打造由生态背景、开敞空间体系和人文景观构成的多功能景观系统。以林地为主的低、较低生态风险区不仅应该严格管控林地的开发,改善林地的树种结构和林地质量,而且需严防森林火灾,防控由森林火灾引起的景观生态系统的扰动。④未来城镇发展情境选择一方面应考虑城镇发展阶段和未来城镇管控的重点布局,另一方面应综合分析多种情景模式下研究区生态安全格局优化,协调生态保护与经济发展之间的关系,才能在生态环境保护的基础上实现高质量的发展。不同情境对比下,基于生态保护情景的安宁市景观生态风险空间分布特征和变化趋势更接近生态安全格局优化方案,更符合安宁市转型升级样板区、滇中绿色发展示范区定位及绿色可持续发展理念。

Reference (30)

Catalog

    /

    DownLoad:  Full-Size Img  PowerPoint
    Return
    Return