Volume 41 Issue 1
Feb.  2024
Turn off MathJax
Article Contents

DING Jinhua, SUN Qi. Multi-scenario simulation and prediction of blue-green spatial pattern in the southern Jiangsu water network area[J]. Journal of Zhejiang A&F University, 2024, 41(1): 202-210. doi: 10.11833/j.issn.2095-0756.20220741
Citation: DING Jinhua, SUN Qi. Multi-scenario simulation and prediction of blue-green spatial pattern in the southern Jiangsu water network area[J]. Journal of Zhejiang A&F University, 2024, 41(1): 202-210. doi: 10.11833/j.issn.2095-0756.20220741

Multi-scenario simulation and prediction of blue-green spatial pattern in the southern Jiangsu water network area

doi: 10.11833/j.issn.2095-0756.20220741
  • Received Date: 2022-12-01
  • Accepted Date: 2023-11-13
  • Rev Recd Date: 2023-10-27
  • Available Online: 2024-01-19
  • Publish Date: 2024-02-20
  •   Objective  The objective is to simulate and predict the multi-scenario development trend of the blue-green spatial pattern in the southern Jiangsu water network area, and explore scenario plans to promote sustainable development in the region.  Method  Taking the southern Wujiang District of Suzhou City, Jiangsu Province as sampling area, three scenarios were set up: natural development, ecological protection priority, and urban development priority. Based on CA-Markov model, a multi-scenario simulation analysis was conducted to simulate and analyze the changing trend of the blue-green spatial pattern in 2030. Morphological spatial pattern analysis (MSPA) and landscape connectivity evaluation were used to interpret the ecological structure and characteristics of the blue-green spatial landscape.   Result  There were significant differences in the scale and pattern of the blue-green space under different development scenarios. Under the priority scenario of natural development and urban development, the area of the blue-green space showed an accelerated reduction trend, with a reduction of 3 626.37 and 7 145.74 hm2 respectively. The shape types of the core area and pore of the blue-green space changed sharply in the negative direction, resulting in an increase in fragmentation and a decrease in connectivity in the blue-green space. Compared with the priority scenarios of natural development and urban development, the priority scenario of ecological protection increased the area of the blue-green space by 2 904.30 and 6 423.67 hm2, and the core area of the blue-green space and other morphological types increased significantly, with a significant reduction in porosity, a reduction in the fragmentation of the blue-green space, and an increase in connectivity.  Conclusion  The priority scenarios of natural development and urban development have a negative impact on the blue-green space in the water network area, and the priority scenario of ecological protection has a significant effect on maintaining the stability of the area and pattern of the blue-green space and improving its connectivity. [Ch, 4 fig. 4 tab. 23 ref.]
  • [1] WU Genghong, WANG Yiru, LIU Tiedong, GONG Wenfeng, LIN Shiping, CHEN Chong.  Evaluation of landscape pattern evolution and spatial configuration of urban park green space in Haikou City based on SEDMs model . Journal of Zhejiang A&F University, 2023, 40(5): 1093-1101. doi: 10.11833/j.issn.2095-0756.20220702
    [2] WANG Hui, LIU Yuan, SHI Yan, DING Zhifan, JIANG Hongchao.  Scenario simulation and prediction of Qinhu National Wetland Park based on PLUS Model . Journal of Zhejiang A&F University, 2023, 40(6): 1311-1321. doi: 10.11833/j.issn.2095-0756.20230163
    [3] WANG Xinyu, DUAN Yanbo, GONG Man, TIAN Guohang.  Coupling analysis and simulation optimization of constructing space and green space in Luohe City . Journal of Zhejiang A&F University, 2022, 39(1): 95-104. doi: 10.11833/j.issn.2095-0756.20210105
    [4] ZHU Ying, GU Chunwang, LI Xin, ZHOU Tingting, FENG Yuqing.  Evaluation of wetland ecological security in Wujiang District of Suzhou based on DPSIRM model . Journal of Zhejiang A&F University, 2022, 39(5): 1114-1123. doi: 10.11833/j.issn.2095-0756.20210758
    [5] LI Chen, GAO Binpin, WU Yingmei, ZHENG Kejun, WU Yan.  Dynamic simulation of landscape ecological risk in mountain towns based on PLUS model . Journal of Zhejiang A&F University, 2022, 39(1): 84-94. doi: 10.11833/j.issn.2095-0756.20210237
    [6] LI Wenhao, SHEN Jun.  Spatio-temporal variation of farmland fragmentation in water net plain area . Journal of Zhejiang A&F University, 2021, 38(4): 723-729. doi: 10.11833/j.issn.2095-0756.20200682
    [7] ZHAO Chenxiao, LIU Chunhui, WEI Jiaxing.  Green infrastructure network construction method for mitigating urban heat island effect in Nanjing . Journal of Zhejiang A&F University, 2021, 38(6): 1127-1135. doi: 10.11833/j.issn.2095-0756.20200816
    [8] WEI Xiao, HAO Riming, ZHANG Mingjuan, SHEN Haotian, QIU Yi, GENG Hongkai.  Microclimate changes with simulated canopy spatial structures . Journal of Zhejiang A&F University, 2019, 36(4): 783-792. doi: 10.11833/j.issn.2095-0756.2019.04.019
    [9] XIE Mingming, GUO Sujuan, SONG Ying, ZHANG Li, SUN Huijuan.  Spatial distribution and seasonal dynamics of fine roots of Castanea mollissima . Journal of Zhejiang A&F University, 2018, 35(1): 60-67. doi: 10.11833/j.issn.2095-0756.2018.01.008
    [10] TANG Sijia, TANG Mengping, ZHAO Saisai, DU Xiufang, SHEN Qianyong, PANG Chunmei.  Competitive spatial patterns for Moso bamboo on Mount Tianmu . Journal of Zhejiang A&F University, 2018, 35(2): 199-208. doi: 10.11833/j.issn.2095-0756.2018.02.002
    [11] WANG Yang, LENG Yanzhi, SU Changjiang, SONG Congwen, CHENG Dehua, CAO Yingnan, ZHANG Min, FU Cuilin.  Spatial structure and distribution pattern of natural Toona ciliata populations in the Enshi Region . Journal of Zhejiang A&F University, 2016, 33(1): 17-25. doi: 10.11833/j.issn.2095-0756.2016.01.003
    [12] YUAN Zhenhua, ZHANG Maozhen, GUO Hanru, QIN Lihou.  A spatial co-simulation based forest carbon estimation for Kaihua County . Journal of Zhejiang A&F University, 2016, 33(3): 384-393. doi: 10.11833/j.issn.2095-0756.2016.03.003
    [13] GUO Hui-hui, JIANG Wen-wei, MEI Yan-xia.  Landscape pattern analysis of Yinzhou new city zone based on high spatial resolution aerial photos . Journal of Zhejiang A&F University, 2012, 29(3): 344-351. doi: 10.11833/j.issn.2095-0756.2012.03.005
    [14] YANG Zi-qing, CHEN Ping-liu, LIU Jian, YU Kun-yong, LIAO Xiao-li, YOU Hao-chen, GONG Cong-hong.  Spatio-temporal variation of distribution patterns in Cunninghamia lanceolata plantations . Journal of Zhejiang A&F University, 2012, 29(3): 374-382. doi: 10.11833/j.issn.2095-0756.2012.03.008
    [15] WANG Yu-lan, LIU Ai-hua, ZHANG Jing-wen, ZHAO Bian-jian, YUE Zhao-yang, ZHANG Xin-ping, TANG Li.  Coincidence level in spatial distribution of Eulecanium gigantea and Blastothrix sericae . Journal of Zhejiang A&F University, 2012, 29(5): 799-802. doi: 10.11833/j.issn.2095-0756.2012.05.026
    [16] XI Ben-ye, JIA Li-ming, LIU Yin, WANG Ye.  Spatial distribution and simulation for fine roots of triploid Populus tomentosa with wide and narrow row spacing . Journal of Zhejiang A&F University, 2010, 27(2): 259-265. doi: 10.11833/j.issn.2095-0756.2010.02.016
    [17] WANG Hang-jun, FANG Lu-ming, ZHANG Guang-qun.  Spatial data structure in spatial analysis . Journal of Zhejiang A&F University, 2007, 24(3): 363-368.
    [18] FU Xiao-ping, TIAN Da-lun, HUANG Zhi-yong.  模拟酸雨对植物形态学效应的影响 . Journal of Zhejiang A&F University, 2006, 23(5): 521-526.
    [19] ZHU Xi, WANG Mei-rong, HAN Hong.  Comparative morphology study of the skeletons of three species of egrets . Journal of Zhejiang A&F University, 2003, 20(3): 240-244.
    [20] ZHANG Fei-ping, CAI Qiu-jing, LU Feng-mei, DONG Xi-ming, HUANG Chang-wen, ZHONG Jing-hui.  Spatial pattern and time series dynamics in the population of Aponychus corpuzae . Journal of Zhejiang A&F University, 2001, 18(2): 169-172.
  • [1]
    YANG Chaobin, ZHANG Ting, HU Changtao, et al. Spatial-temporal characteristics of the cooling island for blue-green space and its driving factors in Suzhou, China [J]. Resources and Environment in the Yangtze Basin, 2021, 30(3): 677 − 688.
    [2]
    ZHANG Yuepeng, CHANG Qing, GUO Xudong. Management-oriented ecological land's conception and multi-dimensional classification system in China [J]. Acta Ecologica Sinica, 2016, 36(12): 3655 − 3665.
    [3]
    ZHI Linjiao, WANG Jin, LIU Min, et al. Multiscale dynamic change of green spatial pattern of urban agglomeration in central Yunnan [J]. Journal of Southwest Forestry University, 2021, 41(5): 88 − 97.
    [4]
    CUI Jie, XU Hao, LIU Wei. Analysis on the evolution of blue-green spatial landscape pattern in Xuzhou metropolitan area in the past 20 years [J]. Landscape Architecture Academic Journal, 2022, 39(7): 75 − 81.
    [5]
    XU Hao, JIN Ting, LIU Wei. Study on the scale and landscape pattern evolution characteristics of blue-green space in Suzhou-Wuxi-Changzhou metropolitan area, China [J]. Journal of Nanjing Forestry University (Natural Sciences Edition), 2022, 46(1): 219 − 226.
    [6]
    IOJĂ I, OSACI-COSTACHE G, BREUSTE J, et al. Integrating urban blue and green areas based on historical evidence [J]. Urban Forestry &Urban Greening, 2018, 34: 217 − 225.
    [7]
    CAO Jing. Construction strategy of urban and rural blue-green space on one blueprint: a case study of Jieshou in Anhui Province [J]. Planners, 2021, 37(9): 26 − 32.
    [8]
    WU Yan, HE Xusheng, YANG Ling. Compilation conception of city and county level blue-green space system specialized planning under national territory spatial planning system [J]. Landscape Architecture, 2020, 27(1): 30 − 34.
    [9]
    CRUZ J A, BLANCO A C, GARCIA J J, et al. Evaluation of the cooling effect of green and blue spaces on urban microclimate through numerical simulation: a case study of Iloilo River Esplanade, Philippines [J]. Sustainable Cities and Society, 2021, 74: 103 − 184.
    [10]
    FINLAY J, FRANKE T, MCKAY H, et al. Therapeutic landscapes and wellbeing in later life: impacts of blue and green spaces for older adults [J]. Health &Place, 2015, 34: 97 − 106.
    [11]
    TRIGUERO-MAS M, DONAIRE-GONZALEZ D, SETO E, et al. Natural outdoor environments and mental health: stress as a possible mechanism [J]. Environmental Research, 2017, 159: 629 − 638.
    [12]
    WATERS D P. von Neumann’s theory of self-reproducing automata: a useful framework for biosemiotics? [J]. Biosemiotics, 2012, 5: 5 − 15.
    [13]
    GUAN Dongjie, LI Haifeng, INOHAE T, et al. Modeling urban land use change by the integration of cellular automaton and Markov model [J]. Ecological Modelling, 2011, 222: 3761 − 3772.
    [14]
    GAO Xing, YANG Liuwanqing, LI Chenxi, et al. Land use change and ecosystem service value measurement in Baiyangdian Basin under the simulated multiple scenarios [J]. Acta Ecologica Sinica, 2021, 41(20): 7974 − 7988.
    [15]
    LIN Hongyu, QIAN Jing, YAN Lijiao, et al. Analysis of spatial-temporal pattern and scenario simulation of green infrastructure in Wuyi County based on morphological spatial pattern analysis and CA-Markov model [J]. Acta Agriculturae Zhejiangensis, 2019, 31(7): 1193 − 1204.
    [16]
    WANG Hui, LIU Yuan, SHI Yan, et al. Scenario simulation and prediction of Qinhu National Wetland Park based on PLUS Model [J]. Journal of Zhejiang A&F University, 2023, 40(6): 1311 − 1321.
    [17]
    YANG Qingke, DUAN Xuejun, JIN Zhifeng, et al. Spatial scenario simulation and landscape ecological effect based on construction land expansion of Nantong City [J]. Scientia Georgaphica Sinica, 2017, 37(4): 528 − 536.
    [18]
    LI Kongming, LI Chunlin, CAO Jianjun, et al. Spatiotemporal evolution characteristics of urban green infrastructure in central Liaoning urban agglomeration during the past 20 years based on landscape ecology and morphology [J]. Acta Ecologica Sinica, 2021, 41(21): 8408 − 8420.
    [19]
    CHEN Liding, FU Bojie. The ecological significance and application of landscape connectivity [J]. Chinese Journal of Ecology, 1996, 15(4): 37 − 42, 73.
    [20]
    XIE Jing, LI Wen, JIA Jia, et al. Construction and optimization of ecological network in the main urban area of Qiqihar City [J]. Research of Soil and Water Conservation, 2021, 28(6): 308 − 315.
    [21]
    CHEN Dechao, SHI Zhukai, WANG Zujing, et al. Ecological network construction and spatial conflict identification around Taihu Lake Area in Suzhou City [J]. Journal of Ecology and Rural Environment, 2020, 36(6): 778 − 787.
    [22]
    LI Guoyu, LIN Liqun, WU Shidai, et al. Recognition of ecological source and ecological security pattern construction: a case study of Fuqing City [J]. Areal Research and Development, 2018, 37(3): 120 − 125.
    [23]
    MENG Jijun, WANG Ya, WANG Xiaodong, et al. Construction of landscape ecological security pattern in Guiyang based on MCR model [J]. Resources and Environment in the Yangtza Basin, 2016, 25(7): 1052 − 1061.
  • 加载中
通讯作者: 陈斌, bchen63@163.com
  • 1. 

    沈阳化工大学材料科学与工程学院 沈阳 110142

  1. 本站搜索
  2. 百度学术搜索
  3. 万方数据库搜索
  4. CNKI搜索

Figures(4)  / Tables(4)

Article views(114) PDF downloads(9) Cited by()

Related
Proportional views

Multi-scenario simulation and prediction of blue-green spatial pattern in the southern Jiangsu water network area

doi: 10.11833/j.issn.2095-0756.20220741

Abstract:   Objective  The objective is to simulate and predict the multi-scenario development trend of the blue-green spatial pattern in the southern Jiangsu water network area, and explore scenario plans to promote sustainable development in the region.  Method  Taking the southern Wujiang District of Suzhou City, Jiangsu Province as sampling area, three scenarios were set up: natural development, ecological protection priority, and urban development priority. Based on CA-Markov model, a multi-scenario simulation analysis was conducted to simulate and analyze the changing trend of the blue-green spatial pattern in 2030. Morphological spatial pattern analysis (MSPA) and landscape connectivity evaluation were used to interpret the ecological structure and characteristics of the blue-green spatial landscape.   Result  There were significant differences in the scale and pattern of the blue-green space under different development scenarios. Under the priority scenario of natural development and urban development, the area of the blue-green space showed an accelerated reduction trend, with a reduction of 3 626.37 and 7 145.74 hm2 respectively. The shape types of the core area and pore of the blue-green space changed sharply in the negative direction, resulting in an increase in fragmentation and a decrease in connectivity in the blue-green space. Compared with the priority scenarios of natural development and urban development, the priority scenario of ecological protection increased the area of the blue-green space by 2 904.30 and 6 423.67 hm2, and the core area of the blue-green space and other morphological types increased significantly, with a significant reduction in porosity, a reduction in the fragmentation of the blue-green space, and an increase in connectivity.  Conclusion  The priority scenarios of natural development and urban development have a negative impact on the blue-green space in the water network area, and the priority scenario of ecological protection has a significant effect on maintaining the stability of the area and pattern of the blue-green space and improving its connectivity. [Ch, 4 fig. 4 tab. 23 ref.]

DING Jinhua, SUN Qi. Multi-scenario simulation and prediction of blue-green spatial pattern in the southern Jiangsu water network area[J]. Journal of Zhejiang A&F University, 2024, 41(1): 202-210. doi: 10.11833/j.issn.2095-0756.20220741
Citation: DING Jinhua, SUN Qi. Multi-scenario simulation and prediction of blue-green spatial pattern in the southern Jiangsu water network area[J]. Journal of Zhejiang A&F University, 2024, 41(1): 202-210. doi: 10.11833/j.issn.2095-0756.20220741
  • 新型城镇化建设的推进为苏南水网地区城乡建设带来了经济的快速发展,但同时也给区域生态环境保护带来压力,蓝绿交织的水网地域特色景观正面临逐渐消失的危机。蓝绿空间是水网地区自然生态空间的重要组成部分,也是水网地区地域特色景观的载体[1]。水网地区的耕地以水田为主,具有涵养水源、调蓄雨洪的生态功能[2],与林地、草地等共同构成绿色空间。蓝色空间则指河流、湖泊、湿地和坑塘等共同构成的水域空间[3]。目前,国内外学者对于蓝绿空间的研究多集中于景观格局演变[45]、空间营建与调控[68]、冷岛效应[9]以及健康服务功能评价[1011]等方面,研究区域多集中于城市群区域或城市市域范围,对具有水网地域特征的城镇地区蓝绿空间格局的研究相对较少。

    苏南水网地区属于太湖流域,具有得天独厚的地理条件,形成了水绿共生的整体格局。快速城镇化在促进苏南水网地区社会经济高速发展的同时,量大面广的居住区、工业园区等人工开发建设活动对蓝绿空间的干扰程度日趋增强。据Landsat 8影像数据统计,2000—2022年,苏州市吴江区建设用地面积由14653.57 hm2增加至31008.33 hm2,而蓝绿空间面积由107543.79 hm2减少至91790.00 hm2。建设用地不断扩张使得蓝绿空间面临着面积下降、景观格局破碎、生态效益减弱等问题,水网地区的可持续发展受到冲击。模拟预测蓝绿空间未来发展格局,分析蓝绿空间格局未来发展趋势,总结蓝绿空间格局未来演变特征,是保护和恢复水网地区生态环境,促进苏南水网地区城乡可持续发展的关键。

    本研究以具有典型苏南水网特征的苏州市吴江地区为代表,在总结2000—2020年蓝绿空间格局演变规律的基础上,借助CA-Markov模型,模拟2030年吴江南片区蓝绿空间土地利用多情景发展状态,并对多情景发展的蓝绿空间演变进行定量分析,结合形态学空间格局分析(MSPA)和景观连通性评价科学解读蓝绿空间景观生态结构与生态格局特征,为水网地区蓝绿空间的保护提供理论帮助与数据支持,以期促进水网地区城乡可持续发展。

    • 吴江南片区隶属于江苏省苏州市吴江区,地处江苏省东南部,位于31°02′~31°13′N,120°51′~120°42′E,包括了横扇街道、平望镇、七都镇、震泽镇、盛泽镇和桃源镇,面积约606.1 km2。该片区自然环境条件优越,地势平坦,属于典型的水网平原,耕地、林地、河流和湖泊资源丰富,形成了水网地区蓝绿交错的独特格局。但在快速城镇化建设过程中,吴江区蓝绿空间面临着面积缩减,功能脆弱,空间破碎化等问题。

    • ①2000、2010、2020年吴江区遥感影像从地理空间数据云平台Landsat 8卫星获取,分辨率均为30 m。以此为基础数据,结合研究区实地调查结果,使用ENVI 5.3对遥感影像进行监督分类和人工目视解译,根据GB/T 21010—2017《土地利用现状分类》的分类依据和标准,将土地利用类型划分为耕地、林地、草地、水域和建设用地等5类,经检验3期图像精度均达到85%以上。②行政区划边界数据来源于最新发布的吴江区行政区划图,通过地图数字化处理得到行政区划边界矢量数据。③研究区数字高程(DEM)数据为30 m分辨率的ASTER GDEMV 3数据,来源于中国科学院地理空间数据云(http://www.gscloud.cn/),坡度数据由DEM高程数据提取得到。④城镇居民点数据来源于国家统计局官方网站发布的统计用区划和城乡划分代码等相关信息,将其整理成格式化文本数据,通过地理编码等处理得到村镇居民点空间分布矢量点数据。

    • CA-Markov模型由Markov模型和离散动力学元胞自动机(cellular automata,CA)模型[1213]构成,能够基于土地利用转移概率矩阵与土地利用变化适宜性图集,模拟预测未来格局的演变趋势。本研究基于IDRISI 7.0中的CA-Markov模型,对吴江南片区的土地利用格局变化进行预测,将模拟得到的吴江南片区2020年土地利用类型图与实际情况进行比对,检验模型精度。在CA-Markov模型模拟可信度较高的情况下,以2020年吴江南片区土地利用图为基础年数据,分别选取3种情景下的转移概率和适宜性图集运行CA-Markov模型,得到2030年吴江南片区多情景土地利用模拟预测图像。

    • 多标准评价模型(multi-criteria evaluation,MCE)由约束条件和适宜因子2个部分组成,是土地利用多情景模拟转换规则的核心。本研究借鉴前人的研究结果[1416],并结合研究区实际情况和模拟效果,从自然因素和社会因素2个方面选择高程、坡度、距村镇居民点距离、距河流和湖泊距离及人均国内生产总值(GDP)共6类因子,作为制作适宜性图集的主要影响因子,约束条件则根据不同的发展情景进行分别设置。

    • 情景分析旨在描述和分析事物发展的各种可能性,对比不同发展路径下的状态,为科学规划决策提供依据[17]。本研究基于CA-Markov模型和MCE模型,综合考虑研究区不同情景的发展需求及转换规律,参照《苏州市国土空间总体规划(2021—2035)》《苏州市吴江区国土空间规划近期实施方案》《长江三角洲区域一体化发展规划纲要》等相关文件,设定吴江南片区3种土地利用变化模拟情景:①自然发展情景。自然发展情景是基于2010—2020年吴江南片区的土地利用变化趋势,按照目前的城镇化发展模式和土地利用转移速率,不对耕地、林地、草地和水域与建设用地间的相互转换进行限制,模拟自然发展情景下2030年吴江南片区蓝绿空间土地利用演变状况。②生态保护优先情景。生态保护优先情景是以推动生态文明建设为首要,结合苏南水网地区水网密布,蓝绿交织的地域特征,考虑将永久基本农田保护区和生态保护红线设置为限制转化区,对建设用地随意侵占耕地、林地、草地及水域实施管控,降低蓝绿空间向建设用地的转化速率。③城镇发展优先情景。该情景是以适应苏南水网地区的经济与城镇发展需求为前提,土地利用情景设置中的新增建设用地有可能会占用原有建设用地范围周边的部分耕地、林地、草地及水域。

    • 形态学空间格局分析(morphological spatial pattern analysis, MSPA)是一种图像处理方法,可以识别目标像元集与结构要素之间的空间拓扑关系,能够有效地确定景观的类型和结构[18]。本研究借助MSPA分析蓝绿空间格局的形态变化及演变趋势,基于3种模拟情景下得到的2030年吴江南片区土地利用类型图,结合当地实际情况,利用ArcGIS平台的重分类工具将生物多样性潜在力较好的耕地、林地、草地和水域分类为前景像元,建设用地作为背景像元,运用Guidos Toolbox软件的MSPA工具对数据进行腐蚀、膨胀等运算,得到3种模拟情景下2030年吴江南片区蓝绿空间景观组成类型及其占比。

    • 景观连接度是评价景观结构单元之间连续性的重要指标[19],也是度量水网乡村蓝绿空间连通性的关键指标,数值越高,越有利于蓝绿空间格局整体生态效益的发挥。可能连通性指数(PC)综合考虑了物种迁移能力和扩散概率,是现阶段较为成熟的评价指标[20]

      选取对本研究有重要意义的核心区景观要素,运用Conefor 2.6,参考相关文献[15, 2122]并结合本研究的研究尺度,设置斑块连通距离阈值为500 m,连通的概率根据实际情况设为0.5,对研究区的核心区进行景观连接度评价,筛选出3种模拟情景下景观连接度最大的9个斑块。按照连接重要性指数($ \mathrm{d}\mathrm{I} $)评价各核心区斑块在整体景观中的重要值,作为评判核心区景观连接度的指标,记作可能连通性重要值(dPC),反映斑块重要性[23]

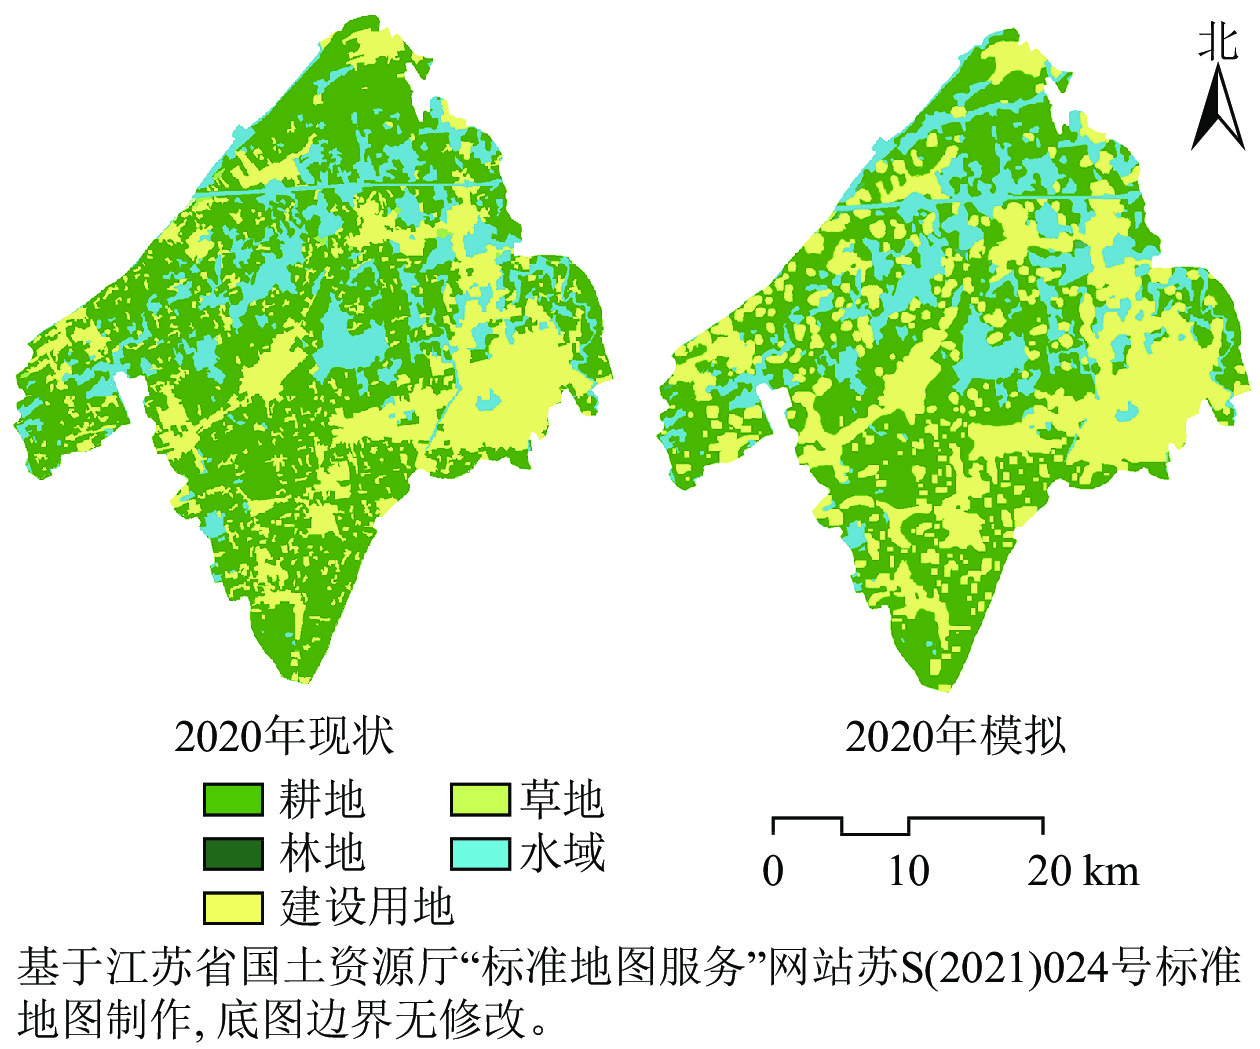
    • 利用2000、2010年的土地利用类型数据,获得2000—2010年土地利用类型的转移概率矩阵(表1)。以2010年的土地利用类型图作为基础年数据,以10 a为迭代周期,比例误差设为0.15,预测2020年吴江区南片区土地利用类型图(图1),与2020年实际土地利用分布图进行对比验证,得到Kappa值为0.886 2,表示模拟的可信度较高,可用来预测研究区后续土地利用变化情况。

      2000年土地利用类型2010年土地类型转移概率/%
      耕地林地草地水域建设用地
      耕地  63.740.030.024.5831.63
      林地  6.0268.850.1914.3010.64
      草地  0.010.7372.4226.830.01
      水域  13.930.050.0176.649.37
      建设用地19.950.060.014.2175.77

      Table 1.  Probability matrix of land use type transfer in southern Wujiang District from 2000 to 2010

      Figure 1.  Landuse status and simulation of southern Wujiang District in 2020

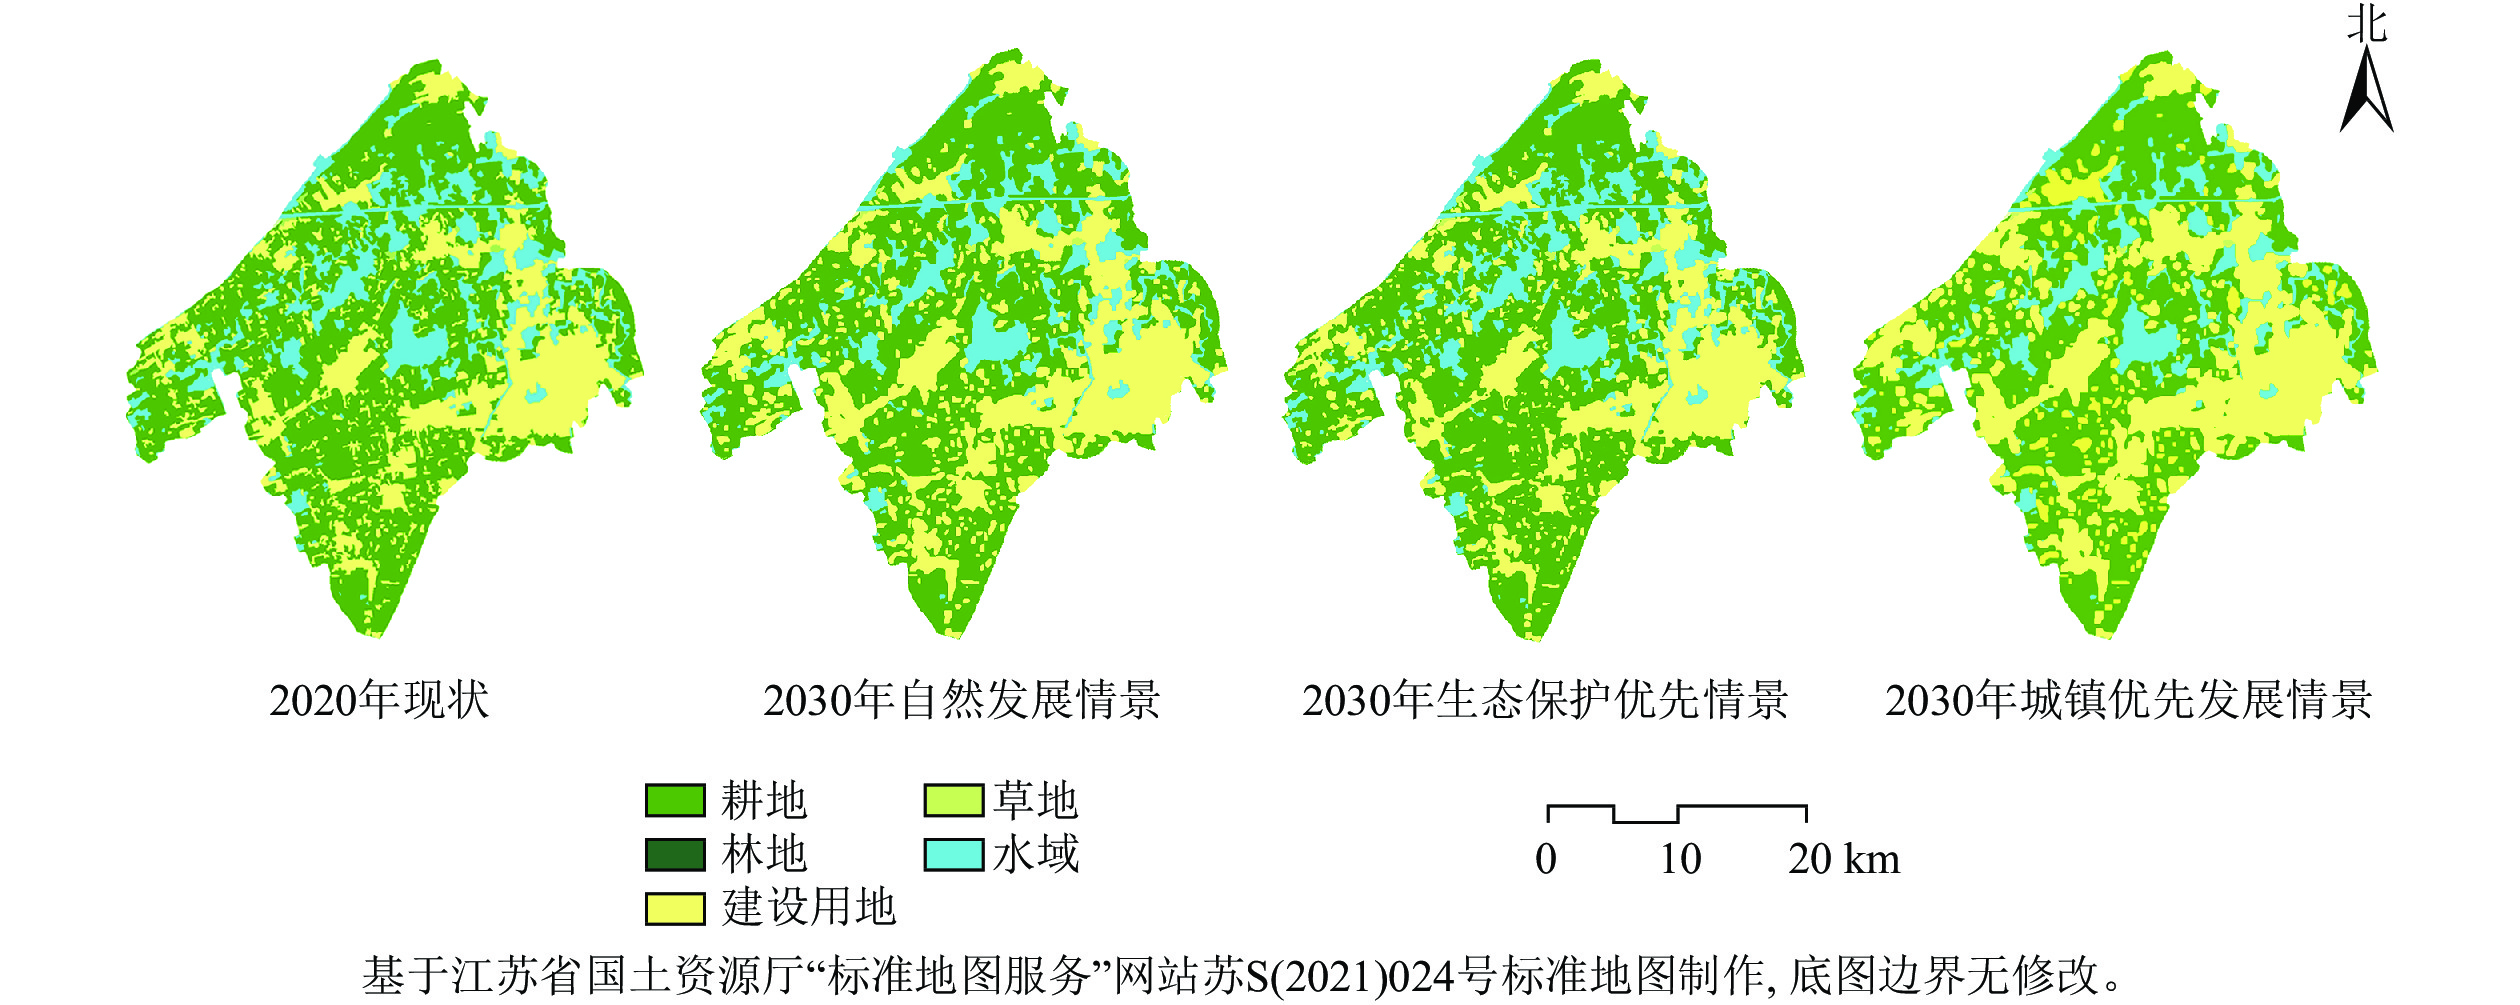
    • 以2020年吴江南片区土地利用空间分布图为基础数据,通过MCE模型,分析各类土地利用适宜性及吴江南片区2010—2020年的土地利用类型转移概率矩阵(表2),并限制不同情景下各类土地利用的约束条件,利用CA-Markov模型预测3种情景下2030年吴江南片区蓝绿空间土地利用的变化及各类土地利用的面积、比例(图2表3)。

      2010年土地利用类型2020年土地利用类型转移概率/%
      耕地林地草地水域建设用地
      耕地  65.130.010.013.4431.41
      林地  0.9075.780.1313.459.74
      草地  15.420.0184.550.010.01
      水域  13.370.010.0175.5711.04
      建设用地14.270.010.015.1380.58

      Table 2.  Probability matrix of land use type transfer in southern Wujiang District from 2010 to 2020

      Figure 2.  Landuse change of blue and green space in southern Wujiang District

      类型2020年现状2030年自然发展情景2030年生态保护优先情景2030年城镇发展优先情景
      面积/hm2占比/%面积/hm2占比/%面积/hm2占比/%面积/hm2占比/%
      耕地  33 837.0355.8431 826.7952.5233 058.3554.3628 946.7947.84
      林地  142.290.23129.780.21148.590.2430.410.05
      草地  19.440.0317.640.0322.140.0417.640.03
      水域  9 838.9816.248 237.1613.599 886.5916.267 697.1612.72
      建设用地16 763.2227.6620 390.7633.6517 693.1029.1023 810.5839.36

      Table 3.  Land use data of blue and green space in southern Wujiang District from 2020 to 2030

      图2表3可知:2020—2030年,3种发展情景下的耕地、林地、草地和水域的土地利用面积及占比变化差异较大。①自然发展情景下,耕地、林地和水域面积随时间推移而缩减,分别减少了3.32%、0.02%和2.56%,建设用地面积持续增加,增幅约为5.99%,基本延续过去10 a吴江南片区土地利用的发展规律。②生态保护优先情景下,基于生态文明建设的需求,限制了耕地、林地和水域等向建设用地的无序转化,蓝绿空间土地利用相对稳定,耕地、林地、草地和水域的面积及占比有所增加。相对于自然发展情景,生态保护优先情景下耕地和水域增幅最为显著,分别为1.84%和2.67%,建设用地增幅减少,从3 627.54 hm2减少到929.88 hm2。③城镇优先发展情景下,蓝绿空间土地利用发生了较为剧烈的变化,相较于生态保护优先情景,城镇发展优先情景下耕地、林地面积减幅较大,其占比分别下降了6.59%、0.19%,水域面积减少了2 189.43 hm2,而建设用地面积显著增加,增幅达10.25%。
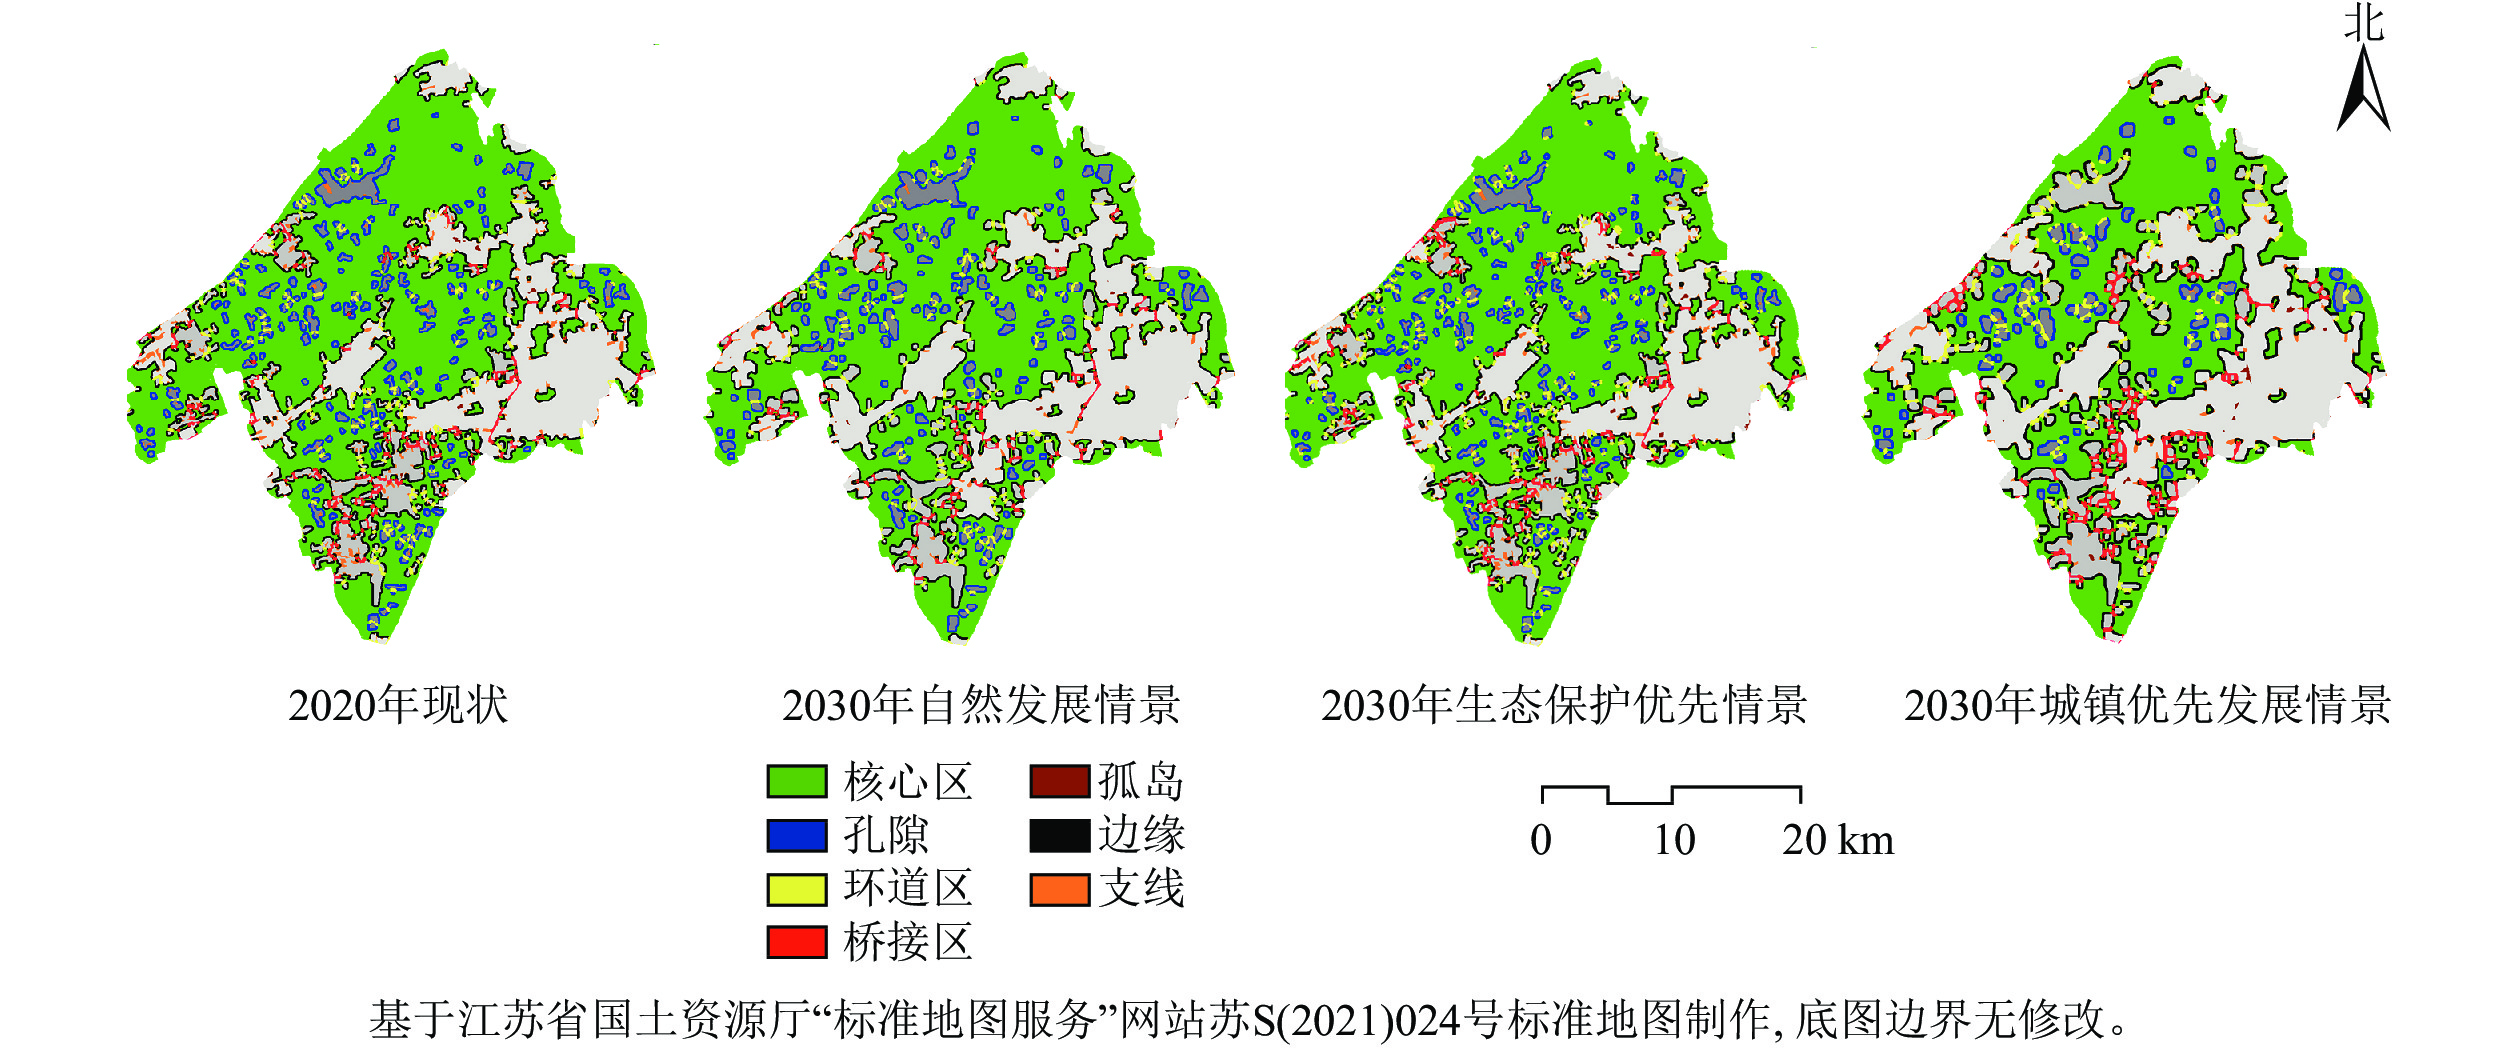
    • 表4图3可知:2020—2030年,①自然发展情景下的7类蓝绿空间景观要素基本延续前10 a的自然发展规律,核心区、边缘区等景观要素占比呈现出整体下降的趋势,孤岛下降率明显,孤岛面积从54.54 hm2减少至30.30 hm2,变化率为−44.44%。孤岛面积下降说明可供生物在吴江南片区蓝绿空间之间迁移的“踏脚石”数量正在减少。②生态保护优先情景下,蓝绿空间景观要素多呈现良好的发展态势,其中核心区的增幅最大,增长了490.87 hm2。核心区可作为蓝绿网络中的源地,在生物多样性保护方面发挥着重要作用,核心区面积的增加反映了吴江南片区蓝绿空间的生态功能有所增强。生态保护优先情景下的桥接区和环道区占比分别为0.38%和0.48%,较自然发展情景分别减少了0.21%和0.05%。桥接区是连通各核心区间的廊道,环道区是核心区内部的廊道,两者是物种迁移、能量流动的重要通道,桥接区、环道区数量的减少反映了吴江南片区蓝绿空间景观破碎化程度的改善。③城镇优先发展情景下,受建设用地沿分布区域向内外扩张的影响,蓝绿空间核心区面积大幅减小,核心区内部的孔隙面积持续增加。孔隙是蓝绿空间核心区内部的孔洞,孔隙面积增幅越大代表蓝绿空间核心区内部零散的建设用地越多,蓝绿空间的破碎化程度越高。城镇优先发展情景下孔隙占比较生态保护优先情景增长了2.77%,表明城镇优先发展情景下吴江南片区蓝绿空间正面临着外部面状、内部点状的生态破坏,对维持蓝绿空间景观格局稳定造成不利影响。

      类别2020年实际
      面积/hm2
      自然发展情景生态保护优先情景城镇优先发展情景
      2030年预测
      面积/hm2
      面积变化/
      hm2
      变化率/
      %
      2030年预测
      面积/hm2
      面积变化/
      hm2
      变化率/
      %
      2030年预测
      面积/hm2
      面积变化/
      hm2
      变化率/
      %
      核心区31 312.5129 258.13−2 054.37−6.5631 803.37490.871.5723 804.05−7 508.46−23.98
      孤岛 54.5430.30−24.24−44.4442.42−12.12−22.2296.9642.4277.78
      孔隙 4 005.723 508.79−496.93−12.412 817.94−1 187.18−29.654 496.59490.8712.25
      边缘区6 708.526 211.60−496.93−7.415 987.37−721.15−10.756 787.3178.781.17
      环道区351.49309.06−42.42−12.07290.88−60.60−17.24103.02−248.46−70.69
      桥接区454.51327.25−127.26−28.00230.28−224.22−49.33696.91242.4053.33
      支线 963.55569.65−393.91−40.88569.65−393.91−40.88612.07−351.49−36.48

      Table 4.  Changes of MSPA landscape types in the blue and green space of southern Wujiang District from 2020 to 2030

      Figure 3.  Analysis of morphological spatial pattern of blue and green space in southern Wujiang District
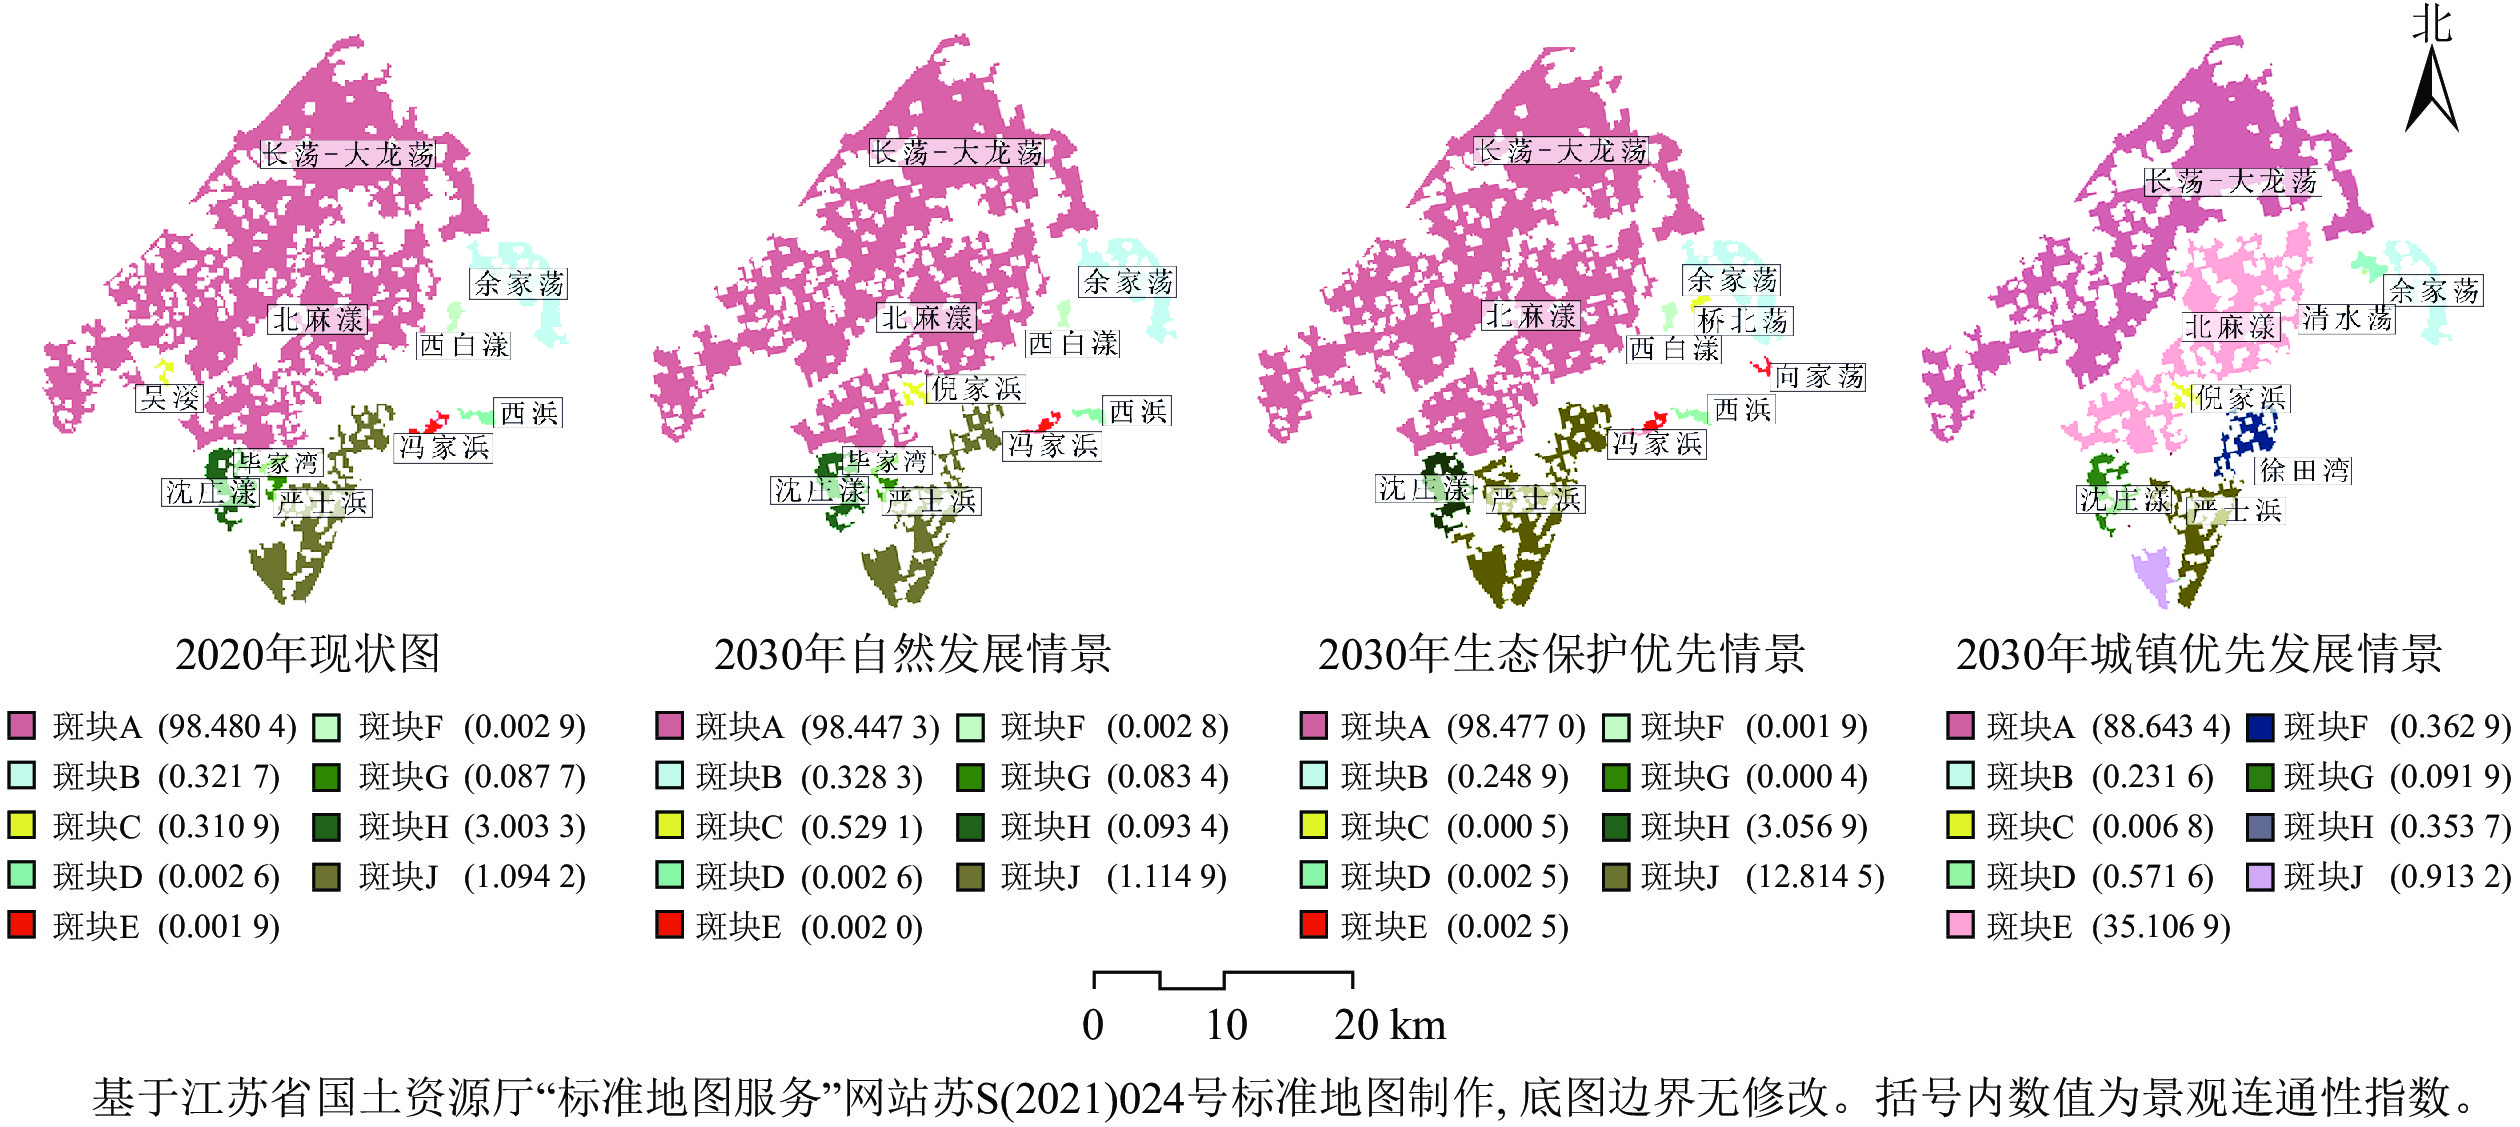
    • 图4可知:2020—2030年,①自然发展情景下,蓝绿空间整体景观连通性呈现略微下降的趋势。与2020年吴江南片区蓝绿空间景观连通性现状相比,毕家湾、沈庄漾区域景观连通性均有下降,可能连通性重要值分别下降了0.004 3、2.909 9。②生态保护优先情景下,蓝绿空间研究区核心区重要斑块数量较多、相对面积较大,且斑块较为集中,蓝绿空间连通性有所增强。相较于自然发展情景,沈庄漾和严士浜区域景观连通性增长较为显著,可能连通性重要值分别增加了2.963 5和11.699 6。③城镇发展优先情景下蓝绿空间受建设用地快速扩张的影响,连通性呈现出快速下降趋势,其中长荡—大龙荡、严士浜区域斑块所受影响较大。相对于生态保护优先情景,长荡—大龙荡区域斑块的可能连通性重要值从98.477 0下降至88.643 4,降幅约为9.98%。严士浜区域景观连通性受镇域内建设用地快速扩张的负面影响,同样呈现大幅下降趋势,可能连通性重要值由12.814 5下降至0.353 7,降幅约为97.24%。

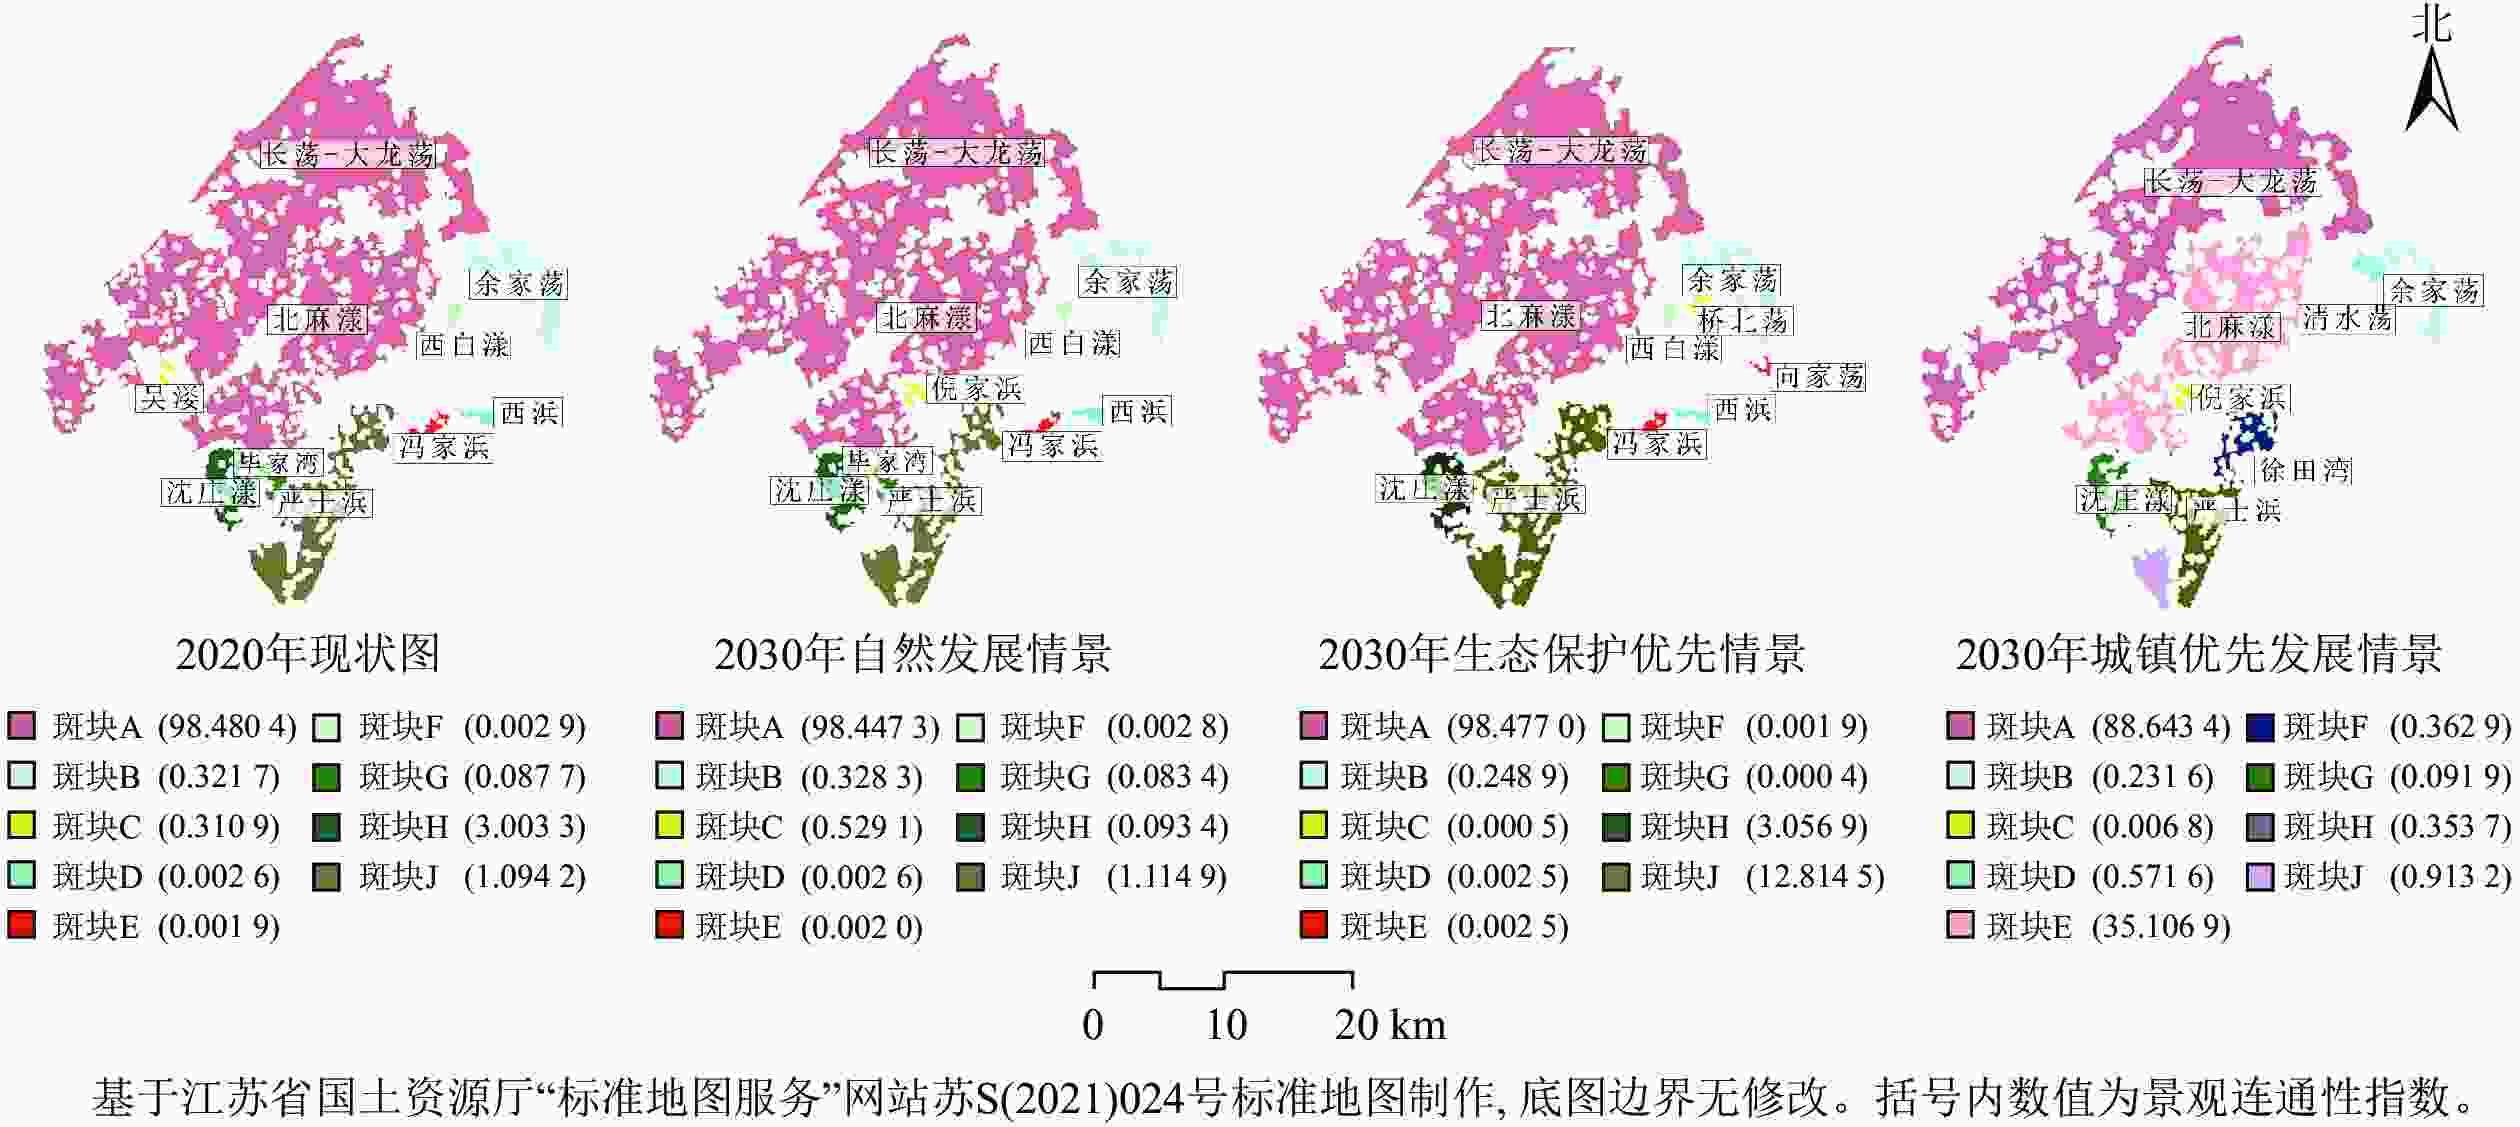
      Figure 4.  Change of landscape connectivity of blue and green space in the southern Wujiang District

    • 本研究基于苏州市吴江南片区2000、2010和2020年3期土地利用数据,通过参数调配设置CA-Markov模型,模拟自然发展情景、生态保护优先情景和城镇发展优先情景等3种情景下吴江南片区2030年蓝绿空间的发展趋势,并运用MSPA和景观连通性评价对比各情景模拟下的蓝绿空间格局。主要结论如下:①从多情景模拟下的蓝绿空间土地利用分析来看,自然发展情景下,耕地、林地、草地和水域面积均有不同程度减少,基本延续过去10 a吴江南片区土地利用的发展规律。在生态保护优先情景下,蓝绿空间用地面积呈现整体上升趋势,建设用地面积增速明显放缓,反映出生态优先保护情景对控制非蓝绿空间用地无序扩张具有显著成效。城镇优先发展情景下,耕地、林地、草地和水域等蓝绿空间用地面积减少速率较2020年明显加快。②从多情景模拟下的蓝绿空间形态学空间格局分析结果来看,自然发展情景下,各蓝绿空间形态类型基本延续前10 a的发展趋势,呈现负向增长,表明如不调整未来发展模式,吴江南片区仍将面临生态环境保护的压力。生态保护优先发展情景下,蓝绿空间核心区等形态类型呈现出较为明显的增长趋势,表明蓝绿空间的整体生态效益有所提升。城镇优先发展情景下,蓝绿空间核心区、孔隙等形态类型面积及占比呈现负向发展趋势,反映出吴江南片区蓝绿空间核心区内部的集聚程度受到较大影响,斑块景观连通性下降,亟须加强保护力度。③从多情景模拟下的蓝绿空间景观连通性评价来看,蓝绿空间核心区的连通性程度在自然发展情景呈现出略微下降的趋势,毕家湾、沈庄漾区域的景观连通性降低程度相对明显。生态保护优先发展情景下,蓝绿空间景观连通性整体呈现上升趋势,表明以生态保护建设为首要的发展模式对吴江南片区蓝绿空间景观破碎化程度改善具有明显作用。在城镇优先发展情景下,受人为活动和建设用地快速扩张等因素影响,长荡—大龙荡等区域的景观连通性下降幅度较为剧烈,反映出未来吴江南片区蓝绿空间连通性降低程度还将持续加剧。

    • CA-Markov模型的模拟主要基于土地利用数据分析,虽然解译多时段的土地利用数据能更细致地体现时空变化,但受区域土地利用数据遥感影像图精度限制,导致模拟结果存在一定偏差。在后续研究中应进一步提升土地利用数据的分辨率,提高研究结果的精准性。同时,在多情景设置时,本研究结合前人的研究,情景设置主要考虑了自然地理和政策法规,对社会、经济、人文等方面指标的权衡作用尚未全面考虑,未来将进一步完善多情景模拟的指标体系设置,对每个情景做更全面的定量分析比较。苏州市吴江区蓝绿空间具有典型水网生态结构特征,伴随快速城镇化进程,水网地区蓝绿空间生态呈现复杂性。面对蓝绿空间面积减少,破碎化加剧等问题,未来应该加强对蓝绿空间保护,坚守生态保护红线,管控建设用地快速扩张,保护蓝绿空间用地规模,强化蓝绿空间生态环境治理。同时,建议整合现有蓝绿空间生态资源,通过科学识别重要蓝绿空间资源,构建吴江南片区蓝绿空间生态网络等一系列重要举措,增强蓝绿空间连通性,优化城镇复合生态系统,缓解地区生态矛盾,促进人地关系和谐。

Reference (23)

Catalog

    /

    DownLoad:  Full-Size Img  PowerPoint
    Return
    Return