-
园林绿化废弃物资源化利用[1-2]已成为研究热点,其中堆肥化是一种比较理想的处理方式。由于园林绿化废弃物木质素含量较高、起始微生物数量较少等原因,堆肥效率较低,因此如何提高堆肥过程中的微生物数量成为推进园林绿化废弃物堆肥的关键[3-4]。添加微生物菌剂是提高堆体微生物数量最直接的方式之一。目前,针对木质素降解的菌剂较少,且多集中于液体菌剂。然而液体菌剂对无菌条件要求较高,运输及产品储存有诸多不便[5]。固体菌剂在生产和储存方面能弥补液体菌剂的不足,同时,固体菌剂生产成本更低、生产工艺也相对简单,对促进园林绿化废弃物堆肥化过程的优势更明显[6]。生产固体菌剂,除了设计固体发酵的培养基,还要优化其发酵条件,主要流程为试验设计、数学建模和优化设计3个部分[7]。合理的试验设计能用较少的试验数据进行建模,从而获取各因素范围内的最优解。已有研究对于固态发酵的优化多是使用响应面法[8-9]。但是有研究发现[10]:人工神经网络算法优化培养基比响应面法优化培养基验证结果更准确,误差更小。本研究拟采用单因素试验和正交试验确定作为固态发酵培养基碳源、氮源的较优种类和水平,然后根据碳氮源优化结果,通过单因素试验确定外加营养组分种类,最后采用均匀实验结合人工神经网络建模与优化,寻找2株木质素降解菌的外加营养组分接种量和最佳固体培养基发酵条件,以期得到最大发酵生物量,制作高效固体菌剂用于园林绿化废弃物堆肥。
-
菌株A为构巢曲霉Aspergillus nidulans、菌株Q为栓菌属1种Trametes sp.,均由北京林业大学土壤生物学实验室分离并保藏。
PDA培养基:马铃薯浸汁(200.000 g土豆去皮去芽,切成小块,加蒸馏水1 L保持微沸30 min后过滤),葡萄糖 20.000 g,蛋白胨15.000 g,琼脂 20.000 g,pH自然。PDB液体培养基:马铃薯浸汁(同PDA培养基),葡萄糖 20.000 g,蛋白胨15.000 g,pH自然。以上所有培养基均121 ℃高压蒸汽灭菌30 min。
-
①菌株活化。将接种环置于酒精灯上燃烧,待冷却后挑取PDA斜面上的少许菌株接种至PDA培养基,封口后置于恒温培养箱活化。②液体菌种培养。将活化后纯培养的目标菌株的PDA培养基接至放有玻璃碎片的PDB液体培养基的三角瓶中,在IS-RDD3台式恒温振荡器中以25 ℃、200 r·min−1条件下培养5 d。③固态发酵。以30.000 g麸皮为发酵基质,添加碳氮源以及外加营养组分,于121 ℃高压蒸汽灭菌30 min后,冷却至室温备用。将液体菌种按20%的接种量(物料干质量)加入无菌水中混匀,接入物料,调节料水比,搅拌均匀后置于25 ℃条件下培养7 d,重复3次。
-
①碳氮源筛选。采用单因素试验筛选固体发酵培养基的碳氮源种类。以麸皮为发酵基质,在米糠、木质素磺酸钠、玉米粉、蔗糖中筛选碳源,在豆饼粉、蛋白胨、酒石酸胺、尿素中筛选氮源,比较不同碳氮源对2株木质素降解菌生物量的影响,以选择能促进菌体生长发育的最佳碳氮源。采用L9(34)正交试验确定最佳添加量。根据最佳碳氮源的筛选结果,选择3个吸光度D(260)相对较高的添加量梯度进行L9(34)正交试验,探究碳氮源添加量对2株木质素降解菌生物量的影响,优化固态发酵基质配方。②外加营养组分筛选。采用单因素试验确定添加物质种类。以麸皮为发酵基质,在最佳碳氮源的基础上中添加营养组分:硫酸钙(CaSO4)、硫酸镁(MgSO4)、磷酸二氢钾(KH2PO4)、硫酸亚铁(FeSO4·7H2O)、氯化钠(NaCl)进行外加营养组分筛选,重复3次,选择3个D(260)最大的作为外加营养组分的种类,确定外加钙盐、镁盐、磷酸盐等对菌株A和菌株Q生长的影响。③培养基配方优化。采用均匀实验设计结合人工神经网络建模,进一步优化固态发酵培养基的外加营养组分添加量及其他发酵条件。
-
将液体菌种用纱布过滤,同时以无菌水充分洗涤过滤物,过滤物即为纯菌体,在65 ℃的条件下烘干至恒量,留存备用。精密称取纯菌体0.010、0.030、0.050、0.100、0.150和0.200 g,加入25.000 mL体积分数为5%三氯乙酸溶液,80 ℃恒温水浴中搅拌提取25 min,取出后冰浴冷却,在4 ℃、8000 r·min−1条件下离心15 min,稀释2倍,以体积分数为5%的三氯乙酸为对照,用分光光度计测定D(260),构建标准回归曲线。发酵物置于65 ℃条件下烘干至恒量,取0.500 g烘干至恒量的固态发酵物测定D(260)(与上述提取纯菌体中核酸的方式相同)。同时,以发酵7 d但未接种种子液的固态发酵物作为空白对照,在260 nm处测定提取液的D(260),通过标准回归曲线预测菌丝干质量。
-
①数据采用Excel 2007和SPSS 22.0处理。碳氮源优化用单因素方差分析法,平均值多重比较用LSD最小显著性差异法(P<0.05)。②采用均匀实验实现人工神经网络建模与优化。其一,基于Smooth L1损失函数的人工神经网络构建。该网络借鉴U-Net架构设计了编码器和解码器,添加了残差连接[11],以缓解网络退化问题[12],并采用Smooth L1损失函数[13]最小化观察值与模型预测值的误差。损失函数如下所示:SmoothL1(x)
$ = \left\{ {\begin{array}{*{20}{c}} {\begin{array}{*{20}{l}} {0.5{x^2}}\\ {|x| - 0.5} \end{array}}&{\begin{array}{*{20}{c}} {{\text{假如}}\;|x| {\text{<}} 1}\\ {{\text{否则}}} \end{array}} \end{array}} \right.$ 。其二,基于AdamW算法[14]寻优。神经网络、AdamW算法基于Pytorch[15]实现。 -
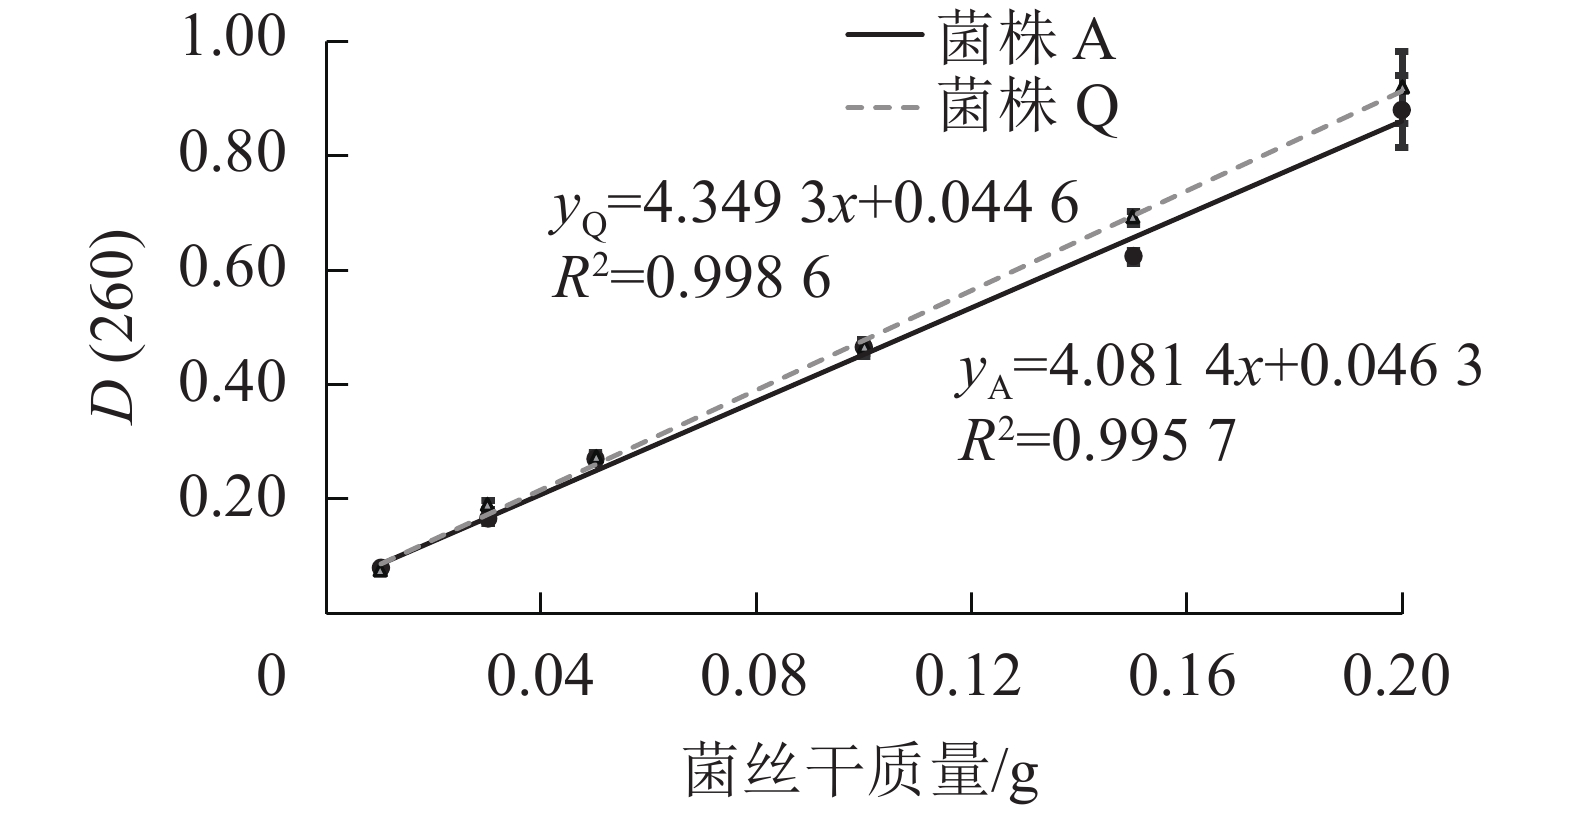
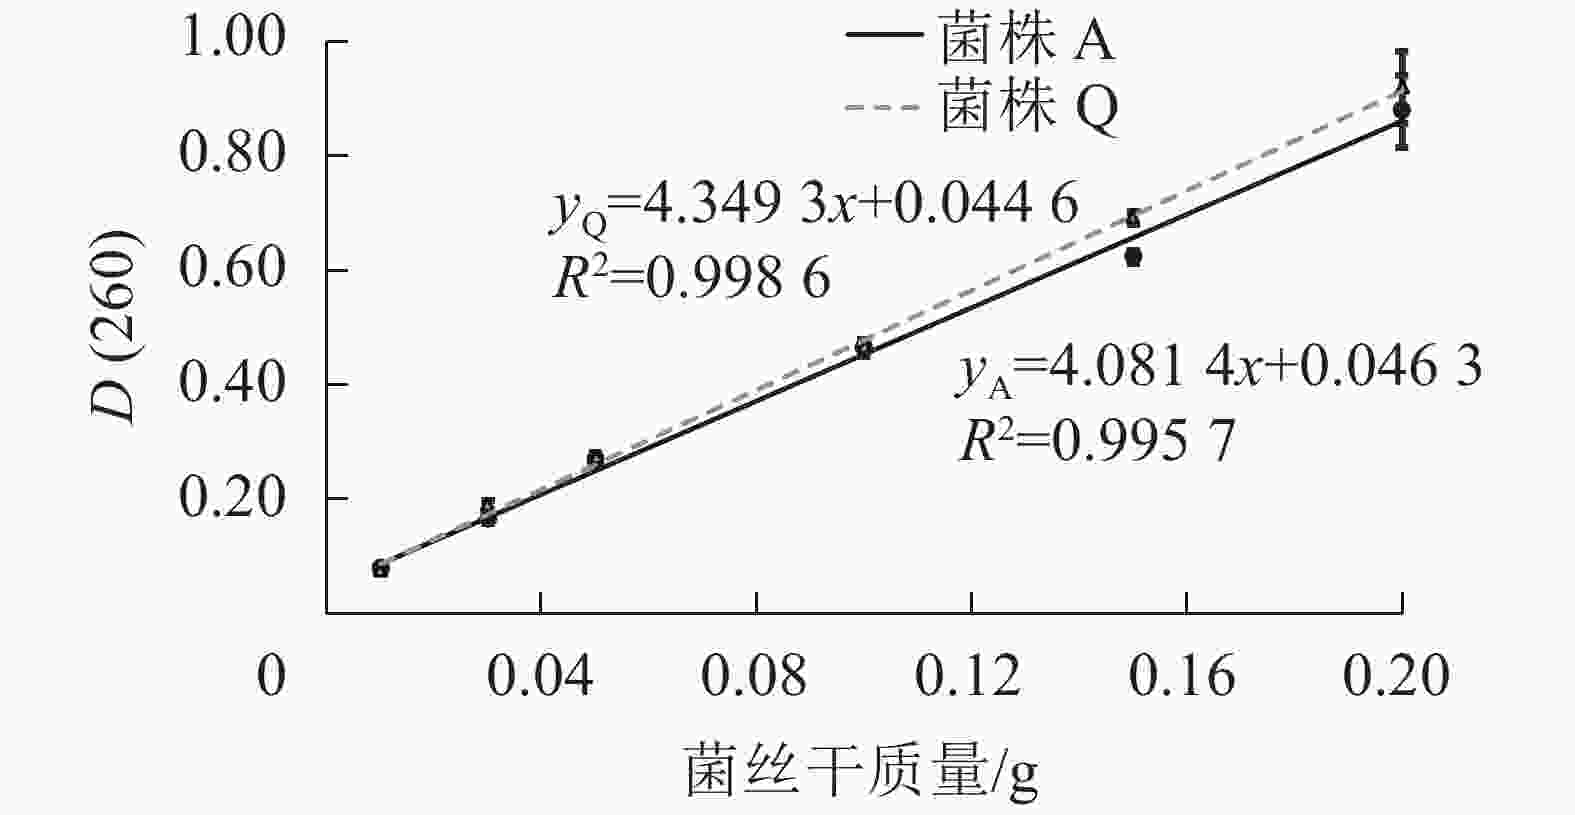
由图1可知:2株木质素降解菌菌丝中的核酸量与菌丝干质量在测试的范围之内可呈现良好的线性关系,说明通过测定D(260)来确定2株木质素降解菌固态发酵生物量的方法可行。菌株Q的线性方程为yQ=4.349 3x+0.044 6,R2=0.998 6;菌株A的线性方程为yA=4.081 4x+0.046 3,R2=0.995 7。
-
由图2可知:菌株A的4种碳源处理的D(260)差异不显著(P>0.05),但木质素磺酸钠的D(260)最高,分别较米糠、玉米粉和蔗糖处理高出14.900%、8.800%和8.200%。菌株Q的3种碳源处理的D(260)差异不显著(P>0.05),但玉米粉的D(260)最高,分别较木质素磺酸钠、米糠和蔗糖处理高出6.900%、3.600%和0.900%。菌株A为构巢曲霉,分泌的木质素降解相关酶系降解木质素效果显著[16-17],同时木质素磺酸钠是木质素磺化改性得到的衍生化产品,因此,相比其他3种碳源,木质素磺酸钠更有利于促进菌株A细胞的快速生长,获得较高的菌丝生物量[18]。菌株Q在以玉米粉为碳源时的生物量最高,可能是因为玉米粉中含有大量的糖分、淀粉、多种矿质元素和维生素, 这些营养物质有利于菌株Q的生长繁殖[19]。因此,选择木质素磺酸钠作为菌株A的碳源,选用玉米粉作为菌株Q的碳源。
-
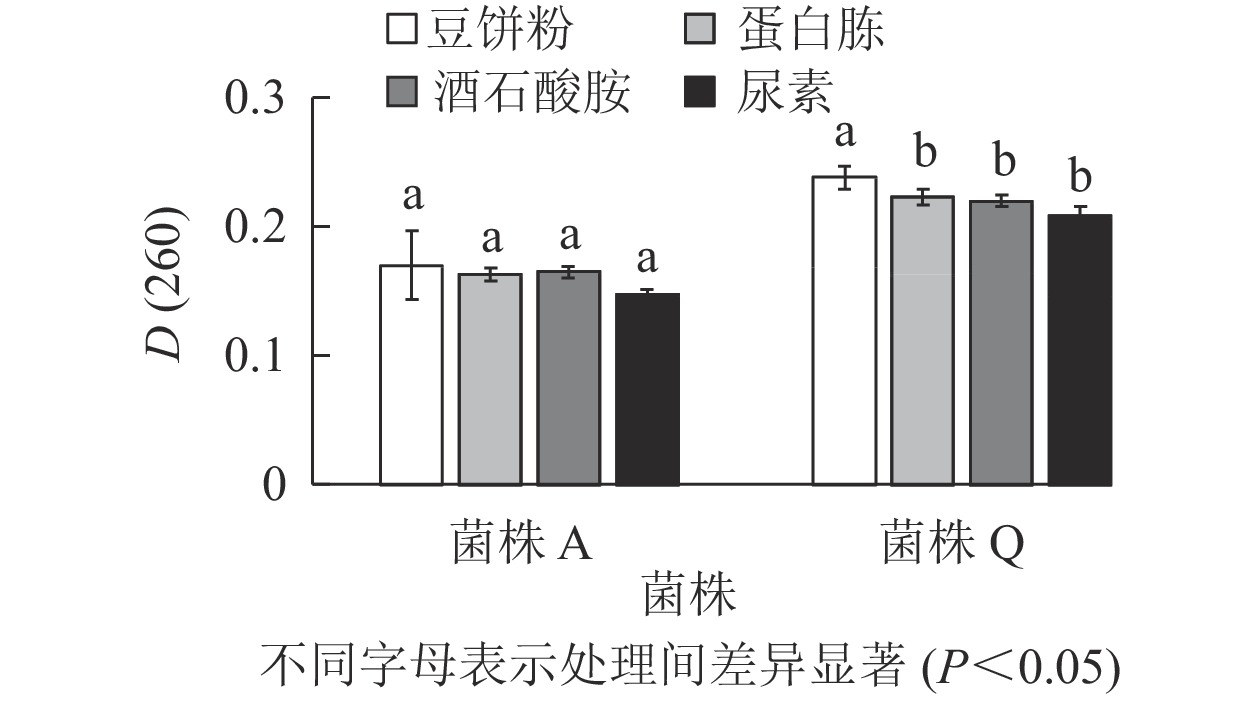
由图3可知:菌株A的4种氮源处理的D(260)差异不显著(P>0.05),但豆饼粉的D(260)最高,分别较蛋白胨、酒石酸胺和尿素处理高出4.300%、3.000%和15.600%。菌株Q的D(260)在以豆饼粉为氮源时最高,且与其他处理差异显著(P<0.05),分别较蛋白胨、酒石酸胺和尿素处理高出6.700%、8.200%和14.400%。豆饼粉含大量碳水化合物、蛋白质及少量异黄酮类物质和可溶性多糖,可作为发酵的氮源及生长因子,有利于生物量的积累[20-21]。同时,豆饼粉来源稳定,价格低廉,能够快速被微生物利用,因此,选用豆饼粉为后续实验中菌株A和菌株Q的氮源。
-
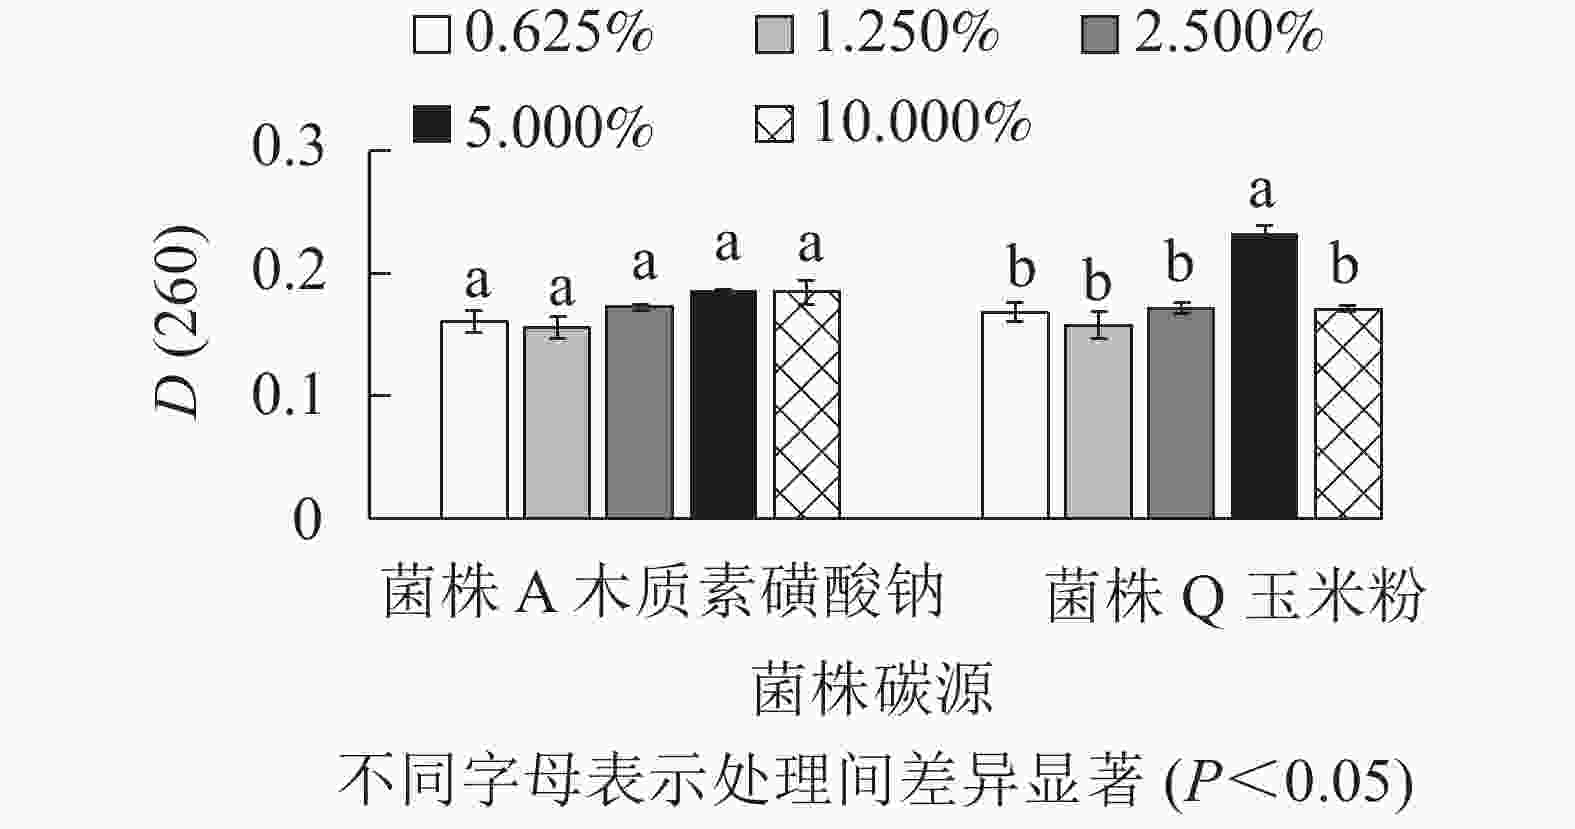
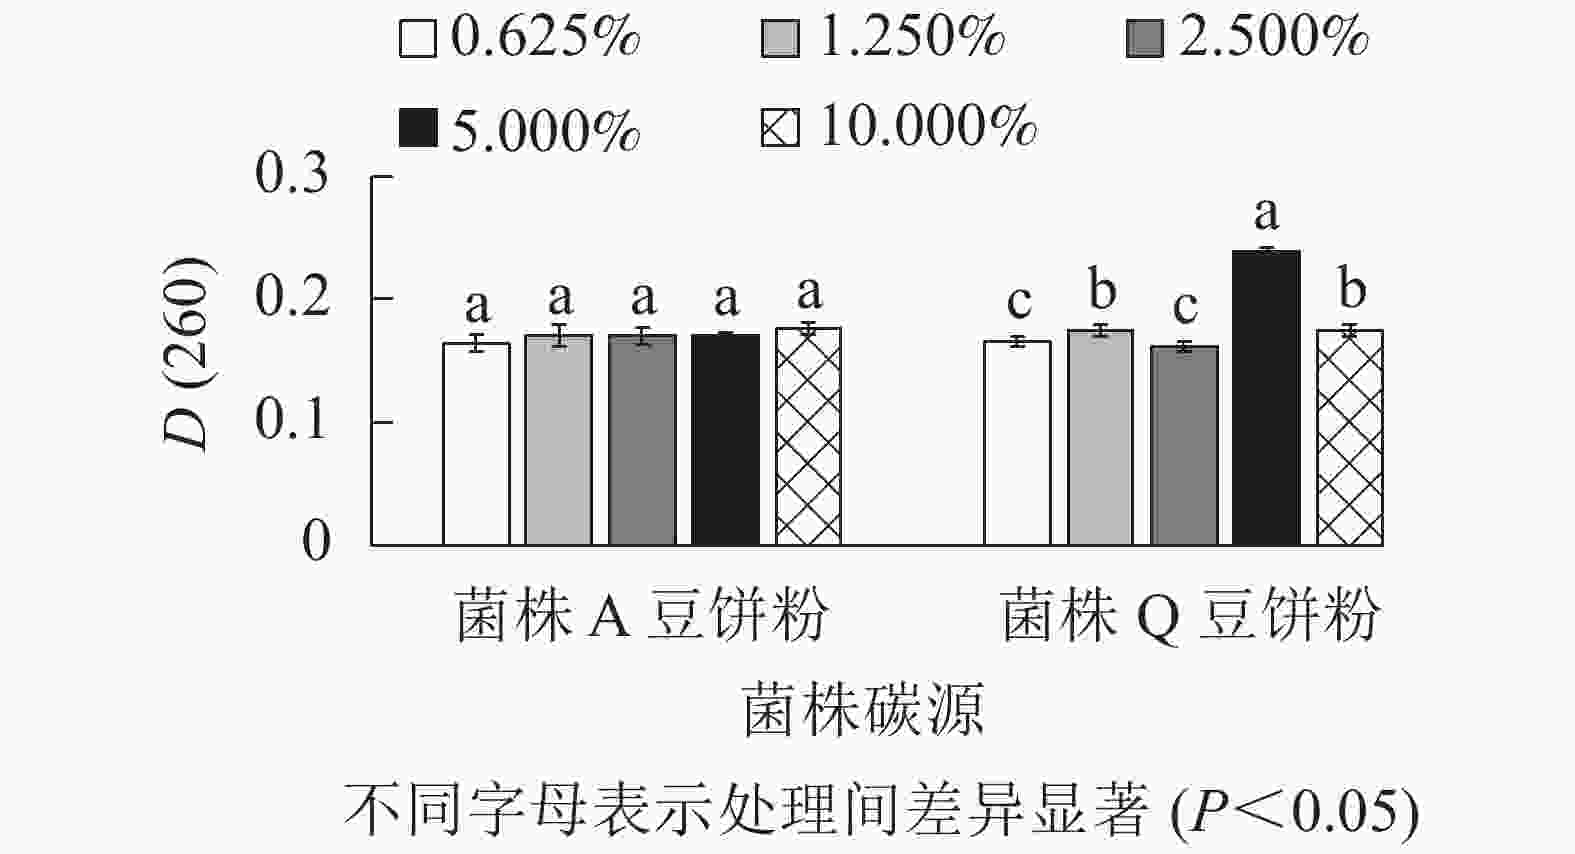
由图4所示:菌株A在以木质素磺酸钠为最佳碳源时,添加量为2.500%、5.000%、10.000%处理间的D(260)差异不显著(P>0.05),但是数值相对较高。因此,菌株A的木质素磺酸钠选用2.500%、5.000%、10.000%添加量进行正交试验。菌株Q在以玉米粉为最佳碳源时,添加量为5.000%时D(260)值最高,与其他处理差异显著(P<0.05),0.625%、2.500%的D(260)也相对较高,因此,菌株Q的玉米粉选用0.625%、2.500%、5.000%添加量进行正交试验。菌株Q在添加量为5.000%时生物量达到最高,可能是由于在培养空间一定时,玉米粉的添加量越多,通气量降低,导致生物量的积累下降从而使菌株Q的生长受到了一定的抑制[16]。由图5可知:菌株A以豆饼粉为最佳氮源时,5种不同添加量处理的D(260)差异不显著(P>0.05)。添加量为10.000%时D(260)最高,但是从经济角度考虑,最终选择豆饼粉添加量为1.250%、2.500%、5.000%进行正交试验。菌株Q以豆饼粉为最佳氮源时,添加量为1.250%、5.000%、10.000%时的D(260)显著高于另外2个添加量,因此选择这3个梯度进行正交试验。
-
由表1和表2可知:菌株A的碳氮源添加量为木质素磺酸钠5.000%、豆饼粉5.000%时D(260)最大,高达0.249。菌株Q的碳氮源添加量为玉米粉0.625%、豆饼粉10.000%时D(260)最大,高达0.261。因此选定菌株A的碳氮源添加量为木质素磺酸钠5.000%和豆饼粉5.000%,菌株Q的碳氮源添加量为豆饼粉10.000%和玉米粉0.625%。
表 1 菌株A正交设计试验L9(34)
Table 1. Orthogonal design experiment of strain A L9 (34)
处理 豆饼粉/% 木质素磺酸钠/% D(260) T1 1.250 2.500 0.228±0.009 T2 1.250 5.000 0.241±0.001 T3 1.250 10.000 0.207±0.018 T4 2.500 2.500 0.216±0.007 T5 2.500 5.000 0.213±0.008 T6 2.500 10.000 0.245±0.010 T7 5.000 2.500 0.237±0.010 T8 5.000 5.000 0.249±0.003 T9 5.000 10.000 0.241±0.007 表 2 菌株Q正交设计试验L9(34)
Table 2. Orthogonal design experiment of strain Q L9 (34)
处理 豆饼粉/% 玉米粉/% D(260) T1 1.250 0.625 0.101±0.003 T2 1.250 2.500 0.224±0.006 T3 1.250 5.000 0.214±0.005 T4 5.000 0.625 0.101±0.003 T5 5.000 2.500 0.162±0.008 T6 5.000 5.000 0.232±0.020 T7 10.000 0.625 0.261±0.003 T8 10.000 2.500 0.191±0.002 T9 10.000 5.000 0.102±0.003 -
由图6表明:菌株A的5种外加营养组分处理的D(260)差异不显著(P>0.05),但外加CaSO4、MgSO4、KH2PO4时的D(260)值最大,因此,这3种被定为最佳外加营养组分。微生物除了碳源和氮源,还需要一定量的无机盐来调节其生长代谢。镁盐作为许多重要酶的激活剂能够影响蛋白质的合成以及基质氧化;磷则是核酸和蛋白质的重要组成成分,能够影响微生物的生长[22],这与本研究结果一致。
-
在以2.2.4和2.3实验结果为前提的条件下,设计6因素5水平10组的均匀实验。再通过神经网络对所有数据进行预测,得到实测值与仿真值的对比(表3和表4)。结果发现:各观察值与测量值误差较小,基本相同。综上,该模型预测值具备参考性。
表 3 菌株Q均匀实验设计及结果
Table 3. Strain Q uniform test design and results
试验号 因素水平(实际用量/%) D(260) MgSO4 KH2PO4 FeSO4·7H2O 接菌量 料水比 海藻糖 实测值1 1(0.600) 2(0.800) 3(1.000) 5(25.000) 7(1.00∶0.50) 10(16.000) 0.4110 仿真值1 1(0.600) 2(0.800) 3(1.000) 5(25.000) 7(1.00∶0.50) 10(16.000) 0.4109 实测值2 2(0.800) 4(1.200) 6(0.600) 10(25.000) 3(1.00∶0.65) 9(12.000) 0.4500 仿真值2 2(0.800) 4(1.200) 6(0.600) 10(25.000) 3(1.00∶0.65) 9(12.000) 0.4499 实测值3 3(1.000) 6(0.600) 9(1.200) 4(20.000) 10(1.00∶0.95) 8(8.000) 0.4800 仿真值3 3(1.000) 6(0.600) 9(1.200) 4(20.000) 10(1.00∶0.95) 8(8.000) 0.4801 实测值4 4(1.200) 8(1.000) 1(0.600) 9(20.000) 6(1.00∶0.30) 7(4.000) 0.4430 仿真值4 4(1.200) 8(1.000) 1(0.600) 9(20.000) 6(1.00∶0.30) 7(4.000) 0.4431 实测值5 5(1.400) 10(1.400) 4(1.200) 3(15.000) 2(1.00∶0.50) 6(0.000) 0.3860 仿真值5 5(1.400) 10(1.400) 4(1.200) 3(15.000) 2(1.00∶0.50) 6(0.000) 0.3859 实测值6 6(0.600) 1(0.600) 7(0.800) 8(15.000) 9(1.00∶0.80) 5(16.000) 0.4620 仿真值6 6(0.600) 1(0.600) 7(0.800) 8(15.000) 9(1.00∶0.80) 5(16.000) 0.4619 实测值7 7(0.800) 3(1.000) 10(1.400) 2(10.000) 5(1.00∶0.95) 4(12.000) 0.4630 仿真值7 7(0.800) 3(1.000) 10(1.400) 2(10.000) 5(1.00∶0.95) 4(12.000) 0.4635 实测值8 8(1.000) 5(1.400) 2(0.800) 7(10.000) 1(1.00∶0.30) 3(8.000) 0.2930 仿真值8 8(1.000) 5(1.400) 2(0.800) 7(10.000) 1(1.00∶0.30) 3(8.000) 0.2929 实测值9 9(1.200) 7(0.800) 5(1.400) 1(5.000) 8(1.00∶0.65) 2(4.000) 0.4450 仿真值9 9(1.200) 7(0.800) 5(1.400) 1(5.000) 8(1.00∶0.65) 2(4.000) 0.4453 实测值10 10(1.400) 9(1.200) 8(1.000) 6(5.000) 4(1.00∶0.80) 1(0.000) 0.4230 仿真值10 10(1.400) 9(1.200) 8(1.000) 6(5.000) 4(1.00∶0.80) 1(0.000) 0.4231 表 4 菌株A均匀试验设计及结果
Table 4. Strain A uniform test design and results
试验号 因素水平(实际用量/%) D(260) CaSO4 MgSO4 KH2PO4 接菌 料水比 海藻糖 实测值1 1(0.600) 2(0.800) 3(1.000) 5(25.000) 7(1.00∶0.50) 10(16.000) 0.3930 仿真值1 1(0.600) 2(0.800) 3(1.000) 5(25.000) 7(1.00∶0.50) 10(16.000) 0.3930 实测值2 2(0.800) 4(1.200) 6(0.600) 10(25.000) 3(1.00∶0.65) 9(12.000) 0.4020 仿真值2 2(0.800) 4(1.200) 6(0.600) 10(25.000) 3(1.00∶0.65) 9(12.000) 0.4020 实测值3 3(1.000) 6(0.600) 9(1.200) 4(20.000) 10(1.00∶0.95) 8(8.000) 0.4260 仿真值3 3(1.000) 6(0.600) 9(1.200) 4(20.000) 10(1.00∶0.95) 8(8.000) 0.4260 实测值4 4(1.200) 8(1.000) 1(0.600) 9(20.000) 6(1.00∶0.30) 7(4.000) 0.3930 仿真值4 4(1.200) 8(1.000) 1(0.600) 9(20.000) 6(1.00∶0.30) 7(4.000) 0.3930 实测值5 5(1.400) 10(1.400) 4(1.200) 3(15.000) 2(1.00∶0.50) 6(0.000) 0.3900 仿真值5 5(1.400) 10(1.400) 4(1.200) 3(15.000) 2(1.00∶0.50) 6(0.000) 0.3900 实测值6 6(0.600) 1(0.600) 7(0.800) 8(15.000) 9(1.00∶0.80) 5(16.000) 0.4320 仿真值6 6(0.600) 1(0.600) 7(0.800) 8(15.000) 9(1.00∶0.80) 5(16.000) 0.4320 实测值7 7(0.800) 3(1.000) 10(1.400) 2(10.000) 5(1.00∶0.95) 4(12.000) 0.4110 仿真值7 7(0.800) 3(1.000) 10(1.400) 2(10.000) 5(1.00∶0.95) 4(12.000) 0.4110 实测值8 8(1.000) 5(1.400) 2(0.800) 7(10.000) 1(1.00∶0.30) 3(8.000) 0.3650 仿真值8 8(1.000) 5(1.400) 2(0.800) 7(10.000) 1(1.00∶0.30) 3(8.000) 0.3650 实测值9 9(1.200) 7(0.800) 5(1.400) 1(5.000) 8(1.00∶0.65) 2(4.000) 0.3770 仿真值9 9(1.200) 7(0.800) 5(1.400) 1(5.000) 8(1.00∶0.65) 2(4.000) 0.3770 实测值10 10(1.400) 9(1.200) 8(1.000) 6(5.000) 4(1.00∶0.80) 1(0.000) 0.4210 仿真值10 10(1.400) 9(1.200) 8(1.000) 6(5.000) 4(1.00∶0.80) 1(0.000) 0.4210 -
如表5所示:按照人工神经网络算法模型预测的优化后固体发酵培养基进行实验验证,该优化条件下菌株Q的D(260)为0.6020,实测值为0.5960,误差为1.000%;预测得到菌株A的D(260)为0.4850,实测值为0.4780,误差为1.500%。
表 5 人工神经网络寻优结果
Table 5. Optimization results of artificial neural network
试验号 实际用量/% D (260) MgSO4 KH2PO4 FeSO4·7H2O 接菌量 料水比 海藻糖 菌株Q仿真值 1.434 0.115 1.497 6.000 1.000∶0.992 1.000 0.6020 菌株Q实测值 1.434 0.115 1.497 6.000 1.000∶0.992 1.000 0.5960 菌株A仿真值 0.123 0.213 1.280 21.000 1.000∶1.000 19.000 0.4850 菌株A实测值 0.123 0.213 1.280 21.000 1.000∶1.000 19.000 0.4780 -
本研究结果表明:人工神经网络算法优化后菌株Q的预测值为0.6020,实测值为0.5960,误差为1.000%;菌株A的预测值为0.485,实测值为0.478,误差为1.500%。基于人工神经网络构建的模型拟合度较好。
根据单因素试验和人工神经网络算法结果,确定了2株木质素降解菌的最优固体发酵条件。菌株Q:固体菌剂培养基基质为麸皮30.000 g作为基底,添加豆饼粉10.000%和玉米粉0.625%,外加营养组分为MgSO4 1.434%、KH2PO4 0.115%和FeSO4·7H2O 1.497%;接种条件为接菌量6.000%、料水比1.000∶0.992、保护剂1.000%。菌株A:固体菌剂培养基基质为麸皮30.000g作为基底,添加豆饼粉5.000%和木质素磺酸钠为5.000%,外加营养组分为MgSO4 0.123 %、KH2PO4 0.213 %、FeSO4·7H2O 1.280%;接种条件为接菌量21.000%、料水比1∶1、保护剂19.000%。
Preparation of two strains of lignin-degrading bacteria solid inoculum
-
摘要:
目的 以2株不同的木质素降解菌[菌株A(构巢曲霉 Aspergillus nidulans) 、菌株Q(栓菌属1种 Trametes sp.)]为材料,分别制作应用于园林绿化废弃物降解或者堆肥的高效固体发酵菌剂。 方法 采用单因素试验确定固体发酵培养基的碳氮源和外加营养组分种类,再通过正交试验对碳氮源添加量进行优化,最后根据碳氮源优化结果,采用均匀实验结合人工神经网络算法寻找2株木质素降解菌的外加营养组分接种量和最佳固体培养基发酵条件。 结果 优化后的菌株Q固体菌剂培养基基质以麸皮30.000 g作为基底,添加豆饼粉3.000 g和玉米粉0.188 g;外加营养组分(按基质的质量比)为硫酸镁(MgSO4) 1.434%、磷酸二氢钾(KH2PO4)0.115%和硫酸亚铁(FeSO4·7H2O)1.497%;接种条件为接菌量6.000%、料水比(质量比)1.000∶0.992、保护剂1.000%。优化后的菌株A固体菌剂培养基基质以麸皮30.000 g作为基底,添加豆饼粉1.500 g和木质素磺酸钠1.500 g;外加营养组分(按基质的质量比)为MgSO4 0.123%、KH2PO4 0.213%、FeSO4·7H2O 1.280%;接种条件为接菌量21.000%、料水比1∶1、保护剂19.000%。菌株Q和菌株A在优化培养基上发酵7~9 d获得最大发酵生物量,菌株Q的吸光度D(260)为0.596,菌株A的D(260)为0.478。 结论 2株木质素降解菌在优化后的发酵条件下制得的固体菌剂具有高生物量的特点,在降解园林绿化废弃物的木质素方面具有一定潜力。图6表5参22 Abstract:Objective With two different lignin-degrading bacteria, strain A (Aspergillus nidulans) and strain Q (Trametes sp.) used as materials, this study is aimed to research the production of high-efficiency solid fermentation inoculants for degradation or composting of garden greening wastes. Method First, a single factor experiment was employed to determine the types of carbon and nitrogen sources and additional nutrient components of the solid fermentation medium. Then, the orthogonal experiment design was adopted to optimize the amount of carbon and nitrogen sources to be added, based on which, efforts were made to figure out the inoculation amount of additional nutrient components and the best solid medium fermentation conditions of the two lignin-degrading bacteria using a uniform experiment combined with the artificial neural network algorithm. Result The optimized solid inoculum medium matrix (mass ratio) of strain Q was with 30.000 g bran as the base, 3.000 g soybean meal powder and 0.188 g corn flour added, with extra nutrients (based on the mass ratio of the matrix) being MgSO4 1.434%, KH2PO4 0.115%, FeSO4·7H2O 1.497% whereas the inoculation conditions being 6.000% of inoculation, with the ratio of material to water as 1.000∶0.992, and the protective agent as 1.000%. The optimized solid inoculum medium matrix (mass ratio) of strain A was with 30.000 g bran as the base, 1.500 g soybean meal powder and 1.500 g sodium lignosulfonate were added, with extra nutrients (based on the mass ratio of the matrix) being MgSO4 0.123%, KH2PO4 0.213%, FeSO4·7H2O 1.280% whereas the inoculation conditions being 21.000% inoculation amount with the ratio of material to water as 1∶1 and the protective agent as 19.000%. Strain Q and strain A were fermented on the optimized medium for 7−9 days to get the largest fermentation biomass with the D(260) value of strain Q being 0.596 and the D(260) value of strain A being 0.478. Conclusion The solid inoculum prepared by two lignin-degrading bacteria under optimized fermentation conditions were featured with high biomass and certain potential for degrading the lignin of landscaping wastes. [Ch, 6 fig. 5 tab. 22 ref.] -
Key words:
- lignin-degrading bacteria /
- optimization /
- solid inoculum /
- fermentation
-
表 1 菌株A正交设计试验L9(34)
Table 1. Orthogonal design experiment of strain A L9 (34)
处理 豆饼粉/% 木质素磺酸钠/% D(260) T1 1.250 2.500 0.228±0.009 T2 1.250 5.000 0.241±0.001 T3 1.250 10.000 0.207±0.018 T4 2.500 2.500 0.216±0.007 T5 2.500 5.000 0.213±0.008 T6 2.500 10.000 0.245±0.010 T7 5.000 2.500 0.237±0.010 T8 5.000 5.000 0.249±0.003 T9 5.000 10.000 0.241±0.007 表 2 菌株Q正交设计试验L9(34)
Table 2. Orthogonal design experiment of strain Q L9 (34)
处理 豆饼粉/% 玉米粉/% D(260) T1 1.250 0.625 0.101±0.003 T2 1.250 2.500 0.224±0.006 T3 1.250 5.000 0.214±0.005 T4 5.000 0.625 0.101±0.003 T5 5.000 2.500 0.162±0.008 T6 5.000 5.000 0.232±0.020 T7 10.000 0.625 0.261±0.003 T8 10.000 2.500 0.191±0.002 T9 10.000 5.000 0.102±0.003 表 3 菌株Q均匀实验设计及结果
Table 3. Strain Q uniform test design and results
试验号 因素水平(实际用量/%) D(260) MgSO4 KH2PO4 FeSO4·7H2O 接菌量 料水比 海藻糖 实测值1 1(0.600) 2(0.800) 3(1.000) 5(25.000) 7(1.00∶0.50) 10(16.000) 0.4110 仿真值1 1(0.600) 2(0.800) 3(1.000) 5(25.000) 7(1.00∶0.50) 10(16.000) 0.4109 实测值2 2(0.800) 4(1.200) 6(0.600) 10(25.000) 3(1.00∶0.65) 9(12.000) 0.4500 仿真值2 2(0.800) 4(1.200) 6(0.600) 10(25.000) 3(1.00∶0.65) 9(12.000) 0.4499 实测值3 3(1.000) 6(0.600) 9(1.200) 4(20.000) 10(1.00∶0.95) 8(8.000) 0.4800 仿真值3 3(1.000) 6(0.600) 9(1.200) 4(20.000) 10(1.00∶0.95) 8(8.000) 0.4801 实测值4 4(1.200) 8(1.000) 1(0.600) 9(20.000) 6(1.00∶0.30) 7(4.000) 0.4430 仿真值4 4(1.200) 8(1.000) 1(0.600) 9(20.000) 6(1.00∶0.30) 7(4.000) 0.4431 实测值5 5(1.400) 10(1.400) 4(1.200) 3(15.000) 2(1.00∶0.50) 6(0.000) 0.3860 仿真值5 5(1.400) 10(1.400) 4(1.200) 3(15.000) 2(1.00∶0.50) 6(0.000) 0.3859 实测值6 6(0.600) 1(0.600) 7(0.800) 8(15.000) 9(1.00∶0.80) 5(16.000) 0.4620 仿真值6 6(0.600) 1(0.600) 7(0.800) 8(15.000) 9(1.00∶0.80) 5(16.000) 0.4619 实测值7 7(0.800) 3(1.000) 10(1.400) 2(10.000) 5(1.00∶0.95) 4(12.000) 0.4630 仿真值7 7(0.800) 3(1.000) 10(1.400) 2(10.000) 5(1.00∶0.95) 4(12.000) 0.4635 实测值8 8(1.000) 5(1.400) 2(0.800) 7(10.000) 1(1.00∶0.30) 3(8.000) 0.2930 仿真值8 8(1.000) 5(1.400) 2(0.800) 7(10.000) 1(1.00∶0.30) 3(8.000) 0.2929 实测值9 9(1.200) 7(0.800) 5(1.400) 1(5.000) 8(1.00∶0.65) 2(4.000) 0.4450 仿真值9 9(1.200) 7(0.800) 5(1.400) 1(5.000) 8(1.00∶0.65) 2(4.000) 0.4453 实测值10 10(1.400) 9(1.200) 8(1.000) 6(5.000) 4(1.00∶0.80) 1(0.000) 0.4230 仿真值10 10(1.400) 9(1.200) 8(1.000) 6(5.000) 4(1.00∶0.80) 1(0.000) 0.4231 表 4 菌株A均匀试验设计及结果
Table 4. Strain A uniform test design and results
试验号 因素水平(实际用量/%) D(260) CaSO4 MgSO4 KH2PO4 接菌 料水比 海藻糖 实测值1 1(0.600) 2(0.800) 3(1.000) 5(25.000) 7(1.00∶0.50) 10(16.000) 0.3930 仿真值1 1(0.600) 2(0.800) 3(1.000) 5(25.000) 7(1.00∶0.50) 10(16.000) 0.3930 实测值2 2(0.800) 4(1.200) 6(0.600) 10(25.000) 3(1.00∶0.65) 9(12.000) 0.4020 仿真值2 2(0.800) 4(1.200) 6(0.600) 10(25.000) 3(1.00∶0.65) 9(12.000) 0.4020 实测值3 3(1.000) 6(0.600) 9(1.200) 4(20.000) 10(1.00∶0.95) 8(8.000) 0.4260 仿真值3 3(1.000) 6(0.600) 9(1.200) 4(20.000) 10(1.00∶0.95) 8(8.000) 0.4260 实测值4 4(1.200) 8(1.000) 1(0.600) 9(20.000) 6(1.00∶0.30) 7(4.000) 0.3930 仿真值4 4(1.200) 8(1.000) 1(0.600) 9(20.000) 6(1.00∶0.30) 7(4.000) 0.3930 实测值5 5(1.400) 10(1.400) 4(1.200) 3(15.000) 2(1.00∶0.50) 6(0.000) 0.3900 仿真值5 5(1.400) 10(1.400) 4(1.200) 3(15.000) 2(1.00∶0.50) 6(0.000) 0.3900 实测值6 6(0.600) 1(0.600) 7(0.800) 8(15.000) 9(1.00∶0.80) 5(16.000) 0.4320 仿真值6 6(0.600) 1(0.600) 7(0.800) 8(15.000) 9(1.00∶0.80) 5(16.000) 0.4320 实测值7 7(0.800) 3(1.000) 10(1.400) 2(10.000) 5(1.00∶0.95) 4(12.000) 0.4110 仿真值7 7(0.800) 3(1.000) 10(1.400) 2(10.000) 5(1.00∶0.95) 4(12.000) 0.4110 实测值8 8(1.000) 5(1.400) 2(0.800) 7(10.000) 1(1.00∶0.30) 3(8.000) 0.3650 仿真值8 8(1.000) 5(1.400) 2(0.800) 7(10.000) 1(1.00∶0.30) 3(8.000) 0.3650 实测值9 9(1.200) 7(0.800) 5(1.400) 1(5.000) 8(1.00∶0.65) 2(4.000) 0.3770 仿真值9 9(1.200) 7(0.800) 5(1.400) 1(5.000) 8(1.00∶0.65) 2(4.000) 0.3770 实测值10 10(1.400) 9(1.200) 8(1.000) 6(5.000) 4(1.00∶0.80) 1(0.000) 0.4210 仿真值10 10(1.400) 9(1.200) 8(1.000) 6(5.000) 4(1.00∶0.80) 1(0.000) 0.4210 表 5 人工神经网络寻优结果
Table 5. Optimization results of artificial neural network
试验号 实际用量/% D (260) MgSO4 KH2PO4 FeSO4·7H2O 接菌量 料水比 海藻糖 菌株Q仿真值 1.434 0.115 1.497 6.000 1.000∶0.992 1.000 0.6020 菌株Q实测值 1.434 0.115 1.497 6.000 1.000∶0.992 1.000 0.5960 菌株A仿真值 0.123 0.213 1.280 21.000 1.000∶1.000 19.000 0.4850 菌株A实测值 0.123 0.213 1.280 21.000 1.000∶1.000 19.000 0.4780 -
[1] 王琳, 李素艳, 孙向阳, 等. 不同配比园林绿化废弃物和蘑菇渣混合蚯蚓堆肥的效果[J]. 浙江农林大学学报, 2019, 36(2): 326 − 334. WANG Lin, LI Suyan, SUN Xiangyang, et al. Mixing garden wastes and spent mushroom compost of different ratios for vermicomposting [J]. J Zhejiang A&F Univ, 2019, 36(2): 326 − 334. [2] 蔡琳琳, 李素艳, 龚小强, 等. 好氧堆肥-蚯蚓堆肥结合法处理绿化废弃物与牛粪[J]. 浙江农林大学学报, 2018, 35(2): 261 − 267. CAI Linlin, LI Suyan, GONG Xiaoqiang, et al. Composting-vermicomposting of green waste processing spiked with cow dung [J]. J Zhejiang A&F Univ, 2018, 35(2): 261 − 267. [3] 梁丛颖, 林璐. 环境微生物介导的木质素代谢及其资源化利用研究进展[J]. 微生物学通报, 2020, 47(10): 3380 − 3392. LIANG Congying, LIN Lu. Environmental microorganisms driven lignin biodegradation and their roles in lignin utilization [J]. Microbiol China, 2020, 47(10): 3380 − 3392. [4] 孙谱, 孙婉薷, 石占成, 等. 微生物菌剂在木本废弃物堆肥中的应用综述[J]. 江苏农业科学, 2020, 48(15): 57 − 63. SUN Pu, SUN Wanru, SHI Zhancheng, et al. Application of microbial agents in woody waste composting: a review [J]. Jiangsu Agric Sci, 2020, 48(15): 57 − 63. [5] 孟童瑶, 李素艳, 邹荣松, 等. 固定化木质素降解菌对园林废弃物堆肥的影响[J]. 浙江农林大学学报, 2021, 38(1): 38 − 46. MENG Tongyao, LI Suyan, ZOU Rongsong, et al. Effect of immobilized lignin-degrading bacteria on green waste composting [J]. J Zhejiang A&F Univ, 2021, 38(1): 38 − 46. [6] 付冰妍, 孙向阳, 余克非, 等. 芽孢杆菌B01固态发酵及其对园林废弃物堆肥的影响[J]. 环境科学研究, 2021, 34(2): 450 − 457. FU Bingyan, SUN Xiangyang, YU Kefei, et al. Solid state fermentation of Bacillus sp. B01 and its effect on green waste composting [J]. Res Environ Sci, 2021, 34(2): 450 − 457. [7] 李信军, 冯晓晓, 金慧清, 等. 2株内生真菌菌株固态发酵培养基优化[J]. 微生物学通报, 2016, 43(3): 550 − 558. LI Xinjun, FENG Xiaoxiao, JIN Huiqing, et al. Optimization of solid-state fermentation media for growth of two endophytic fungal strains [J]. Microbiol China, 2016, 43(3): 550 − 558. [8] 胡欣颖, 李洪军, 李少博, 等. 对比研究响应面法和BP神经网络-粒子群算法优化调理松板肉加工工艺[J]. 食品与发酵工业, 2019, 45(24): 179 − 187. HU Xinying, LI Hongjun, LI Shaobo, et al. A comparative study of the optimization of processing technology of conditioning pine board meat by response surface methodology and BP neural network-particle swarm optimization [J]. Food Ferment Ind, 2019, 45(24): 179 − 187. [9] 李鹏, 陈秀珍, 庄文颖. 高产纤维素酶的拟康宁木霉菌株8985固态发酵条件优化[J]. 菌物学报, 2021, 40(4): 743 − 758. LI Peng, CHEN Xiuzhen, ZHUANG Wenying. Optimization of solid state fermentation conditions for the high cellulose producing strain Trichoderma koningiopsis 8985 [J]. Mycosystema, 2021, 40(4): 743 − 758. [10] 李佳腾. 纤维素降解优势菌株的筛选与杏鲍菇菌糠混菌发酵条件的优化[D]. 杨凌: 西北农林科技大学, 2019. LI Jiateng. Screening of Dominant Cellulose-degradation Strains and Condition Optimization of Mixed Strains Fermentation of Pleurotus eryngii Spent Mushroom Substrate[D]. Yangling: Northwest A&F University, 2019. [11] LI Xianguo, SUN Yemei, YANG Yanli, et al. symmetrical residual connections for single image super-resolution [J]. ACM Transac Multimedia Comput Commun Appl, 2019, 15(1): 1 − 10. [12] 彭璟, 罗浩宇, 赵淦森, 等. 深度学习下的医学影像分割算法综述[J]. 计算机工程与应用, 2021, 57(3): 44 − 57. PENG Jing, LUO Haoyu, ZHAO Gansen, et al. Survey of medical image segmentation algorithm in deep learning [J]. Comput Eng Appl, 2021, 57(3): 44 − 57. [13] LIU Yuliang, JIN Lianwen. Deep matching prior network: toward tighter multi-oriented text detection [C]//IEEE. 2017 IEEE Conference on Computer Vision, 2017: 1962 − 1969. doi: 10.1109/CVPR.2017.368. [14] HOANG N D. Automatic impervious surface area detection using image texture analysis and neural computing models with advanced opitimizers[J/OL]. Comput Intell Neurosci, 2021, 2021: 8820116[2021-03-20]. doi: 10.1155/2021/8820116. [15] FLORENCIO F, VALENÇT, MORENO E D, et al. Performance analysis of deep learning libraries: TensorFlow and PyTorch [J]. J Comp Sci, 2019, 15(6): 785 − 799. [16] 刘波, 邬应龙, 张霞, 等. 红曲霉固态发酵产木聚糖酶培养基的响应面优化[J]. 食品工业科技, 2014(1): 254 − 258. LIU Bo, WU Yinglong, ZHANG Xia, et al. Optimization of solid state fermentation medium of Monascus M2 for xylanase production by response surface analysis [J]. Sci Technol Food Ind, 2014(1): 254 − 258. [17] 张健. 构巢曲霉转化子菌株TN02A7-Lg-mnp2产MnP的优化诱导及染料脱色研究[D]. 哈尔滨: 东北林业大学, 2017. ZHANG Jian. Optimization of Mnp Production and Decolorization of Dye from Aspergillus nidulans Transformant Strain TN02A7-Lg-mnp2 [D]. Harbin: Northeast Forestry University, 2017. [18] 熊乙. 木质纤维素降解菌的筛选鉴定及降解产物研究[D]. 太原: 山西农业大学, 2019. XIONG Yi. Screening and Identification of Lignocellulose Degrading Bacteria and Degradation Products Research[D]. Taiyuan: Shanxi Agricultural University, 2019. [19] 胡瑞萍, 丁贤, 李来好, 等. 响应面法优化枯草芽孢杆菌NHS1产芽孢发酵培养[J]. 生态学杂志, 2018, 37(2): 605 − 612. HU Ruiping, DING Xian, LI Laihao, et al. Optimization of fermentation medium composition by response surface methodology for the spore production of Bacillus subtilis [J]. Chin J Ecol, 2018, 37(2): 605 − 612. [20] 刘艳苓, 肖安风, 李利君, 等. 棘孢曲霉固态发酵α-L-鼠李糖苷酶调控机制及培养基优化[J]. 中国食品学报, 2015, 15(7): 10 − 17. LIU Yanling, XIAO Anfeng, LI Lijun, et al. The regulatory mechanisms of α-L-rhamnosidase synthesis from Aspergillus aculeatus and improving the medium α-L-rhamnosidase production using solid-state fermentation [J]. J Chin Inst Food Sci Technol, 2015, 15(7): 10 − 17. [21] 彭志妮, 郭丽琼, 张新超, 等. 蛹虫草固体发酵大豆基质的成分及抗氧化活性变化研究[J]. 菌物学报, 2011, 30(2): 338 − 342. PENG Zhini, GUO Liqiong, ZHANG Xinchao, et al. Compositions and antioxidant activities of soybean substrate during solid-state fermentation by Cordyceps militaris [J]. Mycosystema, 2011, 30(2): 338 − 342. [22] 刘波. 红曲霉生淀粉酶发酵优化、分离纯化及其酶学性质研究[D]. 雅安: 四川农业大学, 2014. LIU Bo. Studies on Fermentation Optimization, Purification and Enzyme Characteristics of Raw-starch-digesting Amylase from Monascus[D]. Ya’an: Sichuan Agricultural University, 2014. -

-
链接本文:
https://zlxb.zafu.edu.cn/article/doi/10.11833/j.issn.2095-0756.20210311


 下载:
下载:

