-
有研究表明,植物的叶表面结构和生理生化特性对细颗粒物(PM2.5)有吸附和净化作用,植物类型不同其所发挥的效果也不同[1-2]。目前,国内外学者针对PM2.5的详细研究主要包括其组成来源[3-4]、化学组成分析[5-6]、去除途径等方面[7];有关城市森林对PM2.5的阻滞作用研究也多有涉及,尤其是不同配置模式的城市绿地对PM2.5的阻滞作用,以及小气候因子与林带减尘率的关系等[8-11]。可见,城市森林阻滞PM2.5作用研究一直是相当重要的研究方向。城市道路林是城市森林的重要组成部分,在阻滞吸附大气颗粒物、改善空气质量、美化城市环境等方面发挥着重要作用[12-13]。因此,如何利用有限的城市用地,构建防尘抑霾且兼具美学功能的环境友好型城市道路林是亟待解决的难题之一。基于此,本研究选择了山东省泰安市3种结构共12种不同配置模式的城市道路林,通过分析林带内外的PM2.5在时间和空间中的变化规律,不同配置模式的道路林对PM2.5的阻滞效果以及小气候因子与林带阻滞率的关系等方面探讨以下问题:①PM2.5在城市道路林内外是如何随着时间和空间变化的?②不同配置模式的道路林对PM2.5的阻滞功效是否相似?何种配置的林带减尘率最佳?③林带在发挥减尘效果时,小气候因子是否发挥了功效?它们之间有何关系?最终目的是探索何种配置的城市道路林的防尘抑霾效果最佳,并根据研究结果对城市森林的合理建设提供建议和数据支撑。
-
研究区位于山东省泰安市(35°38′~36°28′N,116°20′~117°59′E),属温带大陆性半湿润季风气候区,夏季炎热多雨,冬季寒冷干燥。年平均气温为13.0 ℃,7月气温最高,平均26.4 ℃;1月份最低,平均−2.6 ℃;年平均降水量697.0 mm。主导风向为东北季风,多年平均风速2.7 m·s−1,8、9月最小,平均2.0 m·s−1以下;3、4月最大,平均3.7 m·s−1。市内植物资源丰富,泰山风景区和徂徕山国家森林公园坐落其中,绿化总面积为215 km2,森林覆盖率达80%,植物种类繁多。中心城区行道树、滨河绿地、环城绿带、城郊结合部的路网绿带发达,可为城市和郊区之间开辟输氧通道,进一步改善城市生态环境。
-
于2016年3月选取了3种道路林结构类型:针阔混交乔木(A)、乔灌草(B)、单行乔木(C),每种结构类型选择3~6块具有不同植物配置模式的样地,各样地内的植被组成见表1。为比较PM2.5在不同水平梯度的城市道路林内的变化规律,A结构设置样地为20 m×20 m,B结构设置样地为40 m×40 m,C结构设置样地为10 m×10 m,林内垂直于道路边每隔5 m设置一组取样点,3组重复,在每处样地的林外裸地无植被处设置对照点(ck),计算平均减尘率。对样地进行植物群落学调查,包括林分郁闭度,乔木层平均冠幅、平均高度;灌木、草本层的平均高度和盖度(表2)。
表 1 12种城市道路林样地的植被组成
Table 1. Vegetation composition of 12 urban road forest plots
群落结构 样地名称 植被组成 针阔混交乔木 A1 圆柏Sabina chinensis+白皮松Pinus bungeana+银杏Ginkgo biloba+雪松Cedrus deodara+柿树Diospyros kaki+垂 柳Salix babylonica-麦冬Ophiopogon japonicus A2 国槐Sophora japonica+紫叶李Prunus cerasifera+小龙柏Sabina chinensis A3 悬铃木Platanus acerifolia+雪松Cedrus deodara+白皮松 A4 栾树Koelreuteria paniculata+紫叶李+黑松Pinus thunbergii A5 色木槭Acer mono+紫叶李+圆柏 A6 雪松+国槐+色木槭+银杏-狗尾草Setaria viridis 单行乔木 B1 国槐+小龙柏 B2 悬铃木+小龙柏 B3 雪松-麦冬Ophiopogon japonicus 乔灌草 C1 旱柳Salix matsudana+圆柏+紫叶李+银杏+栾树-日本晚樱Cerasus yedoensis+石楠Photinia serrulata+大叶黄杨 Euonymus japonicus-鸢尾Iris tectorum C2 油松Pinus tabuliformi+柿树Diospyros kaki+白蜡Fraxinus americana+雪松+圆柏-紫薇Lagerstroemia indica-鸢 尾+细叶结缕草Zoysia tenuifolia C3 银杏+油松+麻栎Quercus acutissima+色木槭+柿树+垂柳-紫叶小檗Berberis thunbergii+龙柏-早熟禾Poa annua+狗尾草Setaria viridis 表 2 12种城市道路林样地的林分特征
Table 2. Stand characteristics of 12 urban road forest plots
样地
名称郁闭度 乔木层平
均冠幅/m乔木层
高度/m灌木层
盖度/%灌木层
高度/m草本层
盖度/%草本层
高度/mA1 0.7 2.35 5.20 − − 15 0.25 A2 0.5 3.10 4.65 7 0.50 − − A3 0.7 4.40 7.70 − − − − A4 0.8 3.20 5.50 − − − − A5 0.6 3.35 5.40 10 0.50 − − A6 0.5 3.10 7.00 − − 10 0.30 B1 0.5 4.50 7.50 25 0.45 − − B2 0.6 5.40 8.50 15 0.50 − − B3 0.7 5.20 7.80 − − 10 0.20 C1 0.4 2.72 5.04 40 1.30 65 0.30 C2 0.4 2.28 4.78 40 1.50 80 0.28 C3 0.5 2.05 4.85 60 0.60 45 0.35 说明:“−”表示样地内无灌木或草本 -
于2016年4月至2017年1月,选择晴朗或微风(风力<3级)天气,每个月上中下旬各取3 d,使用Dustmate粉尘测试仪(分辨率:0.001 μg·m−3)同步监测所有样地,每个监测点取3次重复,监测时间段为8:00−18:00,隔2 h监测1次。采样高度为距离地面1.5 m处(人体的呼吸高度)。气象因子对PM2.5质量浓度影响显著,尤其是雾霾天或湿度较大的天气,故同步监测相对湿度、温度和风速3种气象因子。
-
使用Excel 2013汇总整理原始实验数据,各样地内调查指标计算平均值和标准偏差;依据PM2.5质量浓度限值标准[14](表3)评价污染等级;计算各样地PM2.5阻滞率[14],计算公式:
${B_{{\rm{PM}}i}} = $ $ [({C_{\rm{s}}} - {C_i})/{C_{\rm{s}}}] \times 100\% $ 。其中:BPMi为第i个样地PM2.5阻滞率,Cs为对照点PM2.5质量浓度,Ci为第i个样地的PM2.5质量浓度。表 3 空气质量分级指数及对应PM2.5质量浓度限值
Table 3. Air quality grading index and corresponding PM2.5 concentration limit
空气质量指数/
(μg·m−3)污染等级
(六级)PM2.5日均值/
(μg·m−3)PM2.5年均值/
(μg·m−3)0~50 优 ≤35 ≤15 51~100 良 35~75 15~35 101~150 轻度 76~115 36~75 151~200 中度 116~150 76~115 201~300 重度 151~250 116~150 >300 严重污染 >250 >150 使用SPSS 18.0进行数理统计与分析,对林地内PM2.5质量浓度和阻滞率进行单因素方差分析,并和气象因子间进行相关性分析,显著性水平设定为α = 0.05。
-
如图1所示:12种道路林及ck内的PM2.5日变化表现出相似性,早晚高,中间低,变化曲线近似“U”形。8:00最高,之后逐渐下降,10:00达到低谷后逐渐上升,12:00左右达到峰值后又逐渐下降,14:00达到最小值,之后逐渐升高,18:00又达到峰值。从全年变化角度分析,道路林及ck内的PM2.5年变化规律表现为冬季(136.74~194.18 μg·m−3)>秋季(63.48~104.96 μg·m−3)>春季(28.68~36.31 μg·m−3)>夏季(13.30~19.13 μg·m−3) (表4);4个季节及季节均值都表现为林内<ck;春夏季节,林内对比ck差异较小,差值分别在8.00 和6.00 μg·m−3范围内波动,ck与林内的PM2.5质量浓度之比分别为1.00∶1.27和1.00∶1.44;秋冬季节差值分别在41.00和57.00 μg·m−3范围内波动,PM2.5质量浓度之比分别为1.00∶1.65和1.00∶1.42。
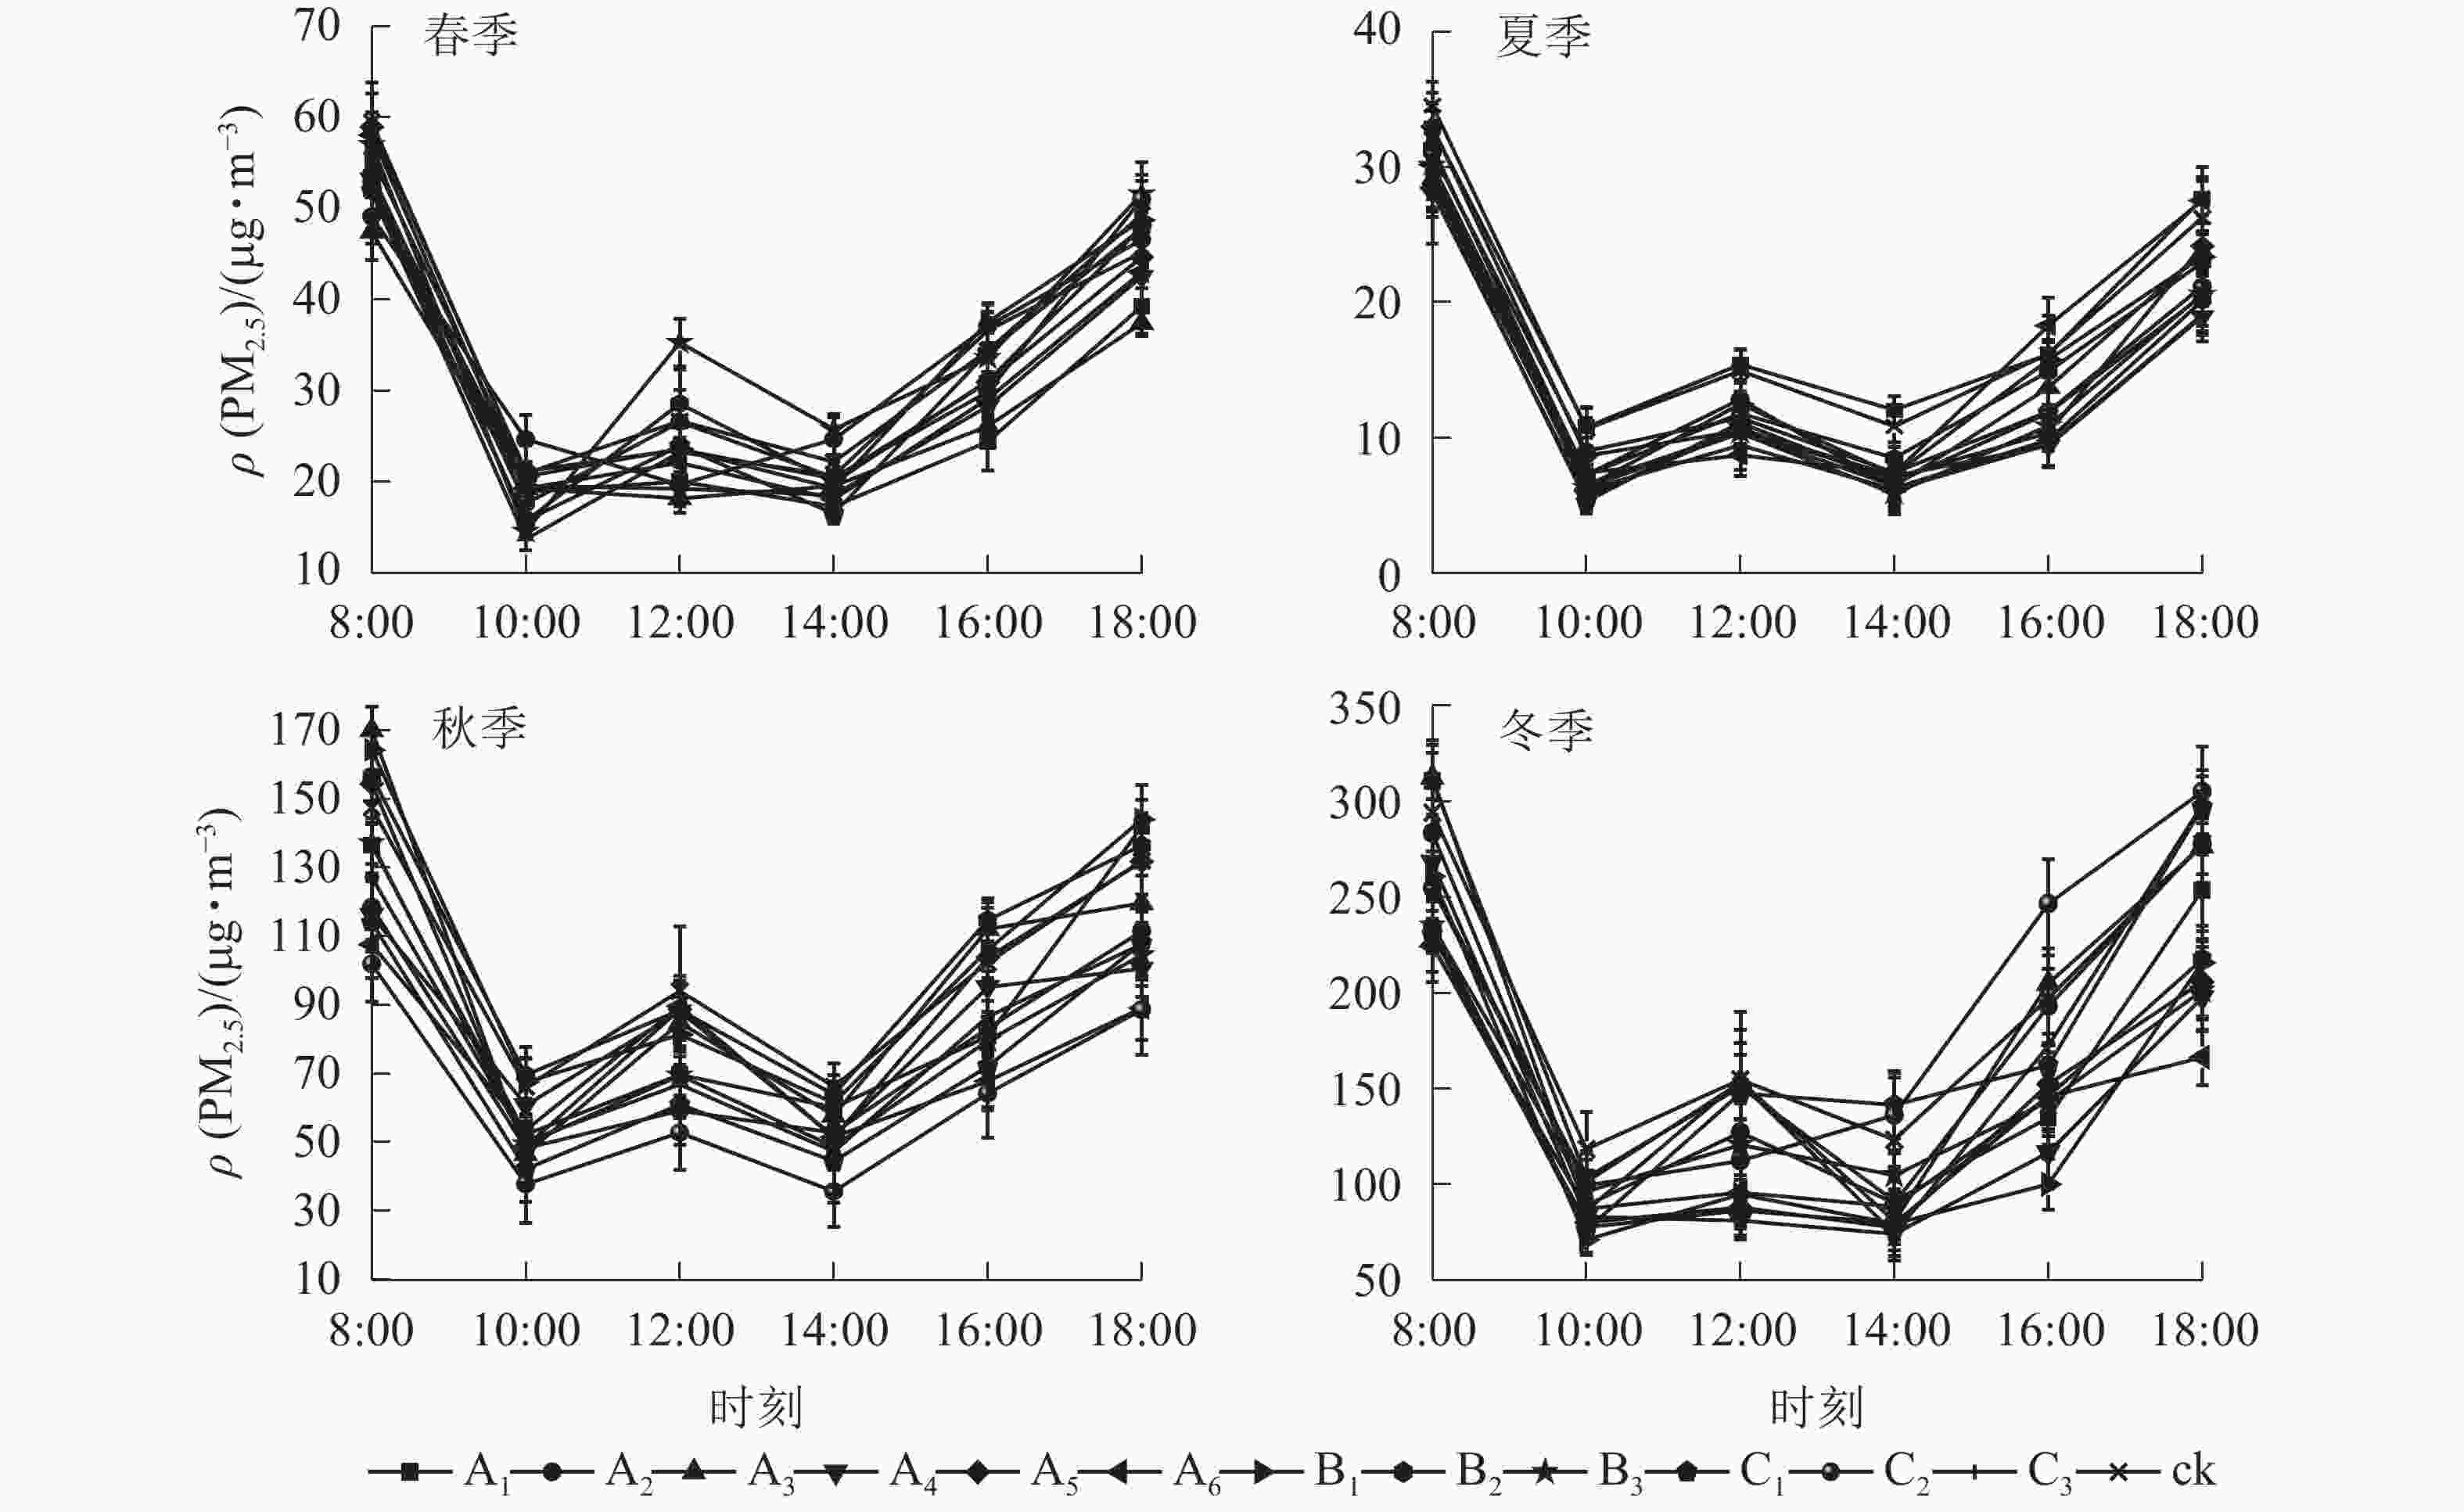
图 1 城市道路林内外PM2.5日变化特征
Figure 1. Diurnal variation characteristics of PM2.5 inside and outside urban forests
表 4 城市道路林内外PM2.5季节均值
Table 4. Seasonal mean value of PM2.5 inside and outside urban roads
样地名称 样地结构 PM2.5变化值/(μg·m−3) 春季 夏季 秋季 冬季 季节均值 A1 针阔混交乔木 28.68±2.80 ab 19.13±1.44 d 90.16±6.85 g 174.09±16.35 e 78.01±6.86 e A2 针阔混交乔木 33.63±2.75 c 14.15±2.22 ab 78.86±8.29 d 176.77±16.05 f 75.86±7.33 d A3 针阔混交乔木 28.0±1.42 a 14.91±1.53 abc 98.46±7.67 i 185.82±16.54 g 81.80±6.79 f A4 针阔混交乔木 30.24±2.42 b 13.30±1.51 a 85.38±9.16 f 136.74±14.54 b 66.41±6.91 a A5 针阔混交乔木 33.28±1.83 c 15.60±1.54 bc 96.46±9.17 h 138.05±14.95 b 70.85±6.87 b A6 针阔混交乔木 31.62±1.54 c 16.55±1.81 c 76.47±8.99 c 134.53±16.11 a 64.79±7.11 a B1 单行乔木 34.24±1.58 cd 15.75±1.65 bc 104.07±6.81 k 136.91±10.08 b 72.74±5.03 c B2 单行乔木 32.68±1.15 c 16.11±1.78 c 104.96±6.18 k 140.22±10.35 c 73.49±4.87 c B3 单行乔木 36.31±1.87 e 14.00±1.82 ab 81.45±7.00 e 150.10±12.58 d 70.46±5.82 b C1 乔灌草 31.72±2.20 c 13.96±1.54 ab 73.58±11.12 b 175.77±14.89 f 73.76±7.44 c C2 乔灌草 33.25±3.07 c 15.32±1.75 bc 63.48±11.58 a 192.32±18.92 h 76.09±8.83 d C3 乔灌草 31.87±1.93 de 13.38±1.66 a 80.94±10.62 e 175.90±20.62 f 75.52±8.71 d ck 35.51±4.09 de 18.88±2.04 d 101.33±14.86 j 194.18±36.42 i 87.40±14.35 g 依据环境空气质量标准(表3),春夏季节道路林内PM2.5质量浓度在所有监测时段空气质量为优;秋冬季节在8:00和18:00,空气质量达到中重度污染,其他时间监测时段为良。
-
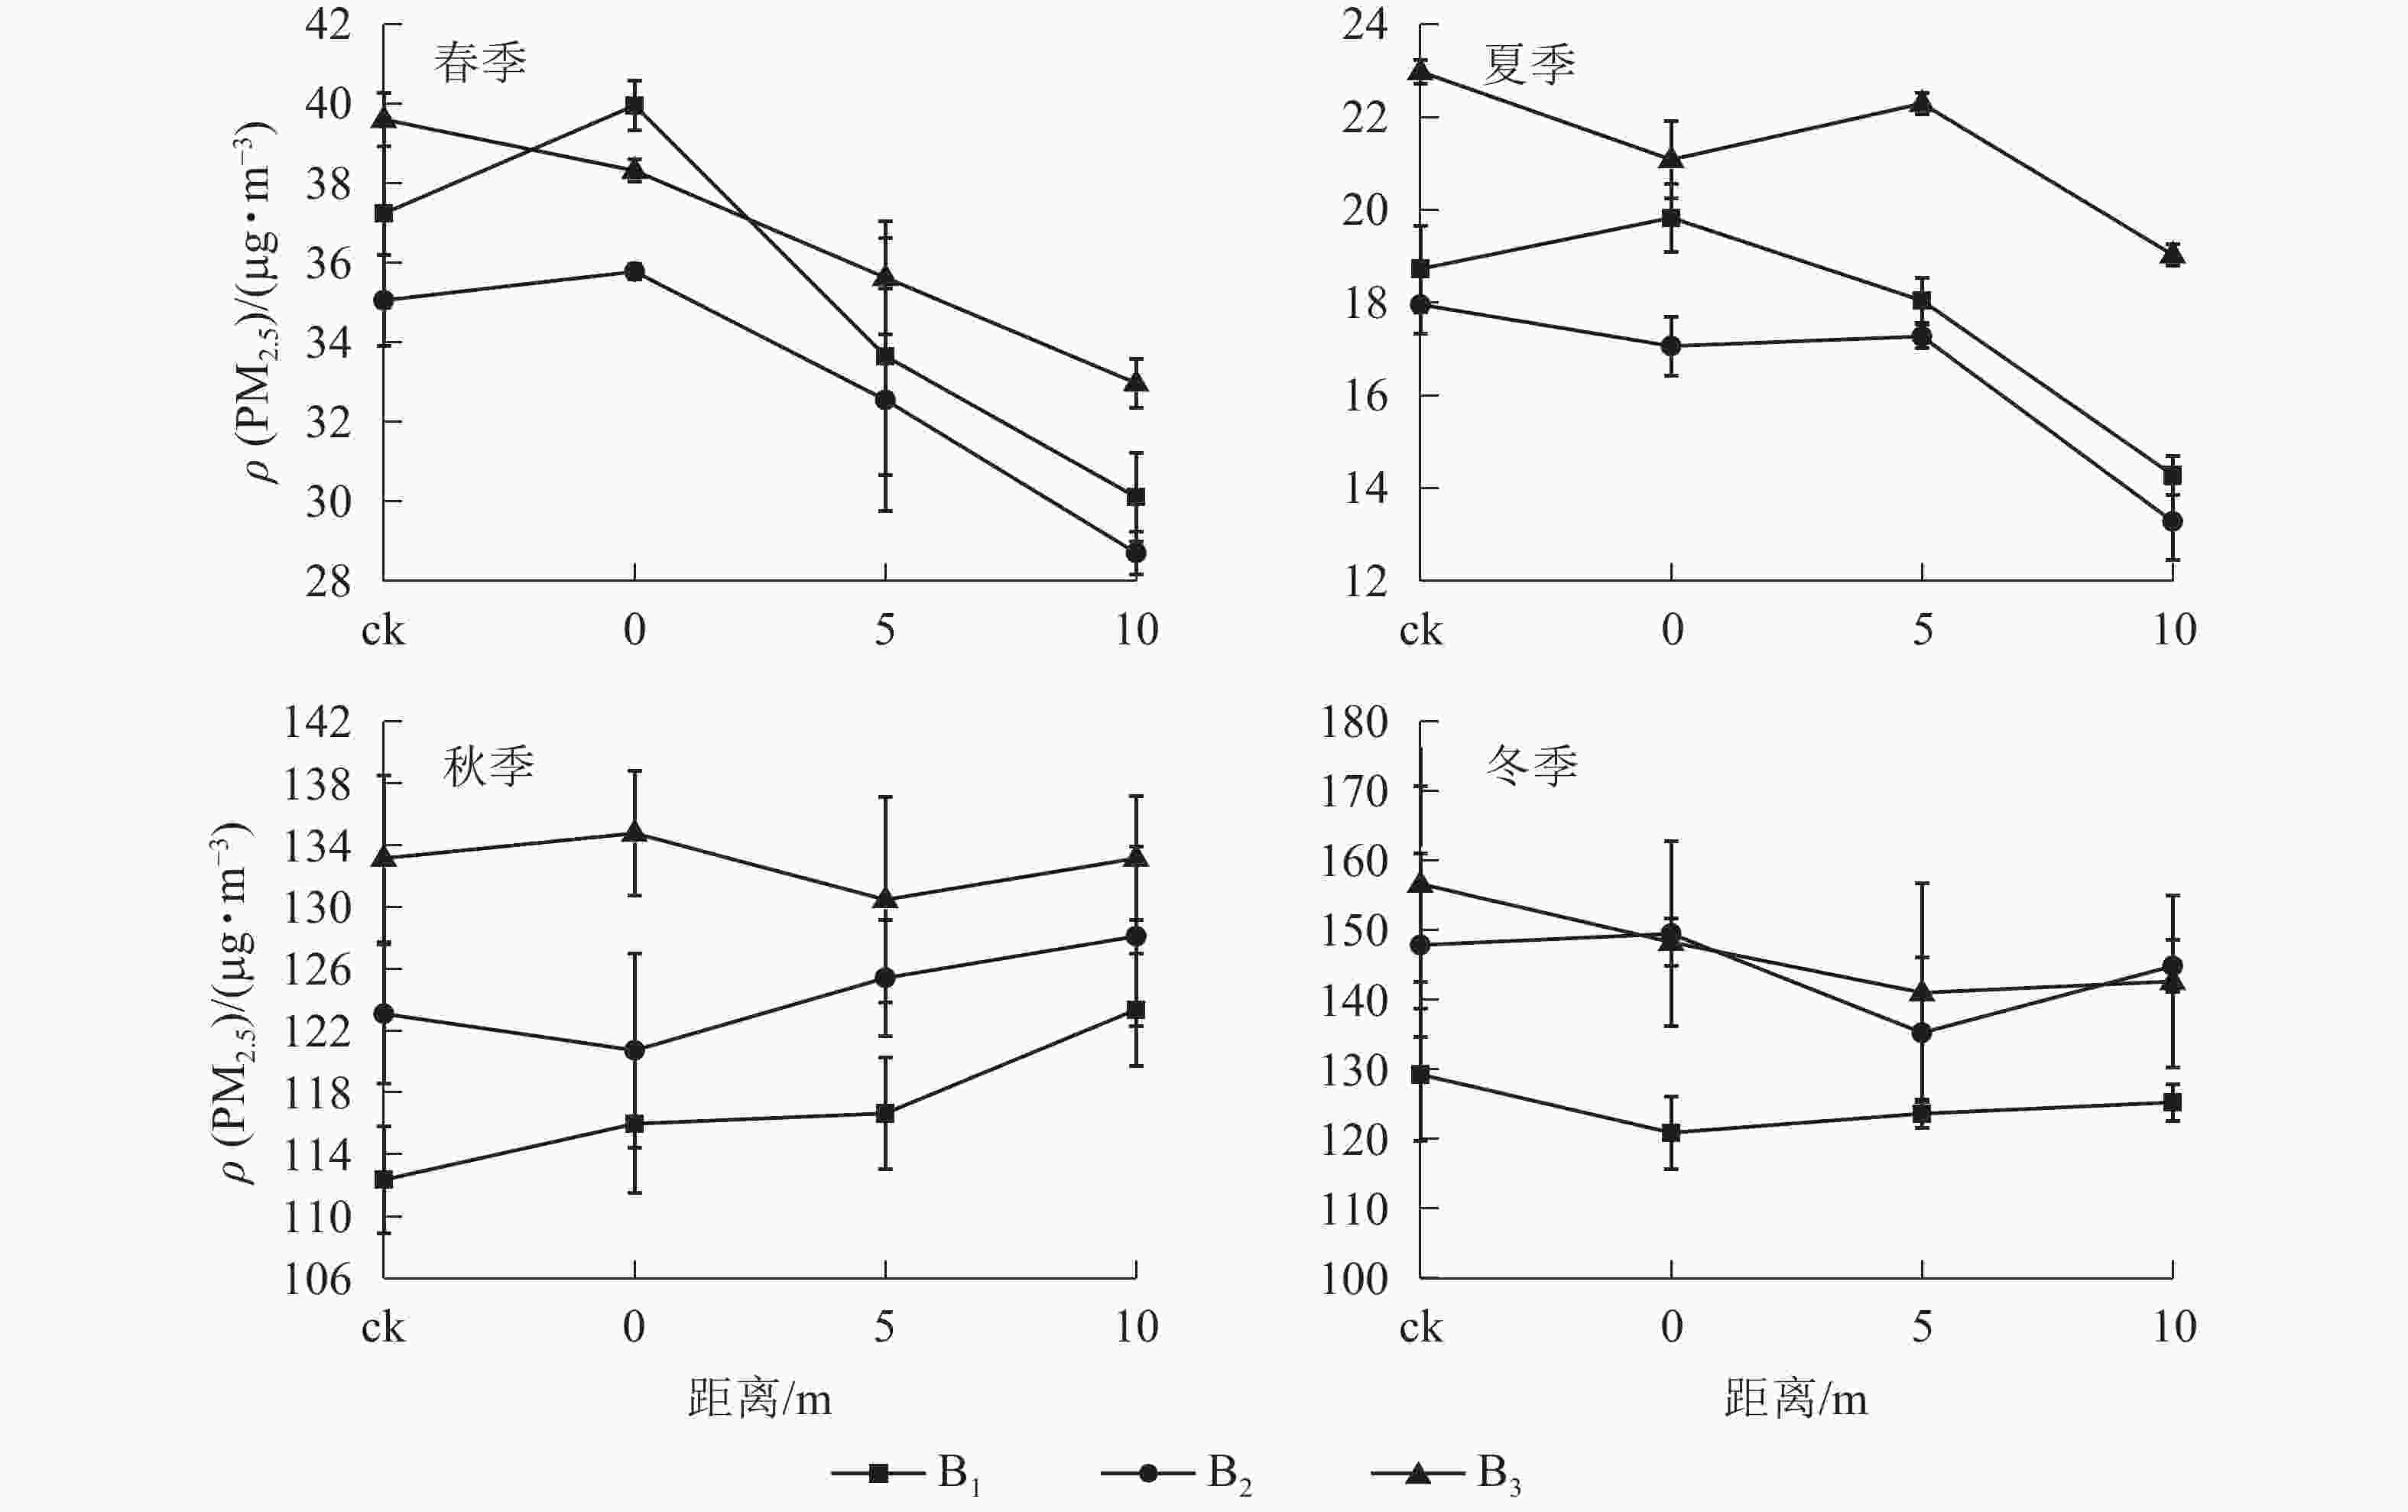
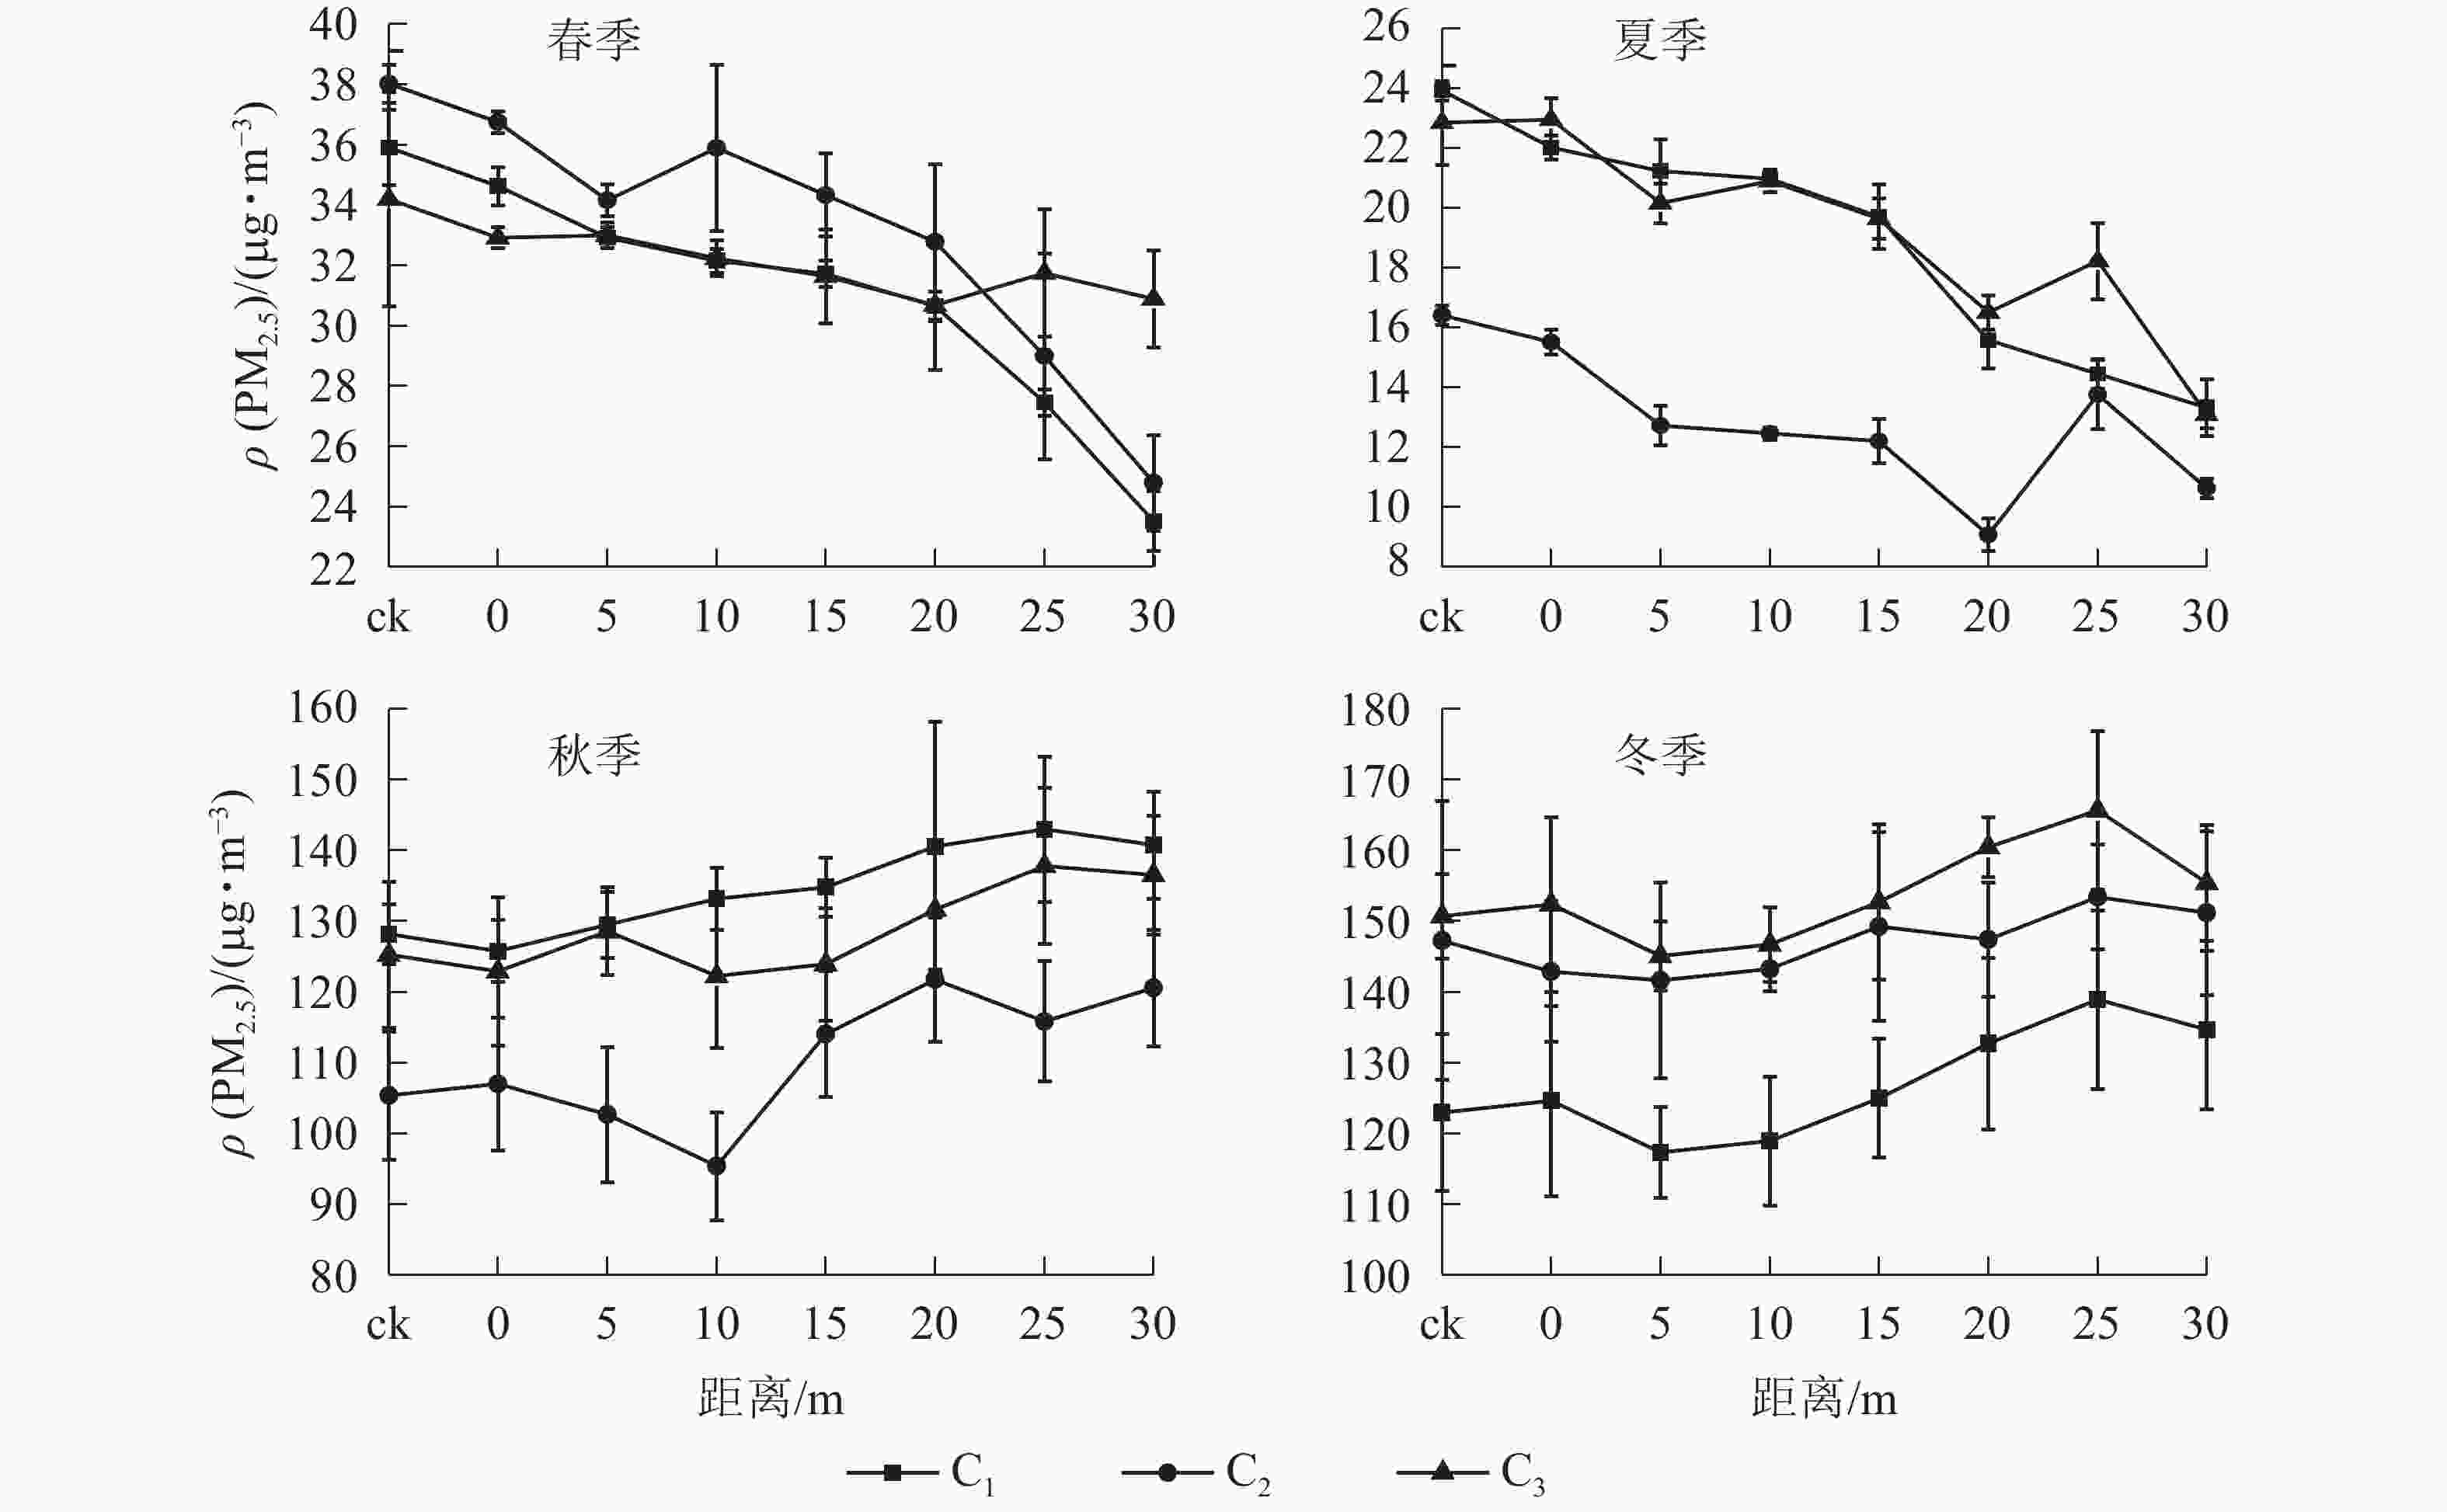
PM2.5在水平空间上的变化因季节表现出差异(图2~4)。春夏季节,PM2.5质量浓度在不同水平梯度(10、20、30 m)中表现为从ck向林内逐渐递减,即PM2.5质量浓度从大到小依次为10、20、30 m,减少幅度为12.53%~16.79%。秋冬两季,PM2.5质量浓度则从ck向林内呈递增趋势,具体表现为从林带边缘1 m处开始增加,15~25 m处达到峰值,25 m之后逐渐减少,30 m位置处达到最低值。对比ck发现,PM2.5质量浓度在0~25 m以内高于ck,只在25~30 m处低于ck,减少幅度为4.37%~10.76%,且表现出林带宽度越大,阻滞率越高的趋势。
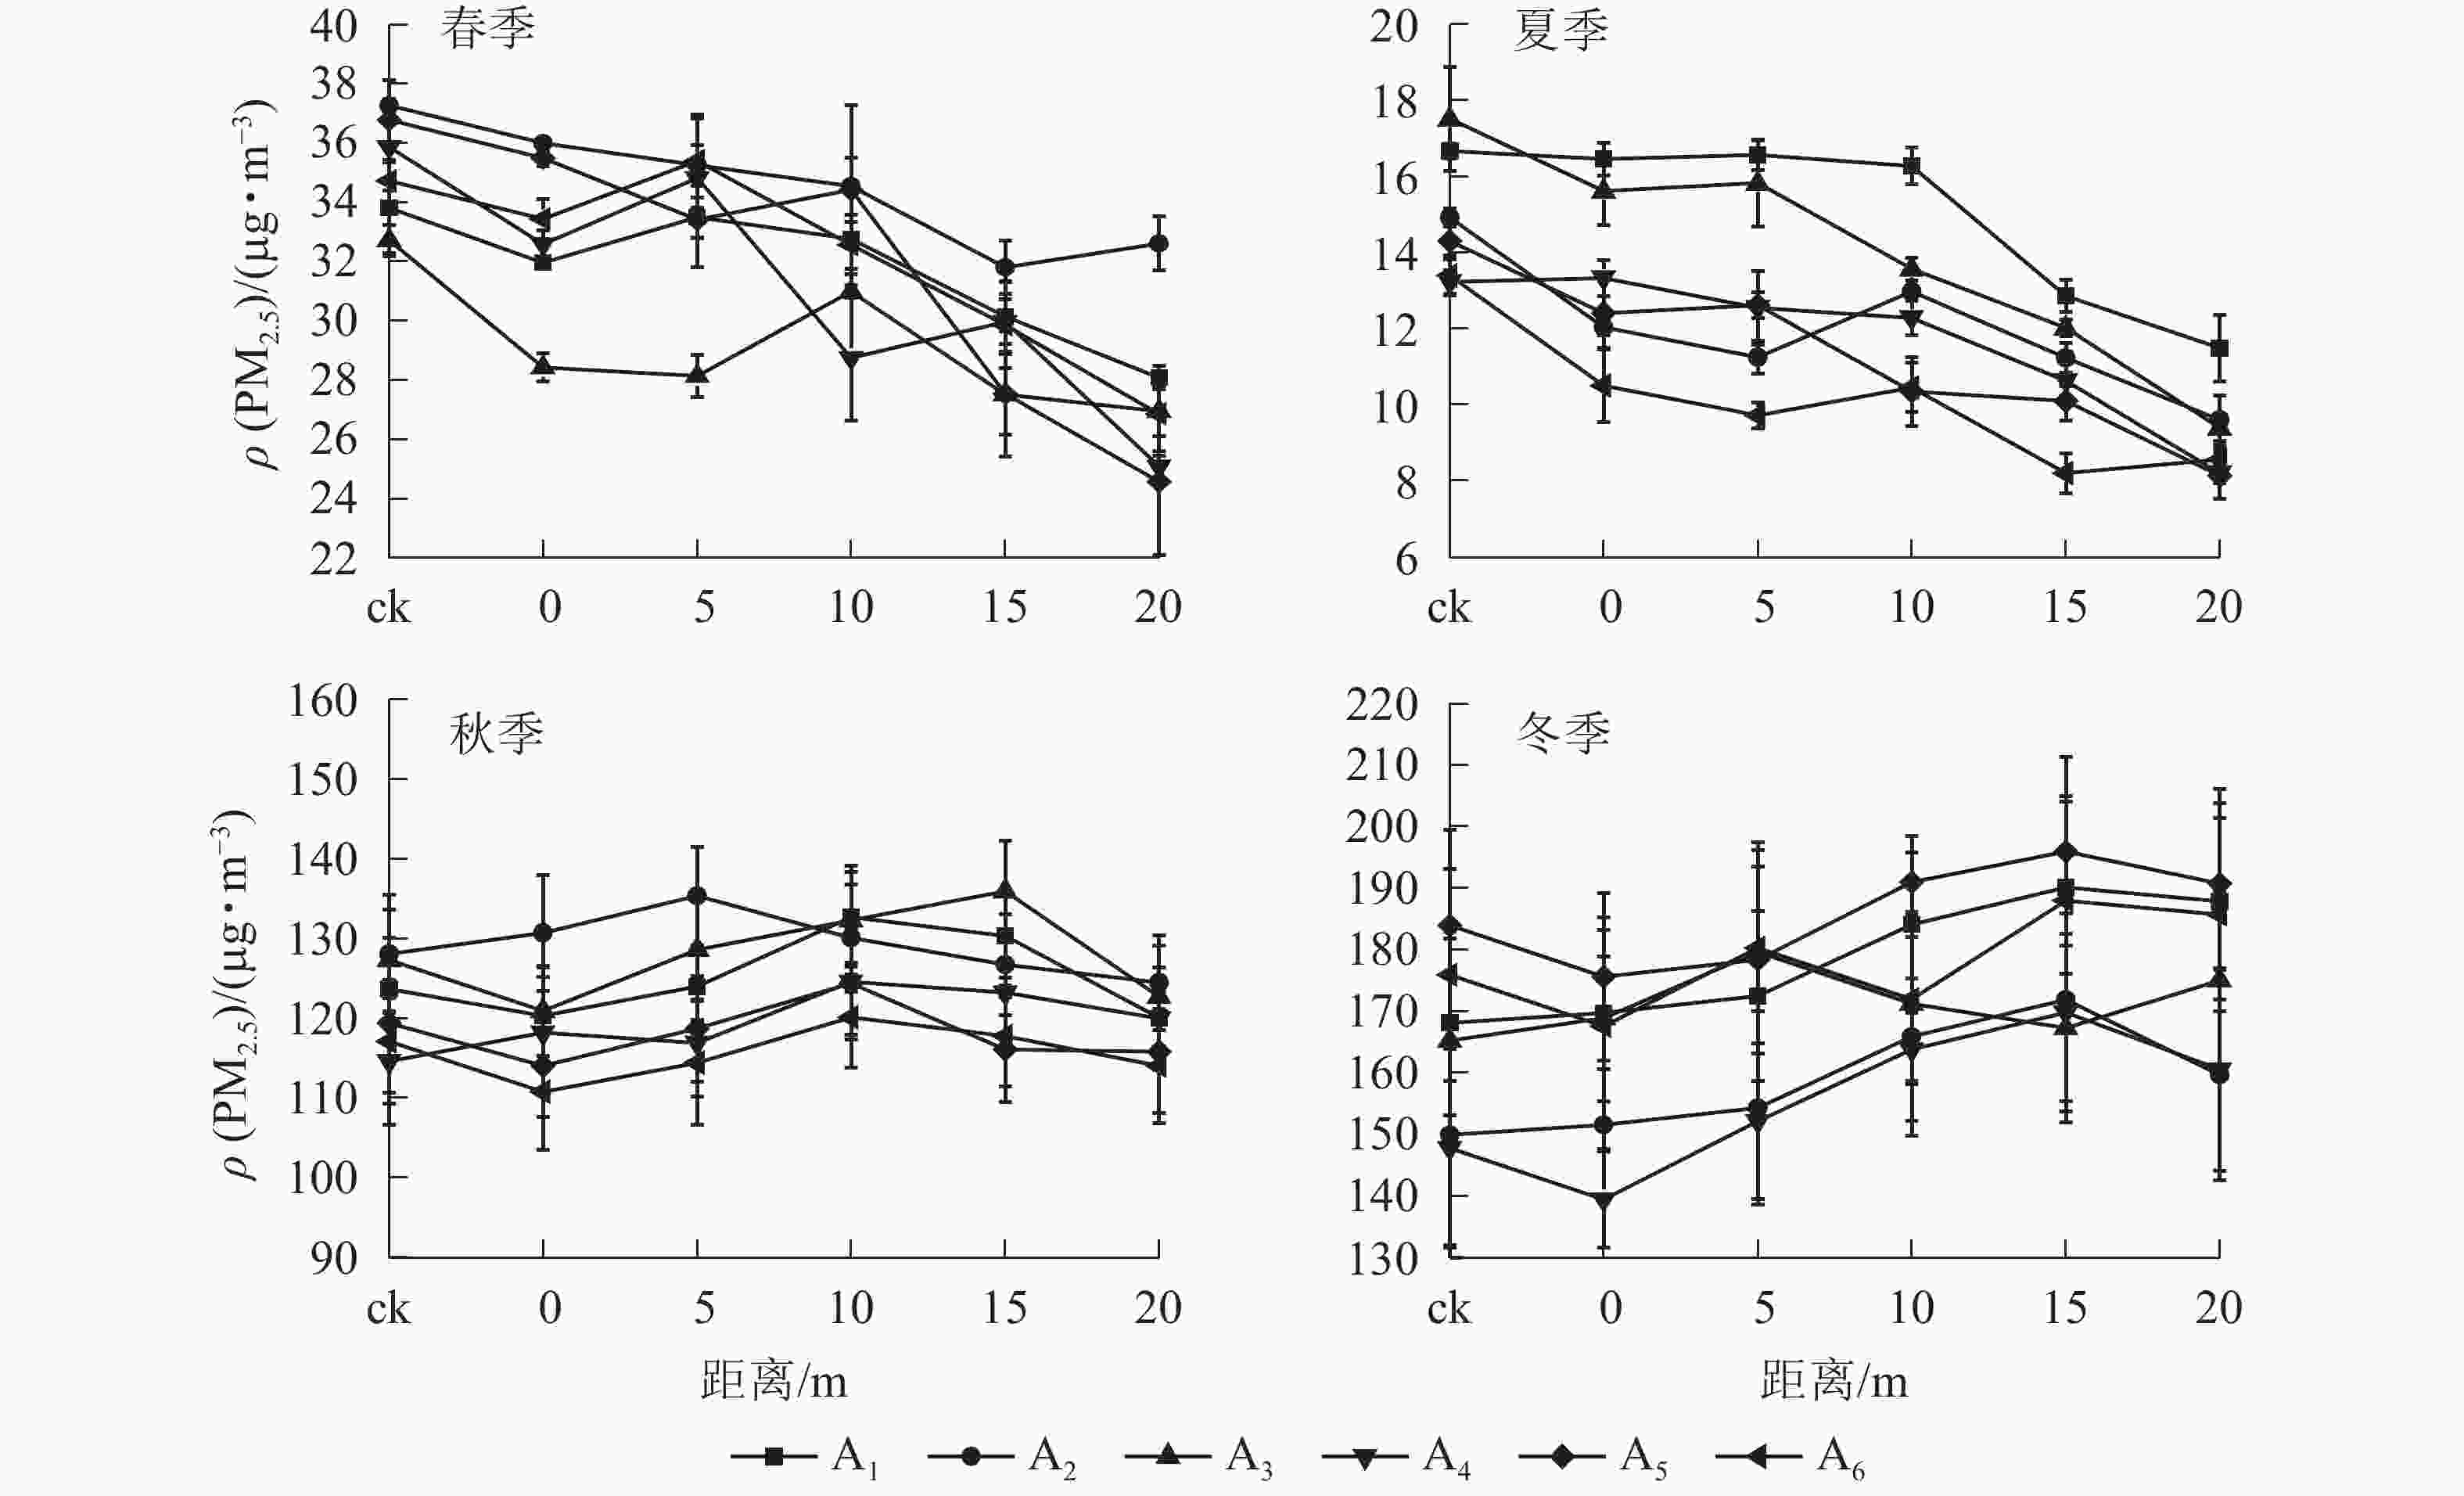
图 2 A结构城市道路林PM2.5水平空间变化特征
Figure 2. Horizontal spatial variation characteristics of PM2.5 in urban forests with A structure
-
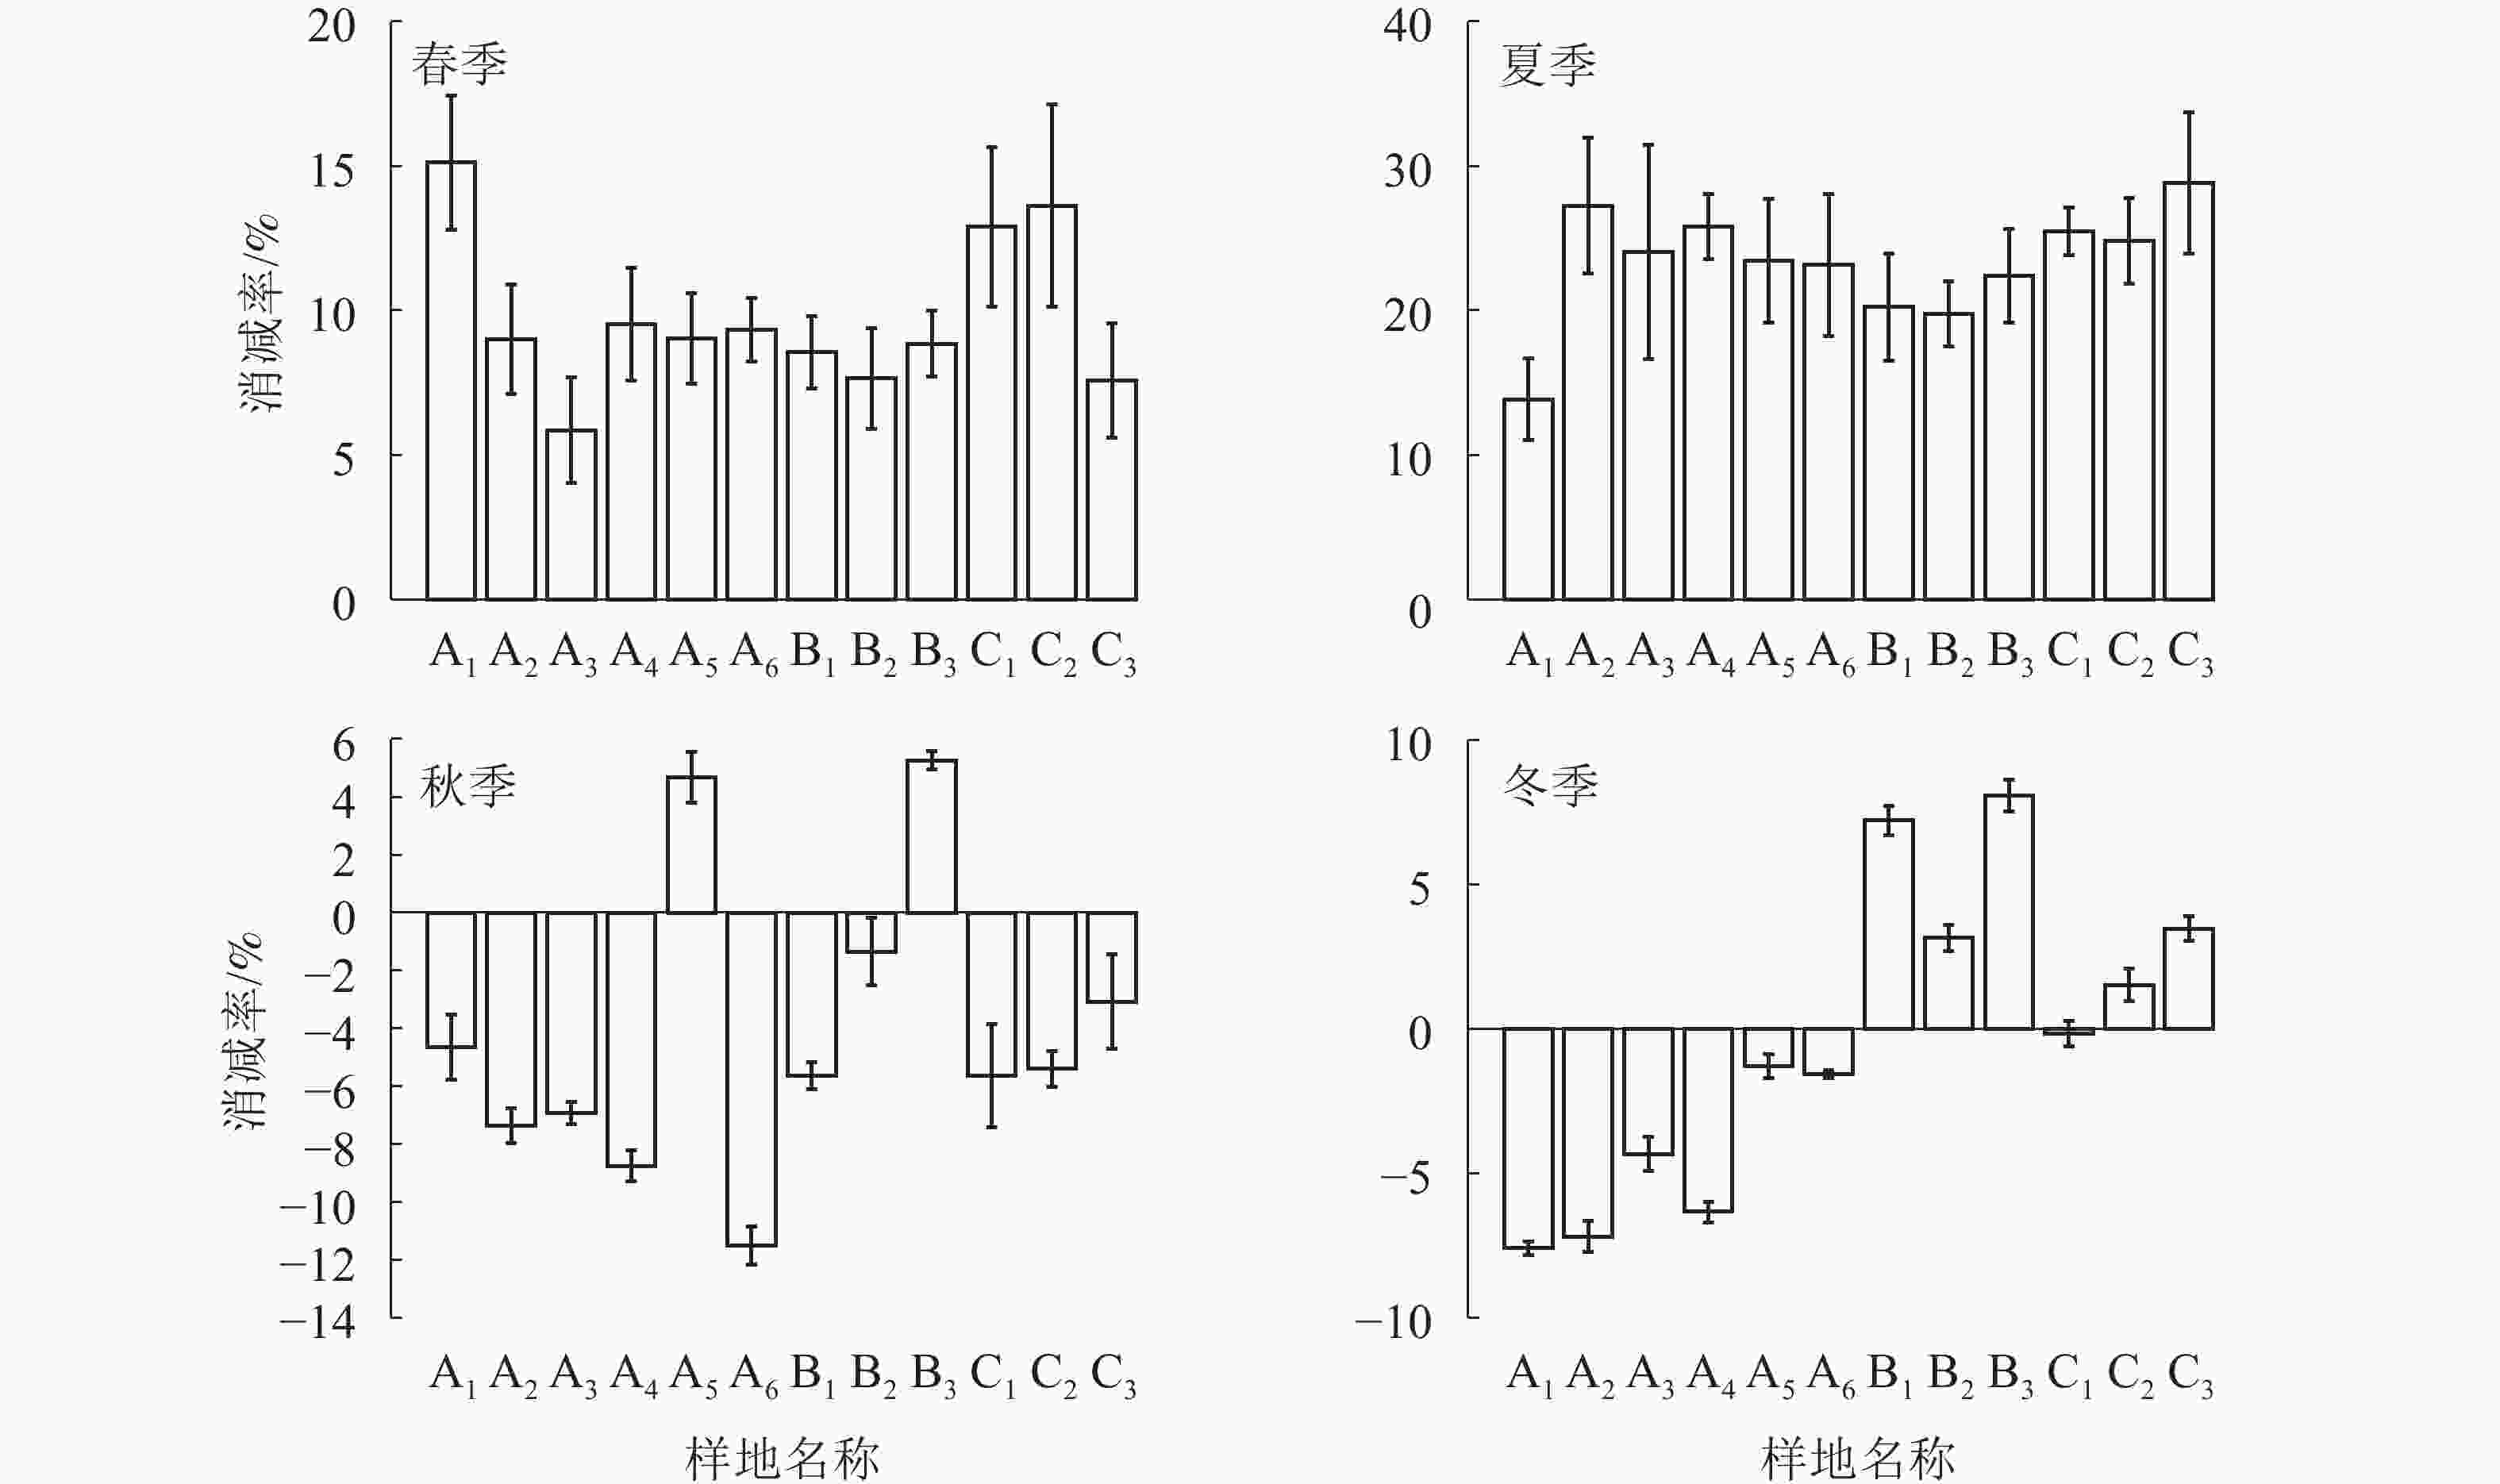
根据图5可知:春季,12种道路林对PM2.5均有阻滞效果,减幅最高的是A1(针阔混交乔木)、C1(乔灌草)、C2(乔灌草),分别减少15.12%、12.89%、13.63%,显著高于其他林带(5.86%~9.52%)(P<0.05);夏季,减幅最高的是C3(乔灌草)、A2(针阔混交乔木),分别减少28.84%、27.26%,其他林带平均减幅为13.86%~25.78%。可见,夏季雨水多,林带内植物经过风力和雨水的冲刷后滞尘能力较强。秋季,林带滞尘效果均较差,且差异性显著(P<0.05),只有A5(针阔混交乔木)、B3(单排乔木)有正消减,平均减幅分别为4.68%和5.62%,其他林带均为负值(−1.35%~−11.50%)。冬季削减能力也较差,且差异性显著(P<0.05),只有B1~B3(单排乔木)和乔灌草结构(C2、C3)阻滞率为正值,分别为7.22%、3.15%、8.08%、1.53%、3.47%,其他均为负值(−0.17%~−7.59%)。
-
如表5所示:在一定范围内,PM2.5质量浓度与风速存在负相关(P<0.05),春、秋、冬3个季节相关性分别达到显著、极显著、显著(r=−0.619 0、−0.862 0、−0.680 0),夏季相关不显著;与相对湿度存在正相关(P<0.05),春、夏2季相关性达到显著、极显著(r=0.670 0、0.767 0),其他季节相关性不显著;与气温存在正相关关系(P<0.05),秋、冬2季相关性达到极显著(r=0.924 0、0.853 0),其他季节相关性不显著。
表 5 PM2.5质量浓度与气象因子的偏相关系数
Table 5. Partial correlation coefficient between PM2.5 concentration and meteorological factors
季节 风速 相对湿度 气温 春季 −0.619 0* 0.670 0* 0.440 0 夏季 −0.508 0 0.767 0** 0.307 0 秋季 −0.862 0** 0.553 0 0.924 0** 冬季 −0.680 0* 0.025 0 0.853 0** 说明:*在0.05水平上显著相关,**在0.01水平上显著相关 -
由表6可知:PM2.5阻滞率与气象因子存在一定的相关性,4个季节与风速基本呈负相关,但相关性不显著;PM2.5阻滞率与相对湿度在秋季达到极显著正相关(P<0.01,r=−0.847 0),其他季节均不显著;与气温存在负相关关系(P<0.05),秋、冬2个季节下相关性分别达到极显著、显著(r=−0.862 0、r=−0.654 0),其他季节相关性不显著。
表 6 城市道路林PM2.5阻滞率与气象因子的偏相关系数
Table 6. Partial correlation coefficient between PM2.5 block rate and meteorological factors in urban road forests
季节 风速 相对湿度 气温 春季 −0.571 0 −0.183 0 −0.301 0 夏季 0.135 0 0.075 0 −0.226 0 秋季 −0.150 0 0.847 0** −0.862 0** 冬季 −0.299 0 0.517 0 −0.654 0* 说明:*在0.05水平上显著相关,**在0.01水平上显著相关 -
城市中的PM2.5主要来源于生活排放、地面扬尘和交通排放等。PM2.5的变化和人们的生活习惯密切相关,而其沉降是一个复杂的过程,气流运动、环境因子等因素都可能会对PM2.5的沉降产生影响。本研究中,道路中(ck)PM2.5日变化规律均表现为早晚高,中间低,峰值出现在8:00和18:00,主要原因是此时正值上下班高峰期,道路上车辆增加,导致排放的颗粒物增加,其次是来往的车辆会引起地面扬尘。而林带内PM2.5日变化与道路一致,这说明林带对PM2.5的阻滞作用有协同作用。早晚温度较低,湿度较大,不利于大气的输送和扩散,因此导致PM2.5在林内外积聚,不易扩散[15-16];正午前后,车辆减少,气温升高,相对湿度减小,太阳光照增强,大气对流和湍流强烈,有利于大气的扩散运动[17],PM2.5由林缘向林内逐渐扩散,同时,林内植物对颗粒物发挥了阻滞作用,故PM2.5质量浓度下降且低于早晚[18]。
一般来说,PM2.5存在季节性差异。前人研究表明:PM2.5质量浓度年变化从高到低依次为冬季、春季、秋季、夏季[19]。也有学者认为:PM2.5质量浓度秋季高于春季[20]。本研究结果显示:PM2.5质量浓度年变化从高到低依次为冬季、秋季、春季、夏季,与前人结果存在一定差异;这种季节性规律的主要原因应该与大气扩散条件的季节差异以及排放源的冬、夏季差异有关。研究表明:降水通过惯性碰并过程和布朗扩散作用可冲刷附着在叶面上的颗粒物,同时也能有效减少空气中颗粒物含量及地表扬尘,从而增加植物叶片对颗粒物的循环吸附能力[21-22]。泰安市夏天雨水充沛,对PM2.5的冲刷效果明显,同时,气温高,大气垂直对流作用强,这些因素使得PM2.5不易聚集,质量浓度减少,故夏季达到最低[20];而秋冬季燃煤排放源增加及雾霾天气多发,导致在秋冬季居高不下。而春秋季节的差异主要和植物的生长期、气候变化等有关[23]。相关植物和气象因素是影响空气中PM2.5阻滞效应的主要因素。本研究表明:PM2.5在水平空间上具有季节性差异,其主要原因是城市道路污染源向四周持续线性扩散输送污染物,表现为进入慢、累积慢、消散慢的特点,道路林内的植被在吸附PM2.5时过程缓慢,短时间内容易累积在林内,随着林带宽度的增加,林内参与削减PM2.5的植被增加,因此,春夏季节呈现ck至林内逐渐降低的趋势。但秋冬季节,在林带内25 m处,PM2.5质量浓度增加,这可能是由于此处的的风速降低,导致PM2.5沉降[18, 24]。
不同配置模式的城市道路林对PM2.5的阻滞率季节差异明显。本研究结果表明:春夏季节对PM2.5有正向的阻滞效应,阻滞能力最强的是乔灌草结构,其次是针阔混交乔木结构、单排乔木结构;主要原因是乔灌草结构具有良好的降低风速的功能和立体化滞尘效果;而秋冬季节,只有A5(针阔混交乔木)、B1~B3(单排乔木)和乔灌草(C2、C3)阻滞效果较好,其余均富集PM2.5。这可能和样地内树种组成以及环境因子有关。本研究样地内种植有松柏类和高大阔叶类乔木植物,松柏类针叶树针叶细长、枝茎复杂且全年有叶期,其吸附颗粒物的能力在秋冬季节强于阔叶树,且能够分泌树脂,可减少吸附颗粒物的弹回比例[25-27];而乔木类树种林冠层茂盛、叶面积指数大、林分郁闭度较高等比灌木和草本植物更能有效阻滞大气颗粒物,同时对空气流动的影响比针叶类乔木更强,更易使周边空气形成湍流,从而为颗粒物沉降提供有利条件,促进植物对颗粒物的吸附[28-29]。但大气颗粒物的组成成分复杂,不同树种的滞尘能力又有很大差异[30],对于单一树种的滞尘能力需进一步研究和探讨。
一般来说,风速与PM2.5呈负相关关系,而温湿度呈正相关关系。本研究结果显示:气象因子和PM2.5相关关系与前人的研究结果一致,但是阻滞率与气象因子的相关关系变具有季节性。本研究表明:阻滞率和气温为负相关关系,与吴兑[31]的研究结果相反。这可能是植物叶面气孔的张合有关;春秋冬季阻滞率与风速成负相关,主要是和风力大小有关,合适的风力(5 m·s−1)可通过水平输送和稀释扩散效应降低颗粒物浓度,风力过强或过弱都可能会对植物吸附能力产生反效果,也有学者认为:风力大时较风力小时吸附效果更好[32]。春季阻滞率与相对湿度呈负相关关系,这和吕铃钥等[23]的研究结构相反。这可能和春季植物生长有关。
本研究结果表明:林带对PM2.5阻滞效应表现出强烈的季节性,受车辆、气候和植被类型等多维生态因子的交互作用,尤其是植被的作用机制,因此,在探讨道路林对PM2.5的作用时应充分考虑多维生态因子的协同作用。建议在城市道路林建设中合理增加林带宽度及加大常绿针叶乔木和灌草的比例。
Analysis of blocking effects of urban roadside forests on PM2.5
-
摘要:
目的 分析细颗粒物(PM2.5)的动态变化格局及城市道路林对其的阻滞作用,并进一步探索何种配置的林带所发挥的防尘抑霾效果最佳。 方法 选取了3种结构共12种配置模式的城市道路林,首先分析了林带内外PM2.5的日动态、年际动态和水平空间的变化规律;然后通过减尘率评价不同模式林带对PM2.5的阻滞作用;最后通过减尘率和小气候因子进行Pearson相关性分析,探讨影响植被减尘率的可能因素。 结果 PM2.5日动态变化呈早晚高中间低的趋势,峰值出现在8:00和18:00,10:00和14:00最低;年动态规律表现为冬季最高,其次是秋季和春季,夏季最低。PM2.5在林带内水平空间中的变化规律因季节不同而有所差异,春夏季节,林缘至林内呈逐渐递减趋势;秋冬季节,林缘至林内25 m处呈递增趋势,在25~30 m处下降且低于林外林缘处。对PM2.5减尘率最高的是乔灌草结构,其次是针阔混交乔木结构,单排乔木结构的减尘率最低;春夏季,12种道路林对PM2.5阻滞率为正值,秋冬季只有A5(针阔混交乔木)、B1~B3(单排乔木)和C2、C3(乔灌草)为正值,其余均为负值。小气候因子与PM2.5关系存在季节差异,PM2.5浓度在春秋冬季与风速呈显著负相关(P<0.05),春夏季与温度呈显著正相关(P<0.05),秋冬季与相对湿度呈正相关(P<0.05);林地PM2.5阻滞率在秋季和温度呈显著正相关(P<0.05),在秋冬季和相对湿度呈显著正相关(P<0.05),林地阻滞率和风速相关性不显著。 结论 在城市道路林建设中合理增加林带宽度及加大常绿针叶乔木和灌草的比例对于降低PM2.5质量浓度效果显著。图5表6参32 Abstract:Objective The present study is to analyze the dynamic change patterns of fine particulate matter (PM2.5) and the blocking effects of urban road forests, and further explore which type of forest belt has the optimal dust and haze control effects. Method Three types of urban road forests with a total of 12 configurations were selected. Firstly, the daily dynamics, interannual dynamics and horizontal spatial variations of PM2.5 in and out of the forest belt were analyzed. Then, the dust reduction rate was used to evaluate the blocking effect of different forest belts on PM2.5. Finally, the Pearson correlation analysis was carried out between the dust reduction rate and microclimate factors to explore the possible factors affecting the dust reduction rate of vegetation. Result The results showed that concentrations of PM2.5 in roadside forests were highest around 8:00 and 18:00 and lowest at 10:00 and 14:00. The annual dynamic pattern indicated the most obvious change in winter (136.74−194.18 μg·m−3), followed by autumn (63.48−104.96 μg·m−3), spring (28.68−36.31 μg·m−3), and summer (13.30−19.13 μg·m−3). The variation of PM2.5 in the horizontal space of the forest belt varies with seasons. In the spring and summer, PM2.5 gradually decreased from the edge of the forest to the interior of the forest, while in the autumn and winter, the dust margin increased at 25 m in the forest, but decreased at 25−30 m and was lower than the outer edge of the forest. The blocking rate of PM2.5 was highest in arbor-shrub-grass structure, followed by mixed conifer and broadleaved forest structure, and lowest in uniform arbor type. In spring and summer, the blocking rate of 12 kinds of roadside forests on PM2.5 was positive, while in autumn and winter only A5 (mixed conifer and broadleaved forest), B1, B2, and B3 (uniform arbor type) and C2 and C3 (arbor-shrub-grass structure) were positive, and the rest were negative. There were seasonal differences between microclimate factors and PM2.5. PM2.5 concentration was negatively correlated with wind speed in spring, autumn and winter, but positively correlated with relative humidity in autumn and winter, as well as temperature in spring and summer. The block rate of PM2.5 in roadside forests showed a significant positive correlation with temperature in autumn and relative humidity in autumn and winter, but had no significant correlation with other microclimate factors. Conclusion The belt width, the proportion of evergreen coniferous trees and shrubs of urban roadside forests should be reasonably increased to reduce PM2.5 and improve air quality. [Ch, 5 fig. 6 tab. 32 ref.] -
Key words:
- PM2.5 /
- urban roadside forest /
- configuration mode /
- spatiotemporal variation /
- blocking effect /
- microclimate factor
-
表 1 12种城市道路林样地的植被组成
Table 1. Vegetation composition of 12 urban road forest plots
群落结构 样地名称 植被组成 针阔混交乔木 A1 圆柏Sabina chinensis+白皮松Pinus bungeana+银杏Ginkgo biloba+雪松Cedrus deodara+柿树Diospyros kaki+垂 柳Salix babylonica-麦冬Ophiopogon japonicus A2 国槐Sophora japonica+紫叶李Prunus cerasifera+小龙柏Sabina chinensis A3 悬铃木Platanus acerifolia+雪松Cedrus deodara+白皮松 A4 栾树Koelreuteria paniculata+紫叶李+黑松Pinus thunbergii A5 色木槭Acer mono+紫叶李+圆柏 A6 雪松+国槐+色木槭+银杏-狗尾草Setaria viridis 单行乔木 B1 国槐+小龙柏 B2 悬铃木+小龙柏 B3 雪松-麦冬Ophiopogon japonicus 乔灌草 C1 旱柳Salix matsudana+圆柏+紫叶李+银杏+栾树-日本晚樱Cerasus yedoensis+石楠Photinia serrulata+大叶黄杨 Euonymus japonicus-鸢尾Iris tectorum C2 油松Pinus tabuliformi+柿树Diospyros kaki+白蜡Fraxinus americana+雪松+圆柏-紫薇Lagerstroemia indica-鸢 尾+细叶结缕草Zoysia tenuifolia C3 银杏+油松+麻栎Quercus acutissima+色木槭+柿树+垂柳-紫叶小檗Berberis thunbergii+龙柏-早熟禾Poa annua+狗尾草Setaria viridis 表 2 12种城市道路林样地的林分特征
Table 2. Stand characteristics of 12 urban road forest plots
样地
名称郁闭度 乔木层平
均冠幅/m乔木层
高度/m灌木层
盖度/%灌木层
高度/m草本层
盖度/%草本层
高度/mA1 0.7 2.35 5.20 − − 15 0.25 A2 0.5 3.10 4.65 7 0.50 − − A3 0.7 4.40 7.70 − − − − A4 0.8 3.20 5.50 − − − − A5 0.6 3.35 5.40 10 0.50 − − A6 0.5 3.10 7.00 − − 10 0.30 B1 0.5 4.50 7.50 25 0.45 − − B2 0.6 5.40 8.50 15 0.50 − − B3 0.7 5.20 7.80 − − 10 0.20 C1 0.4 2.72 5.04 40 1.30 65 0.30 C2 0.4 2.28 4.78 40 1.50 80 0.28 C3 0.5 2.05 4.85 60 0.60 45 0.35 说明:“−”表示样地内无灌木或草本 表 3 空气质量分级指数及对应PM2.5质量浓度限值
Table 3. Air quality grading index and corresponding PM2.5 concentration limit
空气质量指数/
(μg·m−3)污染等级
(六级)PM2.5日均值/
(μg·m−3)PM2.5年均值/
(μg·m−3)0~50 优 ≤35 ≤15 51~100 良 35~75 15~35 101~150 轻度 76~115 36~75 151~200 中度 116~150 76~115 201~300 重度 151~250 116~150 >300 严重污染 >250 >150 表 4 城市道路林内外PM2.5季节均值
Table 4. Seasonal mean value of PM2.5 inside and outside urban roads
样地名称 样地结构 PM2.5变化值/(μg·m−3) 春季 夏季 秋季 冬季 季节均值 A1 针阔混交乔木 28.68±2.80 ab 19.13±1.44 d 90.16±6.85 g 174.09±16.35 e 78.01±6.86 e A2 针阔混交乔木 33.63±2.75 c 14.15±2.22 ab 78.86±8.29 d 176.77±16.05 f 75.86±7.33 d A3 针阔混交乔木 28.0±1.42 a 14.91±1.53 abc 98.46±7.67 i 185.82±16.54 g 81.80±6.79 f A4 针阔混交乔木 30.24±2.42 b 13.30±1.51 a 85.38±9.16 f 136.74±14.54 b 66.41±6.91 a A5 针阔混交乔木 33.28±1.83 c 15.60±1.54 bc 96.46±9.17 h 138.05±14.95 b 70.85±6.87 b A6 针阔混交乔木 31.62±1.54 c 16.55±1.81 c 76.47±8.99 c 134.53±16.11 a 64.79±7.11 a B1 单行乔木 34.24±1.58 cd 15.75±1.65 bc 104.07±6.81 k 136.91±10.08 b 72.74±5.03 c B2 单行乔木 32.68±1.15 c 16.11±1.78 c 104.96±6.18 k 140.22±10.35 c 73.49±4.87 c B3 单行乔木 36.31±1.87 e 14.00±1.82 ab 81.45±7.00 e 150.10±12.58 d 70.46±5.82 b C1 乔灌草 31.72±2.20 c 13.96±1.54 ab 73.58±11.12 b 175.77±14.89 f 73.76±7.44 c C2 乔灌草 33.25±3.07 c 15.32±1.75 bc 63.48±11.58 a 192.32±18.92 h 76.09±8.83 d C3 乔灌草 31.87±1.93 de 13.38±1.66 a 80.94±10.62 e 175.90±20.62 f 75.52±8.71 d ck 35.51±4.09 de 18.88±2.04 d 101.33±14.86 j 194.18±36.42 i 87.40±14.35 g 表 5 PM2.5质量浓度与气象因子的偏相关系数
Table 5. Partial correlation coefficient between PM2.5 concentration and meteorological factors
季节 风速 相对湿度 气温 春季 −0.619 0* 0.670 0* 0.440 0 夏季 −0.508 0 0.767 0** 0.307 0 秋季 −0.862 0** 0.553 0 0.924 0** 冬季 −0.680 0* 0.025 0 0.853 0** 说明:*在0.05水平上显著相关,**在0.01水平上显著相关 表 6 城市道路林PM2.5阻滞率与气象因子的偏相关系数
Table 6. Partial correlation coefficient between PM2.5 block rate and meteorological factors in urban road forests
季节 风速 相对湿度 气温 春季 −0.571 0 −0.183 0 −0.301 0 夏季 0.135 0 0.075 0 −0.226 0 秋季 −0.150 0 0.847 0** −0.862 0** 冬季 −0.299 0 0.517 0 −0.654 0* 说明:*在0.05水平上显著相关,**在0.01水平上显著相关 -
[1] DAN Liang, MA Chao, WANG Yunqi, et al. Quantifying PM2.5 capture capability of greening trees based on leaf factors analyzing [J]. Environ Sci Poll Res, 2016, 23(21): 21176 − 21186. [2] 柴一新,祝宁,韩焕金. 城市绿化树种的滞尘效应: 以哈尔滨市为例[J]. 应用生态学报, 2002, 13(9): 1121 − 1126. CHAI Yixin, ZHU Ning, HAN Huanjin. Dust removal effect of urban tree species in Harbin [J]. Chin J Appl Ecol, 2002, 13(9): 1121 − 1126. [3] 孙颖,潘月鹏,李杏茹,等. 京津冀典型城市大气颗粒物化学成分同步观测研究[J]. 环境科学, 2011, 32(9): 2732 − 2740. SUN Ying, PAN Yuepeng, LI Xingru, et al. Chemical composition and mass closure of particulate matter in Beijing, Tianjin and Hebei Megacities, Northern China [J]. Environ Sci, 2011, 32(9): 2732 − 2740. [4] 粟志峰,刘艳,彭倩芳. 不同绿地类型在城市中的滞尘作用研究[J]. 干旱环境监测, 2002, 16(3): 162 − 163. SU Zhifeng, LIU Yan, PENG Qianfang. Study on dust detention functions of the different greenland [J]. Arid Environ Monit, 2002, 16(3): 162 − 163. [5] CHOU C K, LEE C T, CHENG M T, et al. Seasonal variation and spatial distribution of carbonaceous aerosols in Taiwan [J]. Atmos Chem Phys, 2010, 10(19): 7079 − 7113. [6] 王京,王初,陈振楼. 贵阳市城区近地面PM10/PM2.5及重金属污染水平研究[J]. 环境科学与技术, 2011, 34(4): 74 − 76. WANG Jing, WANG Chu, CHEN Zhenlou. Heavy metal pollution of PM10/PM2.5 near-surface in Guiyang [J]. Environ Sci Technol, 2011, 34(4): 74 − 76. [7] TALLIS M, TAYLOR G, SINNETT D, et al. Estimating the removal of atmospheric particulate pollution by the urban tree canopy of London, under current and future environments [J]. Landscape Urban Plann, 2011, 103(2): 129 − 138. [8] 刘旭辉,余新晓,张振明,等. 林带内PM10、PM2.5污染特征及其与气象条件的关系[J]. 生态学杂志, 2014, 33(7): 1715 − 1721. LIU Xuhui, YU Xinxiao, ZHANG Zhenming, et al. Pollution characteristics of atmospheric particulates in forest belts and their relationship with meteorological conditions [J]. Chin J Ecol, 2014, 33(7): 1715 − 1721. [9] 邱玲,刘芳,张祥,等. 城市公园不同植被结构绿地削减空气颗粒物浓度研究[J]. 环境科学研究, 2018, 31(10): 1685 − 1694. QIU Ling, LIU Fang, ZHANG Xiang, et al. Reducing effect of air particulate matter concentration by green spaces with different vegetation structure in city parks [J]. Res Environ Sci, 2018, 31(10): 1685 − 1694. [10] 王会霞,石辉,王彦辉. 典型天气下植物叶面滞尘动态变化[J]. 生态学报, 2015, 35(6): 1696 − 1705. WANG Huixia, SHI Hui, WANG Yanhui. Dynamics of the captured quantity of particulate matter by plant leaves under typical weather conditions [J]. Acta Ecol Sin, 2015, 35(6): 1696 − 1705. [11] 张淑平,韩立建,周伟奇,等. 冬季PM2.5的气象影响因素解析[J]. 生态学报, 2016, 36(24): 7897 − 7907. ZHANG Shuping, HAN Lijian, ZHOU Weiqi, et al. Relationships between fine particulate matter(PM2.5) and meteorological factors in winter at typical Chinese cities [J]. Acta Ecol Sin, 2016, 36(24): 7897 − 7907. [12] 易心钰,彭映赫,廖菊阳,等. 森林植被与大气颗粒物的关系[J]. 植物科学学报, 2017, 35(5): 790 − 796. YI Xinyu, PENG Yinghe, LIAO Juyang, et al. A review of the relationship between forest vegetation and atmospheric particulate matter [J]. Plant Sci J, 2017, 35(5): 790 − 796. [13] 李坤,李传荣,许景伟,等. 3种典型道路景观林对诸城市夏季小气候条件的影响[J]. 生态环境学报, 2018, 27(6): 1060 − 1066. LI Kun, LI Chuanrong, XU Jingwei, et al. Effect of three typical road landscape forests on microclimate under summer weather in Zhucheng City [J]. Ecol Environ Sci, 2018, 27(6): 1060 − 1066. [14] 段敏杰,王月容,刘晶. 北京紫竹院公园绿地生态保健功能综合评价[J]. 生态学杂志, 2017, 36(7): 1973 − 1983. DUAN Minjie, WANG Yuerong, LIU jing. Comprehensive evaluation of ecological health functions of green space in Beijing Purple Bamboo Park [J]. Chin J Ecol, 2017, 36(7): 1973 − 1983. [15] 丛岭,翟杰休,马文梅,等. 林地和湿地大气颗粒物阻滞效果研究[J]. 生态环境学报, 2017, 26(6): 1017 − 1025. CONG Ling, ZHAI Jiexiu, MA Wenmei, et al. Research on the forest and wetland blocking effects of atmospheric particles [J]. Ecol Environ Sci, 2017, 26(6): 1017 − 1025. [16] 李素莉,杨军,马履一,等. 北京市交通干道防护林带内PM2.5浓度变化特征[J]. 西北林学院学报, 2015, 30(3): 245 − 252. LI Suli, YANG Jun, MA Lüyi, et al. Variations of PM2.5 concentrations inside the greenbelts along two urban traffic arteries in Beijing [J]. J Northwest For Univ, 2015, 30(3): 245 − 252. [17] 刘浩栋. 城市道路林内大气颗粒物的时空变化特征[D]. 泰安: 山东农业大学, 2017. LIU Haodong. Temporal and Spatial Variation Characteristics of Atmospheric Particulate Matter in Urban Road Forests[D]. Tai’an: Shandong Agricultural University, 2017. [18] 王成,郭二果,郄光发,等. 北京西山典型城市森林内PM2.5动态变化规律[J]. 生态学报, 2014, 34(19): 5650 − 5658. WANG Cheng, GUO Erguo, QIE Guangfa. Variations of PM2.5 in the west mountain of Beijing, China [J]. Acta Ecol Sin, 2014, 34(19): 5650 − 5658. [19] 蒋燕,陈波,鲁绍伟,等. 北京城市森林PM2.5质量浓度特征及影响因素分析[J]. 生态环境学报, 2016, 25(3): 447 − 457. JIANG Yan, CHEN Bo, LU Shaowei, et al. Analysis on characteristics and influential factors of PM2.5 mass concentration in Beijing’s urban forest [J]. Ecol Environ Sci, 2016, 25(3): 447 − 457. [20] 李华,杨世伦. 潮间带盐沼植物黏附悬浮颗粒物的差异性研究[J]. 海洋学报, 2010, 32(1): 114 − 119. LI Hua, YANG Shilun. Changes of suspended particulates adhering to salt marsh plants [J]. Acta Oceanol Sin, 2010, 32(1): 114 − 119. [21] HAN Lijian, ZHOU Weiqi, LI Weifeng, et al. Impact of urbanization level on urban air quality: a case of fine particles (PM2.5) in Chinese cities [J]. Environ Poll, 2014, 194: 163 − 170. [22] DAWSON J P, ADAMS P, PANDIS S N. Sensitivity of PM2.5 to climate in the Eastern US: a modeling case study [J]. Atmos Chem Phys, 2007, 7(3): 4295 − 4309. [23] 吕铃钥,李洪远,杨佳楠. 植物吸附大气颗粒物的时空变化规律及其影响因素的研究进展[J]. 生态学杂志, 2016, 35(2): 524 − 533. LÜ Lingyue, LI Hongyuan, YANG Jianan. The temporal-spatial variation characteristics and influencing factors of absorbing air particulate matters by plants: a review [J]. Chin J Ecol, 2016, 35(2): 524 − 533. [24] 包红光,王成,郄光发,等. 城市公园外侧防护林结构对外源PM2.5的消减作用[J]. 生态环境学报, 2016, 25(6): 987 − 993. BAO Hongguang, WANG Cheng, QIE Guangfa, et al. The effect of forest shelter belt on subduction of PM2.5 in urban parks [J]. Ecol Environ Sci, 2016, 25(6): 987 − 993. [25] HWANG H J, YOOK S J, AHN K H. Experimental investigation of submicron and ultrafine soot particle removal by tree leaves [J]. Atmos Environ, 2011, 45(38): 6987 − 6994. [26] SÆBØ A, POPEK R, NAWROT B, et al. Plant species differences in particulate matter accumulation on leaf surfaces [J]. Sci Total Environ, 2012, 427/428(5): 347 − 354. [27] 赵晨曦,王玉杰,王云琦,等. 细颗粒物(PM2.5)与植被关系的研究综述[J]. 生态学杂志, 2013, 32(8): 2203 − 2210. ZHAO Chenxi, WANG Yujie, WANG Yunqi, et al. Interactions between fine particulate matter (PM2.5) and vegetation: a review [J]. Chin J Ecol, 2013, 32(8): 2203 − 2210. [28] FOWLER D, SKIBA U, NEMITZ E, et al. Measuring aerosol and heavy metal deposition on urban woodland and grass using inventories of 210 Pb and metal concentrations in soil [J]. Water Air Soil Poll Focus, 2004, 4(2/3): 483 − 499. [29] 杜万光,王成,王茜,等. 北京香山公园主要植被类型的夏季环境效应评价[J]. 林业科学, 2018, 54(4): 155 − 164. DU Wanguang, WANG Cheng, WANG Qian, et al. Evaluation of summer environmental effects of the main vegetation types in Beijing Fragrant Hills Park [J]. Sci Silv Sin, 2018, 54(4): 155 − 164. [30] POPEK R, GAWROŃSKA H, WROCHNA M, et al. Particulate matter on foliage of 13 woody species: deposition on surfaces and phytostabilisation in waxes: a 3-year study [J]. Int J Phytoremediation, 2013, 15(3): 245 − 256. [31] 吴兑. 近10年中国灰霾天气研究综述[J]. 环境科学学报, 2012, 32(2): 257 − 269. WU Dui. Hazy weather research in China in the last decade: A review [J]. Acta Sci Circumstantiae, 2012, 32(2): 257 − 269. [32] FREER-SMITH P H, EL-KHATIB A A, TAYLOR G. Capture of particulate pollution by trees: a comparison of species typical of semi-arid areas (Ficus Nitida and Eucalyptus Globulus) with european and north American species [J]. Water Air Soil Poll, 2004, 155(1/4): 173 − 187. -

-
链接本文:
https://zlxb.zafu.edu.cn/article/doi/10.11833/j.issn.2095-0756.20190335


 下载:
下载:
