Volume 39 Issue 1
Feb.  2022
Turn off MathJax
Article Contents

WANG Xinyu, DUAN Yanbo, GONG Man, TIAN Guohang. Coupling analysis and simulation optimization of constructing space and green space in Luohe City[J]. Journal of Zhejiang A&F University, 2022, 39(1): 95-104. doi: 10.11833/j.issn.2095-0756.20210105
Citation: WANG Xinyu, DUAN Yanbo, GONG Man, TIAN Guohang. Coupling analysis and simulation optimization of constructing space and green space in Luohe City[J]. Journal of Zhejiang A&F University, 2022, 39(1): 95-104. doi: 10.11833/j.issn.2095-0756.20210105

Coupling analysis and simulation optimization of constructing space and green space in Luohe City

doi: 10.11833/j.issn.2095-0756.20210105
  • Received Date: 2021-01-12
  • Rev Recd Date: 2021-05-21
  • Available Online: 2022-02-14
  • Publish Date: 2022-02-14
  •   Objective  Optimize the layout of urban planning to explore the coupling path of urban construction space and green space, optimize the spatial layout of urban land to achieve coordinated and sustainable development.  Method  Multi-temporal urban LUCC analysis and prediction simulation were carried out based on fractal, artificial neural network cellular automata (ANN-CA) and spatial syntax models.  Result  (1) The fractal dimension increased from 1.64 in 2003 to 1.70 in 2013 and reached 1.75 in 2018. (2) There is a data mutation point in the aggregation dimension, and the spatial aggregation state is different in different circles. (3)The spatial accessibility of urban greenness decreased significantly from 2003−2018. (4) The ANN-CA-GM(1, 1) urban growth model is constructed to simulate three future scenarios of “free, constrained and ideal”, and the coupling development process of construction space and green space is predicted: the urban construction land will continue to increase to 156.71 km2 in 2025, and the agglomeration range of construction space under the ideal scenario will fall back to 5500 m around the city government, and the area ratio of green space to construction space is 1.00∶1.48.  Conclusion  (1) The urban form is close to optimal in 2013, followed by an overly dense layout of urban built-up land in 2018 due to high-density urban development, which hinders the coupled exchange with greenness space. (2) In 2018, the construction land was highly concentrated in 14 circles (7 000 m) around the city government. The development of ecological land in this region helps to guide smart growth and build a resilient city. the coupled exchange with greenness space. (3) The area with large green space area and high accessibility are concentrated outside the high aggregation area, while the utilization of riverside green space in the aggregation area is low. (4) The ideal scenario spatial coupling layout provides quantitative data support and spatial layout reference for land spatial planning and “three-line delimitation”, and realizes the effective supply of urban ecological products through green space layout. [Ch, 7 fig. 4 tab. 33 ref.]
  • [1] WANG Xiangfu, LI Yuanhui, WANG Weifeng, SUN Jiejie, WANG Qian, DONG Wenting, WANG Rongnü, YANG Yaqi.  Impact of land use and climate change on potential suitable habitats of snow leopards (Panthera uncia) in Qinghai Province . Journal of Zhejiang A&F University, 2024, 41(3): 526-534. doi: 10.11833/j.issn.2095-0756.20230259
    [2] MENG Xueyuan, CHEN Gang, ZHENG Zhiyuan.  Spatiotemporal response of ecosystem service value to land use changes in national key ecological functional areas . Journal of Zhejiang A&F University, 2024, 41(): 1-11. doi: 10.11833/j.issn.2095-0756.20230506
    [3] ZUO Qilin, YU Yang, ZHA Tonggang, ZHANG Hengshuo, LIANG Yipeng, OUYANG Jiahuan.  Soil quality assessment of different land use types in Qingshui River Basin of western Shanxi Province . Journal of Zhejiang A&F University, 2023, 40(4): 801-810. doi: 10.11833/j.issn.2095-0756.20220498
    [4] CHEN Xi, YE Kemo, LI Kun, JIN Yang.  Research on land use change and risk-value of “production-living-ecological space” in a resource-based city . Journal of Zhejiang A&F University, 2023, 40(5): 1111-1120. doi: 10.11833/j.issn.2095-0756.20220666
    [5] PAN Ting, WANG Yixiang, LIU Xianzhao, XU Chengli, LIU Zhijun.  Land use change and its impact on ecological quality in Xiong’an New Area . Journal of Zhejiang A&F University, 2023, 40(5): 1102-1110. doi: 10.11833/j.issn.2095-0756.20220596
    [6] XUE Rui, YAN Jingjuan, WEI Lingling.  Recreation use of national parks: technical system and research framework . Journal of Zhejiang A&F University, 2022, 39(1): 190-198. doi: 10.11833/j.issn.2095-0756.20210277
    [7] ZHU Rongwei, GE Zhiwei, RUAN Honghua, XU Jin, PENG Sili.  Fractal dimension of soil organic carbon and microbial biomass carbon with nitrogen additions . Journal of Zhejiang A&F University, 2019, 36(4): 656-663. doi: 10.11833/j.issn.2095-0756.2019.04.004
    [8] YI Wuying, SU Weici, ZHOU Wenlong, TANG Jingang, ZHANG Fengtai.  An ecological security early warning simulation city based on the CA Model in Huaxi District of Guiyang City, China . Journal of Zhejiang A&F University, 2015, 32(3): 369-375. doi: 10.11833/j.issn.2095-0756.2015.03.006
    [9] YU Long, ZHOU Yufeng, DING Lixia, ZOU Hongyu.  Dynamic monitoring of land-use classification based on spectral angle mapping (SAM) . Journal of Zhejiang A&F University, 2014, 31(3): 386-393. doi: 10.11833/j.issn.2095-0756.2014.03.009
    [10] WANG Xiaoxue, LIN Tianmiao, WU Xiuqin.  The impact of land use/land cover changes on human settlements in sandylands . Journal of Zhejiang A&F University, 2014, 31(1): 111-116. doi: 10.11833/j.issn.2095-0756.2014.01.017
    [11] ZHANG Tao, LI Yongfu, JIANG Peikun, ZHOU Guomo, LIU Juan.  Research progresses in the effect of land-use change on soil carbon pools and soil respiration . Journal of Zhejiang A&F University, 2013, 30(3): 428-437. doi: 10.11833/j.issn.2095-0756.2013.03.021
    [12] TANG Jie, LI Zhi-hui, TANG Yu-xi, WU Min, LI Yong-jin, WANG Sheng.  Soil respiration dynamics for different land-use types on the shoreline of Dongting Lake . Journal of Zhejiang A&F University, 2011, 28(3): 439-443. doi: 10.11833/j.issn.2095-0756.2011.03.014
    [13] CAO Huan-ling, LI Wen-zhu, SONG Yuan-pu, CHEN Mao-jun.  Porosity and specific surface area for bamboo charcoal using fractal theory . Journal of Zhejiang A&F University, 2011, 28(5): 771-774. doi: 10.11833/j.issn.2095-0756.2011.05.014
    [14] WU Jian, PENG Dao-li.  Technology of land use remote sensing information extraction in Duolun County . Journal of Zhejiang A&F University, 2010, 27(3): 417-423. doi: 10.11833/j.issn.2095-0756.2010.03.016
    [15] HUI Shu-rong, WANG Jiao, ZHANG Qian, WEI Zhong-ping, LIU Yang.  Soil-water dynamics with different agroforestry planting combinations on sandy lands in northwestern Liaoning Province . Journal of Zhejiang A&F University, 2010, 27(4): 579-584. doi: 10.11833/j.issn.2095-0756.2010.04.017
    [16] XIA Qi-biao, LI Guang-hui, YIN Jian-xin.  Application of percolation theory in forest fire simulation . Journal of Zhejiang A&F University, 2009, 26(2): 233-238.
    [17] GU Lei, WU Chun-jun, WANG Xin.  Land utilization pattern changing and driving force analysis based on remote sensing data in Lin’an . Journal of Zhejiang A&F University, 2009, 26(6): 870-876.
    [18] FAN Fan-rong.  Study of inter-specific correlation of Phoebe bournei communities by grey systems . Journal of Zhejiang A&F University, 2008, 25(1): 33-36.
    [19] CAO Yin-gui, ZHOU Wei, CHENG Ye, XU Ning, HAO Yin.  A review of land use and land cover changes in China . Journal of Zhejiang A&F University, 2007, 24(5): 633-637.
    [20] JIANG Wen-wei, GUAN Yu, LIU Tong, ZHOU Guo-mo, SHEN Zhen-ming.  Forecast of land use pattern change in Anji County of Zhejiang : an application of Markov process . Journal of Zhejiang A&F University, 2004, 21(3): 309-312.
  • [1]
    LI Xiaoyong, KUANG Wenhui. Urban land use/cover change and its impact on urban flood regulation ecosystem service in Beijing [J]. Acta Ecol Sin, 2020, 40(16): 5525 − 5533.
    [2]
    GAO Xing, LIU Zewei, LI Chenxi, et al. Land use function transformation in the Xiong’an new area based on ecological-production-living spaces and associated eco-environment effects [J]. Acta Ecol Sin, 2020, 40(20): 7113 − 7122.
    [3]
    WHITE R, ENGELEN G. Cellular automata and fractal urban form: a cellular modeling approach to the evolution of urban land-use patterns [J]. Environ Plann A, 1993, 25(8): 1175 − 1199.
    [4]
    BATTY M. Cities as Fractals: Simulating Growth and Form[M]. New York: Springer, 1991.
    [5]
    CHEN Yanguang. Self-organizedcharacteristics and criteria of the development of Chinese cities [J]. City Plann Rev, 2006, 30(8): 24 − 30.
    [6]
    CHEN Yanguang. Fractal cities and city planning [J]. City Plann Rev, 2005, 29(2): 33 − 40, 51.
    [7]
    JIANG Shiguo, ZHOU Yixing. The fractal urban form of Beijing and its practical significance [J]. Geogr Res, 2006, 25(2): 204 − 212.
    [8]
    LIU Jie, ZHANG Lang, JI Yiwen, et al. Spatial-Temporal evolution analysis of urban green space system based on fractal model: a case study of downtown Shanghai [J]. Mod Urban Res, 2019(10): 12 − 19.
    [9]
    JIN Yunfeng, LI Tao, WANG Chunchun, et al. Optimization of recreational green space system layout based on fractal quantification model from the perspective of urban-rural integration [J]. Landscape Archit, 2018, 25(12): 81 − 86.
    [10]
    WADDELL P. UrbanSim: modeling urban development for land use, transportation, and environmental planning [J]. J Am Plann Assoc, 2002, 68(3): 297 − 297.
    [11]
    WU Fulong. SimLand: a prototype to simulate land conversion through the integrated GIS and CA with AHP-derived transition rules [J]. Int J Geogr Inf Sci, 1998, 12(1): 63 − 82.
    [12]
    LIU Jisheng, CHEN Yanguang. GIS-based cellular automata models and researches on spatial complexity of man-land relationship [J]. Geogr Res, 2002, 21(2): 155 − 162.
    [13]
    CHEN Ying, ZHANG Li, HE Ling, et al. Multi-scenario simulation of land use structure based on dual combined models [J]. Acta Ecol Sin, 2016, 36(17): 5391 − 5400.
    [14]
    JENNINGS V, GAITHER C J, GRAGG R S. Promoting environmental justice through urban green space access: a synopsis [J]. Environ Justice, 2012, 5(1): 1 − 7.
    [15]
    CALTHORPE P. The Next American Metropolis: Ecology, Community, and the American Dream[M]. New York: Princeton Architectural Press, 1993: 56 − 68.
    [16]
    YI Haiwei, KONG Fanhua, ZONG Yueguang. Accessibility and equity assessment on urban green space [J]. Acta Ecol Sin, 2008, 28(7): 3375 − 3383.
    [17]
    WANG Haijun, XIA Chang, ZHANG Anqi, et al. Space syntax expand intensity index and its applications toquantitative analysis of urban expansion [J]. Acta Geogr Sin, 2016, 71(8): 1302 − 1314.
    [18]
    ZHOU Haibo, GUO Xingfang. Innovative trends of green space system planning in territorial spatial planning system [J]. Chin Landscape Archit, 2020, 36(2): 17 − 22.
    [19]
    WEI Jiaxing, SONG Yi, WANG Yuncai, et al. Urban green infrastructure building for sustainability in areas of rapid urbanization based on evaluating spatial priority: a case study of Pukou in China [J]. Acta Ecol Sin, 2019, 39(4): 1178 − 1188.
    [20]
    CHENG Chaonan, HU Yang, FENG Yao, et al. Construction of urban ecological zones based on CA-Markov model: a case study of the main urban area of Jinzhong [J]. Acta Ecol Sin, 2020, 40(4): 1455 − 1462.
    [21]
    SANTÉ I, GARCÍA A M, MIRANDA D, et al. Cellular automata models for the simulation of real-world urban processes: a review and analysis [J]. Landscape Urban Plann, 2010, 96(2): 108 − 122.
    [22]
    WU Hao, LI Yan, SHI Wenzhong, et al. Scale domain recognition for land use spatial fractal feature based on genetic algorithm [J]. Acta Ecol Sin, 2014, 34(7): 1822 − 1830.
    [23]
    KOLIOTSIS P T A, PAPADOPOULOU M P. Spatial analysis of the accessibility of urban greenspace at the city level [J]. Eur J Environ Sci, 2020, 10(1): 15 − 21.
    [24]
    MAINKA S A, MCNEELY J A, JACKSON W J. Depending on nature: ecosystem services for human livelihoods [J]. Environ Policy Sustainable Dev, 2008, 50(2): 42 − 55.
    [25]
    LIN B, MEYERS J, BARNETT G. Understanding the potential loss and inequities of green space distribution with urban densification [J]. Urban For Urban Greening, 2015, 14(4): 952 − 958.
    [26]
    LIU Jie, ZHANG Lang, ZHANG Qingping. The development simulation of urban green space system layout based on the land use Scenario: a case study of Xuchang City, China[J/OL]. Sustainability, 2019, 12(1)[2021-01-01]. doi: 10.3390/su12010326.
    [27]
    FRANKHAUSER P. La Fractalité des Structures Urbaines[M]. Paris: Economica, 1994.
    [28]
    GE Meiling, LIN Qizhong. Realization of the box-counting method for calculating the fractal dimension of the urban form based on the remote sensing image [J]. Geo-Spat Inf Sci, 2009, 12(4): 265 − 270.
    [29]
    WAN Lingxuan, WANG Xiaofang, GUO Yan. Research on spatial accessibility of Wuhan City parks with different functions based on Ga2SFCA [J]. Mod Urban Res, 2020(8): 26 − 34.
    [30]
    XING Luhua, WANG Yongqiang, LIU Manshu, et al. Evaluation on the balance of park greenspace and residential population distribution in the major urban area of Zhengzhou City [J]. J Northwest For Univ, 2020, 35(3): 258 − 265.
    [31]
    DU Qin, HOU Ying, WANG Kaiyun, et al. International experiences of green space construction on urban-rural green system in China [J]. City Plann Rev, 2008(8): 74 − 80.
    [32]
    YANG Fan, DUAN Ning, XU Ying, et al. Smart planning and cross regional interaction: dilemma and planning response of regional green space protection [J]. Planners, 2019, 35(21): 52 − 58.
    [33]
    PARTANEN J. Guiding urban self-organization: combining rule-based and case-based planning[J/OL]. Environ Plann B Plann Des, 2019, 47(2)[2021-01-01]. doi: 10.1177/2399808319893687.
  • 加载中
通讯作者: 陈斌, bchen63@163.com
  • 1. 

    沈阳化工大学材料科学与工程学院 沈阳 110142

  1. 本站搜索
  2. 百度学术搜索
  3. 万方数据库搜索
  4. CNKI搜索

Figures(7)  / Tables(4)

Article views(691) PDF downloads(48) Cited by()

Related
Proportional views

Coupling analysis and simulation optimization of constructing space and green space in Luohe City

doi: 10.11833/j.issn.2095-0756.20210105

Abstract:   Objective  Optimize the layout of urban planning to explore the coupling path of urban construction space and green space, optimize the spatial layout of urban land to achieve coordinated and sustainable development.  Method  Multi-temporal urban LUCC analysis and prediction simulation were carried out based on fractal, artificial neural network cellular automata (ANN-CA) and spatial syntax models.  Result  (1) The fractal dimension increased from 1.64 in 2003 to 1.70 in 2013 and reached 1.75 in 2018. (2) There is a data mutation point in the aggregation dimension, and the spatial aggregation state is different in different circles. (3)The spatial accessibility of urban greenness decreased significantly from 2003−2018. (4) The ANN-CA-GM(1, 1) urban growth model is constructed to simulate three future scenarios of “free, constrained and ideal”, and the coupling development process of construction space and green space is predicted: the urban construction land will continue to increase to 156.71 km2 in 2025, and the agglomeration range of construction space under the ideal scenario will fall back to 5500 m around the city government, and the area ratio of green space to construction space is 1.00∶1.48.  Conclusion  (1) The urban form is close to optimal in 2013, followed by an overly dense layout of urban built-up land in 2018 due to high-density urban development, which hinders the coupled exchange with greenness space. (2) In 2018, the construction land was highly concentrated in 14 circles (7 000 m) around the city government. The development of ecological land in this region helps to guide smart growth and build a resilient city. the coupled exchange with greenness space. (3) The area with large green space area and high accessibility are concentrated outside the high aggregation area, while the utilization of riverside green space in the aggregation area is low. (4) The ideal scenario spatial coupling layout provides quantitative data support and spatial layout reference for land spatial planning and “three-line delimitation”, and realizes the effective supply of urban ecological products through green space layout. [Ch, 7 fig. 4 tab. 33 ref.]

WANG Xinyu, DUAN Yanbo, GONG Man, TIAN Guohang. Coupling analysis and simulation optimization of constructing space and green space in Luohe City[J]. Journal of Zhejiang A&F University, 2022, 39(1): 95-104. doi: 10.11833/j.issn.2095-0756.20210105
Citation: WANG Xinyu, DUAN Yanbo, GONG Man, TIAN Guohang. Coupling analysis and simulation optimization of constructing space and green space in Luohe City[J]. Journal of Zhejiang A&F University, 2022, 39(1): 95-104. doi: 10.11833/j.issn.2095-0756.20210105
  • 随着城市化进程不断加快,用地矛盾逐渐凸显,向外表现为城市边界扩张日趋减缓,向内呈现出建设用地与生态用地的“零和博弈”。一方面,城市土地利用/覆盖变化(LUCC)是决定城市与外界物质、能量、信息等空间流动(spatial flow)是否通畅的主要原因[1],直接影响城市健康;另一方面,由路网-绿地耦合构成的中观子系统,影响整个城市的绿地发展成果能否被共享[2]。传统工具如景观格局指数、基尼系数等“欧式数理”仅聚焦于用地面积与格局,对描述多空间耦合交互关系则力有未逮。因此,新的工具如分形、元胞自动机、神经网络等被逐步发掘。分形(fractal)理论所代表的“自相似性”是复杂巨系统“无序”中的“有序”,作为复杂巨系统理论的基石被持续研究。国外学者基于研究实践[3-4]认为:时间序列上城市最佳形态分维数为Df≈1.71;陈彦光[5-6]则基于国内诸多城市对此结论进行了进一步的验证。姜世国等[7]、刘杰等[8]利用半径法分析了北京、上海等城市的用地集聚特征,发现建设用地的高度聚集使得相关区域与外界的物质、能量交换受阻、循环不畅,绿地结构在密集城区分布不合理,没有发挥生态效益[9]。WADDELL[10]于20世纪90年代提出了大量元胞自动机模型(CA)。同时,一些学者希望进一步通过模型结合模拟局部“无序”而涌现整体“秩序”的方法[11],更好地分析复杂巨系统的耦合变化[12]。目前,研究者尝试引入多种CA耦合模型模拟时间序列[13],探讨土地供给关系,将理论研究向前推进了一大步。复杂巨系统理论对LUCC研究的重要影响已被论证,但与绿度空间耦合进行多情景模拟,以及以“人”为主题的空间优化策略多模型研究仍不多见。相比之下,绿度空间可达性在过去20 a被普遍认为是环境公平、城市健康的重要体现[14]。为了弥补“人均面积”“公园距离”等传统单向指标难以描述绿地可用程度的缺陷,CALTHORPE[15]提出了公共交通导向的用地发展模型(TOD),引入了人的选择因素,不再仅仅聚焦于“数量”,而是将该区域是否真正“可达、可用”作为评判城市健康发展的重要属性[16]。同时,相较于扁平化的“几何网络”分析(如平衡系数、重力模型),基于“拓扑网络”的空间句法将更加客观便捷地衡量结构、节点的可达性[17]。因此,本研究在传统复杂巨系统理论的基础上进一步加入绿度空间可达性变量,以探索多系统耦合的可能性。

  • 本研究地理范围为33°38′12″~33°30′30″N,114°9′46″~113°53′47″E,包括河南省漯河市总体规划中城市建成区与优先发展区,面积为246.90 km2,是漯河市的人口、建设、经济、政治中心,资源丰富而情况复杂,发展遗留问题多,生态环境矛盾剧烈,具有典型性和代表性。需要进行基于未来情景的资源统筹与绿色空间引领下的城市空间优化,将以往见缝插绿的绿地补丁思维转换为以绿地为基准面的底图思维[18]

  • 影像数据要来源于2003、2008、2013、2018年Landsat系列卫星,精度30 m,进行校正分类,Kappa系数均大于80%。用地类型为满足CA模拟精度与分形维数图像二值化的条件,分为建设与非建设用地2类,根据《国土空间调查、规划、用途管制用地用海分类指南(试行)》进行归并(表1)。地形数据来源于ASTER DEM 30 m数据;城市道路、居民点数据来源于开源地图(OSM)、谷歌历史影像与天地图;100 m精度人口密度数据来源于美国能源部橡树岭国家实验室(ORNL);国内生产总值(GDP)等其他数据来源于城市统计年鉴、总体规划等政府公开文件。

    用地类型 空间类型包括一级类用地用海
    建设用地 构筑空间居住用地、公共管理与公共服务用
     地、商业服务业用地、仓储用地、
     交通运输用地、公共设施用地、
     特殊用地(包括军事设施用地)
    非建设用地绿度空间耕地、林地、草地、农业设施建设
     用地、绿地与开敞空间用地、陆
     地水域、其他土地(包括公园绿地、
     防护绿地)

    Table 1.  Description of land use classification

  • 基于复杂巨系统理论进行未来仿真模拟,具体涉及分形(Matlab软件)、绿度空间可达性(Deptnmap X软件)、元胞自动机(基于ArcGIS的GeoSOS插件)3种工具。其中分形理论是对系统整体空间布局现状作出评价,同时引入基于交通可达性的系统内部协同度空间计量模型对城市发展水平作出评价,总体评价分析结果由GM(1, 1)引入约束条件,生成限制性CA模型,通过历史变化及现状发展概率得到多种未来情景。本研究结果图片直接导入Photoshop添加标注。

  • ①形态分维数。计算并观察形态分维数变化趋势,其基本思路为:将1个边长为R的景框等分为2n份,每份边长r=R/(2n),则每份面积a=A/(4n2)。其中A为边长为R的景框面积。将等分出的网格遮罩于研究对象上,取交集并计算非空网格数N(r)。通常持续迭代9次,次数过多会造成数据点脱离无标度区间。将一系列的1/rN(r)取对数拟合,其斜率即为形态分维数Df。②聚集分维数。以漯河市政府为圆心,以每500 m为半径做同心圆,并标注同心圆序号i为1~29;计算各同心圆所覆盖的建设用地面积Si,将其与序号i共同标入坐标系并取对数,其斜率即为聚集分维数Dvγ(i)为在距中心点距离为500i的圈层上用地密度的变化值:

    其中:当Dv<2时,建设用地密度从中心向外围衰减,即在平面上呈向中心聚集的趋势;当Dv=2时,建设用地从中心向外围均匀分布;当Dv>2时,建设用地密度从中心向外围递增,即在平面上呈向外围扩散的趋势。

  • ①空间句法-效率值。理论认为城市是依据拓扑结构建立的空间实体,抽离社会属性可以还原纯粹的空间关系。选取路域为城市骨骼分割空间,选取复合变量“效率值”(efficiency)描述城市路域可达性[19]。引入人的选择因素,结合路网的空间结构特征,主观与客观相统一。②双变量莫兰指数。空间自相关分析是对空间分布变量的相关性进行检验的统计方法,可以揭示区域变量取值的空间分布特征,一般采用莫兰指数衡量。为刻画不同要素间的空间相关性,引入双变量莫兰指数(I),值范围为[−1, 1]。

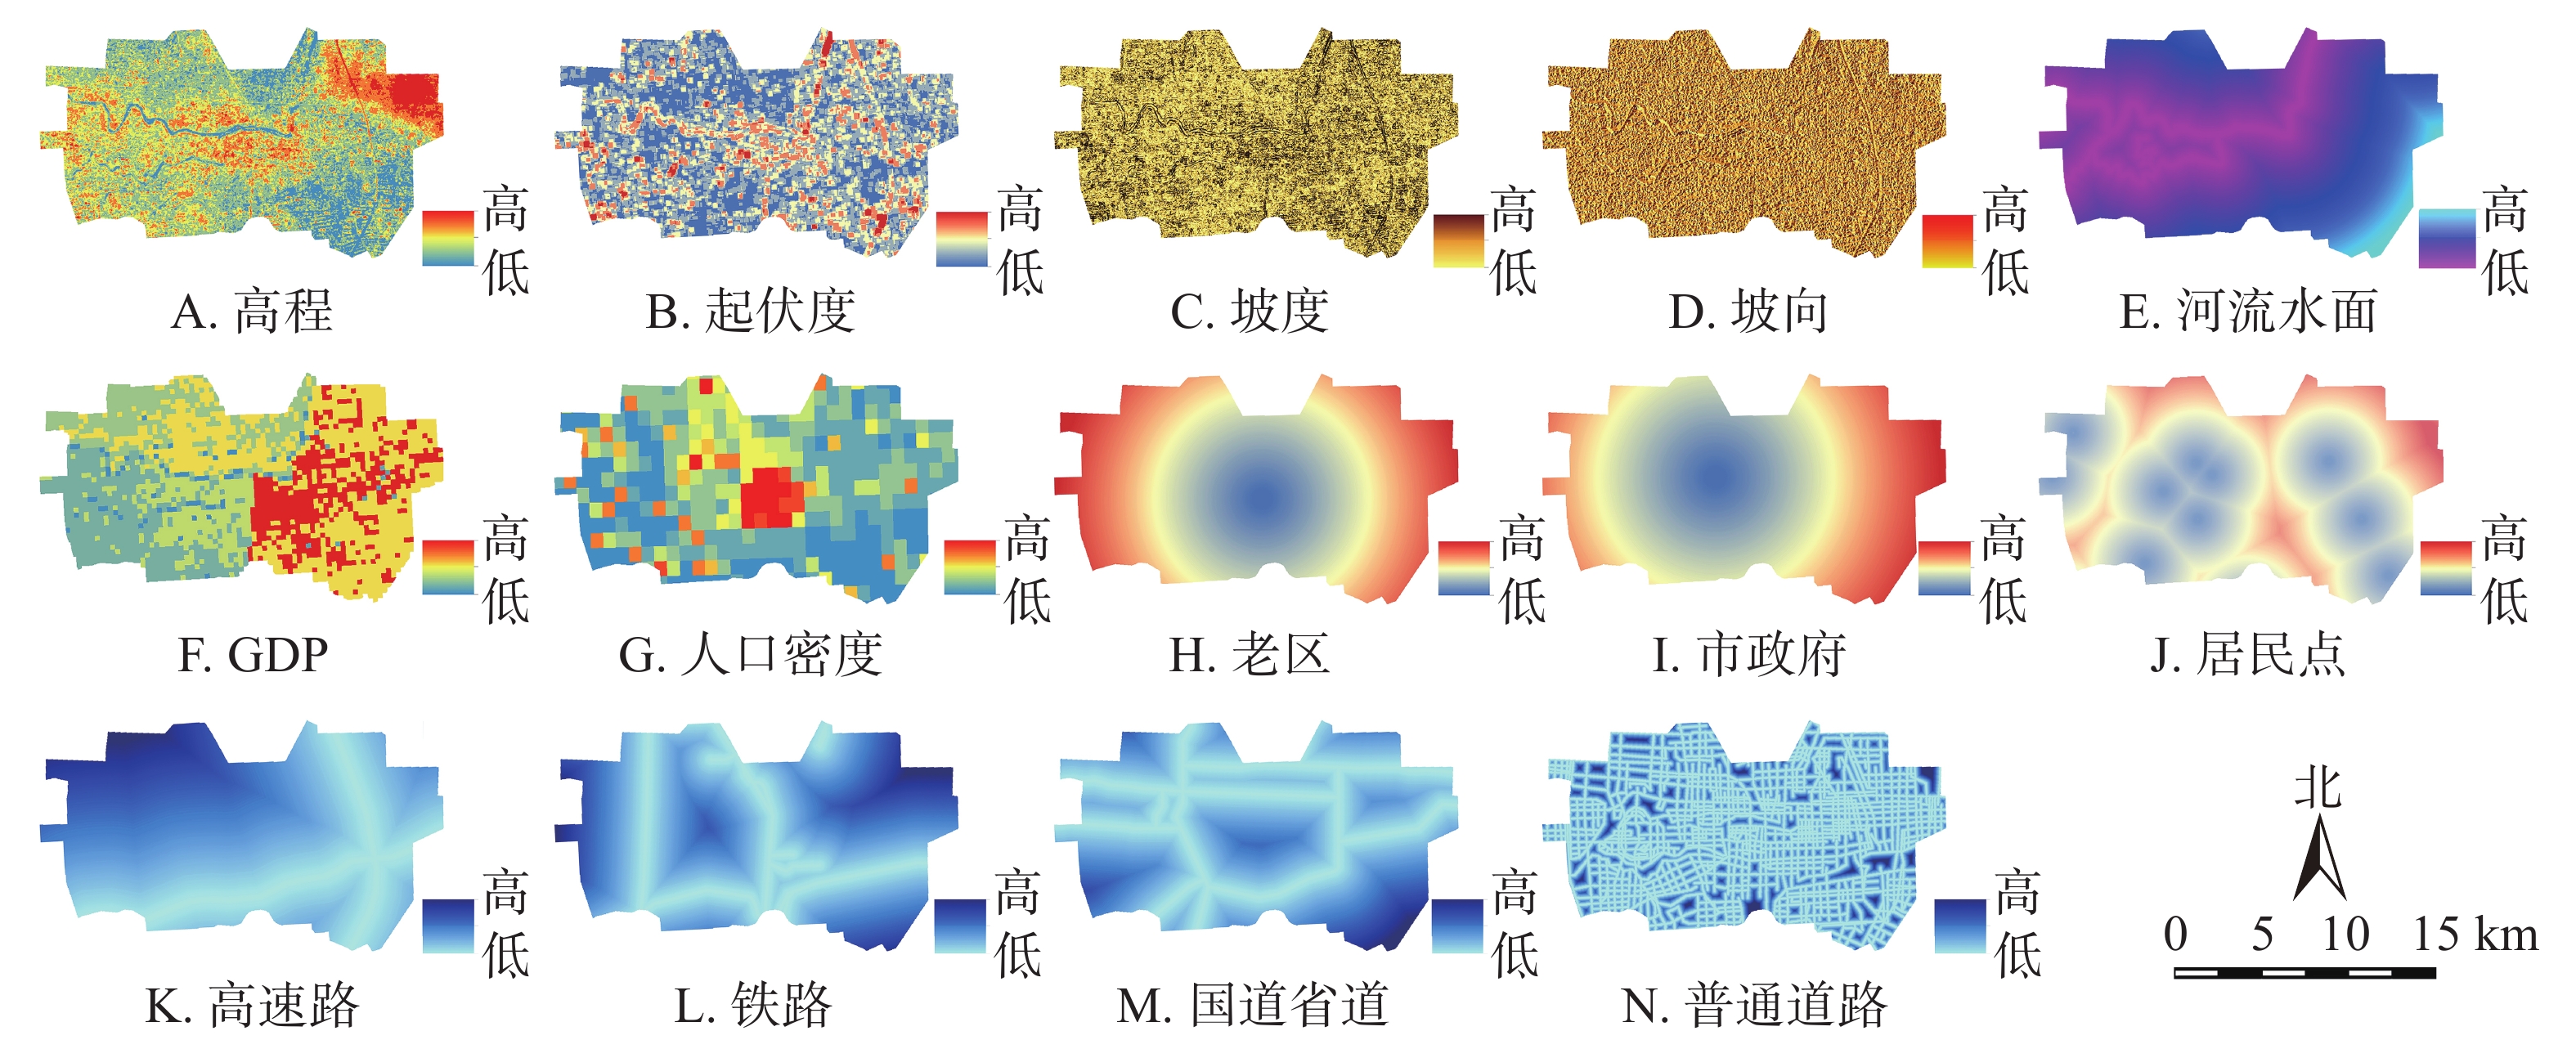
  • ①限制条件:灰色预测模型。灰色系统理论着重研究高度不确定性的混沌系统,在已知信息中深度挖掘,预测系统行为或演变规律。本研究采用经典单变量预测的均值GM(1, 1)模型。②元胞自动机模型。本研究像元与元胞在模型中等价,CA模型可以通过获悉底层约束条件,自下而上地模拟城市的发展进程,展现在少或无强力政策干扰下的城市未来自组织情况。具体转换规则如下[20]:①通过土地用途转换的继承性和区域发展的适宜性筛选驱动因子[21]。使用ArcGIS处理计算返回指定数据源的欧式距离(图1)。②在发展过程中,每种土地利用类型都具有相互关联的时空特征,被称为邻居变量。邻域空间大小取5×5。③漯河市中心城区由郾城、源汇、召陵3区交汇而成,情况复杂,极微小的扰动也会被放大,被称为随机因子。④输入土地利用数据,导入驱动因子进行精度验证,训练样本数据集精度88.33%,随机因子ε=1,转换阈值0.8,Kappa系数0.762,模拟数据与验证数据具有高度一致性。通过Logistic回归分析模型计算各驱动因子权重,数值越高的因子对用地变化的指导性越强(表2)。

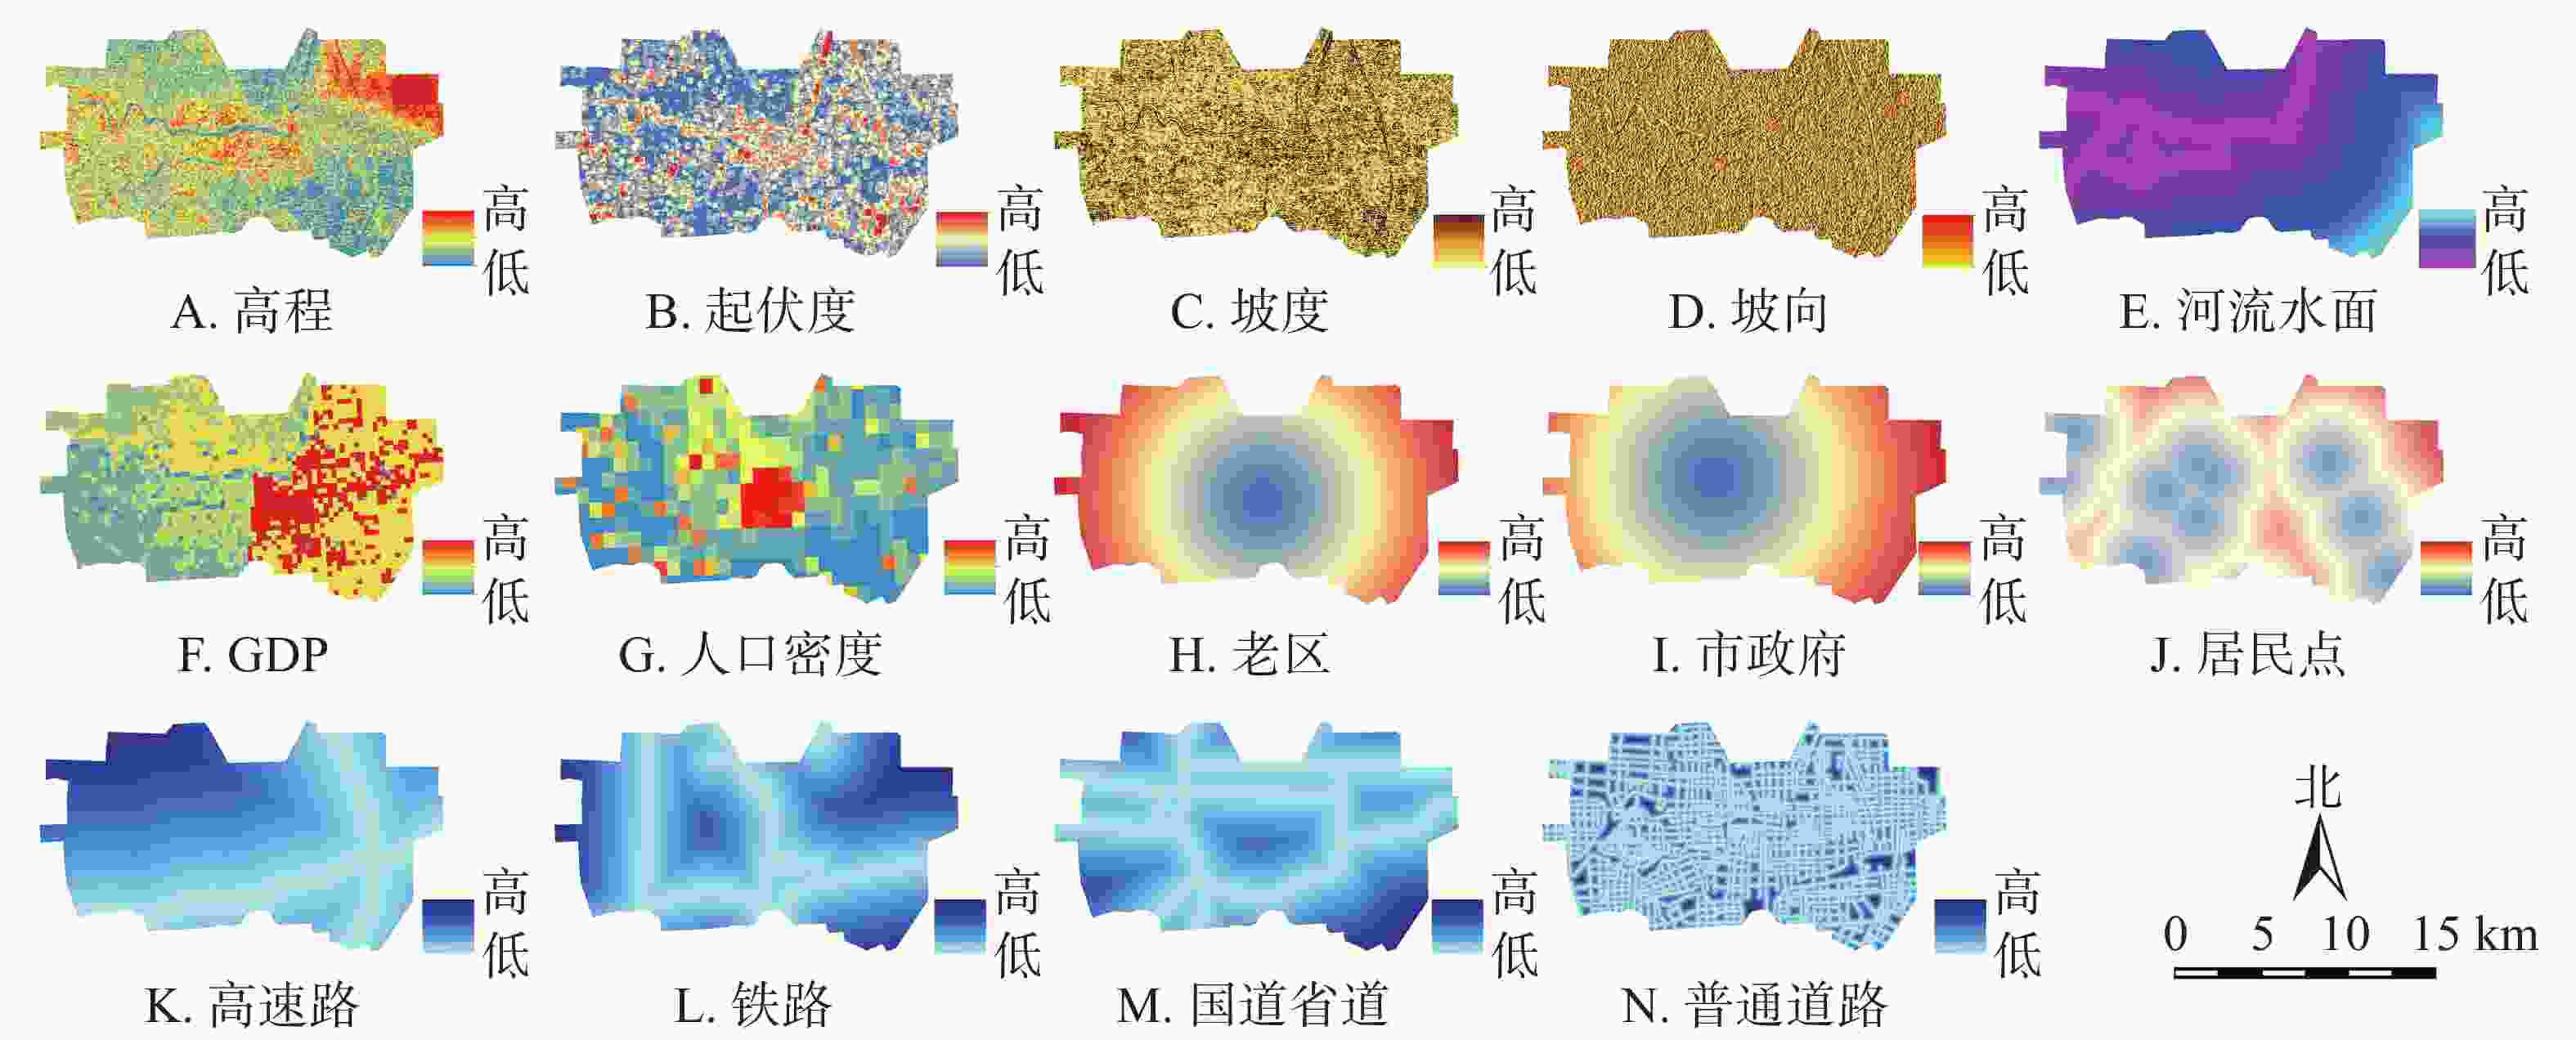
    Figure 1.  Urban development drivers

    目标层A目标层B权重目标层C单因子
    权重 
    漯河城市CA仿真
    限制因子模型 
    自然驱动
    因子 B1
    0.94 高程 C1 0.97
    起伏度 C2 0.46
    坡度 C3 0.25
    坡向 C4 0.02
    河流水面C5 1.11
    城市外驱
    动因子 B2
    1.02 GDP C6 1.11
    人口密度 C7 0.59
    城市内驱
    动因子 B3
    3.14 老区 C8 0.20
    市政府 C9 2.20
    居民点 C10 0.39
    高速路 C11 0.17
    铁路 C12 0.06
    国道省道 C13 4.48
    普通道路 C14 0.14

    Table 2.  Single factor weight value of logical regression

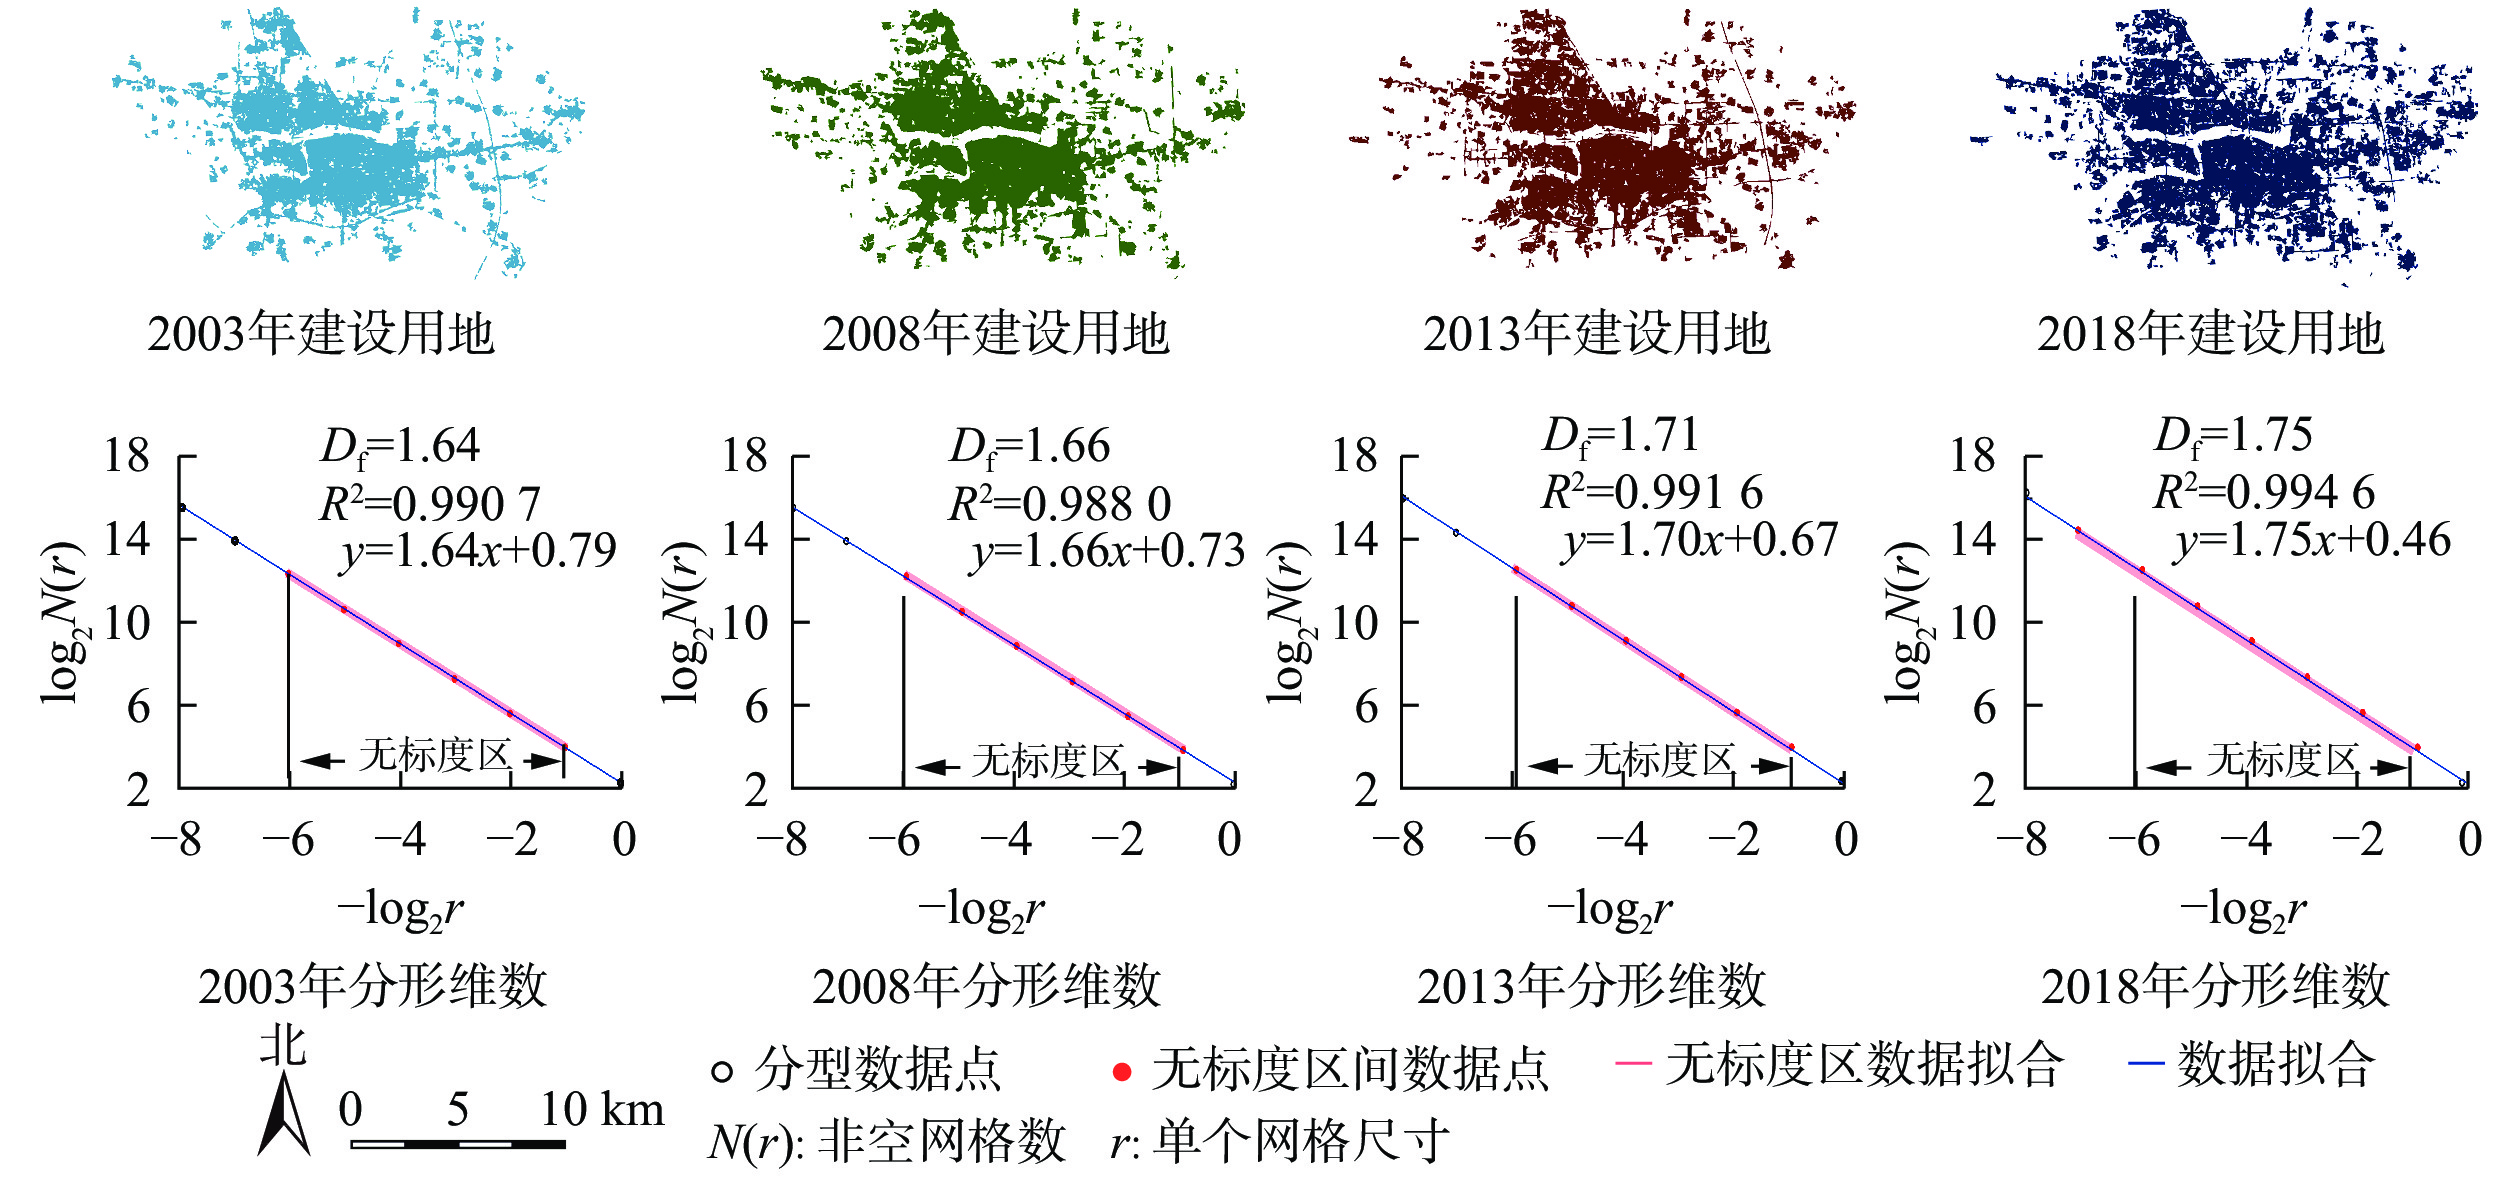
  • 选择无标度区间内的数据点拟合计算形态分维数(图2)。从2003年1.64开始,以2013年为节点,构筑空间与绿度空间的耦合呈先升后降的趋势;随着2013年后形态分维数越过1.71,空间交流程度快速降低;至2018年,Df=1.75,建设用地占比也由41.53%升高至44.98%,城市高度发展的同时,各空间系统进一步孤立[22]

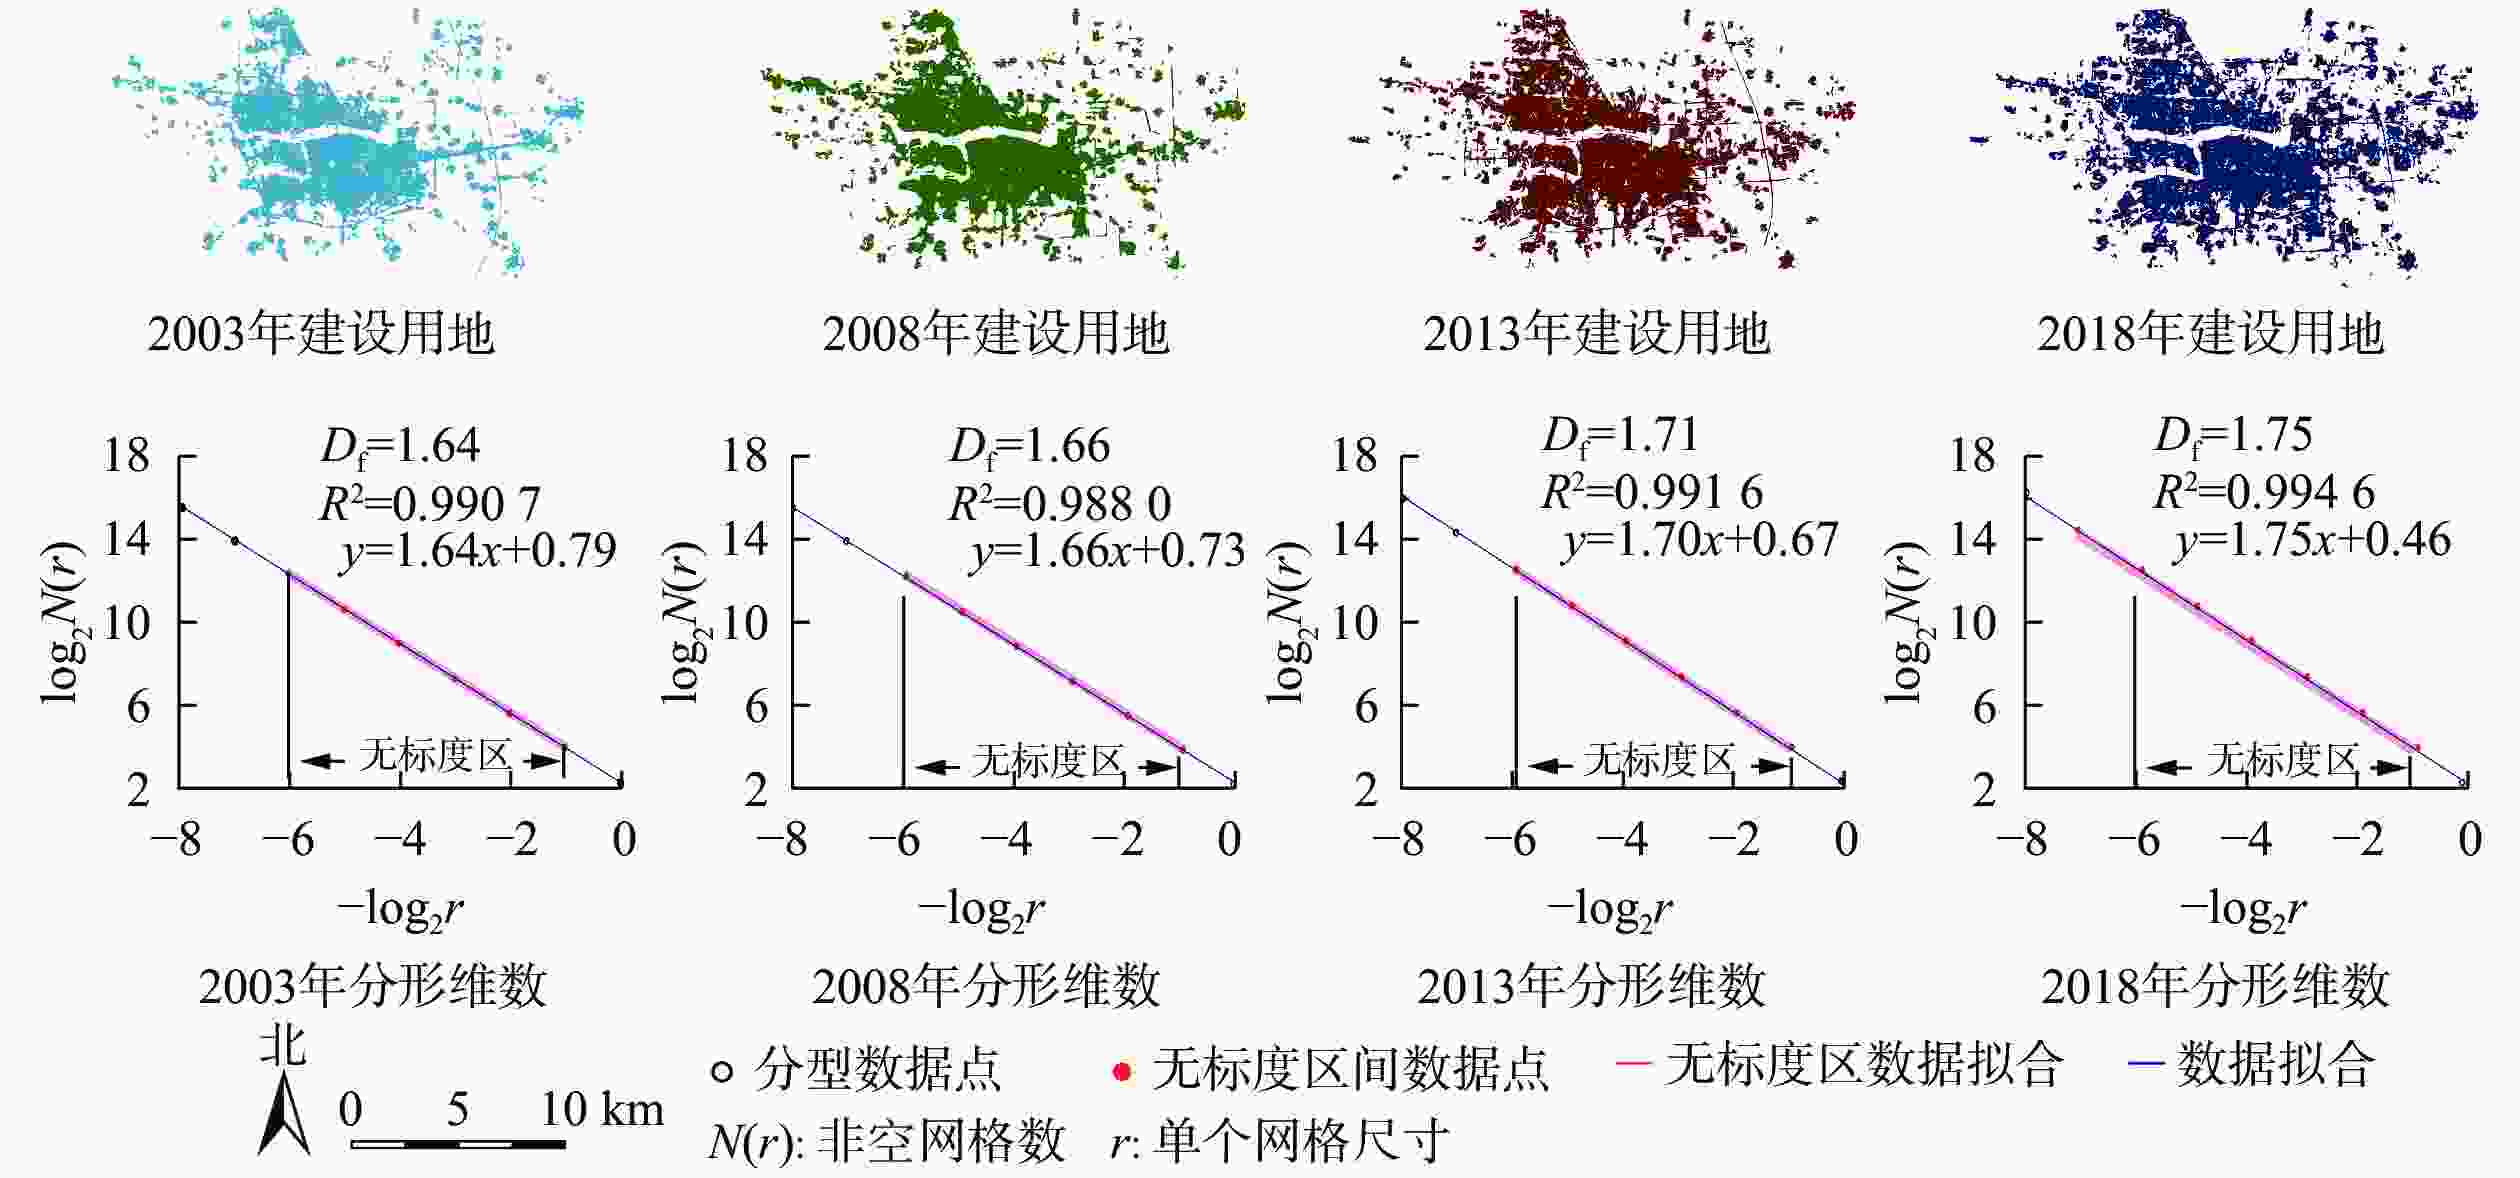
    Figure 2.  Historical evolution of construction land in Luohe Central District

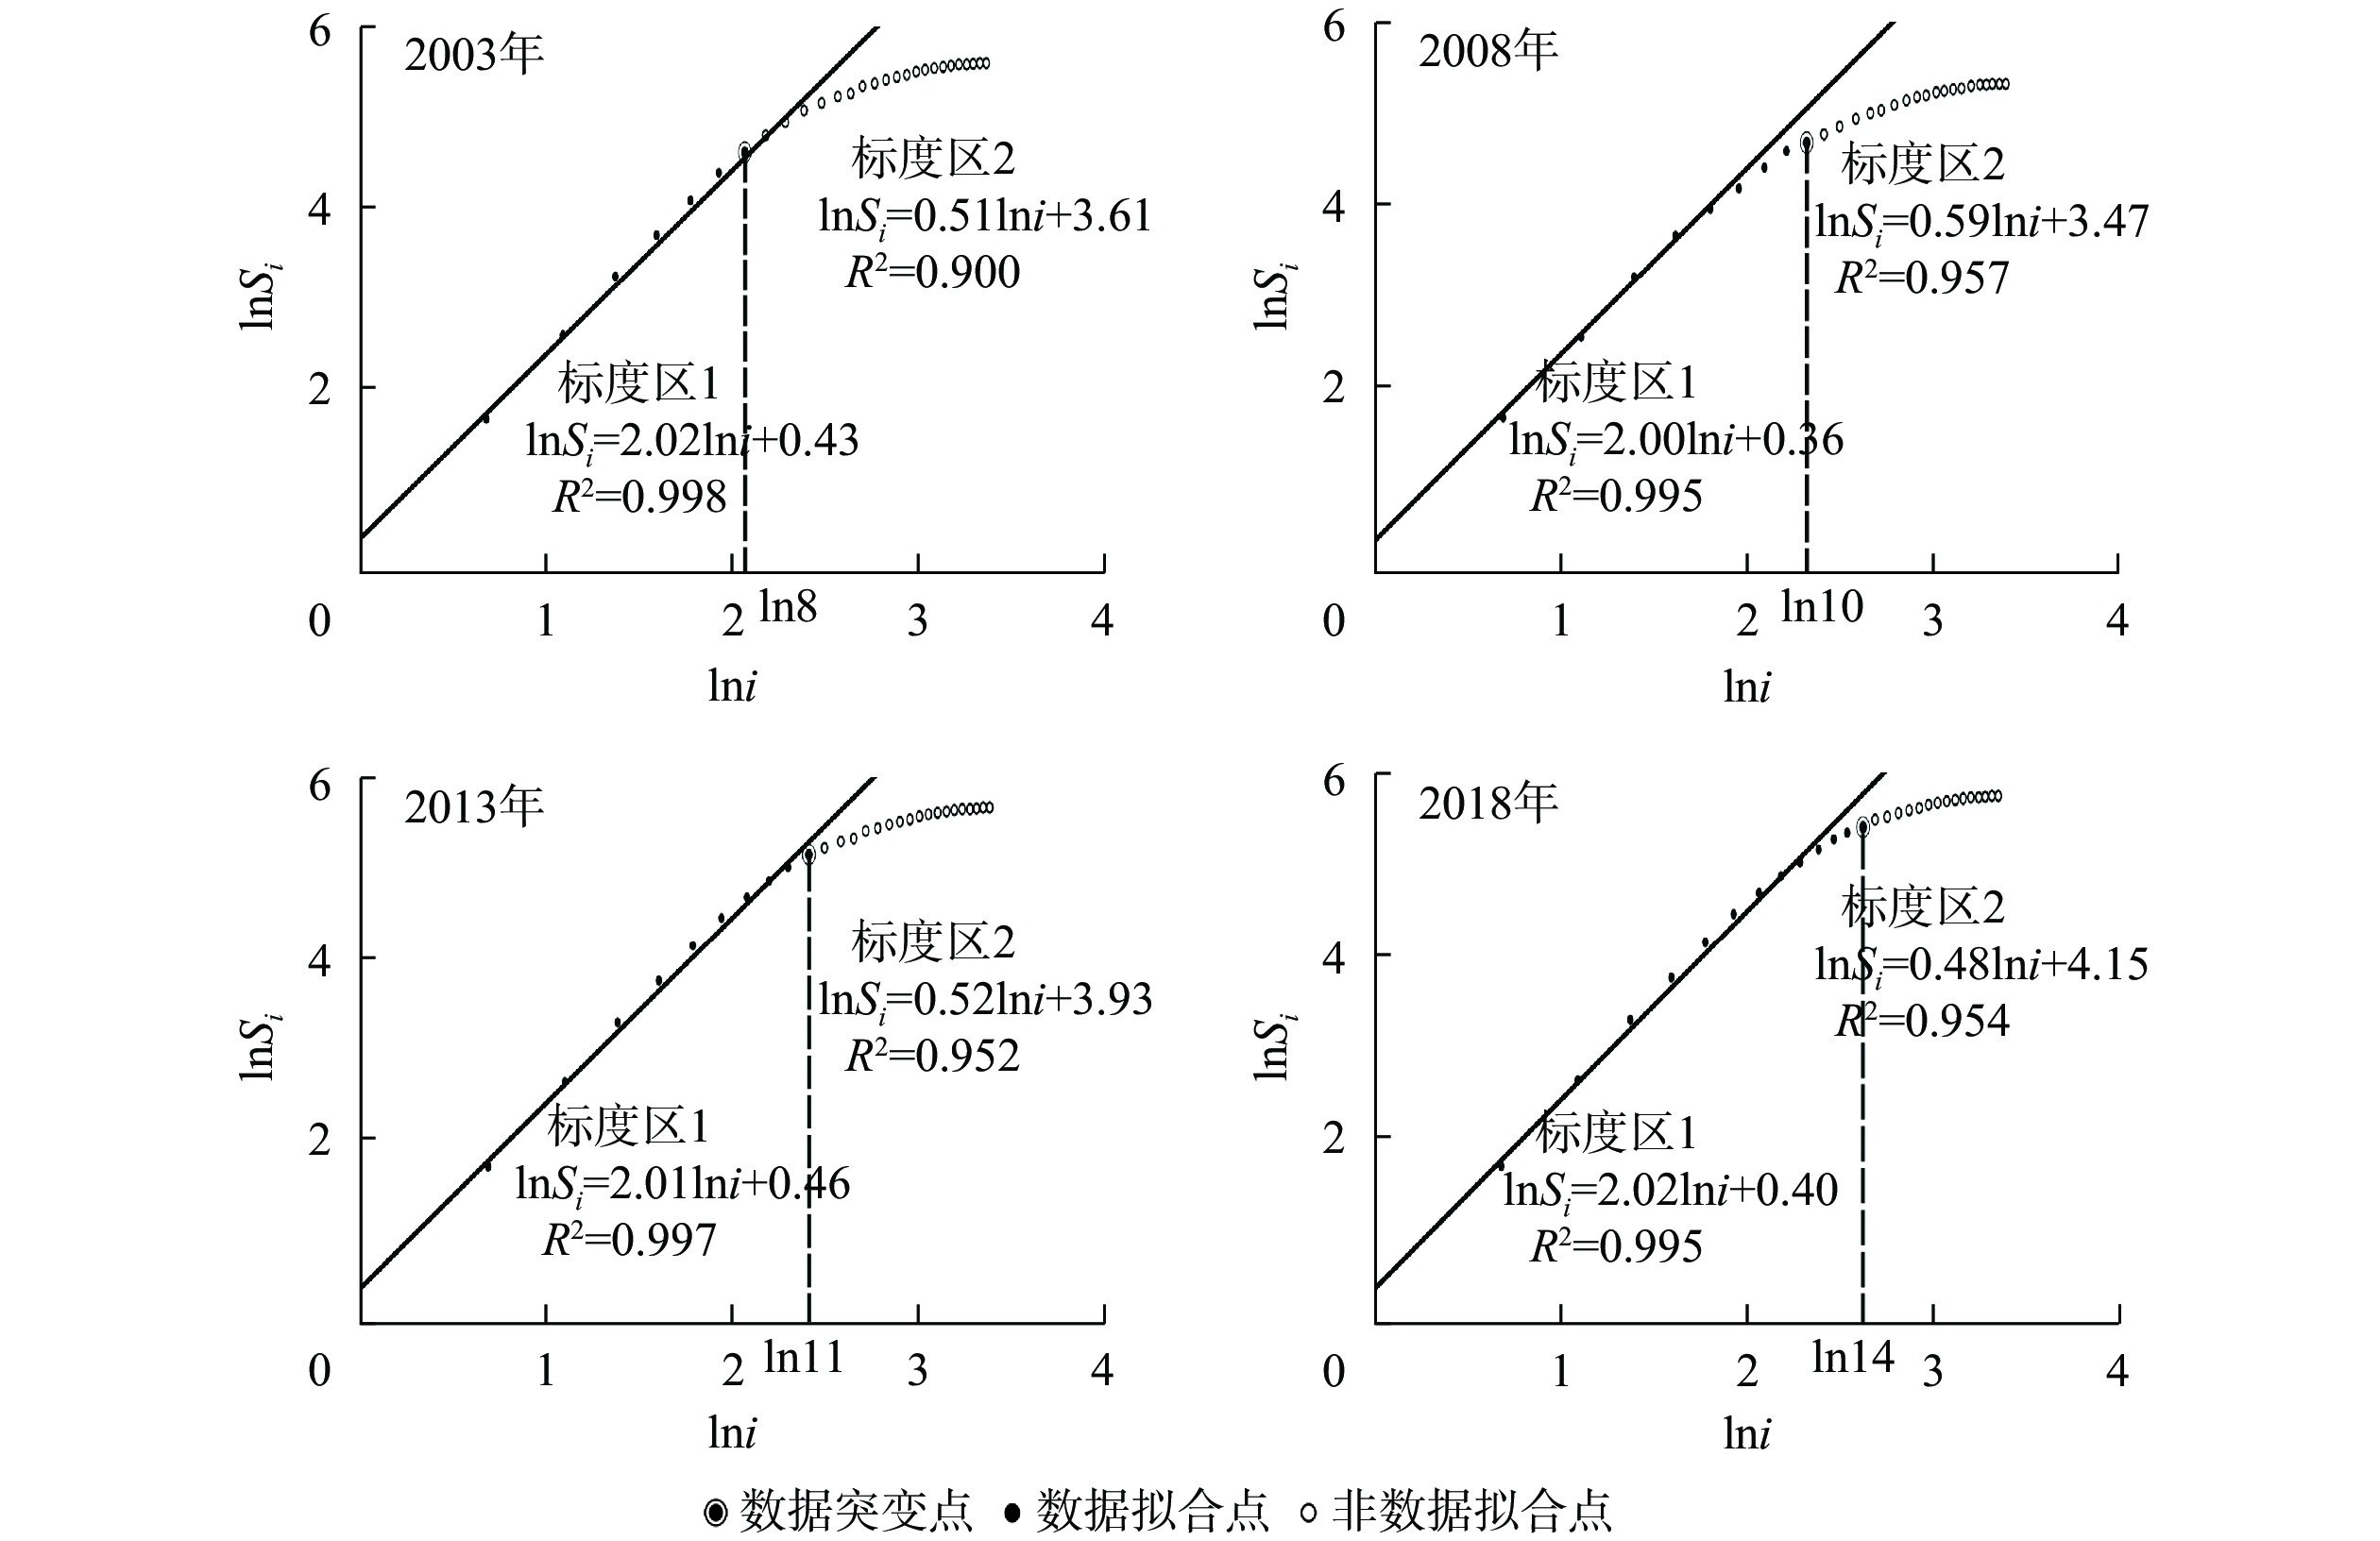
  • ①测量中心的选取。聚集维本质上仍属于一种局部分维数,数值依赖中心点的选择。本研究以市政府作为中心点,原因有二:其一,漯河市政府周边属政治中心,且地段繁华,是漯河市经济中心之一;其二,该点靠近沙澧河,能够清晰地反映河流对于疏解城市物质、能量流阻塞的有利影响。②建设用地聚集维数分析。以斜率2为分界线分为标度区1与标度区2(图3)。建设用地聚集分维特性在标度区1中表现最强,且建设用地整体呈高度聚集的态势,出现最大聚集效应,是整个城市的建设核心区。随着城市的发展,标度区1的半径由市政府周边4 000 m(8圈层,2003)逐步增长为5 000 m(10圈层,2008)、5 500 m(11圈层,2013),直至7 000 m(14圈层,2018),面积增长103.7 km2,扩大约3倍。③建设用地尺度特征分析。依次连接建设用地密度γ(i)获得尺度特征曲线(curve of scaling behaviour),标度区1可再分为Ⅰ~Ⅲ区,标度区2可独立成为第Ⅵ区(图4)。

    Figure 3.  The ln-ln plot on fractal dimensions of land use with the area-radius method

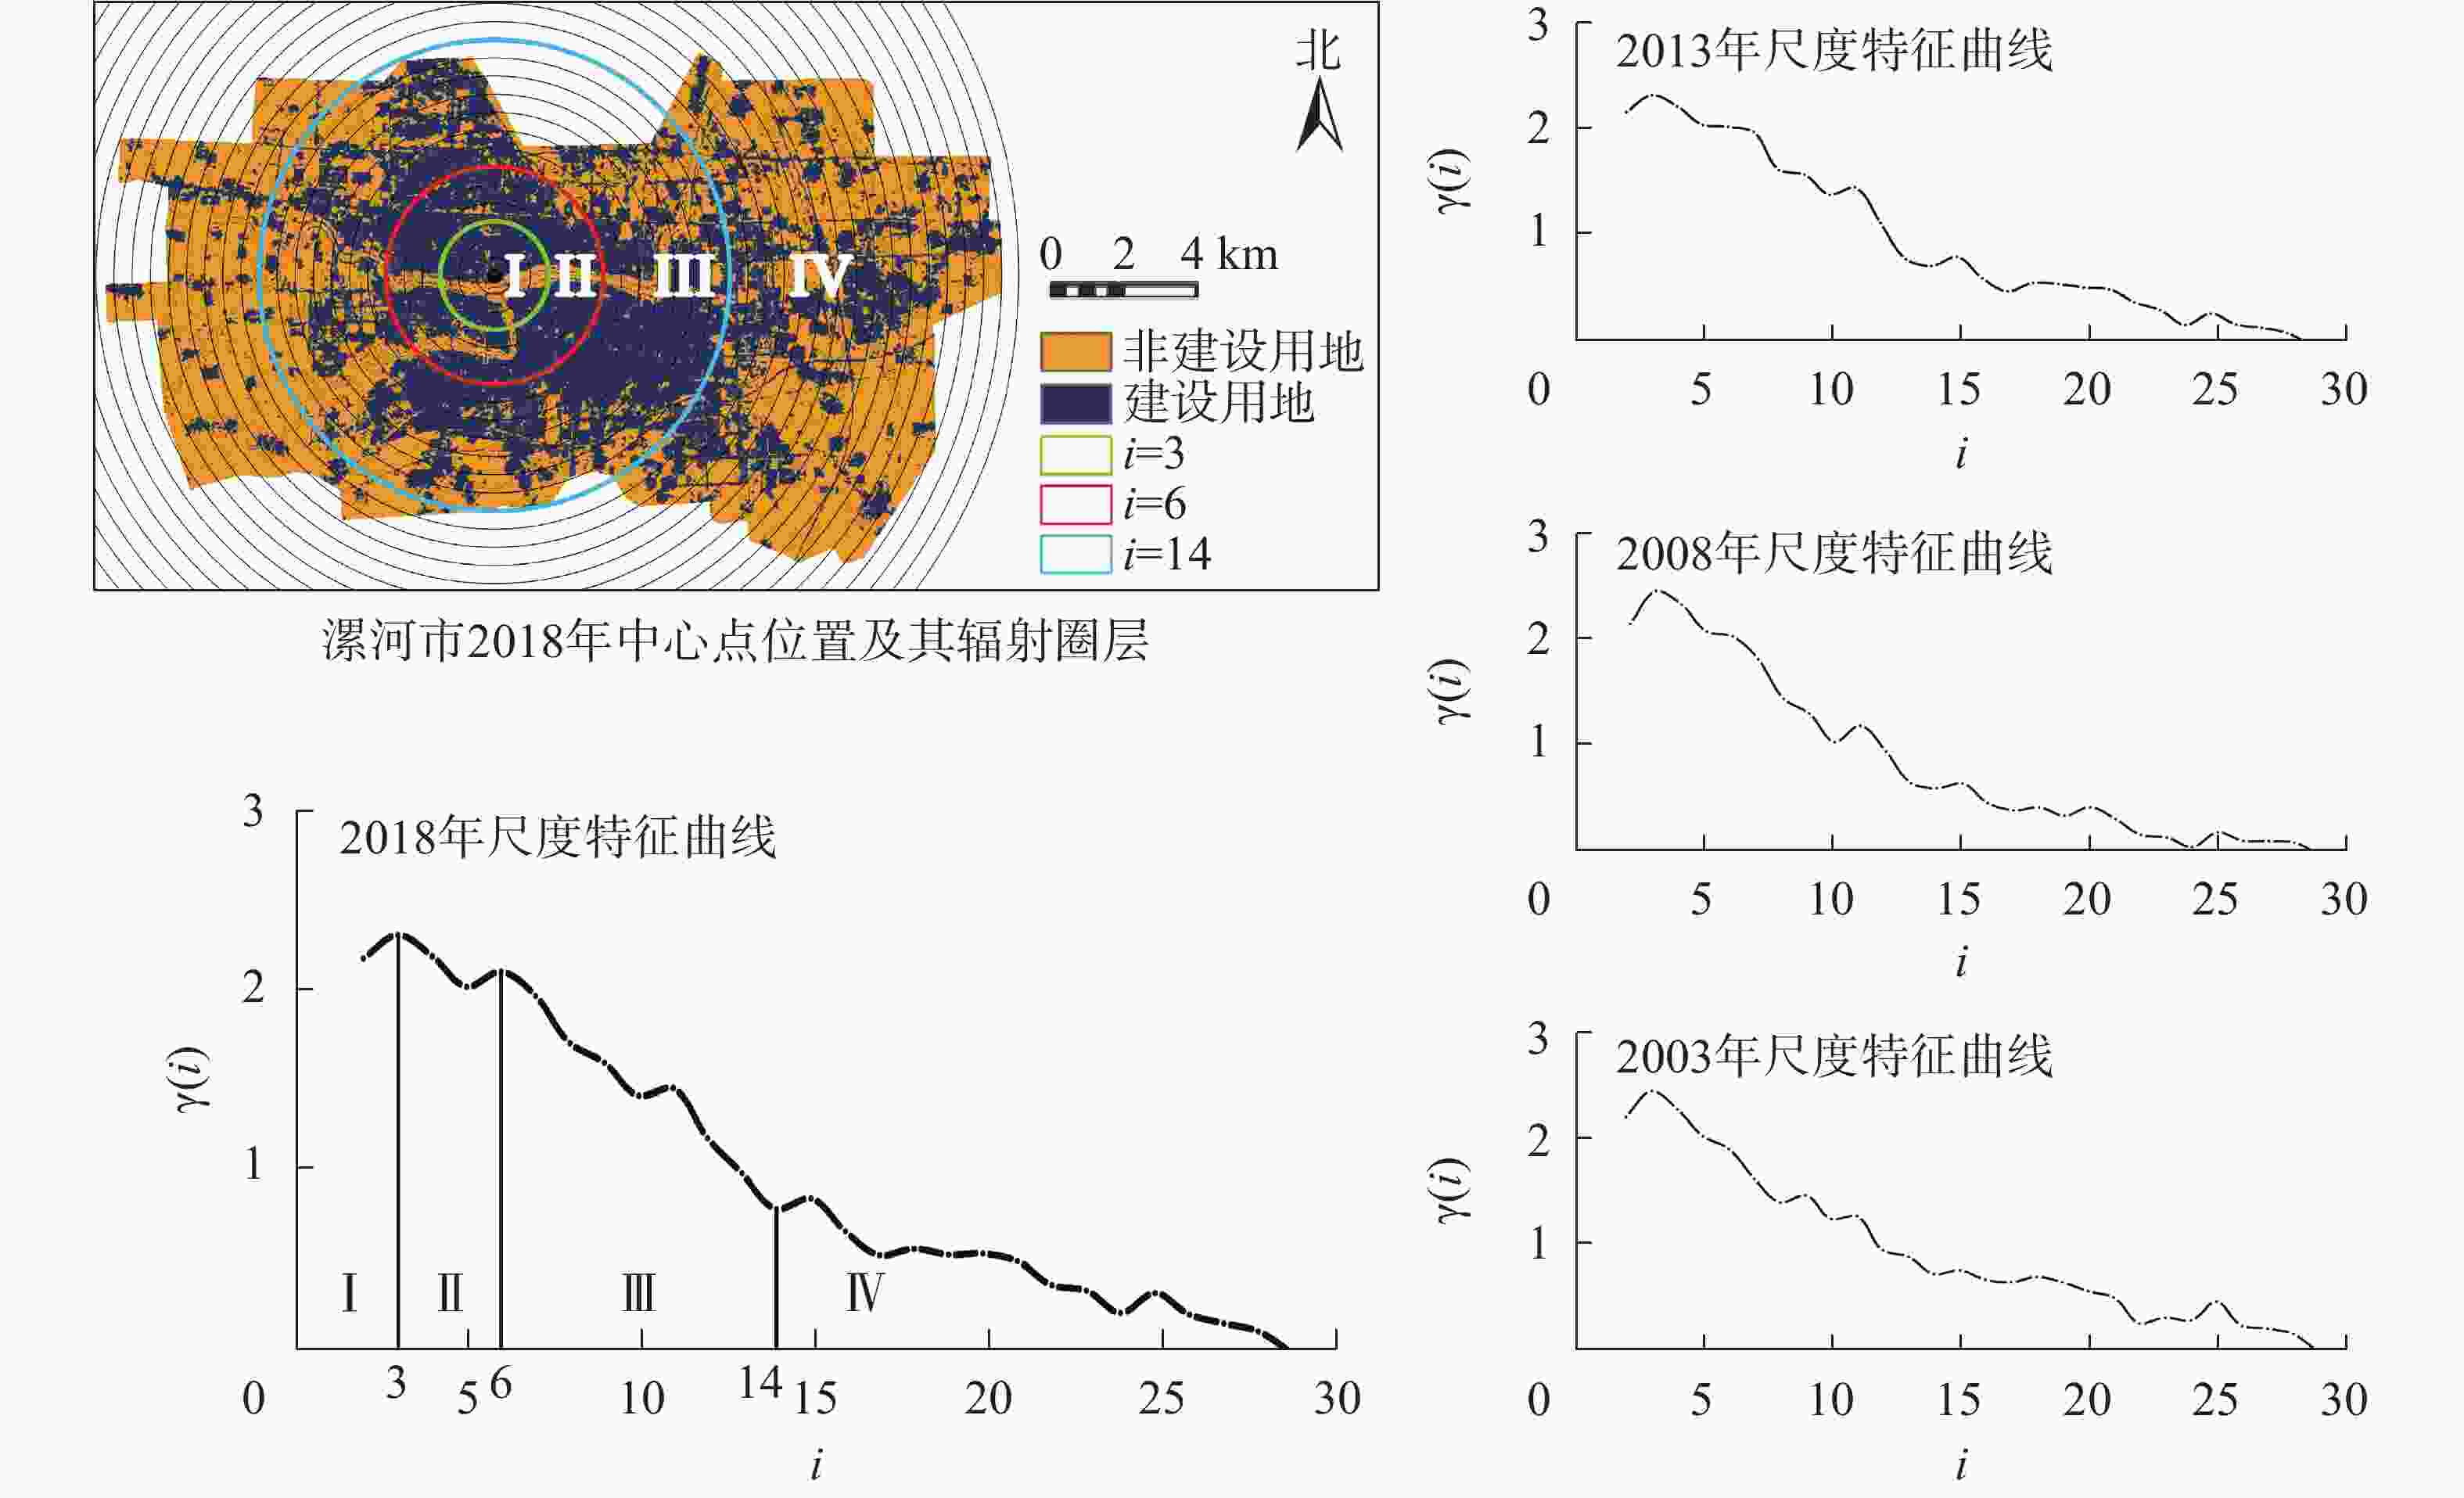
    Figure 4.  Local analysis of fractal behavior in Luohe

    分析2018年LUCC,可见漯河对内正进行“填空”发展,城市扩张驱动力不足,建设用地在Ⅰ~Ⅱ区域高度向心,但由于沙澧河对构筑空间与自然空间的联结作用,多年γ(i)数值基本稳定;第Ⅲ区持续扩大(图4)。生态斑块被不断向周边驱赶,最终导致核心区域的城市范围增长,环境持续恶化。

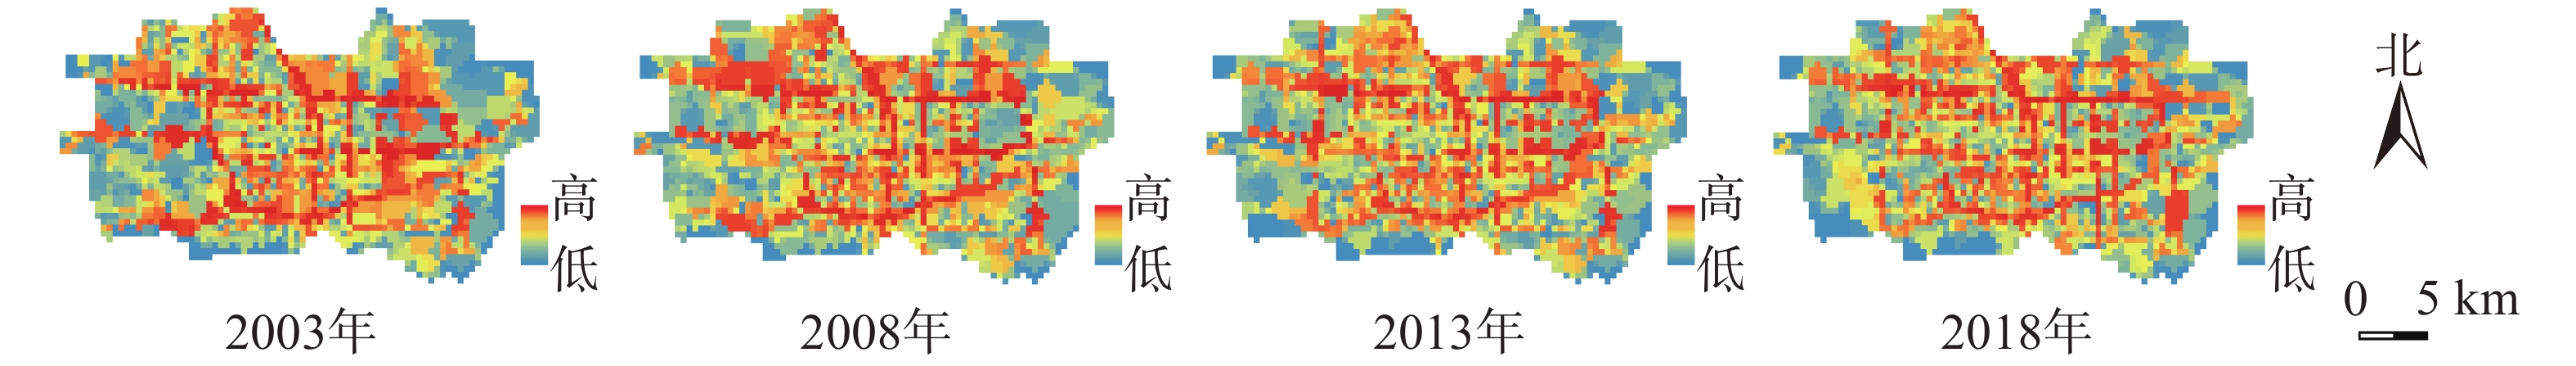
  • 对道路拓扑转绘,2003—2018年道路网络可达性逐步上升,道路交通建设逐步完善,最大值由1.558上升至1.610,均值由1.025上升至1.046。对于城市空间的研究,粒度的影响不可忽视,基于反距离插值法(IDW)转换为300 m粒度模拟街区尺度(neighborhood-level)绿度空间使用,理由有二:其一,根据广泛应用于评估绿度空间可达性的ANGSt (accessible natural greenspace standards)文件,中心点300 m内为街区尺度;其二,根据研究特性,适当进行粒度变换,可以降低运算压力,且使得研究结果具备一定范围内的自由度,降低了实施难度[23]。高可达性区域呈现中心密集、周边稀疏的扩散形态,与建设用地时空分布高度一致;数值较高的区域多为城市主干道,如淞江路、太行山路、交通路、人民路等,2003—2018年高可达性区域由中心向周边逐渐蔓延,特别是西部半岛区域与东部区域有了较大提升(图5)。

    Figure 5.  Spatial changes of efficiency values in 2003−2018

  • 在过去的15 a,绿度空间可达性一路走低,于2018年低至−0.31,交通可达性与非建设用地在空间整体布局上呈负相关(I<0)。以300 m网格为分析单元,5%显著性下绘制LISA聚集图,表征道路可达性-非建设用地率的高-高、低-低的空间正相关,或高-低、低-高的空间负相关,或无显著空间相关性(图6)。高-高聚集区域在2003—2018年由9.74%下跌至8.36%,且通常远离建成区。不断扩张的建成区范围内并不存在高-高聚集区域,多为高-低聚集区域,并夹杂少量低-低聚集区域,沙澧河等绿地资源丰富的区域却并未与交通可达性产生相关性。

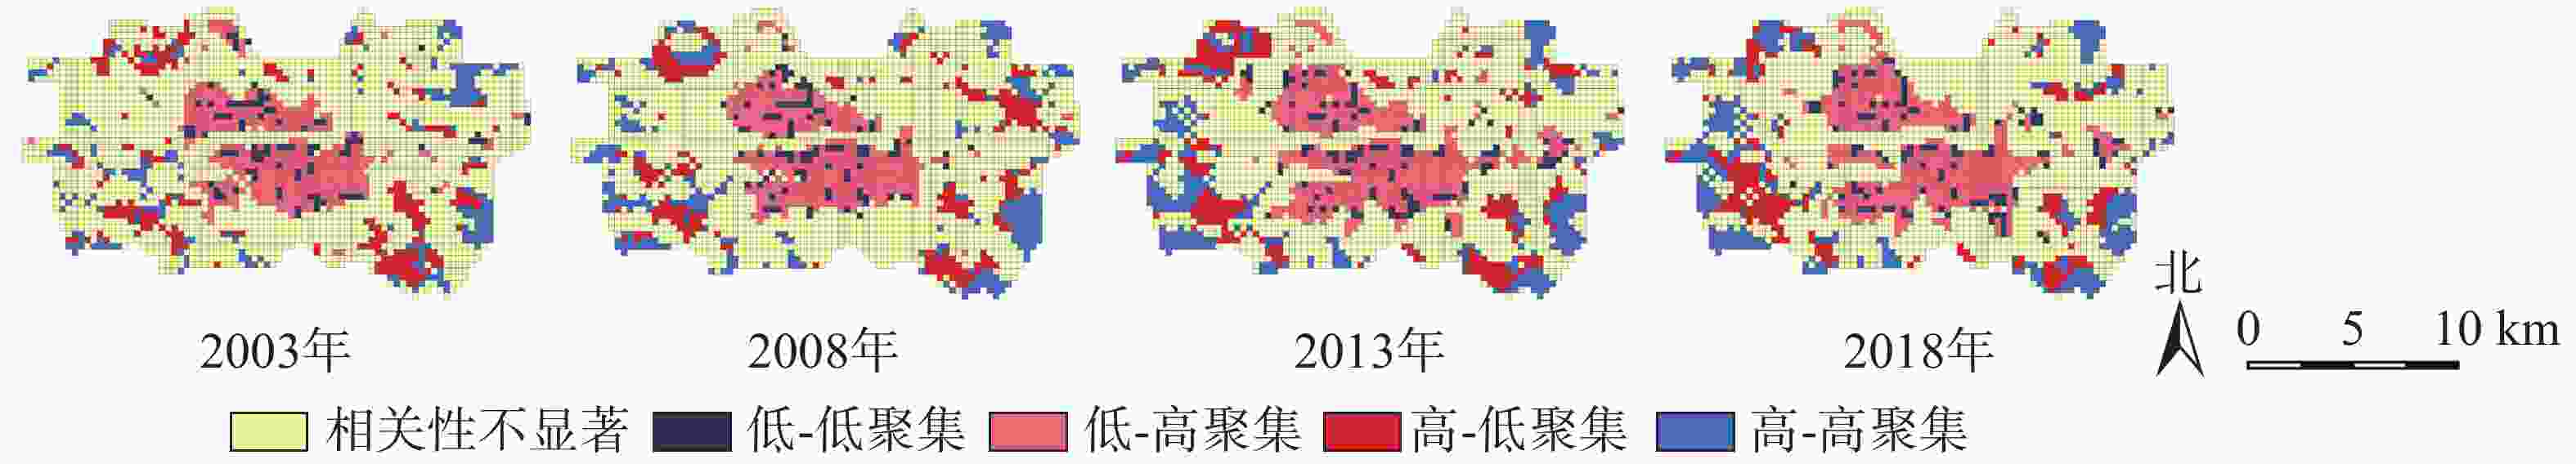
    Figure 6.  Network accessibility-Green Space LISA aggregation

  • 2001—2019年,隔3 a获取1份样本数据,对2025年建设用地数据进行模拟,平均相对误差为4.57%,效果较好。预测2025年漯河研究范围内建设用地元胞数将增至174 124个,即156.71 km2 (表3)。

    年份实际元胞数/个模拟元胞数/个相对误差/%
    200179 67479 6740.00
    200480 05476 0844.96
    200790 89785 6375.79
    201091 75996 3895.05
    2013100 667108 4917.77
    2016122 471122 1120.29
    2019142 551137 4443.59
    20251741 24

    Table 3.  Average GM(1, 1) simulation data and precision test

  • 通过ANN-CA-GM(1, 1)模型约束因子和用地性质的宏观控制,为更进一步开展定量分析,以“生态安全”为考量,依照“底线、约束和理想”的顺序设计出3种未来情景(图7表4)。①底线情景。底线情景LUCC不受任何政策影响,不设置红线并解除河流保护,各土地利用类型均按照2013—2018年趋势进行变化,建设用地增加元胞50 216 个(45.19 km2),大多在原有位置发生了扩张行为,主要集中在源汇区政府、金山北路附近漯河市城乡一体化示范区域,并出现了大量的河道侵占现象。总体而言,该情景下形态分维数增长剧烈,Df=1.83,远超1.71;仅有极少量建设用地转换为非建设用地,建设用地核心区继续扩大至7 500 m,绿度空间可达性值低于0,长此以往,将造成严重的生态问题。②约束情景。约束情景在底线情景的基础上添加生态保护红线(《河南省漯河市城市总体规划2012—2030》),判定该区域内只允许建设用地转入非建设用地,通过引导城市绿度空间布局,间接影响城市构筑空间发展。与底线情景相比,核心圈范围有所收敛(6 500 m),形态分维数也降低至1.80,绿度空间可达性数值有所改善,可见建设红线划定在保护生态安全方面作用显著,在城市发展程度恒定的情况下,生态保护红线的管控在一定程度上增强了城市向外发展的动力;核心区非建设用地得到了极大的保留,有利于绿道、风道等物质能量流通道的通畅。但形态分维数仍超过1.71,给定的规划红线不能完全控制城市形态、空间耦合关系达到最优,需要继续优化,引导实现城市的可持续发展。③理想情景。该情景模拟形态分维数回归过程:理想状态下,所有条件加以正向干预,重点促使市政府周边7 000 m范围内建设用地向非建设用地转化,至最佳分维范围后停止。形态分维数回归至1.72,处于最佳范围,建设用地元胞数回落至110 487 个,且核心圈层回落至11,转换元胞集中于道路及其周边区域,生态环境得到改善,绿度空间可达性仍低于0,但在多情景模拟中相对最佳。以理想情景为出发点,绿地系统规划在编制过程中,需支撑国土空间规划以优化国土空间“三线划定”,通过绿地布局以实现游憩、生态等产品的有效供给[18]

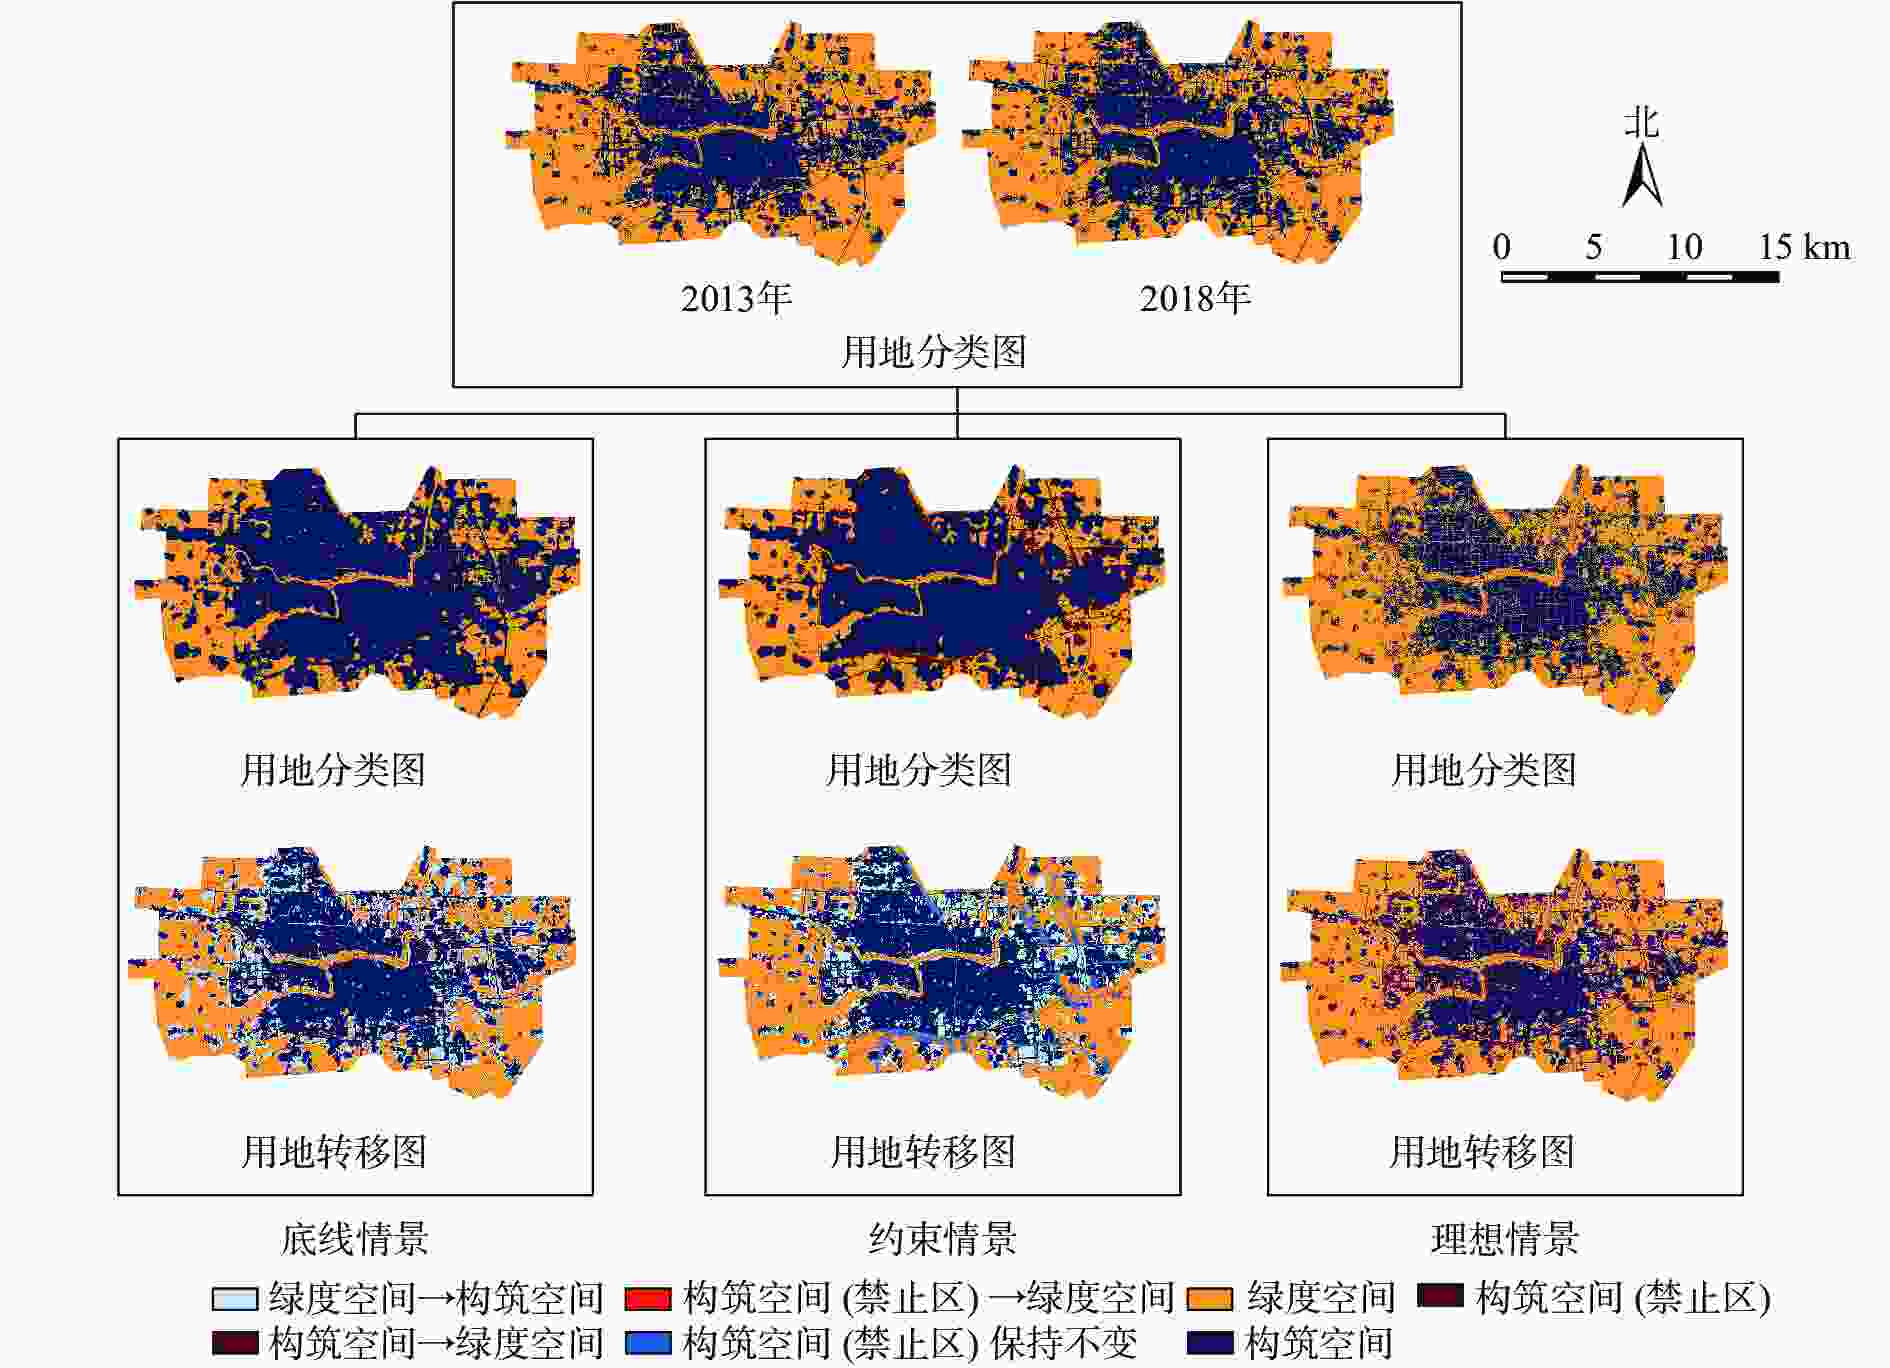
    Figure 7.  Land use scenario simulation results in 2025

    年份情景建设用地元胞数/个形态分维数R2核心圈层数(i)核心圈范围/m
    2018123 3781.750.994 6147 000
    2025底线173 5941.830.997 6157 500
    约束158 7701.800.994 9136 500
    理想110 4871.720.981 2115 500

    Table 4.  Multi-scene raster data

  • 本研究借助分维数探索空间的耦合关系;选取3个大类14个小项驱动因子,导入CA复合限制模型预测2025年中心城区建设用地规模,并进行未来土地布局预测。2008年前漯河城市尚处于发展阶段(Df<1.71);2013年城市化形态基本成型(Df≈1.71);而至2018年,城市建设过密、用地形式过于“整齐”,诸多城市弊病开始显现(Df>1.71)。但漯河的过度建设并非整体均匀地出现在整个规划范围内,而是形成1个致密的建设核心,在沙澧河及其周边绿地高效疏解作用的前提下,该核心从4 000 m扩张至7 000 m,使得构筑空间与绿度空间之间物质能量交互界面减少、流动受阻,威胁生态安全[24]。15 a间,城市高可达性区域基本处于建成区范围内,其提升基本与建设用地的蔓延相吻合。博弈之下,漯河市绿地则因错配导致可达、可用性不足[25]:建成区域内呈现近乎一致的“高可达-低绿地”聚集情况,滨河绿地生态效益无法被充分利用。

    为模拟形态分维向理想值回归,设计“底线、约束和理想”3种情景。底线情景建设用地无序发展,核心区继续扩张(Df=1.83);约束情景则导入用地红线,控制建设用地有序蔓延(Df=1.80);理想情景在仅考虑绿地效益最大化的前提下,减少10.45%(11.60 km2)的建设用地,构筑空间集聚范围回落至5 500 m,与绿度空间面积比为1.00∶1.48,城市形态从单一转向复杂(Df=1.72),打通了城市与自然界的物质、能量流动,城市病问题得到了一定的缓解。相比之下,理想情景更好地考虑了生态(生态空间保护)、生产(城乡关系协调)和生活(居民对城市绿地的需求)的城市结构,符合当前国土空间规划中对“三生空间”的重视[26],应为城市总体规划市域划定、制定城区空间管制政策提供重要参考和基础依据。

    在促使城市分维数回落的案例上,伦敦形态分维数在1820—1939年从1.32上升至1.79,城市环境严重恶化。1966年“伦敦大火”后重新整饬城市绿地,分维值也逐渐稳定在1.72(1981年)[27],成为世界绿城。北京、武汉、南京等14个城市自1990年后整体形态分维数总体呈现下降趋势,其中,1981年北京整体形态分维数约1.930,2000年随城市治理下降至1.907[28]

    在可达性的度量方面,除本研究所使用的空间句法,Ga2SFCA也被广泛应用[29],参与如郑州等城市公园绿地与人口分布严重不符的资源错配研究[30]。这类研究显示:只有将绿地系统网络化、区域化,控制、连接、融合3种城乡绿色空间,才能摆脱“路径依赖”,促进多系统协同配给[31],如基于“精明规划”与“跨域联动”策略的长沙市株潭区绿地资源保护与整合[32],实现了多系统之间信息交互以及资源的最大化利用。

    而基于CLUE-S、ABM等模型的未来多情景用地预测也是研究热点,作为一个“复杂系统”,城市由无限多的随机变数与因子有机互动而成,却能通过控制少数关键变量,促进城市系统“自组织性”[33]。情景模拟不仅能够得出具体的定量结果,而且还能分析达到未来不同发展情景的可行性,在生态预警、环境监测、资源调动等方面发挥了巨大作用。但对未来路网模拟数据的缺乏,致使本研究无法继续进行绿度空间可达性的未来度量,对于土地利用的控制限于本研究所述的“建设核心区”,往年可达性冷热点用地改造滨河绿地的选择并未具体到设计层面,将是进一步的研究方向。

Reference (33)

Catalog

    /

    DownLoad:  Full-Size Img  PowerPoint
    Return
    Return