Volume 39 Issue 1
Feb.  2022
Turn off MathJax
Article Contents

CAI Mengqing, HUANG Lu, YAN Lijiao. Temporal and spatial variation characteristics of annual water yield and its influencing factors in Hangzhou based on InVEST model[J]. Journal of Zhejiang A&F University, 2022, 39(1): 127-135. doi: 10.11833/j.issn.2095-0756.20210170
Citation: CAI Mengqing, HUANG Lu, YAN Lijiao. Temporal and spatial variation characteristics of annual water yield and its influencing factors in Hangzhou based on InVEST model[J]. Journal of Zhejiang A&F University, 2022, 39(1): 127-135. doi: 10.11833/j.issn.2095-0756.20210170

Temporal and spatial variation characteristics of annual water yield and its influencing factors in Hangzhou based on InVEST model

doi: 10.11833/j.issn.2095-0756.20210170
  • Received Date: 2021-02-08
  • Rev Recd Date: 2021-08-21
  • Available Online: 2022-02-14
  • Publish Date: 2022-02-14
  •   Objective   Natural factors and land use changes are important driving factors of ecosystem services change. The analysis of temporal and spatial variation characteristics in annual water yield and its main driving factors have practical significance for maintaining or improving urban soil and water conservation.   Method   This study took Hangzhou as the research object, adopted methods of landscape pattern analysis, spatial gradient analysis, and correlation analysis with the support of the InVEST model, ArcGIS, Fragstats, SPSS and other tools, identified the characteristics of land use and meteorological factors of Hangzhou, evaluated and analyzed the temporal and spatial variation of annual water yield and its correlation with meteorological factors and landscape pattern indices.   Result   The annual water yield in Hangzhou showed a first decline and then an upward trend from 2000 to 2015. The water yield is spatially high in the northeast and low in the southwest, and increased first and then decreased with distance from the city center, reaching the maximum at 10 km. Construction land had the largest water yield. The most dramatic change in land use in Hangzhou from 2000 to 2015 was the conversion between cultivated land and construction land. On the whole, the landscape showed a stronger trend of fragmentation and heterogeneity, reaching a peak at 10−20 km from the city center. The annual precipitation in Hangzhou decreased first and then increased. The annual average temperatures fluctuating increased and the annual actual evapotranspiration fluctuated. The annual precipitation does not change significantly within 50 km of the city center. The annual average temperature decreased significantly as it moved away from the urban center, while the annual actual evapotranspiration first decreased and then increased. The correlation between water yield and meteorological factors was greater than that of landscape patterns indices. Water yield had the strongest positive correlation with precipitation in meteorological factors.   Conclusion   The change of meteorological factors was the main factor causing annual water yield change in Hangzhou, but the impact of landscape pattern was still worthy of attention. The 10 km distance from the city center was the turning point of annual water yield. [Ch, 4 fig. 7 tab. 34 ref.]
  • [1] XU Hao, LI Wei, LIU Wei, WANG Chengkang.  Spatio-temporal evolution of Nanjing’s urban green space pattern and its influencing factors . Journal of Zhejiang A&F University, 2023, 40(2): 407-416. doi: 10.11833/j.issn.2095-0756.20220332
    [2] LIU Yuqing, ZHANG Huabing, SUN Xiaoxiang, LI Yufeng.  Spatial-temporal variations of landscape pattern and hot spot analysis in the Lixiahe Plain of Jiangsu Province from 1980 to 2018 . Journal of Zhejiang A&F University, 2022, 39(1): 105-114. doi: 10.11833/j.issn.2095-0756.20210178
    [3] CAO Jiashuo, DENG Zhengyu, HU Yuandong, WU Yan.  Spatial and temporal evolution and driving forces of the landscape pattern in Shennongjia Forestry District . Journal of Zhejiang A&F University, 2021, 38(1): 155-164. doi: 10.11833/j.issn.2095-0756.20200279
    [4] ZHANG Tianran, ZHENG Wenge, ZHANG Yinke, HUANG Fang, LI Xiaolu, YUAN Chuyang, YU Hui, YAN Hai, SHAO Feng.  Pollution characteristics of heavy metals in PM2.5 in four kinds of green space in Lin’an District of Hangzhou City . Journal of Zhejiang A&F University, 2021, 38(4): 737-745. doi: 10.11833/j.issn.2095-0756.20200558
    [5] YAN Zepu, ZHANG Jiaqi, LIANG Bi, WEI Guangli, ZHANG Qixiang, WANG Zhengjia.  Effects of exogenous gibberellin on growth of Carya illinoensis and its metabolic gene expression . Journal of Zhejiang A&F University, 2020, 37(5): 922-929. doi: 10.11833/j.issn.2095-0756.20190566
    [6] YU Fei, LI Zhiyong.  Forests landscape pattern changes and driving forces in Mount Tianmu . Journal of Zhejiang A&F University, 2020, 37(3): 439-446. doi: 10.11833/j.issn.2095-0756.20190306
    [7] DAI Aona, LIU Xiaoxiao, WANG Bing, DAI Wei.  Annual spatial and temporal variations of soil organic carbon and its components in Castanopsis fargesii forest . Journal of Zhejiang A&F University, 2018, 35(3): 405-411. doi: 10.11833/j.issn.2095-0756.2018.03.003
    [8] ZHU Wankuan, CHEN Shaoxiong, Roger ARNOLD, WANG Zhichao, XU Yuxing, DU Apeng.  Temporal and spatial dynamics of soil respiration and influencing factors in Eucalyptus plantations . Journal of Zhejiang A&F University, 2018, 35(3): 412-421. doi: 10.11833/j.issn.2095-0756.2018.03.004
    [9] QIU Wenxin, ZHANG Yong, YU Jiajun, ZHANG Chao, ZHENG Chaochao, YU Shuquan.  Feasibility verification with field application of a water conservation module using the InVEST Model . Journal of Zhejiang A&F University, 2018, 35(5): 810-817. doi: 10.11833/j.issn.2095-0756.2018.05.004
    [10] GUO Yujing, WANG Yan, ZHENG Yi, LIU Yungen, WEN Guojing, ZHAN Pengfei.  Temporal and spatial evolution of landscapes in Jianhu Lake Basin of northwestern Yunnan Province . Journal of Zhejiang A&F University, 2018, 35(4): 695-704. doi: 10.11833/j.issn.2095-0756.2018.04.015
    [11] WEN Guojing, LIU Yungen, WANG Yan, HOU Lei, WANG Yanxia, GUO Yujing.  Temporal and spatial evolution of landscape patterns and ecological risk in the Puzhehei Lake basin . Journal of Zhejiang A&F University, 2017, 34(6): 1095-1103. doi: 10.11833/j.issn.2095-0756.2017.06.018
    [12] WU Luyi, YUE Yongjie, LIU Guohou, GAO Runhong, SU Zhicheng.  Climate changes affecting regional landscape patterns at Xanadu . Journal of Zhejiang A&F University, 2016, 33(2): 232-238. doi: 10.11833/j.issn.2095-0756.2016.02.007
    [13] JIANG Wen-wei, GUO Yun-xue, YANG Shu-zhen, ZHAO Ming-shui.  Temporal and spatial changes for sap flow velocity of Cryptomeria fortunei stems in National Nature Reserve of Mount Tianmu . Journal of Zhejiang A&F University, 2012, 29(6): 859-866. doi: 10.11833/j.issn.2095-0756.2012.06.009
    [14] GUO Hui-hui, JIANG Wen-wei, MEI Yan-xia.  Landscape pattern analysis of Yinzhou new city zone based on high spatial resolution aerial photos . Journal of Zhejiang A&F University, 2012, 29(3): 344-351. doi: 10.11833/j.issn.2095-0756.2012.03.005
    [15] YANG Zi-qing, CHEN Ping-liu, LIU Jian, YU Kun-yong, LIAO Xiao-li, YOU Hao-chen, GONG Cong-hong.  Spatio-temporal variation of distribution patterns in Cunninghamia lanceolata plantations . Journal of Zhejiang A&F University, 2012, 29(3): 374-382. doi: 10.11833/j.issn.2095-0756.2012.03.008
    [16] CHE Teng-teng, FENG Yi-ming, CAI Dao-xiong, ZHANG Wan-xing, ZHANG Xian-qiang, WU Chun-zheng.  Dynamics analysis on landscape patterns of Chinese tropical and subtropical plantation areas . Journal of Zhejiang A&F University, 2011, 28(5): 706-712. doi: 10.11833/j.issn.2095-0756.2011.05.004
    [17] GUO Zheng, JIANG Hong, CHEN Jian, CHENG Miao-miao, JIANG Zi-shan, YU Shu-quan, LI Tu-sheng.  Forest landscape analysis with remote sensing data for Yuhang,Zhejiang Province . Journal of Zhejiang A&F University, 2010, 27(1): 36-43. doi: 10.11833/j.issn.2095-0756.2010.01.006
    [18] XIA Wei-weil, HAN Hai-rong, YI Li-ta, CHENG Xiao-qin.  Dynamics of forest landscape pattern in Pangquangou National Nature Reserve . Journal of Zhejiang A&F University, 2008, 25(6): 723-727.
    [19] SUN Da,  HUANG Fang,  CAI Rong-rong,  QIN Hua,  ZHUANG Shun-yao,  ZHANG Miao-xian, CAO Zhi-hong.  Temporal and spatial variation of soil phosphorus in Phyllostachys praecox stands under intensive cultivation management . Journal of Zhejiang A&F University, 2007, 24(6): 670-674.
    [20] CAI Rong-rong, HUANG Fang, SUN Da, QINHua, YANG Fang, ZHUANG Shun-yao, ZHOUGuo-mo, CAO Zhi-hong.  Temporal and spatial variation of soil organic matters in Phyllostachys praecox stands with intensive cultivation management . Journal of Zhejiang A&F University, 2007, 24(4): 450-455.
  • [1]
    Millennium Ecosystem Assessment. Ecosystem and Human Well-being: Synthesis[M]. Washington DC: Island Press, 2005: 137.
    [2]
    BAI Yang, OCHUODHO T O, YANG Jian. Impact of land use and climate change on water-related ecosystem services in Kentucky, USA [J]. Ecol Indic, 2019, 102: 51 − 64.
    [3]
    LANG Yanqing, SONG Wei, ZHANG Ying. Responses of the water-yield ecosystem service to climate and land use change in Sancha River Basin, China [J]. Physic Chem Earth, 2017, 101: 102 − 111.
    [4]
    ZHENG Hua, LI Yifeng, ROBINSON B E, et al. Using ecosystem service trade-offs to inform water conservation policies and management practices [J]. Front Ecol Environ, 2016, 14(10): 527 − 532.
    [5]
    LÜ Leting, REN Tiantian, LI Saisai, et al. Analysis on spatio-temporal variation of water supply in Dalian City based on InVEST model [J]. Bull Soil Water Conserv, 2019, 39(4): 144 − 150, 157.
    [6]
    PAN Tao, WU Shaohong, DAI Erfu, et al. Spatiotemporal variation of water source supply service in Three Rivers Source Area of China based on InVEST model [J]. Chin J Appl Ecol, 2013, 24(1): 183 − 189.
    [7]
    LEGESSE D, VALLET-COULOMB C, GASSE F. Hydrological response of a catchment to climate and land use changes in Tropical Africa: case study South Central Ethiopia [J]. J Hydrol, 2003, 275(1): 67 − 85.
    [8]
    PESSACG N, FLAHERTY S, BRANDIZI L, et al. Getting water right: a case study in water yield modelling based on precipitation data [J]. Sci Total Environ, 2015, 537: 225 − 234.
    [9]
    SAMPLE J E, BABER I, BADGER R. A spatially distributed risk screening tool to assess climate and land use change impacts on water-related ecosystem services [J]. Environ Modelling Software, 2016, 83: 12 − 26.
    [10]
    HOYER R, CHANG Heejun. Assessment of freshwater ecosystem services in the Tualatin and Yamhill basins under climate change and urbanization [J]. Appl Geogr, 2015, 53: 402 − 416.
    [11]
    GAO Jie, LI Feng, GAO Hui, et al. The impact of land-use change on water-related ecosystem services: a study of the Guishui River Basin, Beijing, China [J]. J Cleaner Prod, 2016, 163(S): 148 − 155.
    [12]
    NIE Wenming, YUAN Yongping, KEPNER W, et al. Assessing impacts of land use and land cover changes on hydrology for the upper San Pedro watershed [J]. J Hydrol, 2011, 407: 105 − 114.
    [13]
    GU Jinyi, LI Yiping, DU Wei. Evaluation on water source conservation capacity and analysis of its variation characteristics of Taihu Lake Basin based on InVEST model [J]. Water Resour Prot, 2018, 34(3): 62 − 67, 84.
    [14]
    DOU Panfeng, ZUO Shudi, REN Yin, et al. The impacts of climate and land use/land cover changes on water yield service in Ningbo region [J]. Acta Sci Circum, 2019, 39(7): 2398 − 2409.
    [15]
    HU Wenmin, LI Guo, GAO Zhihai, et al. Assessment of the impact of the Poplar Ecological Retreat Project on water conservation in the Dongting Lake wetland region using the InVEST model[J/OL]. Sci Total Environ, 2020, 733: 139423[2021-01-20]. doi: 10.1016/j.scitotent.2020.139423.
    [16]
    MOREIRA M, FONSECA C, VERGÍLIO M, et al. Spatial assessment of habitat conservation status in a Macaronesian island based on the InVEST model: a case study of Pico Island (Azores, Portugal) [J]. Land Use Policy, 2018, 78: 637 − 649.
    [17]
    LOGSDON R A, CHAUBEY I. A quantitative approach to evaluating ecosystem services [J]. Ecol Modelling, 2013, 257(24): 57 − 65.
    [18]
    VIGERSTOL K L, AUKEMA J E. A comparison of tools for modeling freshwater ecosystem services [J]. J Environ Manage, 2011, 92(10): 2403 − 2409.
    [19]
    de GROOT R S, ALKEMADE R, BRAAT L, et al. Challenges in integrating the concept of ecosystem services and values in landscape planning, management and decision making [J]. Ecol Complex, 2009, 7(3): 260 − 272.
    [20]
    GRAFIUS D R, CORSTANJE R, HARRIS J A. Linking ecosystem services, urban form and green space configuration using multivariate landscape metric analysis [J]. Landscape Ecol, 2018, 33(4): 557 − 573.
    [21]
    DAVIES Z G, EDMONDSON J L, HEINEMEYER A, et al. Mapping an urban ecosystem service: quantifying above-ground carbon storage at a city-wide scale [J]. J Appl Ecol, 2011, 48(5): 1125 − 1134.
    [22]
    ANDERSSON E, AHRNÉ K, PYYKÖNEN M, et al. Patterns and scale relations among urbanization measures in Stockholm, Sweden [J]. Landscape Ecol, 2009, 24(10): 1331 − 1339.
    [23]
    LI Quan, LI Teng, YANG Mingzheng, et al. Spatiotemporal variation of ecosystem services value based on gradient analysis in Wuhan: 2000−2010 [J]. Acta Ecol Sin, 2017, 37(6): 2118 − 2125.
    [24]
    YOU Songcai, DI Suchuang, YUAN Ye. Study on soil field capacity estimation in the Loess Plateau Region [J]. J Nat Resour, 2009, 24(3): 545 − 552.
    [25]
    ZHANG Lingyushan, HICKEL K, DAWES W R, et al. A rational function approach for estimating mean annual evapotranspiration [J]. Water Resour Res, 2004, 40(2): 89 − 97.
    [26]
    DONOHUE R J, RODERICK M L, McVICAR T R. Roots, storms and soil pores: Incorporating key ecohydrological processes into Budyko’s hydrological model [J]. J Hydrol, 2012, 436/437: 35 − 50.
    [27]
    ZHANG Canqiang, LI Wenhua, ZHANG Biao, et al. Water yield of Xitiaoxi River Basin based on InVEST modeling [J]. J Resour Ecol, 2012, 3(1): 50 − 54.
    [28]
    HOU Lei, WU Faqi, XIE Xinli. The spatial characteristics and relationships between landscape pattern and ecosystem service value along an urban-rural gradient in Xi’an city, China[J/OL]. Ecol Indic, 2020, 108: 105720[2021-01-20]. doi: 10.1016/j.ecoind.2019.105720.
    [29]
    ZHAO Xiaosong, LIU Yuanbo, WU Guiping. A remote-sensing-based study on evapotranspiration and the environmental factors over the Lake Poyang region [J]. J Lake Sci, 2013, 25(3): 428 − 436.
    [30]
    LU Huiting, HUANG Qiongzhong, ZHU Jieyuan, et al. Ecosystem type and quality changes in Lhasa River Basin and their effects on ecosystem services [J]. Acta Ecol Sin, 2018, 38(24): 8911 − 8918.
    [31]
    YU Zhaowu, YAO Yawen, YANG Gaoyuan, et al. Strong contribution of rapid urbanization and urban agglomeration development to regional thermal environment dynamics and evolution [J]. For Ecol Manage, 2019, 446: 214 − 225.
    [32]
    SHOU Feiyun, LI Zhuofei, HUANG Lu, et al. Spatial differentiation and ecological patterns of urban agglomeration based on evaluations of supply and demand of ecosystem services: a case study on the Yangtze River Delta [J]. Acta Ecol Sin, 2020, 40(9): 2813 − 2826.
    [33]
    QIU Wenxin, ZHANG Yong, YU Jiajun, et al. Feasibility verification with field application of a water conservation module using the InVEST Model [J]. J Zhejiang A&F Univ, 2018, 35(5): 810 − 817.
    [34]
    NALEWANKOVÁ P, SITKOVÁ Z, KUCERA J, et al. Impact of water deficit on seasonal and diurnal dynamics of European Beech transpiration and time-lag effect between stand transpiration and environmental drivers[J/OL]. Water, 2020, 12(12): 3437[2021-01-20]. doi: 10.3390/w12123437.
  • 加载中
通讯作者: 陈斌, bchen63@163.com
  • 1. 

    沈阳化工大学材料科学与工程学院 沈阳 110142

  1. 本站搜索
  2. 百度学术搜索
  3. 万方数据库搜索
  4. CNKI搜索

Figures(4)  / Tables(7)

Article views(1279) PDF downloads(295) Cited by()

Related
Proportional views

Temporal and spatial variation characteristics of annual water yield and its influencing factors in Hangzhou based on InVEST model

doi: 10.11833/j.issn.2095-0756.20210170

Abstract:   Objective   Natural factors and land use changes are important driving factors of ecosystem services change. The analysis of temporal and spatial variation characteristics in annual water yield and its main driving factors have practical significance for maintaining or improving urban soil and water conservation.   Method   This study took Hangzhou as the research object, adopted methods of landscape pattern analysis, spatial gradient analysis, and correlation analysis with the support of the InVEST model, ArcGIS, Fragstats, SPSS and other tools, identified the characteristics of land use and meteorological factors of Hangzhou, evaluated and analyzed the temporal and spatial variation of annual water yield and its correlation with meteorological factors and landscape pattern indices.   Result   The annual water yield in Hangzhou showed a first decline and then an upward trend from 2000 to 2015. The water yield is spatially high in the northeast and low in the southwest, and increased first and then decreased with distance from the city center, reaching the maximum at 10 km. Construction land had the largest water yield. The most dramatic change in land use in Hangzhou from 2000 to 2015 was the conversion between cultivated land and construction land. On the whole, the landscape showed a stronger trend of fragmentation and heterogeneity, reaching a peak at 10−20 km from the city center. The annual precipitation in Hangzhou decreased first and then increased. The annual average temperatures fluctuating increased and the annual actual evapotranspiration fluctuated. The annual precipitation does not change significantly within 50 km of the city center. The annual average temperature decreased significantly as it moved away from the urban center, while the annual actual evapotranspiration first decreased and then increased. The correlation between water yield and meteorological factors was greater than that of landscape patterns indices. Water yield had the strongest positive correlation with precipitation in meteorological factors.   Conclusion   The change of meteorological factors was the main factor causing annual water yield change in Hangzhou, but the impact of landscape pattern was still worthy of attention. The 10 km distance from the city center was the turning point of annual water yield. [Ch, 4 fig. 7 tab. 34 ref.]

CAI Mengqing, HUANG Lu, YAN Lijiao. Temporal and spatial variation characteristics of annual water yield and its influencing factors in Hangzhou based on InVEST model[J]. Journal of Zhejiang A&F University, 2022, 39(1): 127-135. doi: 10.11833/j.issn.2095-0756.20210170
Citation: CAI Mengqing, HUANG Lu, YAN Lijiao. Temporal and spatial variation characteristics of annual water yield and its influencing factors in Hangzhou based on InVEST model[J]. Journal of Zhejiang A&F University, 2022, 39(1): 127-135. doi: 10.11833/j.issn.2095-0756.20210170
  • 联合国千年生态系统评估表明:超过60%的全球生态系统服务呈退化或过度利用趋势,自然因素和由人类活动引起的土地利用变化是导致生态服务功能退化的重要驱动因素[1]。水资源供给是重要的生态系统服务之一,水的可用性在空间和时间上的变化可以显著影响任何生态系统的功能和生产力[2],对生态系统和区域经济的可持续发展具有重要作用[3-4]。有研究[5-6]表明:气候变化和土地利用变化是引起产水量变化的驱动因素。气候变化可以通过改变地区的降水量、气温和蒸散量来影响产水量[7]。PESSACG等[8]和LANG等[3]发现降水量变化会导致产水量的显著差异。土地利用变化可能通过改变入渗速率和蒸散速率影响水量[9-10]。建设用地的增加会提高产水量[11-12]。但目前气候因素和土地利用变化对产水量影响的贡献或相关程度仍存在争议。顾晋饴等[13]在太湖流域的研究发现:降水量较土地利用/覆被更显著地驱动产水量的变化。窦攀烽等[14]利用情景分析发现气候变化对宁波地区产水量影响更为显著。HU等[15]通过主成分分析和相关性分析发现景观格局对洞庭湖地区产水量的驱动作用大于气候因素。如何有效综合评估气候因素和土地利用变化对产水量的影响仍未形成相对统一的结果。InVEST 模型产水量模块基于水量平衡原理,以栅格为单元定量估算不同景观类型的水源供给能力,在评估与水相关的生态系统服务时较为可靠[16-18]。随着城镇化的进程加块,城市结构、内部特征差异和城市生态系统服务供给等出现差异[19-20],并随城市化梯度差异表现[21]。利用梯度分析研究空间布局及其时空变化过程可从空间上识别和评估土地利用变化的影响[22-23]。杭州市是浙江省政治、经济、文化中心,近年来城市绿地侵占与恢复并存,产水量的时空变化特征具有复杂性和不确定性,深刻影响着城市可持续发展和居民福祉。本研究利用遥感数据和观测数据,在InVEST模型支持下,评估杭州市2000—2015年产水量,分析气候变化和土地利用变化与年产水量的相关性,以期为提高城市水资源保护和利用、促进城市生态系统服务发展提供参考。

    • 浙江省杭州市位于中国东南沿海北部、长江三角洲南沿(29°11′~30°33′ N,118°21′~120°30′ E),属于亚热带季风气候,2019年全市平均气温约18.1 ℃,年降水量为1 647.7 mm。夏季高温多雨,冬季低温干燥。杭州市地形复杂多样,东部为浙北平原地区,西部为浙西丘陵地带,京杭大运河和钱塘江穿城而过。截至2019年,全市下辖10区2县1市,分别为上城区、下城区、拱墅区、西湖区、江干区、滨江区、萧山区、余杭区、临安区、富阳区、桐庐县、淳安县和建德市。

    • 本研究所采用的数据包括Landsat遥感影像数据、气象观测数据、土壤数据和地形高程数据。采用中国科学院地理科学与资源研究所提供的长三角城市群2000、2005、2010、2015年共4期土地利用数据为基础数据,将地类划分合并为耕地、林地、草地、水体、建设用地和未利用土地等6类。气象数据由国家气象科学数据中心提供的浙江省基准地面气象观测站及自动站共计18个站点的2000—2015年观测数据集,去除异常值后在ArcGIS平台下进行投影,使用空间分析工具中的克里金(Kringing)插值分析得到2000、2005、2010和2015年的降水量、潜在蒸散量分布图,其中潜在蒸散量按Penman-Monteith (PM)公式计算得到,实际蒸散量由InVEST模型产水模块运行计算得到。利用中科院寒区旱区数据中心提供的中国土壤类型图提取杭州市土壤根系深度、物理组成、有机质等信息,在ArcGIS平台栅格数据空间叠加运算下得到土壤有效含水量(AWC)[24]。采用中国科学院地理所提供的数字高程模型(DEM)计算得到流域矢量数据。所有数据进行栅格化处理,转为同一投影的栅格图像,空间坐标系为Krasovsky_1940_Albers,像素单元大小为30 m×30 m。

    • 利用InVEST模型的产水模块,考虑实际蒸散量,建立年降水量与Budyko热液耦合平衡的关系,估算杭州市不同土地利用类型的产水功能。其核心算法是运用水量平衡法结合气候、地形和土地利用类型计算得出每个栅格的产水量。产水量为区域内各栅格的降水量减去实际蒸散量。产水量计算公式如下:

      式(1)中:Yx为栅格x的年产水量(mm);TAEx为栅格x的年实际蒸散量(mm);Px为栅格x的降水量(mm)。TAEx根据Budyko曲线近似得到,公式[25]为:

      式(2)~(5)中:Rx为栅格x的Budyko干燥度指数,是潜在蒸散量(TPEx)与降水量(Px)的比值。CKx为植被蒸散系数,在不同的植被类型下该值是不同的,表示不同发育期植物潜在蒸散量与参考蒸散量(TE0x)的比值,具体取值参考模型默认范例。TAEx通过TE0x直接计算,并由TE0xPx共同决定其取值。wx是土壤可利用水量与降水量的比值。根据DONOHUE等[26]的定义:

      式(6)中:CAWx为栅格x的土壤有效含水量(mm),Z为季节常数,基于杭州市自然地理特征及相关参考文献将其取值为6.5[27]。本研究年产水总量为杭州市所有栅格单元产水量的总和。

    • 以城市原点(紫薇园,30°15′00″ N,120°10′12″ E)为城市中心、以5 km为间距,建立覆盖杭州市主城区的10个同心圆梯度带[28]。为消除因面积不同产生的结果差异,采用ArcGIS空间分析工具Zonal对每个梯度带要素进行空间分布均值统计分析。

    • 选取年降水量(Pre)、年实际蒸散量(AET)和年均气温(Tem)作为影响年产水量的气象因子指标,根据主成分分析(PCA)从密度、面积、边缘、形状、多样性和聚散性6个方面选取斑块密度(PD)、最大斑块指数(LPI)、边缘密度(ED)、景观形状指数(LSI)、香农多样性指数(SHDI)和蔓延度(CONTAG)等6个景观格局指数作为影响年产水量的景观格局指标。对研究区进行1 km×1 km网格化处理并去除边缘值,分别构建气象因子和景观格局指数网格数据集,其中景观格局指数由土地利用类型数据通过Fragstats 4.2软件计算得到。利用SPSS 25中Pearson分析计算得到年产水量与气象因子、景观格局指数的相关性。

    • 表1可知:2000—2015年间杭州市年产水总量与平均值均呈先下降后上升趋势。就总量来看,2005年最小,为9.81×10⁹ m3,比2000年下降了23.24%,2015年达到最大值(24.48×10⁹ m3);15 a平均增长率为6.10%。就栅格单元平均值来看,最小值为582.42 mm (2005年),最大值为1 457.24 mm(2015年),4 a相对误差为5.90%,2000—2015年平均增长率为6.17%。

      年份总量/(×109 m3)平均值/mm耕地/mm林地/mm草地/mm水体/mm建设用地/mm未利用土地/mm
      200012.78756.75856.53741.30880.33388.631001.17816.48
      20059.81582.42700.64556.62686.54214.30875.89692.31
      201019.351147.681264.091115.641279.94789.691430.851254.00
      201524.481457.241601.451409.231565.031094.851796.251600.17
        说明:除总量外,其余产水量均为栅格单元平均值

      Table 1.  Water yield of Hangzhou during 2000−2015

      从不同土地利用类型来看,2000—2015年间各类型土地栅格单元年产水量均呈先下降后上升趋势(表1)。建设用地高于其他土地利用类型,最大值为1 796.25 mm (2015年),水体产水量低于其他土地利用类型,最小值为214.30 mm (2005年)。2000—2015年间,各类型土地年产水量增长率从大到小依次为水体(181.72%)、未利用土地(95.98%)、林地(90.10%)、耕地(86.97%)、建设用地(79.42%)、草地(77.78%)。

    • 从空间区域上来看,2000—2015杭州市年产水量呈现东北高、西南低的分布特征 (图1)。高值区主要分布在东北部的主城区,且呈聚集扩张趋势,栅格单元多年平均产水量为1 042.68~1 254.85 mm;其他区县市(富阳区、临安区、桐庐县、淳安县、建德市)相对较小,为933.57~1 009.06 mm (图2)。

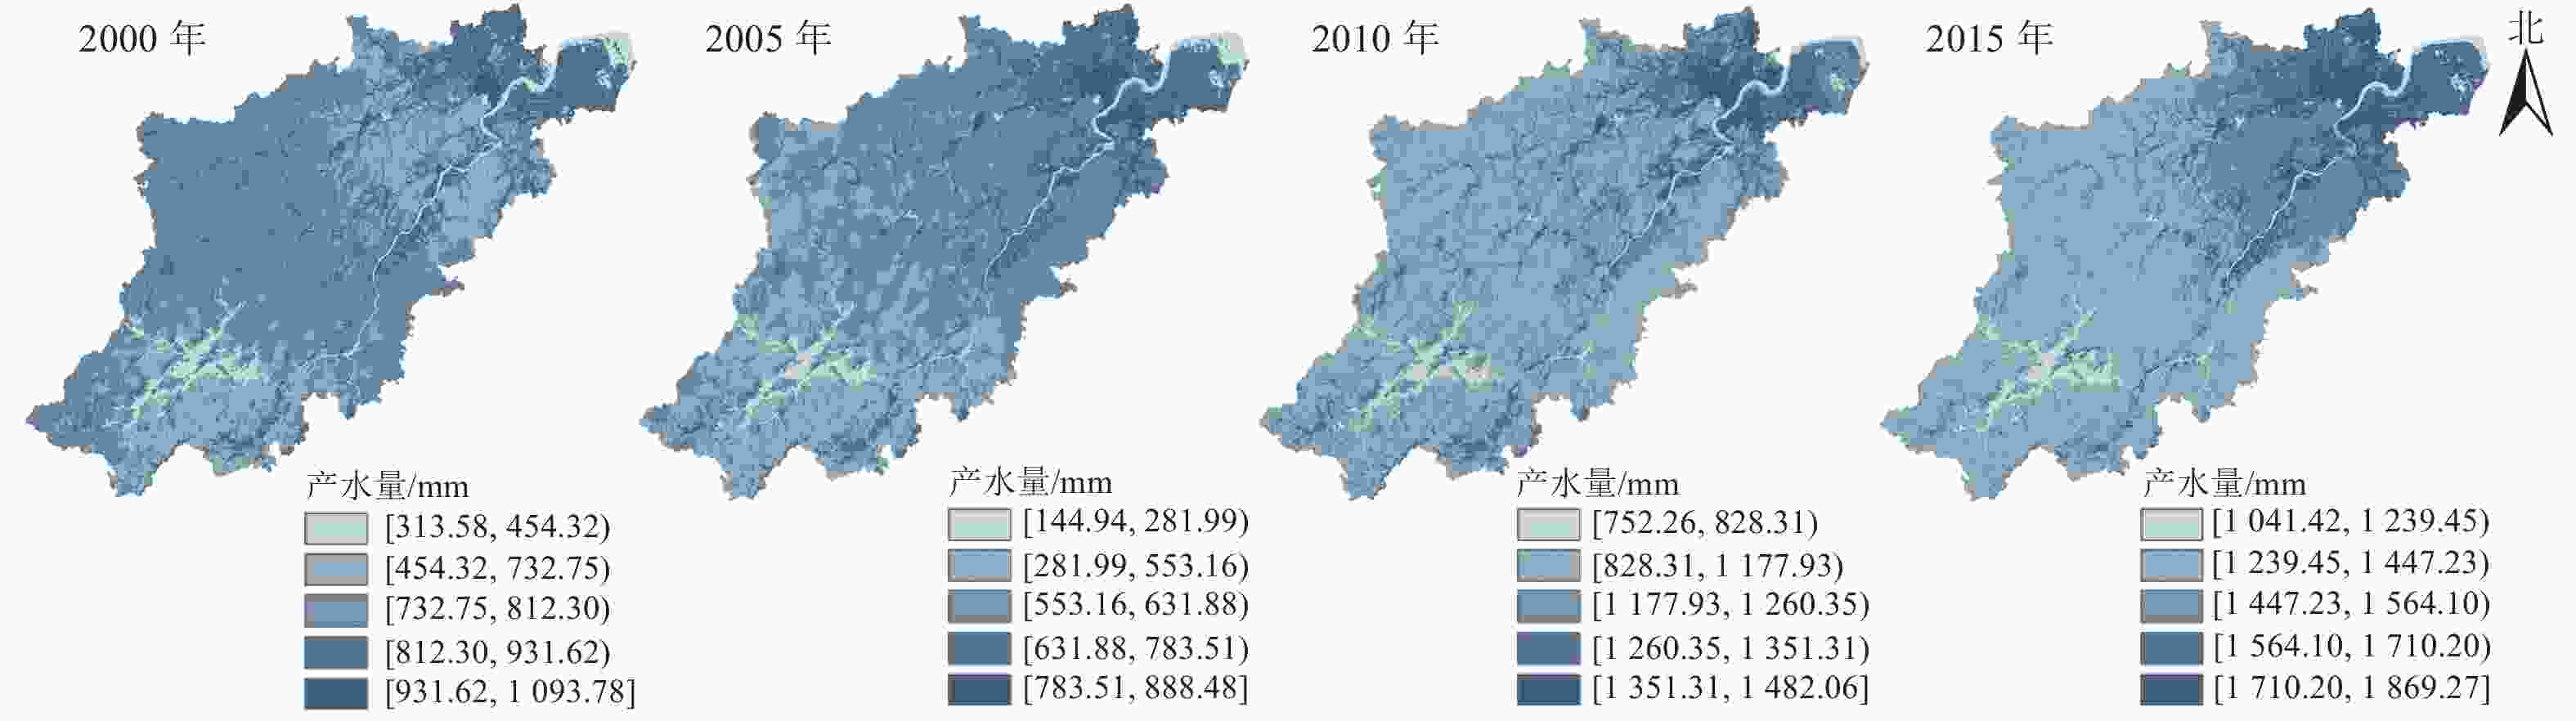
      Figure 1.  Spatial distribution of water yield in Hangzhou in 2000-2015

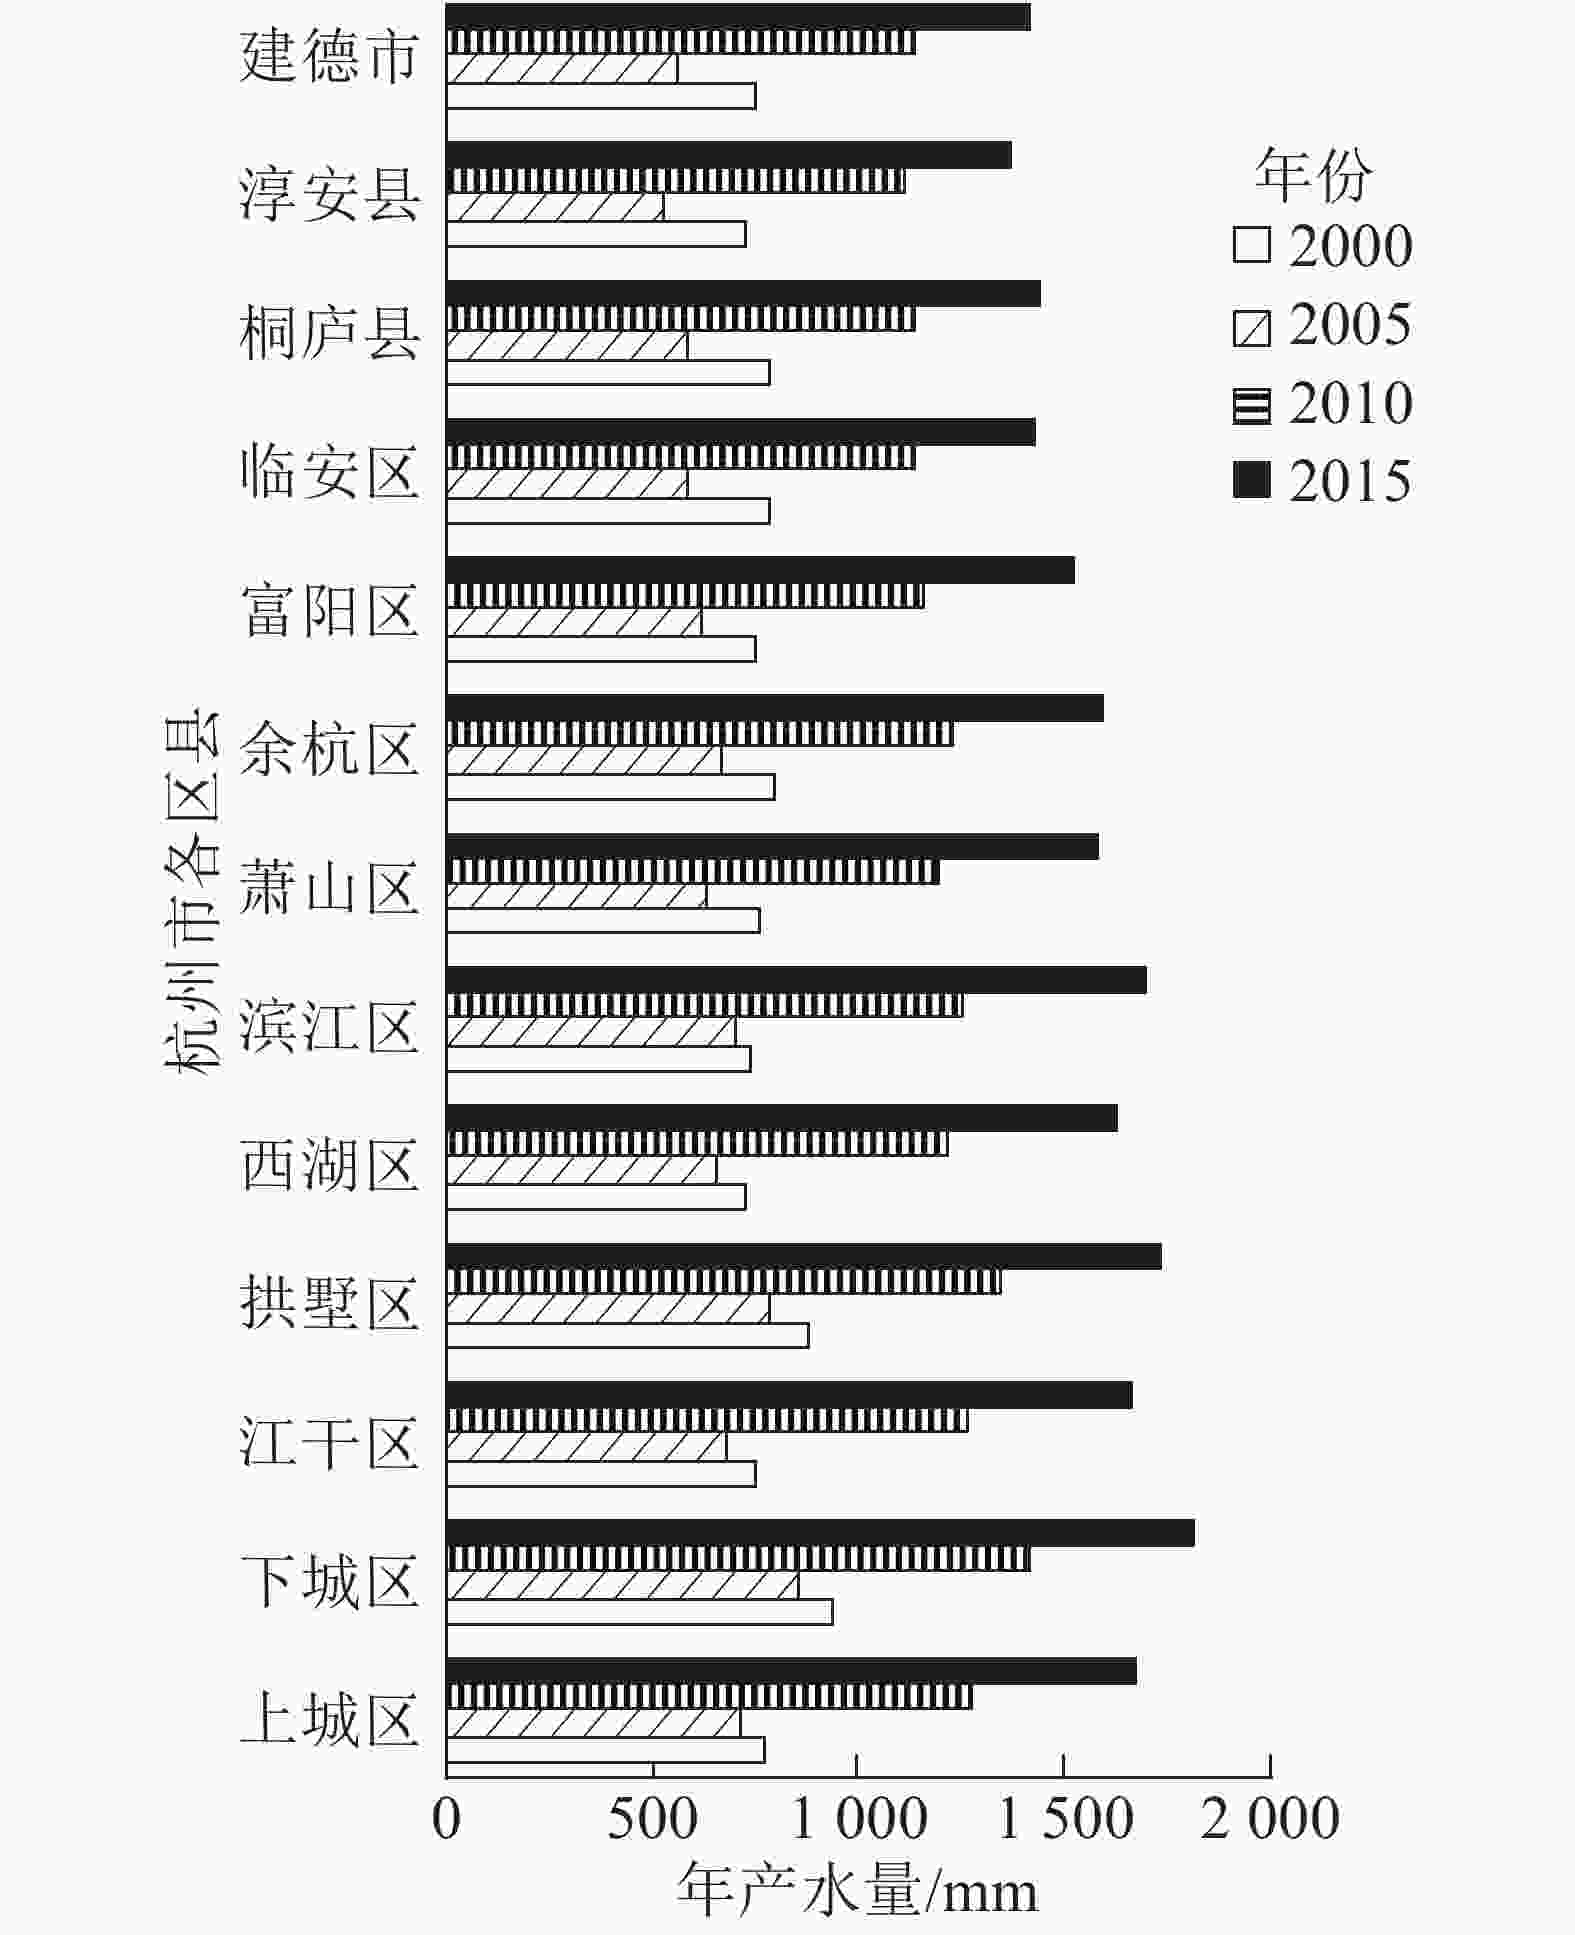
      Figure 2.  Changes of water yield of counties and districts in Hangzhou

      从梯度变化来看,年产水量呈现随着与城市中心距离的增加先增大后减小趋势(表2),最高值均出现在距离城市中心10 km处。对比距离城市中心5~15 km和40~50 km的年产水量发现:2000、2005、2010和2015年的差异率分别为4.50%、16.50%、9.25%和10.31%,这表明年产水量的城乡变化在2005年前后出现拐点。

      年份不同梯度下的产水量/mm
      5101520253035404550 km
      2000774.12787.18775.87772.57769.36780.96770.26757.03749.18725.81
      2005704.70722.54706.81680.91667.67663.95644.82618.20596.43567.25
      20101 260.331 282.991 268.251 241.941 220.991 211.721 186.361 160.961 153.731 144.39
      20151 663.701 705.391 681.581 639.731 612.601 595.341 565.241 528.581 509.991 491.25

      Table 2.  Water yield along gradient in Hangzhou during 2000−2015

    • 杭州市各土地利用类型转移矩阵表明(表3):2000—2015年间土地利用变化最剧烈的为耕地与建设用地之间的转化,耕地面积减少了2.75%,建设用地面积增加了3.67%,15 a间有3.24%耕地转化为建设用地。结合表1可知:杭州市2000—2015年间建设用地面积比例增加显著,导致杭州市2015年产水量显著大于2000年产水量。

      土地利用类型2015年
      耕地/%林地/%草地/%水体/%建设用地/%未利用土地/%
      合计/%
      2000年耕地   15.840.980.040.333.240.0020.44
      林地   1.0466.400.280.160.510.0168.40
      草地   0.040.221.980.010.030.012.29
      水体   0.570.140.024.710.150.005.60
      建设用地 0.200.040.010.022.980.003.25
      未利用土地0.000.000.000.000.000.020.02
      合计   17.6967.792.335.246.920.04100.00
        说明:对角线粗体数值为没有发生变化的土地利用类型的保留率

      Table 3.  Statistics of conversion rates of landscape types in Hangzhou from 2000 to 2015

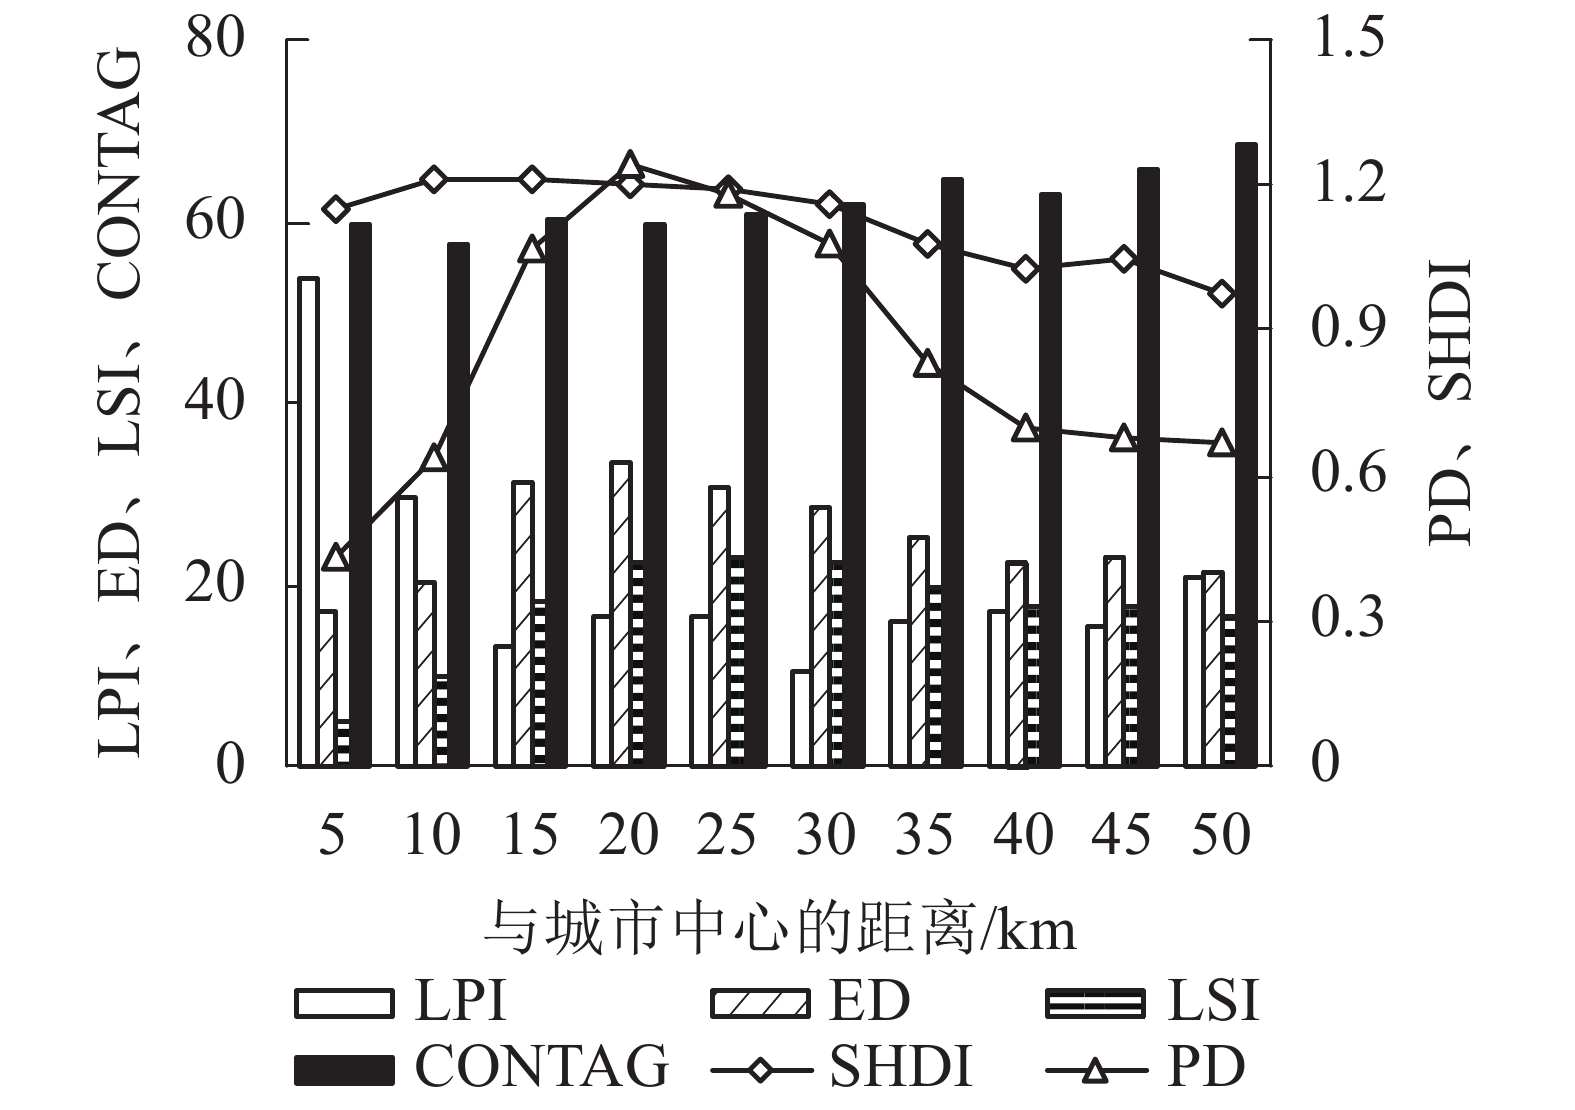
    • 从景观格局来看,2000—2015年间杭州市存在景观明显破碎化和异质性(表4)。15 a间,PD先下降后上升,LPI下降1.23、ED上升1.07,表明景观破碎化程度明显;LSI上升3.69,表明斑块形状较不规则、复杂度不断增加;CONTAG下降1.77,表明景观连通性处于下降趋势,反映景观破碎化增加;SHDI由0.95上升至1.00,表明景观异质性增加。从梯度变化来看,随着与城市中心距离的增加,LPI、CONTAG总体呈现先减小后逐步增加的趋势,最大斑块面积和景观连通性先减小后增大;ED、LSI、PD、SHDI总体呈现先增加后逐步减小的趋势,表明随着与城市中心距离的增加,景观破碎化和异质性先增大后减小(图3)。其中,CONTAG和SHDI的拐点出现在10 km处,表明在距离城市中心10 km处,景观连通性最小、异质性最大;PD、ED、LSI的拐点出现在20 km处,表明在距离城市中心20 km处,景观破碎化最为严重;LPI的拐点则在15和30 km处,表明在距离城市中心15和30 km处,最大斑块面积减小导致一定程度的景观破碎化。因此,在距离城市中心10~20 km处存在最为显著的景观破碎化和异质性。结合年产水量发现:单位面积产水量拐点出现在距离城市中心10 km处,与景观格局的梯度变化趋势较为一致。

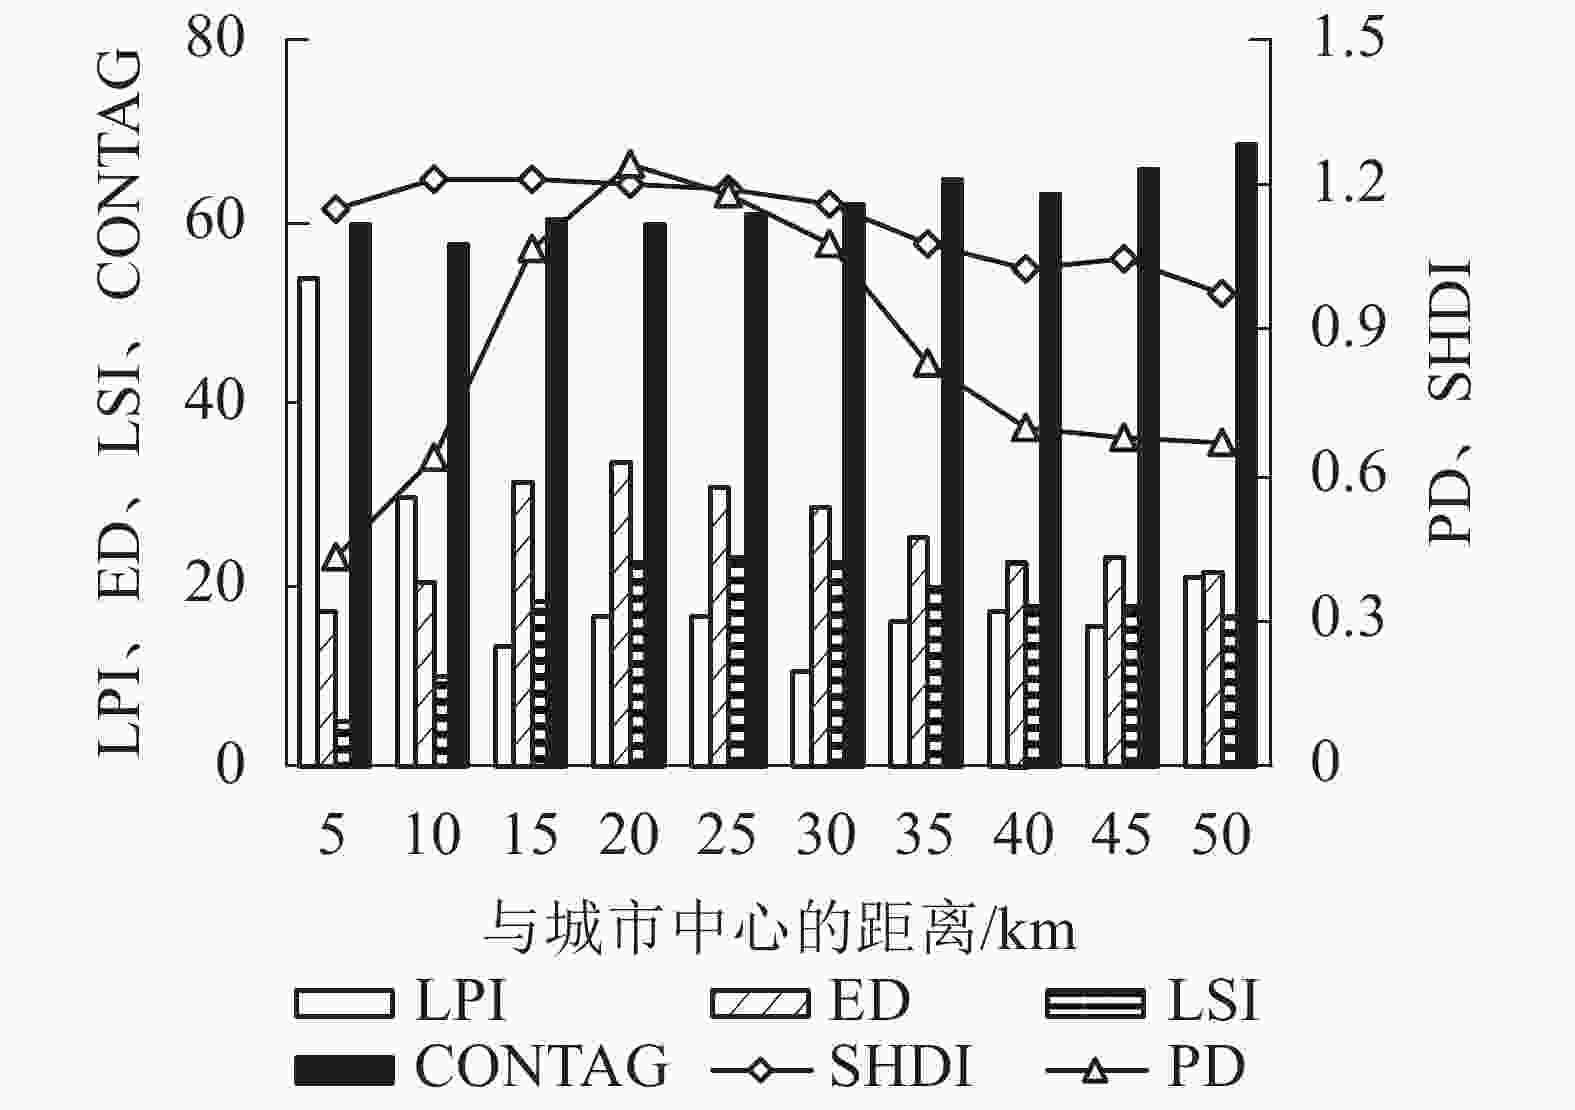
      Figure 3.  Changes of landscape pattern indices along gradient in Hangzhou    

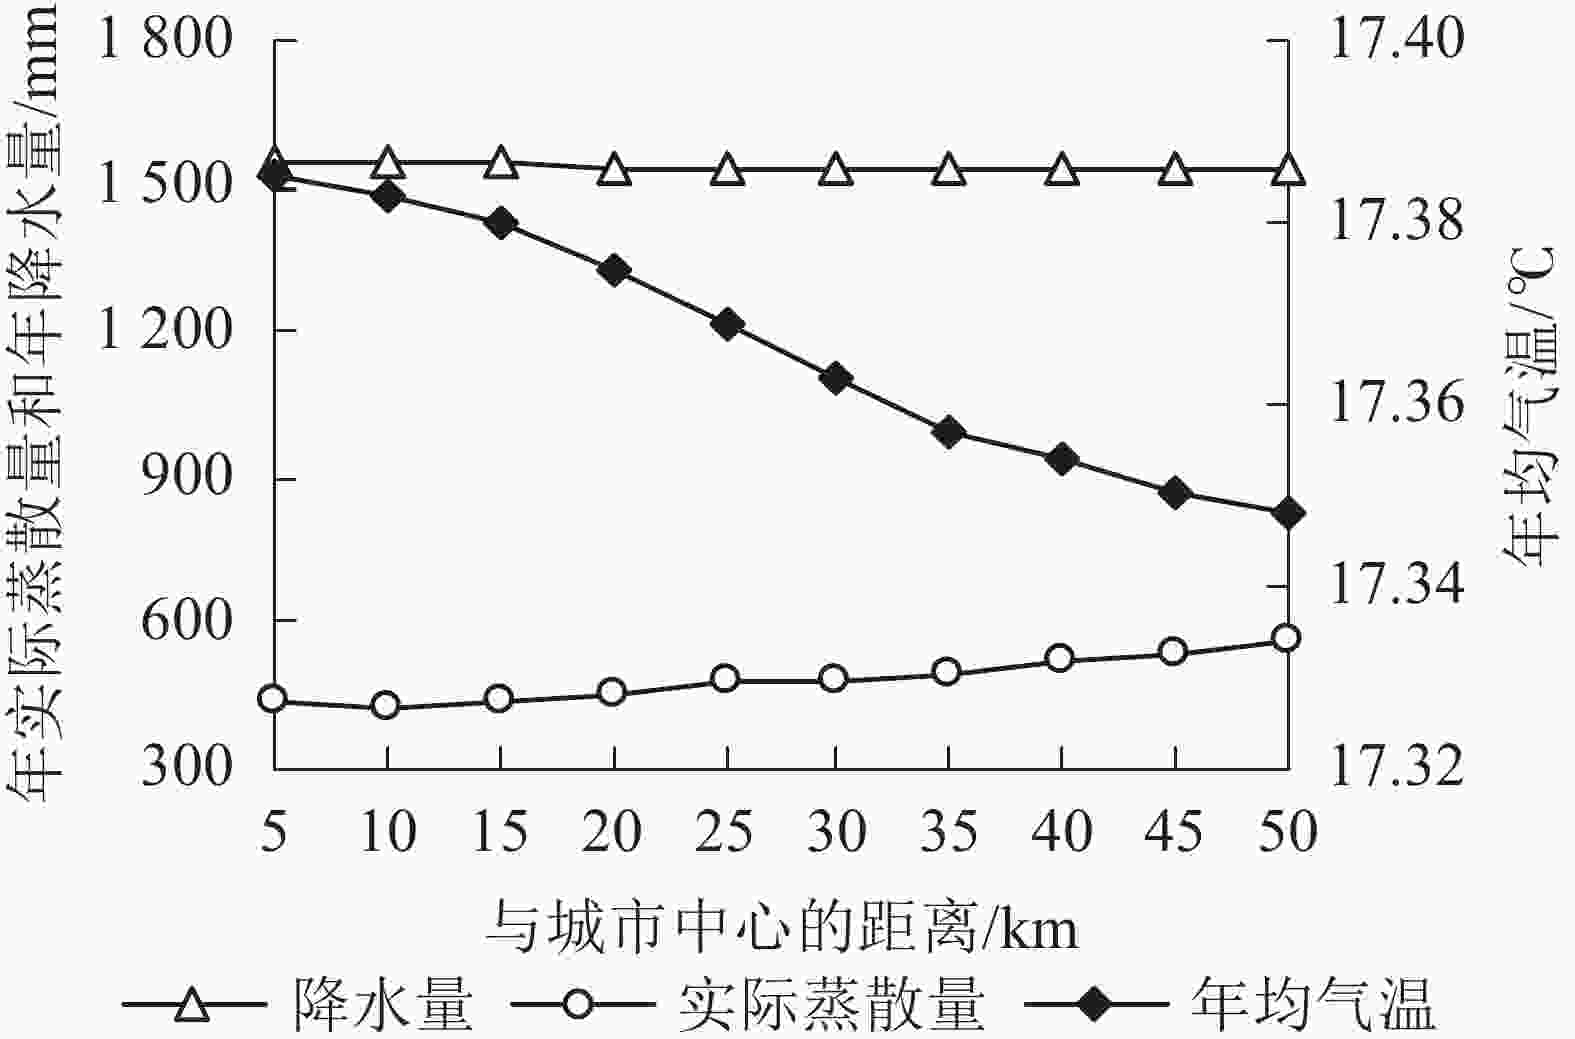
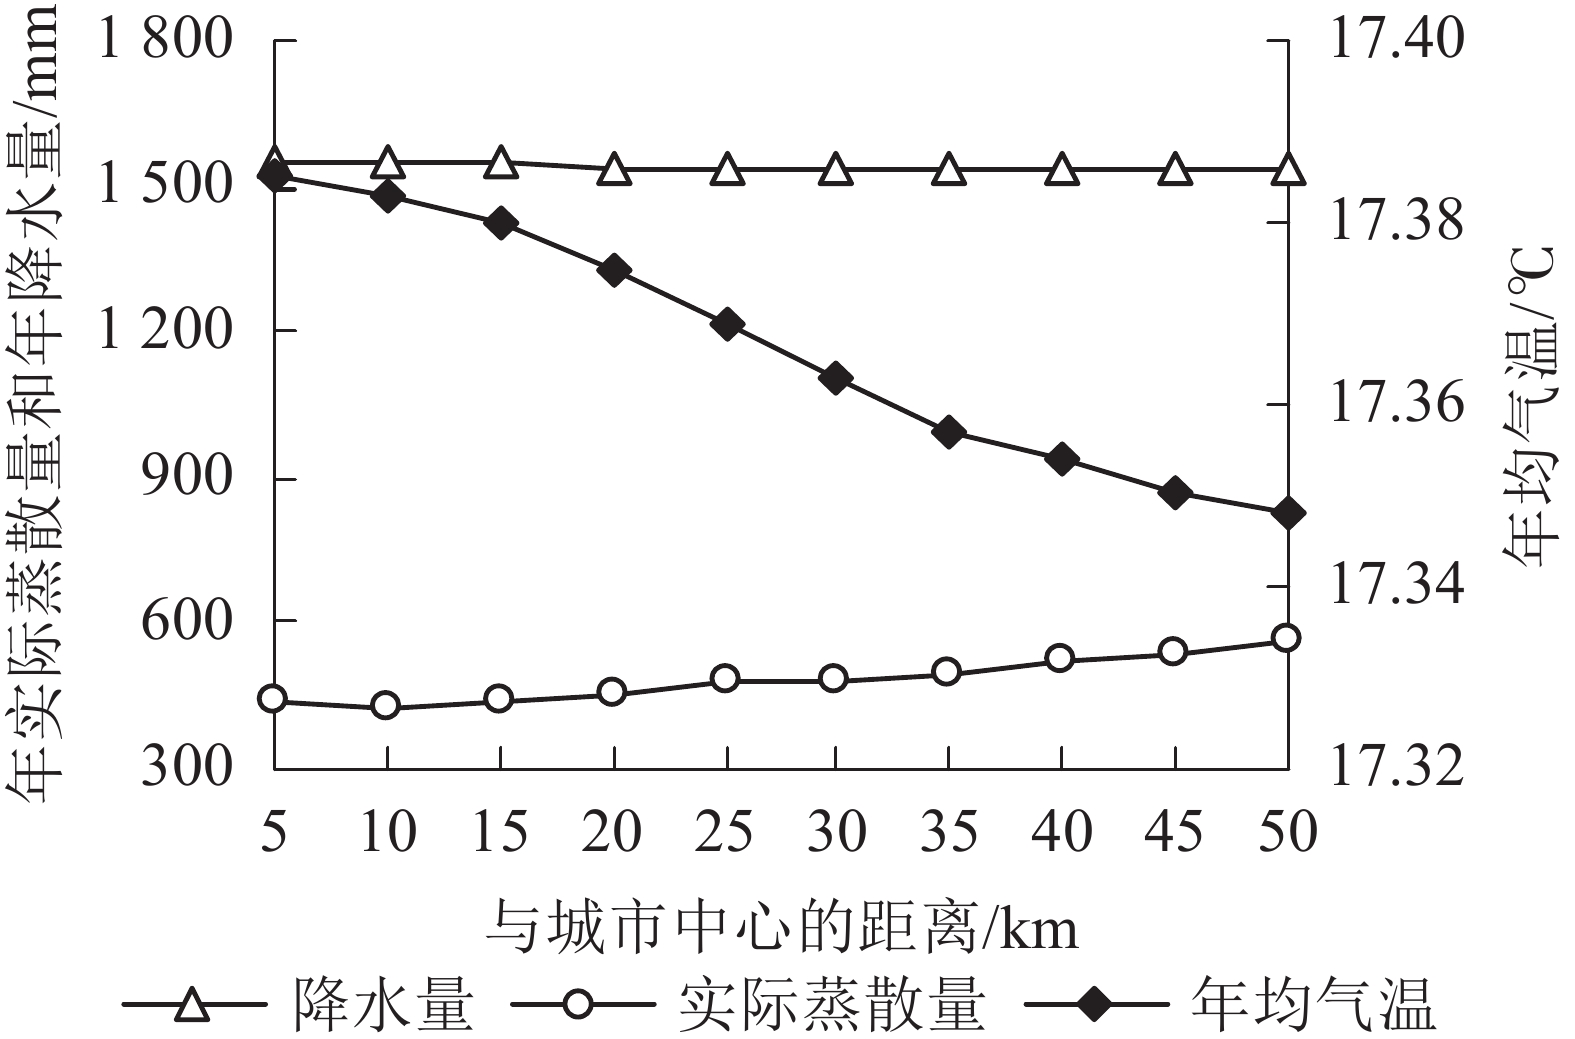
      Figure 4.  Changes of climate factors along gradient in Hangzhou

      年份景观格局指数
      PDLPIEDLSICONTAGSHDI
      20000.4835.5220.2068.0869.310.95
      20050.4335.0420.9870.5968.410.97
      20100.4634.5021.5072.2768.040.98
      20150.4634.2921.2771.7767.541.00

      Table 4.  Statistics of landscape pattern indices in Hangzhou from 2000 to 2015

    • 从时间上看(表5):2000—2015年间,杭州市年降水量最小的是2005年,最大的是2015年。与2000年相比,2005年降水量减少183.54 mm (13.90%),2015年增加696.21 mm (52.75%)。年均气温最低的是2000年,最高的是2015年,相差0.31 ℃。年均实际蒸散量最小值和最大值分别出现在2005和2010年;与2000年相比,2005年实际蒸散量减少9.21 mm (1.64%),2010年增加2.31 mm (0.41%)。结合表1可知:降水量变化与年产水量趋势一致。从空间上看,各县区气象因子存在差异(表6)。主城区与富阳区年降水量为1 540~1 545 mm,其他4区县市均高于1545 mm。主城区年均气温为17.35~17.39 ℃,其他5区县市为17.34~17.38 ℃。主城区年实际蒸散量明显低于其他5区县市,其中最低值出现在下城区(289.10 mm),最高值出现在淳安县(617.13 mm)。从城乡梯度来看,在距城市中心50 km内,年降水量变化不大;随着距离增加,年均气温逐渐下降,年实际蒸散量先减小后增大,最小值出现在距离10 km处(图4)。结合2000—2015年产水量的空间分布特征和梯度变化趋势可知:年产水量空间变化与年实际蒸散量表现相似。

      年份年降水量/mm年均气温/℃年实际蒸散量/mm年份年降水量/mm年均气温/℃年实际蒸散量/mm
      20001 319.7917.25563.0420101 713.0317.26565.35
      20051 136.2517.38553.8320152 016.7717.56559.54

      Table 5.  Statistics of climate factors in Hangzhou from 2000 to 2015

    • 表7可知:2000—2015年,杭州市年产水量与降水量相关性最强,相关系数为0.959,与气温呈极显著正相关(P<0.01),与实际蒸散量呈极显著负相关(P<0.01)。在景观格局指数方面,年产水量与PD相关性最强,相关系数为0.153,与ED、LSI、SHDI呈极显著正相关(P<0.01),与LPI呈显著负相关(P<0.05),与CONTAG呈极显著负相关(P<0.01)。

      各县区年降水量/mm年均气温/℃年实际蒸散量/mm各县区年降水量/mm年均气温/℃年实际蒸散量/mm
      上城区1 543.1017.39432.37余杭区1 544.7517.37477.82
      下城区1 543.9517.38289.10富阳区1 542.5217.36533.47
      江干区1 543.2917.37455.50临安区1 545.7417.34564.34
      拱墅区1 544.4017.38359.98桐庐县1 545.8417.35560.42
      西湖区1 543.2417.39488.31淳安县1 550.7017.38617.13
      滨江区1 542.2617.39446.74建德市1 548.6317.37583.63
      萧山区1 540.1417.35497.46

      Table 6.  Statistics of climate factors of counties and districts in Hangzhou from 2000 to 2015

      指标相关性显著性指标相关性显著性
      Pre 0.959** 0.000 ED 0.148** 0.002
      Tem 0.325** 0.000 LSI 0.129** 0.006
      AET −0.110** 0.000 CONTAG −0.132** 0.002
      PD 0.153** 0.103 SHDI 0.139** 0.001
      LPI −0.109* 0.016
        说明:** 表示在0.01水平极显著相关(双尾),*表示在0.05水平上显著相关(双尾)

      Table 7.  Spearman correlation coefficients among water yield, climate factors and landscape pattern indices

    • InVEST模型水量平衡模型原理认为:降水量和实际蒸散量是估算产水量的2个重要参数,其中降水量作为气象因子的主要变量,由自然条件决定,受人为因素影响较小。也有研究[15]认为:景观格局比气象因子对年产水量的影响更大。本研究发现:2000—2015年杭州市年产水量与降水量的相关性大于其与指数,与顾晋饴等[13]、窦攀烽等[14]结果一致。气温与年产水量具有一定的相关性,而实际蒸散量由于计算方法受到气象因子、土地利用和景观格局的综合影响,相关系数较小。年产水量与各景观格局指数相关系数均较小,但显著性较强,说明虽然景观格局不是影响杭州市年产水量变化最重要的影响因素,但仍值得关注。提示不同地区或生态系统间影响产水量的决定性因素应该是不同的。

      研究发现:2000—2015年间,杭州市年产水量总体上表现为先降低后增加,建设用地的年产水量高于其他各土地利用类型。建设用地是研究区变化规模和速度最快的土地利用类型,由不透水性的下垫面组成,植被覆盖少,不利于有效拦截大量降水,同时地表蒸散发能力较弱,人类活动更为剧烈;建设用地的增加一定程度上引起产水量的增加[11]。相比之下,水体单位面积产水量最小。研究区水域广布(千岛湖、西湖、西溪湿地、钱塘江),水体下渗程度小于其他土地利用类型,但由于水面蒸散速度与强度高[29],因此水体的年产水量也最小。这也可能是研究区生态系统质量整体提升所带来的效应[30]。林地通过林冠层、枯枝落叶层和土壤层拦截降雨,并通过蒸腾作用散失水分。快速城市化导致研究区部分高质量城市绿地损失,景观破碎化和异质性显著增大,因此林地提供的产水量不稳定[15];而为建设绿色城市、生态城市新增的城市林地大部分处于幼龄阶段,这可能是林地产水量在2000—2015年间增长率大于耕地和草地的原因,也说明了城市林地恢复及提供优质服务需要较长时间,具有较大的提升空间。

      由主城区梯度变化可知:景观格局在距离城市中心10~20 km处破碎化程度尤其严重,表明2000—2015年间此区域是人类活动最为密切、景观破坏最为严重的区域。距离城市中心10 km处的单位面积产水量最大,表明这是年产水量在梯度上变化的拐点;气象因子在该区域内变化不大,表明景观格局的变化将重新分配城市产水服务,对城市生态平衡和可持续发展产生积极或消极影响[31]。该结果提示:快速发展的城市化进程中,合理布局规划城市用地[32],可避免因大规模集中建设导致的生态系统服务功能的降低。

      目前InVEST模型产水模块已被广泛应用,与邱问心等[33]研究相比,本研究利用Penman-Monteith 公式计算年蒸散量具有一定的可行性。《杭州市水资源公报》数据显示:杭州市2000、2005、2010和2015年实际产水深度均值分别为0.63、0.54、1.13和1.43 m。本研究结果对比验证发现:4个年份相对误差为5.90%,说明模拟结果相对可信。但其中部分输入参数的选择仍会影响结果的准确性,选择不同的经验公式、空间插值方式和土地利用类型分类均会得到不同的结果。本研究采用研究年份的当年气象数据进行模型估算,未考虑到气象因子作用于环境过程的时间滞后性[34];对景观格局的分析仅考虑了景观水平,对斑块和类型水平的研究有待进一步研究。未来可通过评估其他指标与景观格局的空间相关性来进一步研究生态系统服务与城乡景观格局的关系,为实现区域可持续规划提供科学依据。

Reference (34)

Catalog

    /

    DownLoad:  Full-Size Img  PowerPoint
    Return
    Return