Volume 40 Issue 6
Nov.  2023
Turn off MathJax
Article Contents

WANG Hui, LIU Yuan, SHI Yan, DING Zhifan, JIANG Hongchao. Scenario simulation and prediction of Qinhu National Wetland Park based on PLUS Model[J]. Journal of Zhejiang A&F University, 2023, 40(6): 1311-1321. doi: 10.11833/j.issn.2095-0756.20230163
Citation: WANG Hui, LIU Yuan, SHI Yan, DING Zhifan, JIANG Hongchao. Scenario simulation and prediction of Qinhu National Wetland Park based on PLUS Model[J]. Journal of Zhejiang A&F University, 2023, 40(6): 1311-1321. doi: 10.11833/j.issn.2095-0756.20230163

Scenario simulation and prediction of Qinhu National Wetland Park based on PLUS Model

doi: 10.11833/j.issn.2095-0756.20230163
  • Received Date: 2023-02-18
  • Accepted Date: 2023-06-23
  • Rev Recd Date: 2023-06-15
  • Available Online: 2023-11-23
  • Publish Date: 2023-11-23
  •   Objective  This study aims to explore the scenario plan for promoting the sustainable development of Qinhu National Wetland Park in Jiangsu Province.   Method  Taking Qinhu National Wetland Park as an example, according to the construction goal and upper level planning of the research area, three scenarios were constructed: natural development, ecological protection and tourism development. Based on the simulation results of PLUS model, an optimization scenario was constructed.   Result  (1) From 2015 to 2020, the conversion of shrub land and construction land in the study area increased the most, which was 14.88% and 8.77% respectively, while the conversion of grassland decreased the most, which was −33.25%. The area of arbor forest land, lake wetland, river wetland, marsh wetland and cultivated land was relatively stable. (2) The land use changes under the three scenarios showed different trends. Under the scenarios of natural development and tourism development, the construction land expanded greatly in the east, middle and southwest of the study area, while the shrub land increased more significantly under the natural development scenario. Under the ecological protection scenario, the central lake wetland and the eastern river wetland showed an expanding trend, and the construction land and cultivated land were the main sources. (3) Under the optimization scenario, various wetlands showed an expanding trend, totaling 69.05%. Arbor forest and shrub land accounted for 16.19% and 5.57% respectively, and the construction land area accounted for 5.90%.   Conclusion  Construction land under natural development and tourism development scenarios encroaches on all kinds of wetlands and forestland, while the area of all kinds of wetlands and forestland under ecological protection scenario increases effectively, and construction land is not fully utilized. Under the optimization scenario, all land use types are reasonably regulated, which helps to coordinate the dual goals of ecological protection and rational development in the study area. [Ch, 6 fig. 5 tab. 30 ref.]
  • [1] LI Qiwei, ZHANG Xiuqing, Geriletu, GUO Xinxin, YANG Yin, WU Minjun, SHI Jiuxi.  Application of multi-objective programming method in forest park management regionalization . Journal of Zhejiang A&F University, 2024, 41(1): 192-201. doi: 10.11833/j.issn.2095-0756.20230274
    [2] PENG Lindi, WANG Qiong, ZHANG Hongli, ZHENG Chengjie, WANG Nanyuan, PAN Qubo.  Ecological risk assessment of alien landscaping plants in wetland parks on the west bank of Dianchi Lake . Journal of Zhejiang A&F University, 2023, 40(1): 217-226. doi: 10.11833/j.issn.2095-0756.20220301
    [3] ZHU Ying, WU Yingqian, LI Xin.  Quality evaluation of Shajiabang National Wetland Park from the perspective of coordinated development . Journal of Zhejiang A&F University, 2020, 37(3): 432-438. doi: 10.11833/j.issn.2095-0756.20190448
    [4] XIANG Ying, ZHANG Jianguo.  Rural landscape planning of northern Zhejiang based on industrial development orientation . Journal of Zhejiang A&F University, 2020, 37(3): 587-592. doi: 10.11833/j.issn.2095-0756.20190635
    [5] LIN Qiqi, XU Bin, ZHANG Yaping.  Post occupancy evaluation of rural complex in the rural of large cities . Journal of Zhejiang A&F University, 2020, 37(5): 999-1005. doi: 10.11833/j.issn.2095-0756.2020.20190580
    [6] ZHANG Jianguo, WANG Zhen.  Research on scenic beauty estimation (SBE) of landscapes of Xiazhu Lake National Wetland Park based on SBE method . Journal of Zhejiang A&F University, 2017, 34(1): 145-151. doi: 10.11833/j.issn.2095-0756.2017.01.020
    [7] KONG Yangyang, HAN Hairong, KANG Fengfeng, WANG Qingchun.  Ecological assessment of Momoge National Nature Reserve . Journal of Zhejiang A&F University, 2013, 30(1): 55-62. doi: 10.11833/j.issn.2095-0756.2013.01.008
    [8] LI Jia-jia, WANG Zhi-tai.  Landscape indices with sensor grain size changes in Meitan County,China . Journal of Zhejiang A&F University, 2012, 29(3): 335-343. doi: 10.11833/j.issn.2095-0756.2012.03.004
    [9] SI Zhen.  Ecological view of garden design strategy . Journal of Zhejiang A&F University, 2009, 26(3): 421-426.
    [10] XU Bin, DONG Hai-yan, JIN Min-li.  Application of “origin” garden ideology in modern cemetery park . Journal of Zhejiang A&F University, 2008, 25(6): 777-780.
    [11] ZHANG Yi-chuan, QIAO Li-fang, YAO Lian-fang, DONG Ying.  Landscape planning of the agricultural parks . Journal of Zhejiang A&F University, 2007, 24(4): 492-496.
    [12] XUAN Gong-qiao.  Application of landscape ecology principle in urban green space system planning . Journal of Zhejiang A&F University, 2007, 24(5): 599-603.
    [13] LUO Fen, ZHONG Yong-de, LI Jian, YUYi-wu.  Planning and design of self-guided interpretive trails . Journal of Zhejiang A&F University, 2007, 24(3): 336-341.
    [14] XIAO Sheng-he, SUN Zhi, BAO Ya-fang.  Planning of mountainous non-optimal tourism district . Journal of Zhejiang A&F University, 2006, 23(2): 198-201.
    [15] WANG Xiao-de, XU Bin, DONG Hai-yan, LIU Wan-bin, WU Xi-long, WU Xue-min.  Protection and exploition of scenic resources of Tonglingshan National Forest Park . Journal of Zhejiang A&F University, 2006, 23(4): 465-467.
    [16] HU Shao-qing, ZHANG Hou-yong.  The rules of city biodiversity conservation planning . Journal of Zhejiang A&F University, 2005, 22(2): 207-210.
    [17] WANG Wen-juan, LU Feng-zhu.  Programming of protection forest for headwater conservation in Zhejiang Province . Journal of Zhejiang A&F University, 2001, 18(3): 315-318.
    [18] JIANG Ying-xian.  Overall design of campus landscaping for Zhejiang University of Technology . Journal of Zhejiang A&F University, 1999, 16(3): 322-326.
    [19] Pan Jingui, Ni Haibo, Wu Lidong, Li Hong chuan, Mao Fangming, Weng Yiming..  A Programme of Exploitation and Utilization of Natural Resources in Jiulongshan’ s Mountain Areas. . Journal of Zhejiang A&F University, 1997, 14(1): 94-100.
    [20] Ma Junshan, Wang Xiaode.  scenic Resources and Development planning of the xianhuashan Scenic Resort . Journal of Zhejiang A&F University, 1996, 13(2): 141-146.
  • [1]
    KHAN K, SHAH G M, SAQIB Z, et al. Species diversity and distribution of macrophytes in different wetland ecosystems [J/OL]. Applied Sciences, 2022, 12 (9): 4467[2023-01-18]. doi: 10.3390/app12094467.
    [2]
    CHEN Kexin, CONG Pifu, QU Limei, et al. Wetland degradation diagnosis and zoning based on the integrated degradation index method [J/OL]. Ocean & Coastal Management, 2022, 222: 106135[2023-01-18]. doi: 10.1016/j.ocecoaman.2022.106135.
    [3]
    NILSSON C, REIDY C A, DYNESIUS M, et al. Fragmentation and flow regulation of the world’s large river systems [J]. Science, 2005, 308(5720): 405 − 408.
    [4]
    WANG Lilong, LU Lin, TANG Yong, et al. Running status, distribution pattern and type classification of the state-level wetland parks in China [J]. Acta Ecologica Sinica, 2010, 30(9): 2406 − 2415.
    [5]
    WU Houjian, DAN Xinqiu, WANG Longfu, et al. Review and prospect of wetland park construction in China [J]. Forest Resources Management, 2016(2): 39 − 44.
    [6]
    LIN Wenqi, WU Tinghai. Spatial Planning Thinking and Methods in the Context of Changing Scenarios [M]. Beijing: Tsinghua University Press, 2013.
    [7]
    LOU Wei. The study on scenario analysis theory [J]. Future and Development, 2013, 36(8): 30 − 37.
    [8]
    ZHAO Li, YANG Jun, LI Chuang, et al. Progress on geographic cellular automata model [J]. Scientia Geographica Sinica, 2016, 36(8): 1190 − 1196.
    [9]
    WU Peijun, LIU Xiaoping, LI Xia, et al. Impact of urban expansion on carbon storage in terrestrial ecosystems based on InVEST model and CA: a case study of Guangdong Province, China [J]. Geography and Geo-Information Science, 2016, 32(5): 22 − 28.
    [10]
    YI Wuying, SU Weici, ZHOU Wenlong, et al. An ecological security early warning simulation city based on the CA Model in Huaxi District of Guiyang City, China [J]. Journal of Zhejiang A&F University, 2015, 32(3): 369 − 375.
    [11]
    VERBURG P H, SOEPBOER W, VELDKAMP A, et al. Modeling the spatial dynamics of regional land use: the CLUE-S model [J]. Environmental Management, 2002, 30(3): 391 − 405.
    [12]
    XU Xiaoliang, LI Xin, XIAO Changjiang, et al. Land use layout optimization under different scenarios by using the CLUE-S model [J]. Acta Ecologica Sinica, 2016, 36(17): 5401 − 5410.
    [13]
    BIAN Zihao, MA Xiaoxue, GONG Laicun, et al. Land use prediction based on CLUE-S model under different non-spatial simulation methods: a case study of the Qinhuai River Watershed [J]. Scientia Geographica Sinica, 2017, 37(2): 252 − 258.
    [14]
    GU Hanlong, MA Tianjun, QIAN Fengkui, et al. County land use scenario simulation and carbon emission effect analysis using CLUE-S model [J]. Transactions of the Chinese Society of Agricultural Engineering, 2022, 38(9): 288 − 296.
    [15]
    SONG Ge, WANG Jinshuo, HE Liheng, et al. Simulation of land use change in western arid region under different scenarios based on the CLUE-S model [J]. Journal of Nanjing Forestry University (Natural Sciences Edition), 2013, 37(3): 135 − 139.
    [16]
    LIN Weibin, SUN Yimin, NIJHUIS S, et al. Scenario-based flood risk assessment for urbanizing deltas using future land-use simulation (FLUS): Guangzhou Metropolitan Area as a case study [J/OL]. Science of The Total Environment, 2020, 739: 139899[2023-01-18]. doi: 10.1016/j.scitotenv.2020.139899.
    [17]
    LI Li, HU Ruike, LI Suhong. Simulations of the low-carbon land use scenarios of Beijing based on the improved FLUS model [J]. Remote Sensing for Nature Resources, 2023, 35(1): 1 − 9.
    [18]
    CHEN Xin, HE Xinyi, WANG Siyuan. Simulated validation and prediction of land use under multiple scenarios in Daxing District, Beijing, China, based on GeoSOS-FLUS model [J/OL]. Sustainability, 2022, 14(18): 11428[2023-02-18]. doi: 10.3390/su141811428.
    [19]
    HU Feng, ZHANG Yan, GUO Yu, et al. Spatial and temporal changes in land use and habitat quality in the Weihe River Basin based on the PLUS and InVEST models and predictions [J]. Arid Land Geography, 2022, 45(4): 1125 − 1136.
    [20]
    LI Chen, GAO Binpin, WU Yingmei, et al. Dynamic simulation of landscape ecological risk in mountain towns based on PLUS model [J]. Journal of Zhejiang A&F University, 2022, 39(1): 84 − 94.
    [21]
    YANG Shuo, SU Hao, ZHAO Guoping. Multi-scenario simulation of urban ecosystem service value based on PLUS model: a case study of Hanzhong City [J]. Journal of Arid Land Resources Environment, 2022, 36(10): 86 − 95.
    [22]
    LIANG Xun, GUAN Qingfeng, CLARKE K, et al. Understanding the drivers of sustainable land expansion using a patch-generating land use simulation (PLUS) model: a case study in Wuhan, China [J/OL]. Computers, Environment and Urban Systems, 2021, 85: 101569[2023-01-18]. doi: 10.1016/j.compenvurbsys.2020.101569.
    [23]
    SHU Xiaoyi. Simulation Research on Land Use/Cover Change in Nanliu River Basin [D]. Nanning: Nanning Normal University, 2021.
    [24]
    SHI Lina. Research on Sustainable Development of Wetland Tourism Based on Ecological Ethics: a Case Study of Qinhu Lake National Park [D]. Nanjing: Nanjing Forestry University, 2018.
    [25]
    CAO Lin. Design and Development of Information System of Qin Lake National Wetland Park Based on WebGIS [D]. Nanjing: Nanjing Forestry University, 2008.
    [26]
    Taizhou Jiangyan District People’ s Government. Jiangyan District Territorial Space Planning Implementation Plan [EB/OL]. 2021-05-10[2022-11-21]. http://zrzy.jiangsu.gov.cn/gtapp/nrglIndex.ction?type=a2&messageID=ff80808179404a4e017955b7265e061c.
    [27]
    Jiangsu Forestry Bureau. Wetland Protection Plan of Jiangsu Province (2015−2030) [EB/OL]. 2021-11-19[2022-11-21]. http://fzggw.jiangsu.gov.cn/art/2015/4/30/art_83784_10119305.html.
    [28]
    Taizhou Jiangyan District People’s Government. The 14th Five-Year Plan for National Economic and Social Development of Jiangyan District of Taizhou City and the Outline of the Long-term Goals for 2035 [EB/OL]. 2021-01-21[2022-11-21]. http://www.jiangyan.gov.cn/zfxxgk/fdzdgknr/ghxx/sswgh/ztgh/art/2021/art_48825098368e4bfe9102293f42daaf06.html.
    [29]
    ZHANG Peng, LI Liangtao, SU Yujiao, et al. Spatial and temporal distribution charactersitics of carbon storage in Handan City based on PLUS AND InVEST models [J]. Bulletin of Soil and Water Conservation, 2023, 43(3): 338 − 348.
    [30]
    LIU Feng, YANG Muzhuang, ZHAO Guanwei, et al. Carbon emission effect of Guangzhou based on land use change: a case study of recent 20 years [J]. Agriculture Technology, 2022, 42(4): 73 − 79.
  • 加载中
通讯作者: 陈斌, bchen63@163.com
  • 1. 

    沈阳化工大学材料科学与工程学院 沈阳 110142

  1. 本站搜索
  2. 百度学术搜索
  3. 万方数据库搜索
  4. CNKI搜索

Figures(6)  / Tables(5)

Article views(419) PDF downloads(28) Cited by()

Related
Proportional views

Scenario simulation and prediction of Qinhu National Wetland Park based on PLUS Model

doi: 10.11833/j.issn.2095-0756.20230163

Abstract:   Objective  This study aims to explore the scenario plan for promoting the sustainable development of Qinhu National Wetland Park in Jiangsu Province.   Method  Taking Qinhu National Wetland Park as an example, according to the construction goal and upper level planning of the research area, three scenarios were constructed: natural development, ecological protection and tourism development. Based on the simulation results of PLUS model, an optimization scenario was constructed.   Result  (1) From 2015 to 2020, the conversion of shrub land and construction land in the study area increased the most, which was 14.88% and 8.77% respectively, while the conversion of grassland decreased the most, which was −33.25%. The area of arbor forest land, lake wetland, river wetland, marsh wetland and cultivated land was relatively stable. (2) The land use changes under the three scenarios showed different trends. Under the scenarios of natural development and tourism development, the construction land expanded greatly in the east, middle and southwest of the study area, while the shrub land increased more significantly under the natural development scenario. Under the ecological protection scenario, the central lake wetland and the eastern river wetland showed an expanding trend, and the construction land and cultivated land were the main sources. (3) Under the optimization scenario, various wetlands showed an expanding trend, totaling 69.05%. Arbor forest and shrub land accounted for 16.19% and 5.57% respectively, and the construction land area accounted for 5.90%.   Conclusion  Construction land under natural development and tourism development scenarios encroaches on all kinds of wetlands and forestland, while the area of all kinds of wetlands and forestland under ecological protection scenario increases effectively, and construction land is not fully utilized. Under the optimization scenario, all land use types are reasonably regulated, which helps to coordinate the dual goals of ecological protection and rational development in the study area. [Ch, 6 fig. 5 tab. 30 ref.]

WANG Hui, LIU Yuan, SHI Yan, DING Zhifan, JIANG Hongchao. Scenario simulation and prediction of Qinhu National Wetland Park based on PLUS Model[J]. Journal of Zhejiang A&F University, 2023, 40(6): 1311-1321. doi: 10.11833/j.issn.2095-0756.20230163
Citation: WANG Hui, LIU Yuan, SHI Yan, DING Zhifan, JIANG Hongchao. Scenario simulation and prediction of Qinhu National Wetland Park based on PLUS Model[J]. Journal of Zhejiang A&F University, 2023, 40(6): 1311-1321. doi: 10.11833/j.issn.2095-0756.20230163
  • 湿地是全球生态系统的重要组成部分,具有保护生物多样性、预防旱涝灾害、调节区域气候等功能,被誉为“生命的摇篮”[1]。但人类活动造成的巨大干扰导致湿地退化,严重影响区域生态环境的质量安全[23]。湿地公园是湿地保护体系的重要组成部分,也是解决湿地生态保护和开发利用矛盾的有效途径[4]。然而,目前湿地公园规划方法存在前瞻性不足、保护与利用难以平衡等系统理论体系问题[5]。情景规划是一种探索研究对象未来状态的规划工具,主要根据关键因素和相关驱动因子推演未来的发展情形,能够显著增强对象适应未来不可预见情况的能力[67]。将情景规划理论和方法引入湿地公园规划研究领域,具有一定必要性和可行性。

    目前,情景规划方法常用模型有元胞自动机(Cellular Automata, CA)[810]、小尺度土地利用变化及其空间效益模型(the Conversion of Land Use and its Effects at Small Region Extent,CLUE-S)[1115]、未来土地利用模型(Future Land Use Simulation,FLUS)[1618]、斑块生成土地利用变化模拟(Patch-generating Land Use Simulation, PLUS)[1920]等。其中PLUS模型是一个集成土地扩张策略分析模块(Land Expansion Analysis Strategy, LEAS)和基于多类随机斑块种子的元胞自动机模型的未来土地利用变化模型[21]。该模型可用于探索多种用地类型演变的驱动因素及其对演变的影响,能够在更精细的分辨率下模拟草地、林地等自然类型斑块的生成和演化,在时空范畴上分析多类土地利用斑块变化的机制[2223]。目前,该模型已被应用于国内外土地利用模拟研究中。

    江苏姜堰溱湖国家湿地公园在2005年被批准为首批国家湿地公园(试点),2007年成为长江中下游湿地保护网络成员单位,2011年通过国家湿地公园正式验收。作为中国第1批国家湿地公园试点单位和江苏省首家国家湿地公园,溱湖国家湿地公园具有重要的生态资源保护价值和经济价值。近些年来,溱湖国家湿地公园的生态、经济和社会效益良好,但由于《江苏溱湖国家湿地公园总体规划(2005—2020)》缺少针对湿地生态的规划导则和相应管理办法,导致湿地遭到一定破坏,产生生态结构简单且自我维护功能未得到充分发挥等问题[24]。鉴于此,本研究采用PLUS模型和高分辨率时空数据,研究溱湖国家湿地公园2015—2020年用地空间分布变化的规律,以期为研究区的可持续发展规划提供理论借鉴和科学支撑。

    • 溱湖国家湿地公园属于江苏省泰州市姜堰区,位于全国著名三大洼地之一的里下河地区(31°38′~31°42′N,119°16′~119°19′E),规划总面积为806.9 hm2,湿地面积为588.6 hm2。该湿地公园距泰州城市中心20 km,地理位置优势明显。研究区域内动植物资源丰富,共有102科357种被子植物,4科10种裸子植物,包括3种国家一级保护植物:水杉Metasequoia glyptostroboides、银杏Ginkgo biloba、水松Glyptostrobus pensilis;研究区域内共有138种无脊椎动物,58科155种脊椎动物,包括国家一级保护动物麋鹿Elaphurus davidianus、中华鳄Alligator sinensis、丹顶鹤Grus japonensis、白鹳Ciconia ciconia、黑鹳Ciconia nigra等。区域内留有下河民俗文化、水乡农耕文化和渔事文化等独特的民俗风情文化,人文底蕴深厚。此外,研究区的湿地生态系统典型独特,湿地景观资源丰富多样,在江苏省乃至全国范围内均具有重要地位[25]

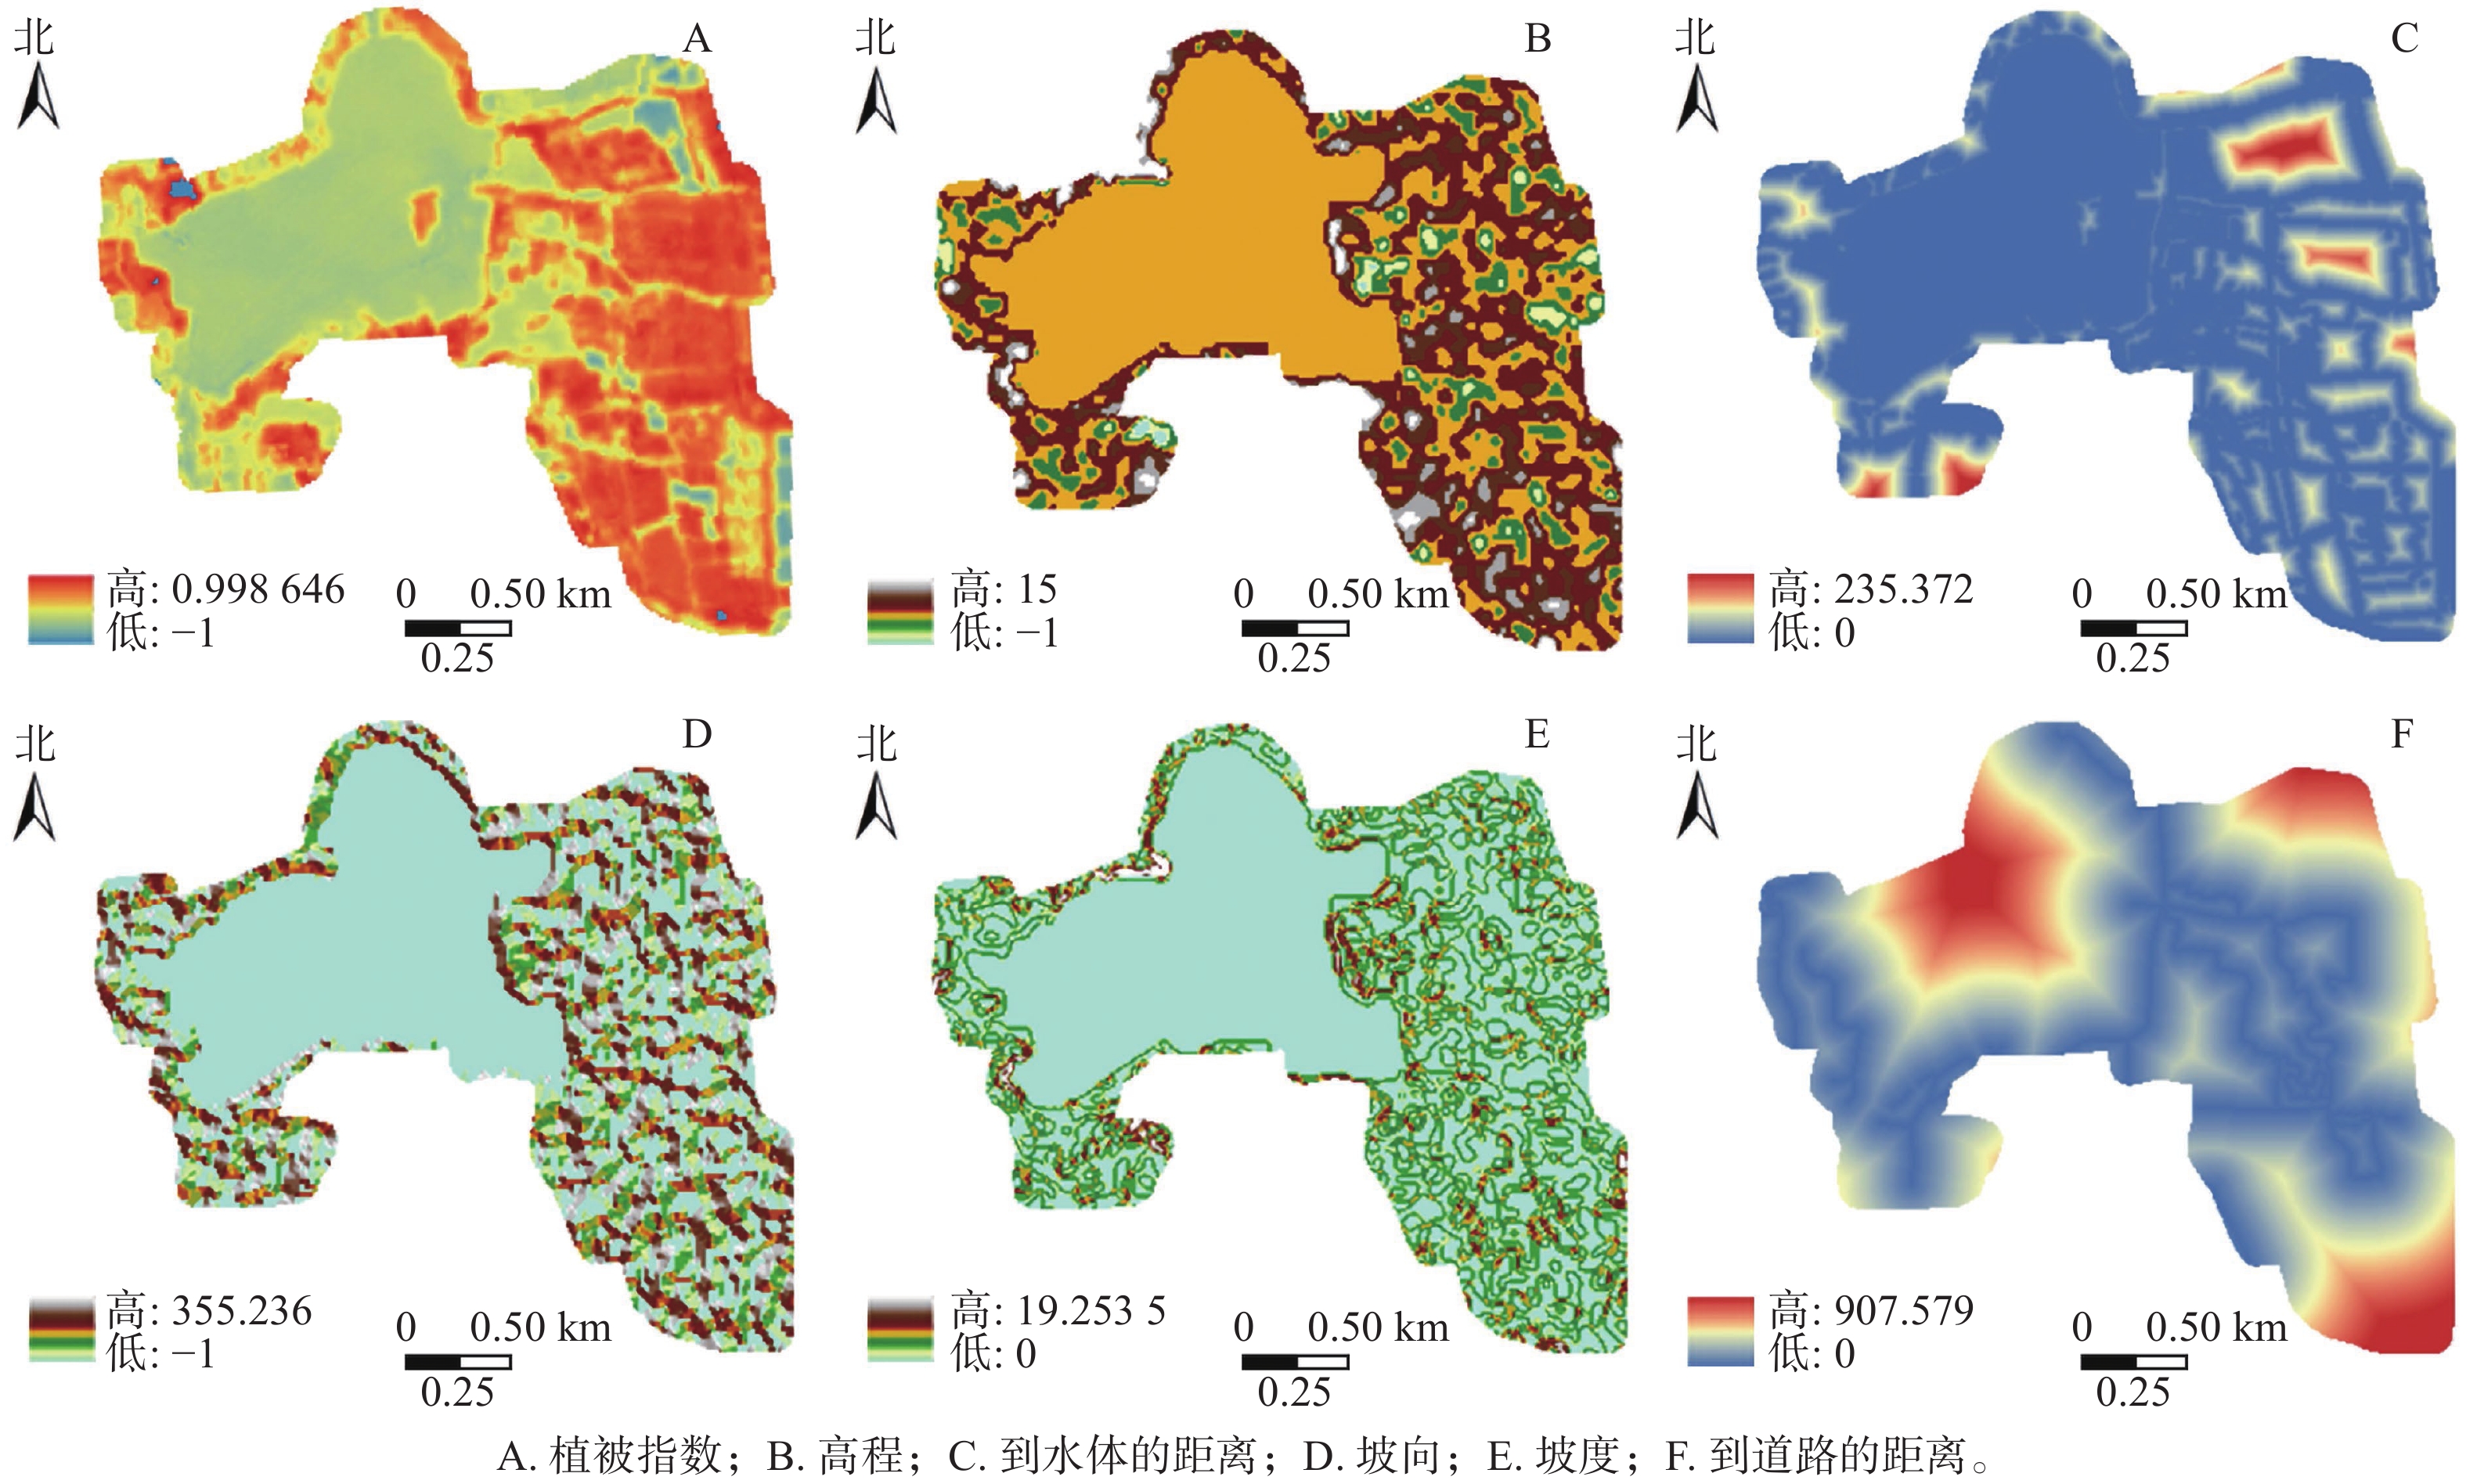
    • 根据研究需要,本研究所采用的数据主要包括:遥感影像数据、驱动因子数据、行政区划数据以及其他辅助数据(表1)。其中研究区2015和2020年遥感影像数据来源为:①购自美国地质勘探局官网的Landsat 8影像,轨道号120,行编号037,所选卫星影像均无云层,遥感影像数据拍摄时间分别为8和10月,影像多光谱分辨率为30.0 m,全色波段分辨率为15.0 m,作数据增强处理后,得到分辨率为15.0 m的遥感影像图;②2015和2020年研究区高清谷歌历史卫星地图,分辨率为2.0 m,用于目视解译过程中用地数据的提取与校对。驱动因子方面,研究区数字高程模型(DEM)数据来自于日本ALOS卫星,数据精度为12.5 m,数据覆盖范围为江苏省全域,用于提取溱湖国家湿地公园的高程、坡度、坡向等数据;植被指数用ENVI 5.3软件提取于Landsat影像,用于分析研究区植被分布和覆盖情况。

      数据类型数据名称精度/m
      遥感影像数据 Landsat 8 OLI 研究区2015年 Landsat 8 OLI 1~9波段 多光谱30.0、全色波段15.0
      研究区2020年 Landsat 8 OLI 1~9波段 多光谱30.0、全色波段15.0
      谷歌卫星 研究区2015年谷歌卫星地图 2.0
      研究区2020年谷歌卫星地图 2.0
      驱动因子 基础地理类 高程(DEM) 12.5×12.5
      坡度(slope) 12.5×12.5
      坡向(aspect) 12.5×12.5
      距离类 到道路的距离(way_distance) 15.0×15.0
      到水体的距离(water_distance) 15.0×15.0
      环境类 植被指数(NDVI) 15.0×15.0

      Table 1.  Research data

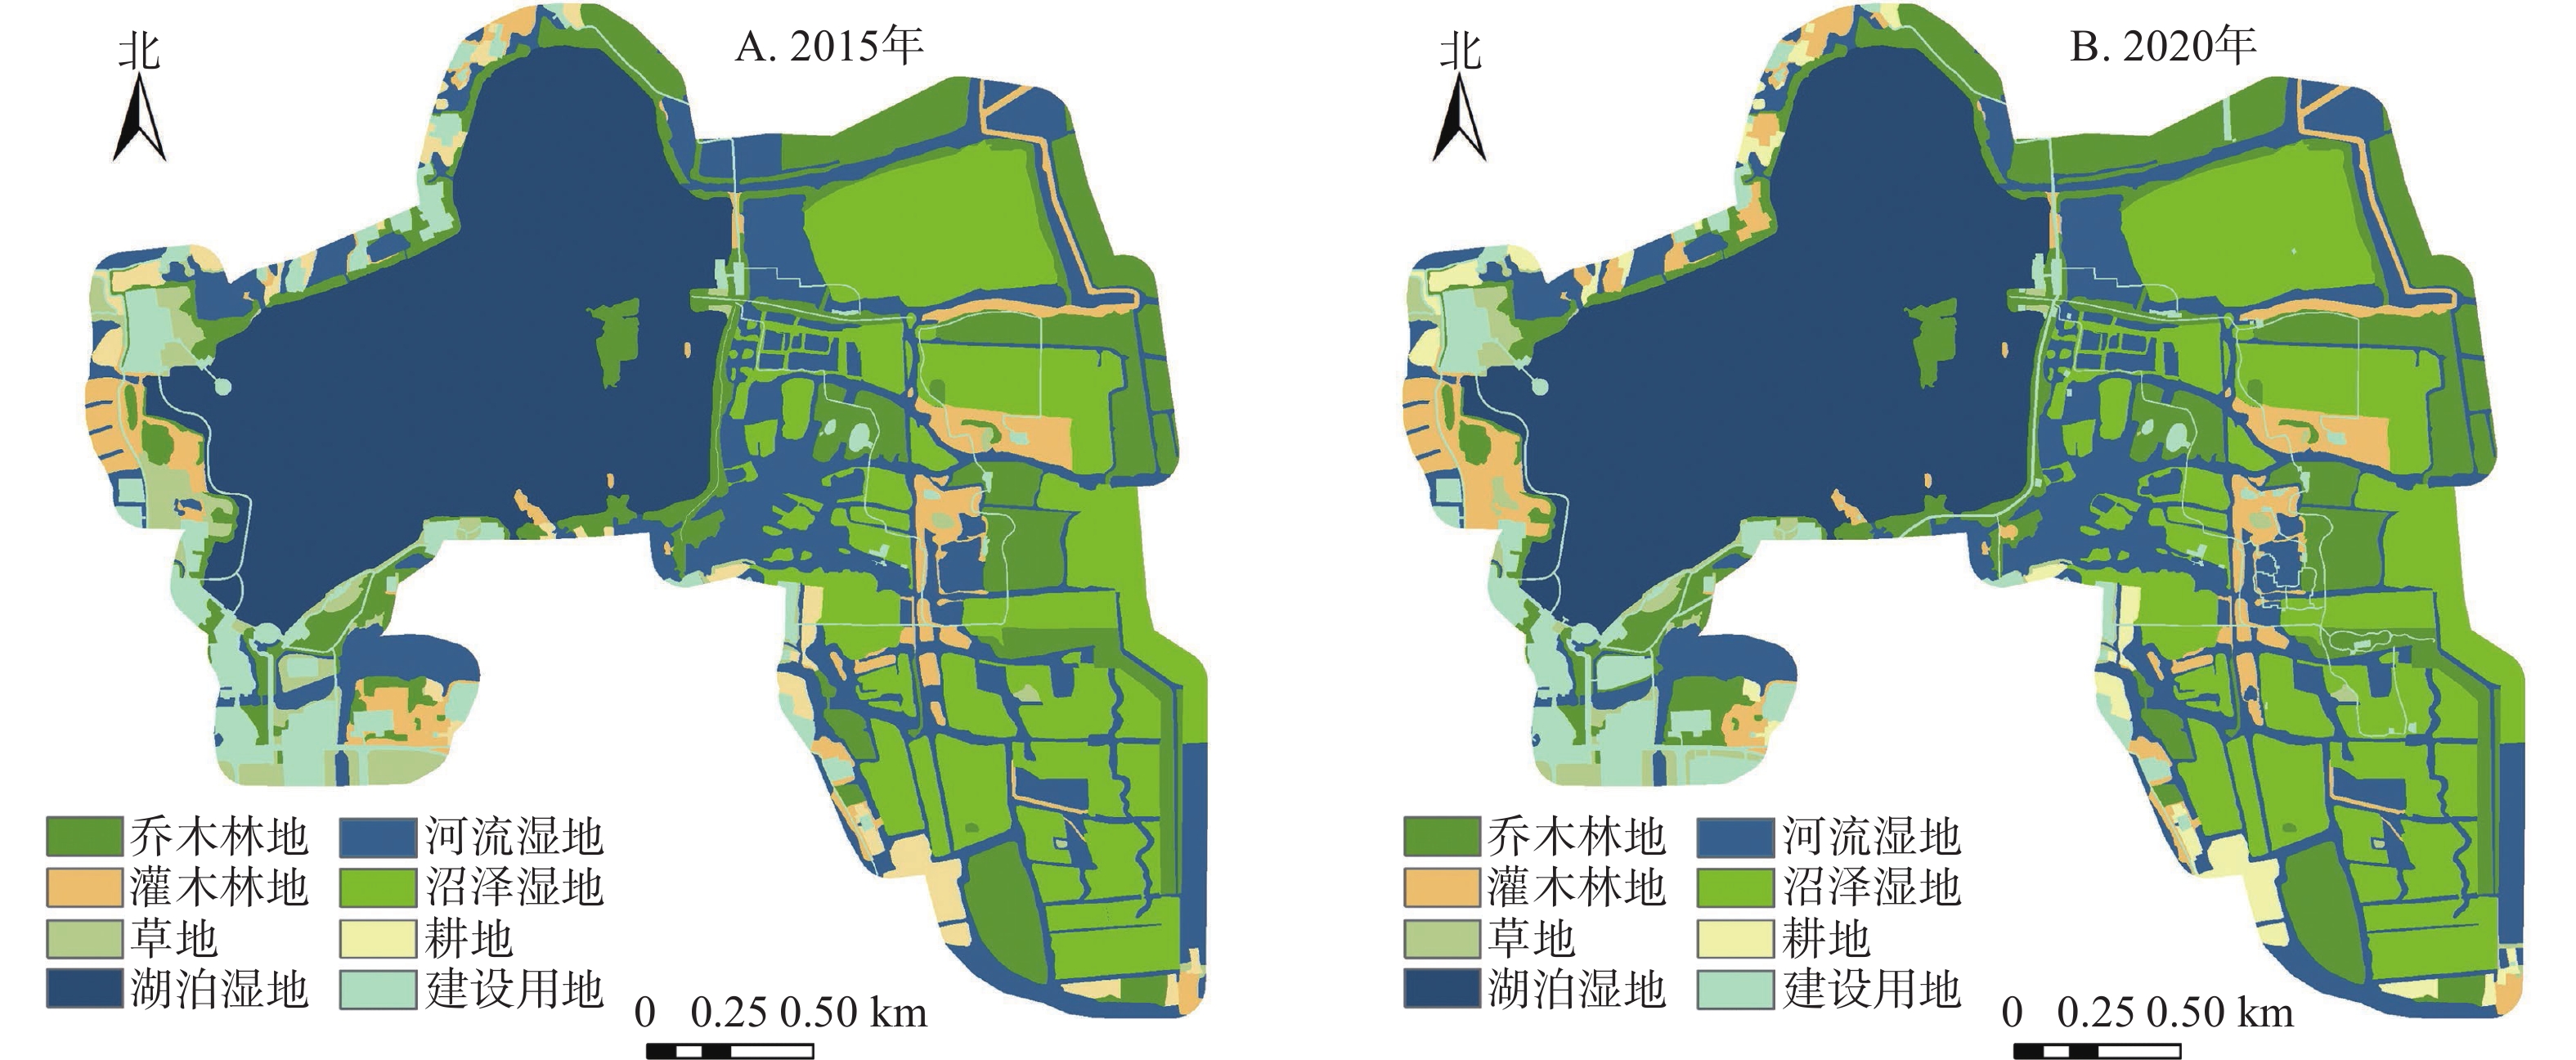
      根据中国土地资源分类系统,将研究区域划分为乔木林地、灌木林地、草地、湖泊湿地、河流湿地、沼泽湿地、耕地、建设用地共8类土地利用类型。借助ENVI 5.3和ArcGIS 10.6软件,选用15.0 m×15.0 m分辨率数据,对遥感影像进行辐射定标、图像融合、几何处理、影像裁剪等预处理,采用人工目视解译法解译遥感影像,并通过野外实地调查校核解译结果,最终得到溱湖国家湿地公园2015和2020年用地空间分布数据(图1)与驱动因子分布数据(图2)。

      Figure 1.  Spatial distribution maps of land use in the study area

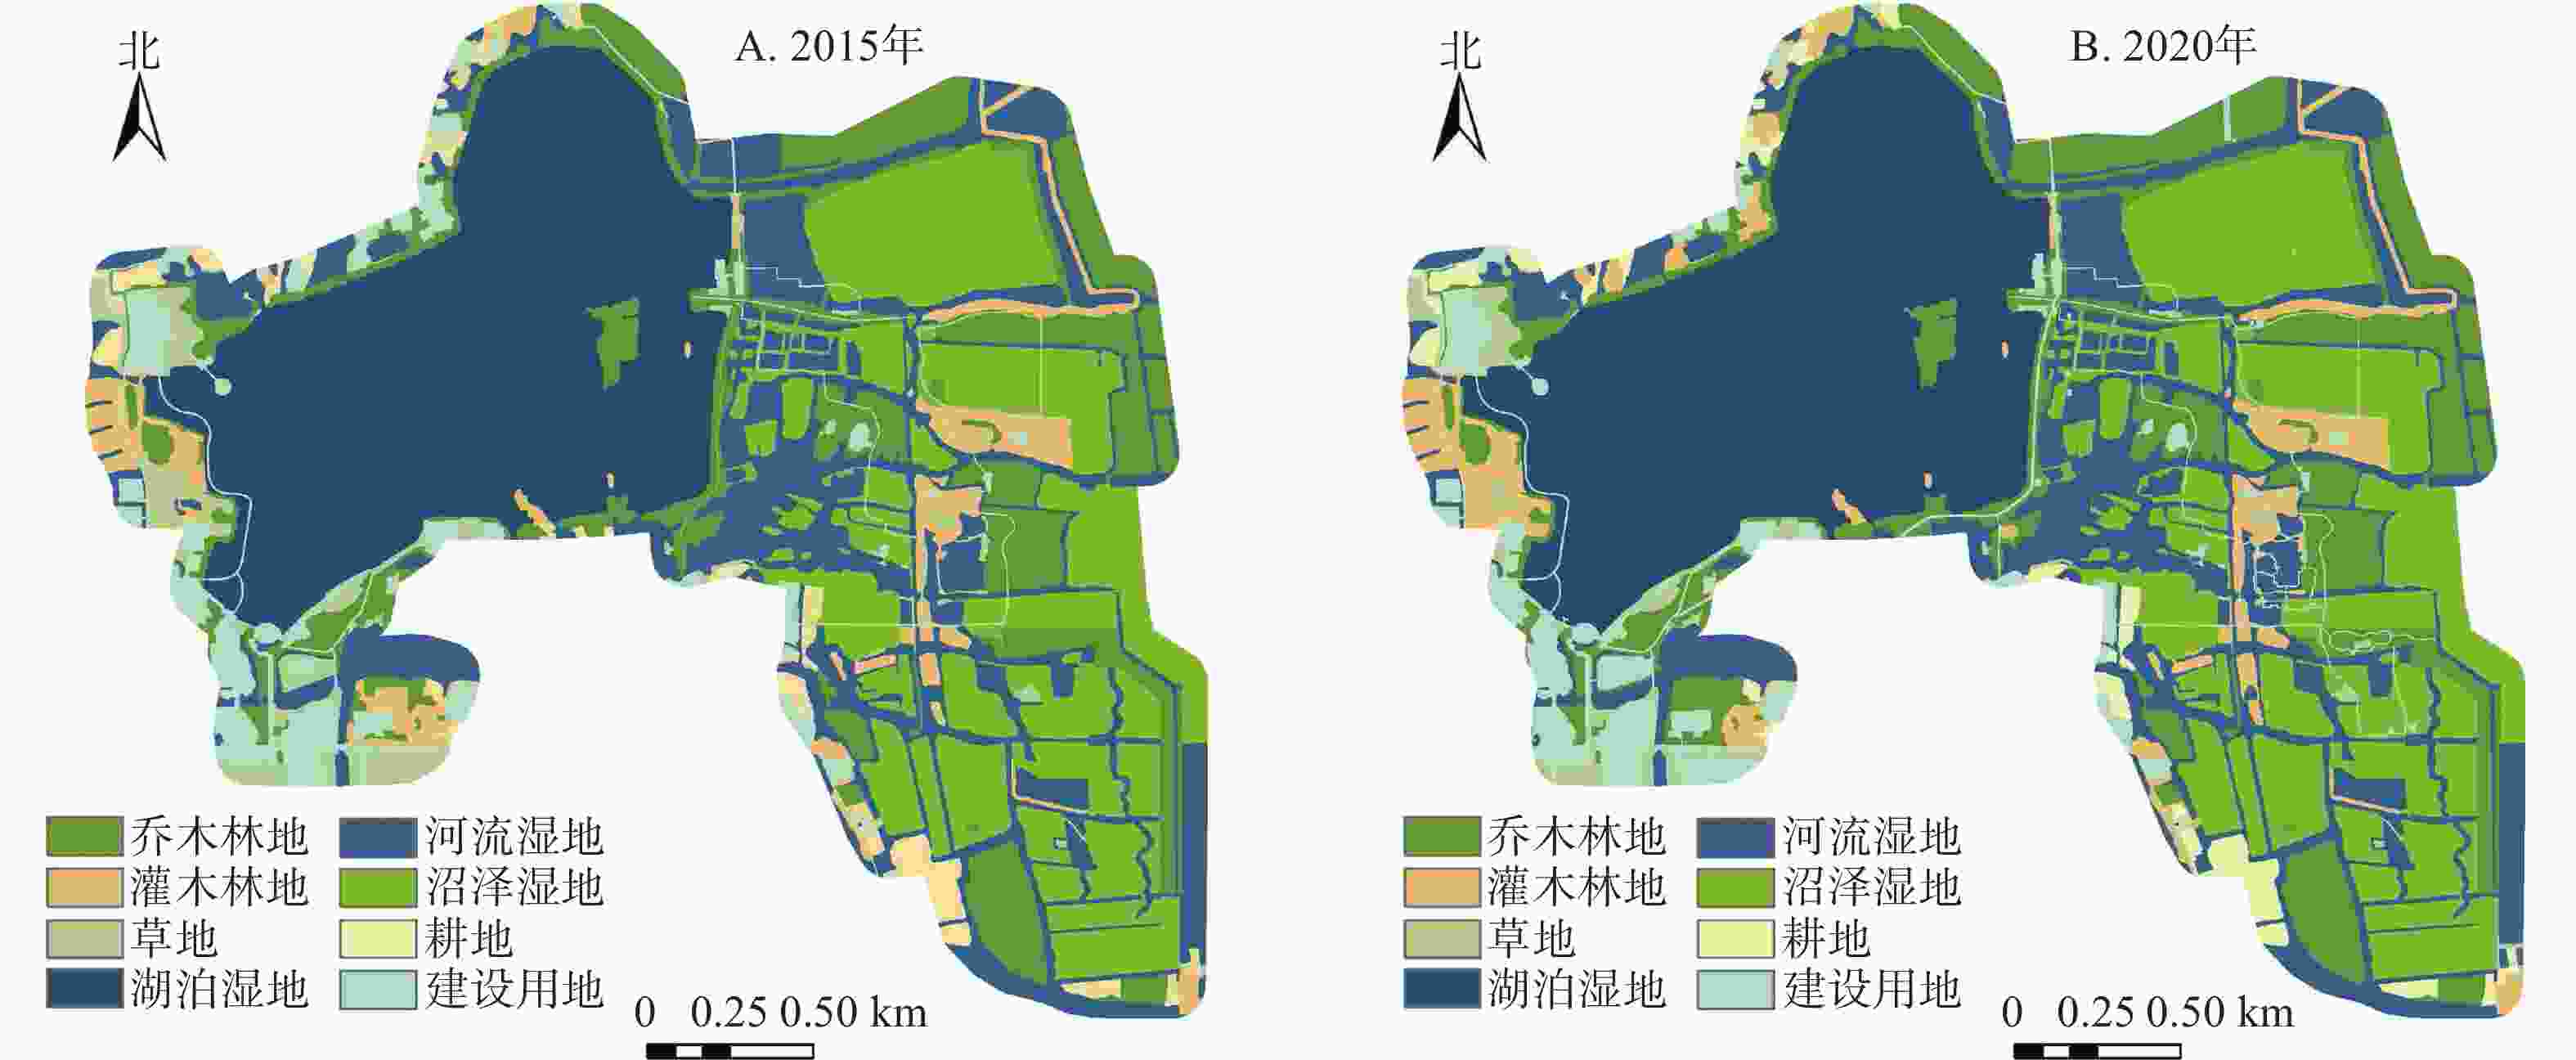
      Figure 2.  Maps of driver distribution

    • 本研究首先对溱湖国家湿地公园2015—2020年的用地空间动态演化过程、驱动机理和发展趋势进行系统分析,并通过模拟2020年用地空间分布对模型和数据精度进行验证;其次,在精度满足要求的前提下进行溱湖国家湿地公园2030年多情景的构建与模拟;最后,基于多情景对比分析结果进一步构建优化情景。

    • 根据湿地公园建设目标、泰州市姜堰区对溱湖国家湿地公园的发展规划和相关参考文献,设定自然发展情景、生态保护情景和旅游开发情景对溱湖国家湿地公园2030年的用地结构和空间分布情况进行模拟预测,具体情景设置及约束条件如下:①自然发展情景:设定此情景以探究现有政策、规划及发展趋势下,研究区未来的用地空间演变结果。此情景下的用地发展不受任何未来政策约束,用地结构和空间布局均按历史惯性发生变化,2030年用地需求以2015和2020年的用地空间分布数据为基础,由Markov模型计算得到,其他参数与2020年用地空间分布模拟时所设参数相同,并且不加入限制性区域。②生态保护情景:该情景以保护湿地生态系统的稳定性为重点,避免因建设用地扩张等原因导致湿地退化和野生动植物栖息地破坏。根据《姜堰区国土空间规划近期实施方案》,溱湖国家湿地公园位于生态保护红线内,湖体范围为禁止建设区、生态环境安全控制区[26]。故此情景将湿地设置为用地转化限制区域,不允许乔木林地、湿地等生态系统服务价值较高的用地类型向生态系统服务价值较低的建设用地和耕地转化,允许各地类向生态价值更高的地类转化;其次,考虑旅游发展和市民休闲游憩等需求,允许建设用地适当扩张,但限制其主要转入源为耕地;最后,根据专家建议对湖泊湿地、沼泽湿地和建设用地的具体面积作出一定约束,适当降低建设用地的增长速率。③旅游开发情景:该情景在当前用地空间演化的基础上结合地区旅游发展目标,重点模拟建设用地迅速扩张对用地空间演化产生的长期效应。根据《江苏省湿地保护规划(2015—2030年)》和《泰州市姜堰区国民经济和社会发展第十四个五年规划和二〇三五年远景目标纲要》对研究区的建设要求[2728],首先,按照一定比例增加耕地向建设用地的转移概率,并减少建设用地向其他用地类型的转移概率,提高建设用地在预测年份的需求量;其次,考虑旅游发展需求,适当增加建设用地的邻域权重;最后,为避免建设用地过度扩张影响区域生态安全,设定湖泊湿地、河流湿地和沼泽湿地的未来用地需求不低于2020年现状的95%,林地占比下限为15%,建设用地上限为10%。

    • PLUS模型是一种面向栅格数据的土地利用变化模拟模型。相比于传统的CA模型,PLUS模型在挖掘土地利用变化的潜在驱动机制和模拟具体的开发和约束情景方面更具优势。PLUS模型主要通过基于阈值下降的多类型随机斑块种子机制,实现对多种土地利用类型的斑块演化,再基于轮盘赌的自适应惯性竞争机制获取土地利用变化的综合概率,最后结合随机斑块生成、过渡转移矩阵和阈值递减机制实现优化,确定最终用地方式[29]

    • 为确保实验误差在允许范围内,本研究以2015年用地数据、驱动因子数据和用地扩张分析数据为原始数据,将研究区2020 年实际用地空间分布与2020年PLUS 模拟结果进行叠加,计算各用地类型模拟正确的像元数与实际像元数的比值,以进行数量精度检验。另外,采用Kappa系数进行土地利用类型的空间精度检验。Kappa 系数的值为0~1,数值越接近1 表示精度越高。

    • 根据溱湖国家湿地公园2015—2020年用地结构(表2)和用地空间分布(图1),从各地类面积和分布情况来看:湖泊湿地面积占比最大,而耕地和草地占比较少,两者占比均不足5%。空间分布上,耕地主要分布于研究区的最北部和最南部,草地则主要零星分布在公园入口处和研究区西北部,乔木林地和灌木林地分布也较为分散,但多数分布在湿地周围,两者面积占比之和稳定在20%左右。

      土地利用类型2015年2020年土地利用类型2015年2020年
      像元个数比例/%像元个数比例/%像元个数比例/%像元个数比例/%
      乔木林地3 734 69715.703 842 03016.15河流湿地4 658 67719.584 479 03918.83
      灌木林地1 149 6694.831 320 7545.55沼泽湿地5 073 87821.335 059 66121.27
      草地  605 1132.54403 8871.70耕地  544 0632.29536 9172.26
      湖泊湿地6 575 41127.646 572 19627.63建设用地1 448 8836.091 575 9076.62

      Table 2.  Land use structure of the study area from 2015 to 2020

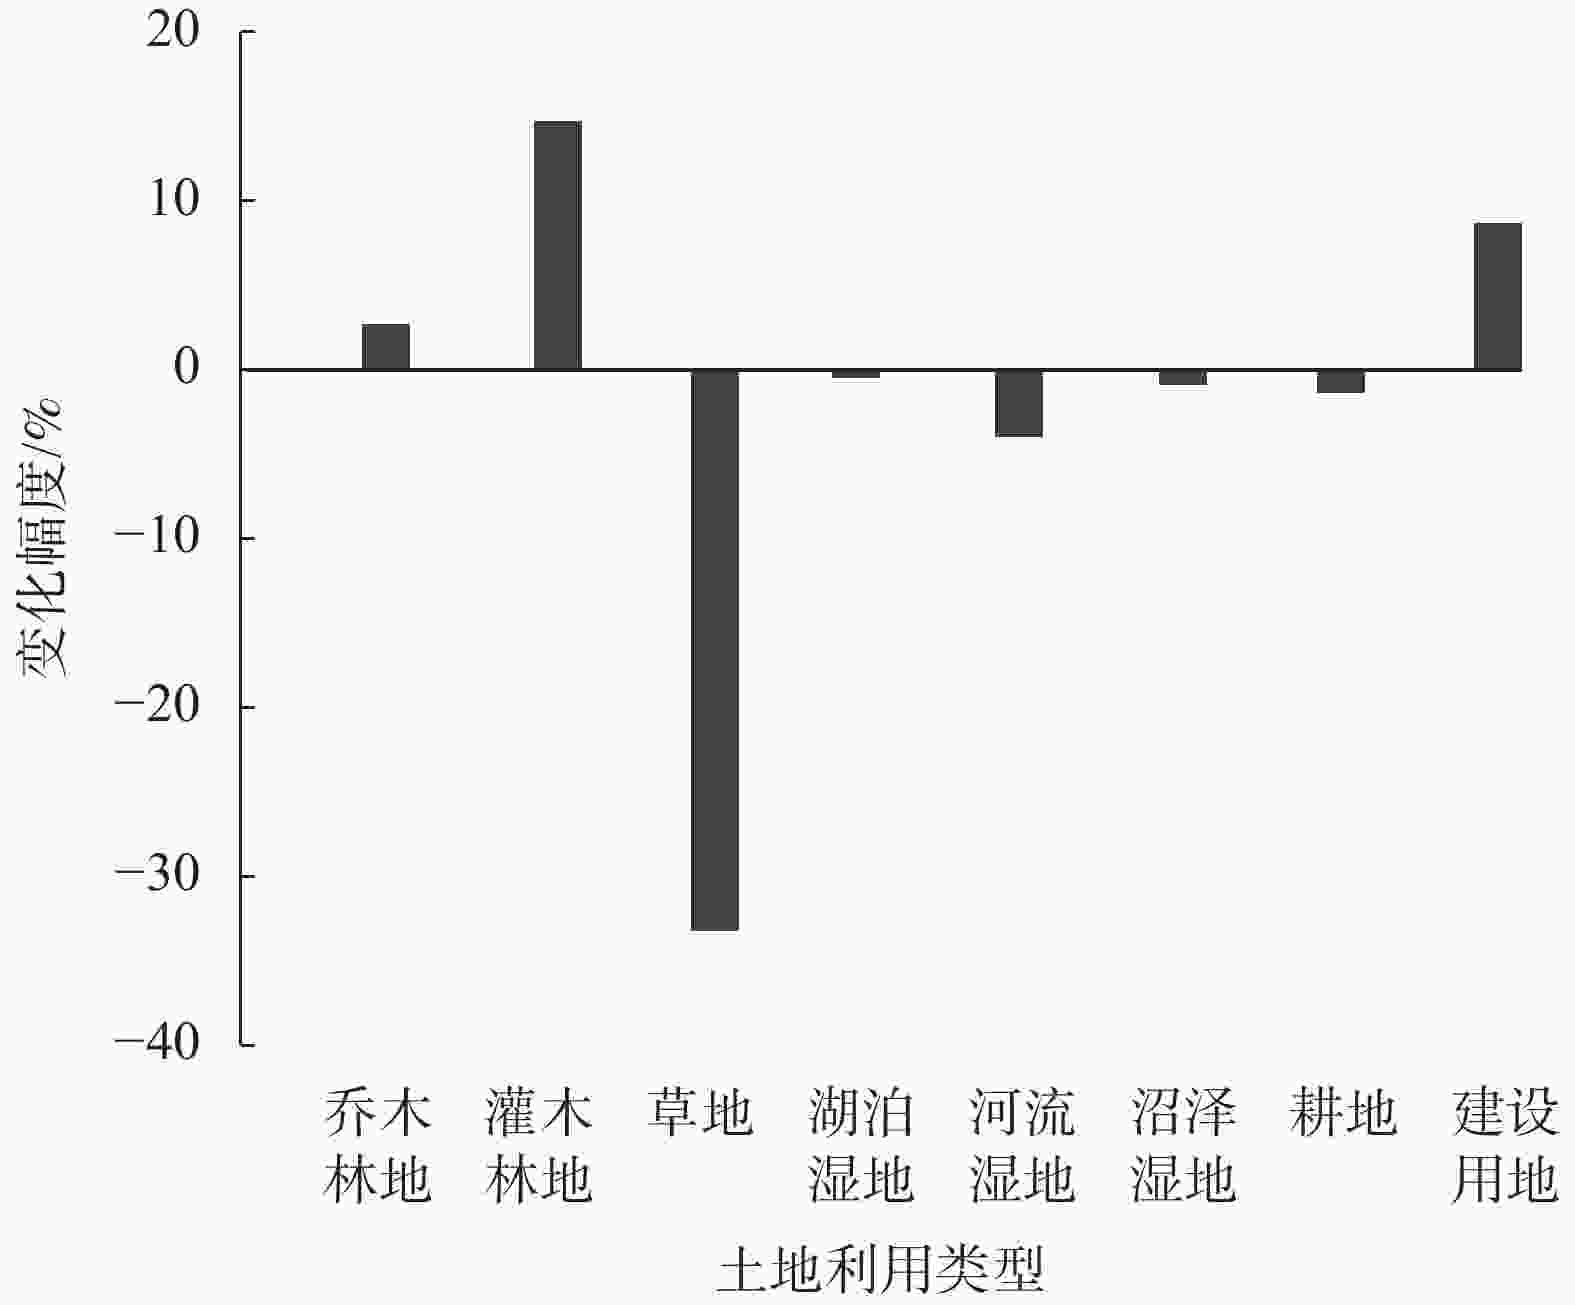
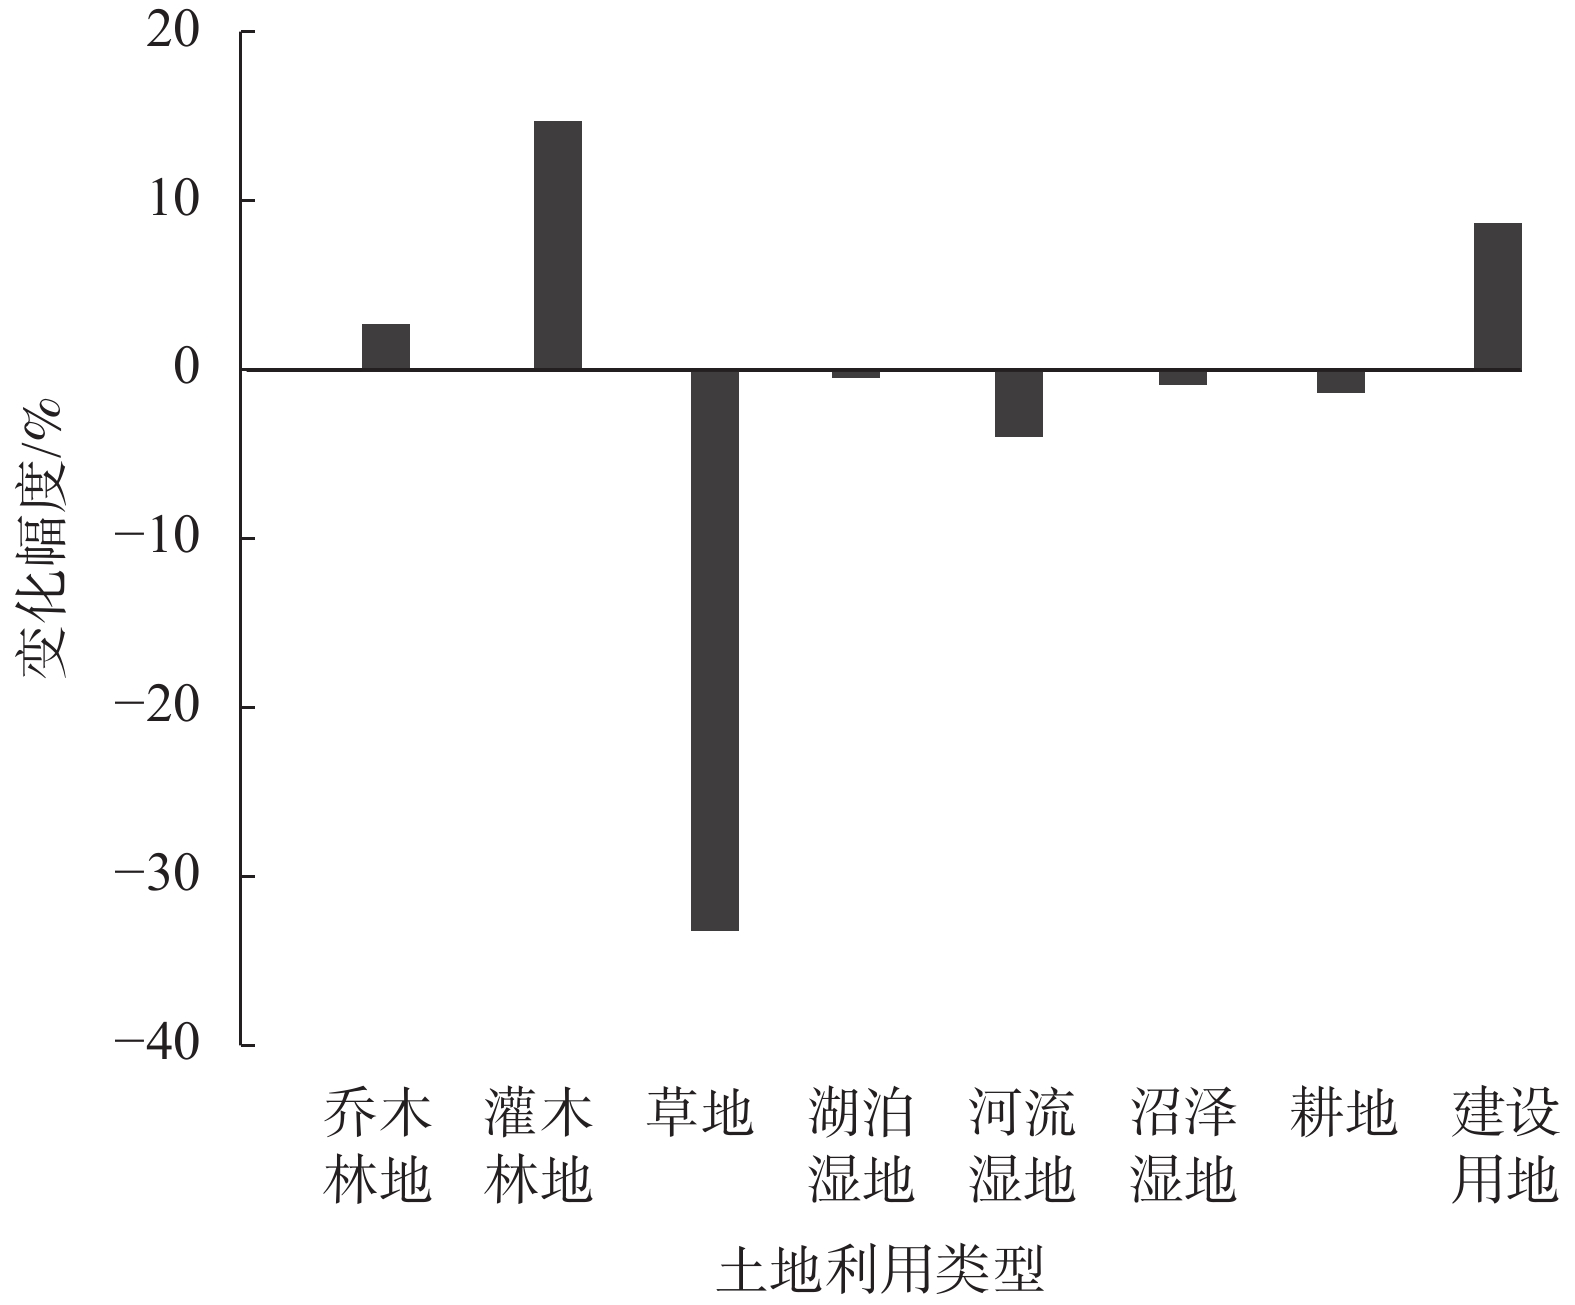
      从溱湖国家湿地公园2015—2020年用地面积的变化幅度来看(图3),各用地类型变化幅度变化均较小。其中有5种地类比例减少,3种地类比例增加。降幅最小的是湖泊湿地和沼泽湿地,仅为−0.05%和−0.28%;降幅最大的是草地,高达−33.25%;比例增大的是乔木林地、灌木林地和建设用地,灌木林地涨幅最大,达14.88%;由于公园建设开发等原因,建设用地增长幅度也较大,达8.77%。

      Figure 3.  Area changes of each land type in the study area from 2015 to 2020       

    • 土地利用转移矩阵,即以二维矩阵的形式展示研究区一定时间段内不同用地类型的变化情况[30]。为了展现研究区2015—2020年间各类用地类型相互转化的数量和方向,由Arcgis 10.6计算转移矩阵(表3)可知:2015—2020年间,耕地、河流湿地、湖泊湿地和沼泽湿地几乎未发生转化;乔木林地只有少量转化为河流湿地和灌木林地;灌木林地转出率最大,主要转化为建设用地和草地,分别占灌木林地总面积的9.52%和8.72%;建设用地向所有地类均有所转移,其中占比较高的是乔木林地和草地,分别为6.16%和6.10%。总体来说,2015—2020年,研究区内除了灌木林地和建设用地转出率较大,其余各地类转出率均很小,各用地类型的面积占比较为稳定。

      年份地类2020
      乔木林地/%灌木林地/%草地/%湖泊湿地/%河流湿地/%沼泽湿地/%耕地/%建设用地/%总计/%
      2015乔木林地94.351.760.140.043.070.010.370.26100
      灌木林地0.6279.928.720.021.160.010.029.52100
      草地  0.070.0295.310.084.230.010.010.27100
      湖泊湿地0.010.000.0099.950.030.000.00100
      河流湿地0.070.070.050.0099.630.100.010.00100
      沼泽湿地0.010.000.000.2699.590.000.14100
      耕地  0.030.100.210.000.780.0198.130.11100
      建设用地6.161.226.100.241.681.930.1382.54100
        说明:表中数值为保留2位小数的百分比,因此0.00不代表未发生转化,只是转化比例非常小;−表示区域未发生转化。

      Table 3.  Land type transfer matrix of the study area from 2015 to 2020

    • 利用PLUS模型中的Validation模块,以5%的采样率对数据进行采样,发现研究区2020 年用地空间分布模拟的整体数量精度平均为90.07%,河流湿地和湖泊湿地分别达96.55%和97.17%,且Kappa系数为95.15%,表明参数设定合理,模拟结果具有较强解释能力,故可将PLUS模型和现有数据用于溱湖国家湿地公园多情景模拟研究中。

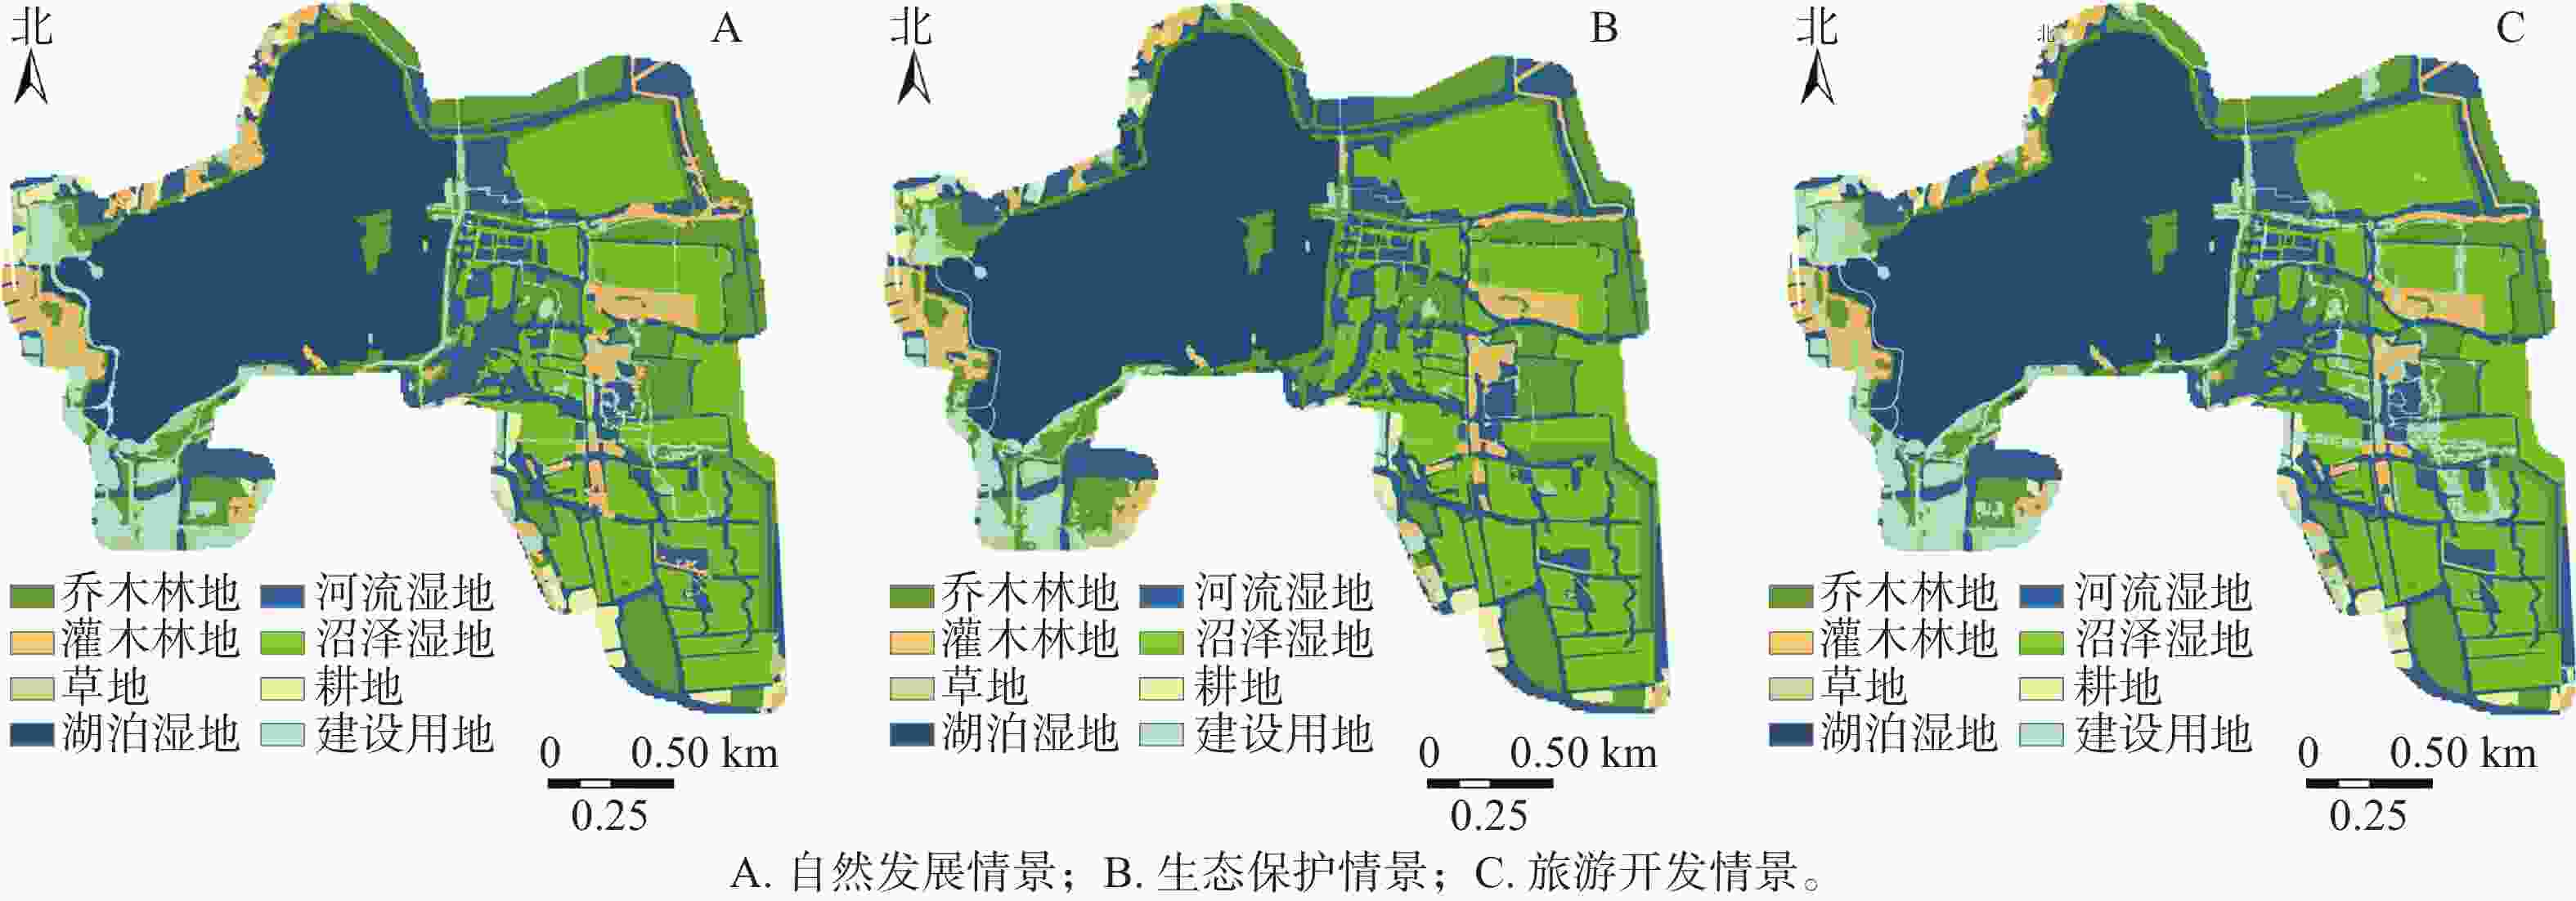
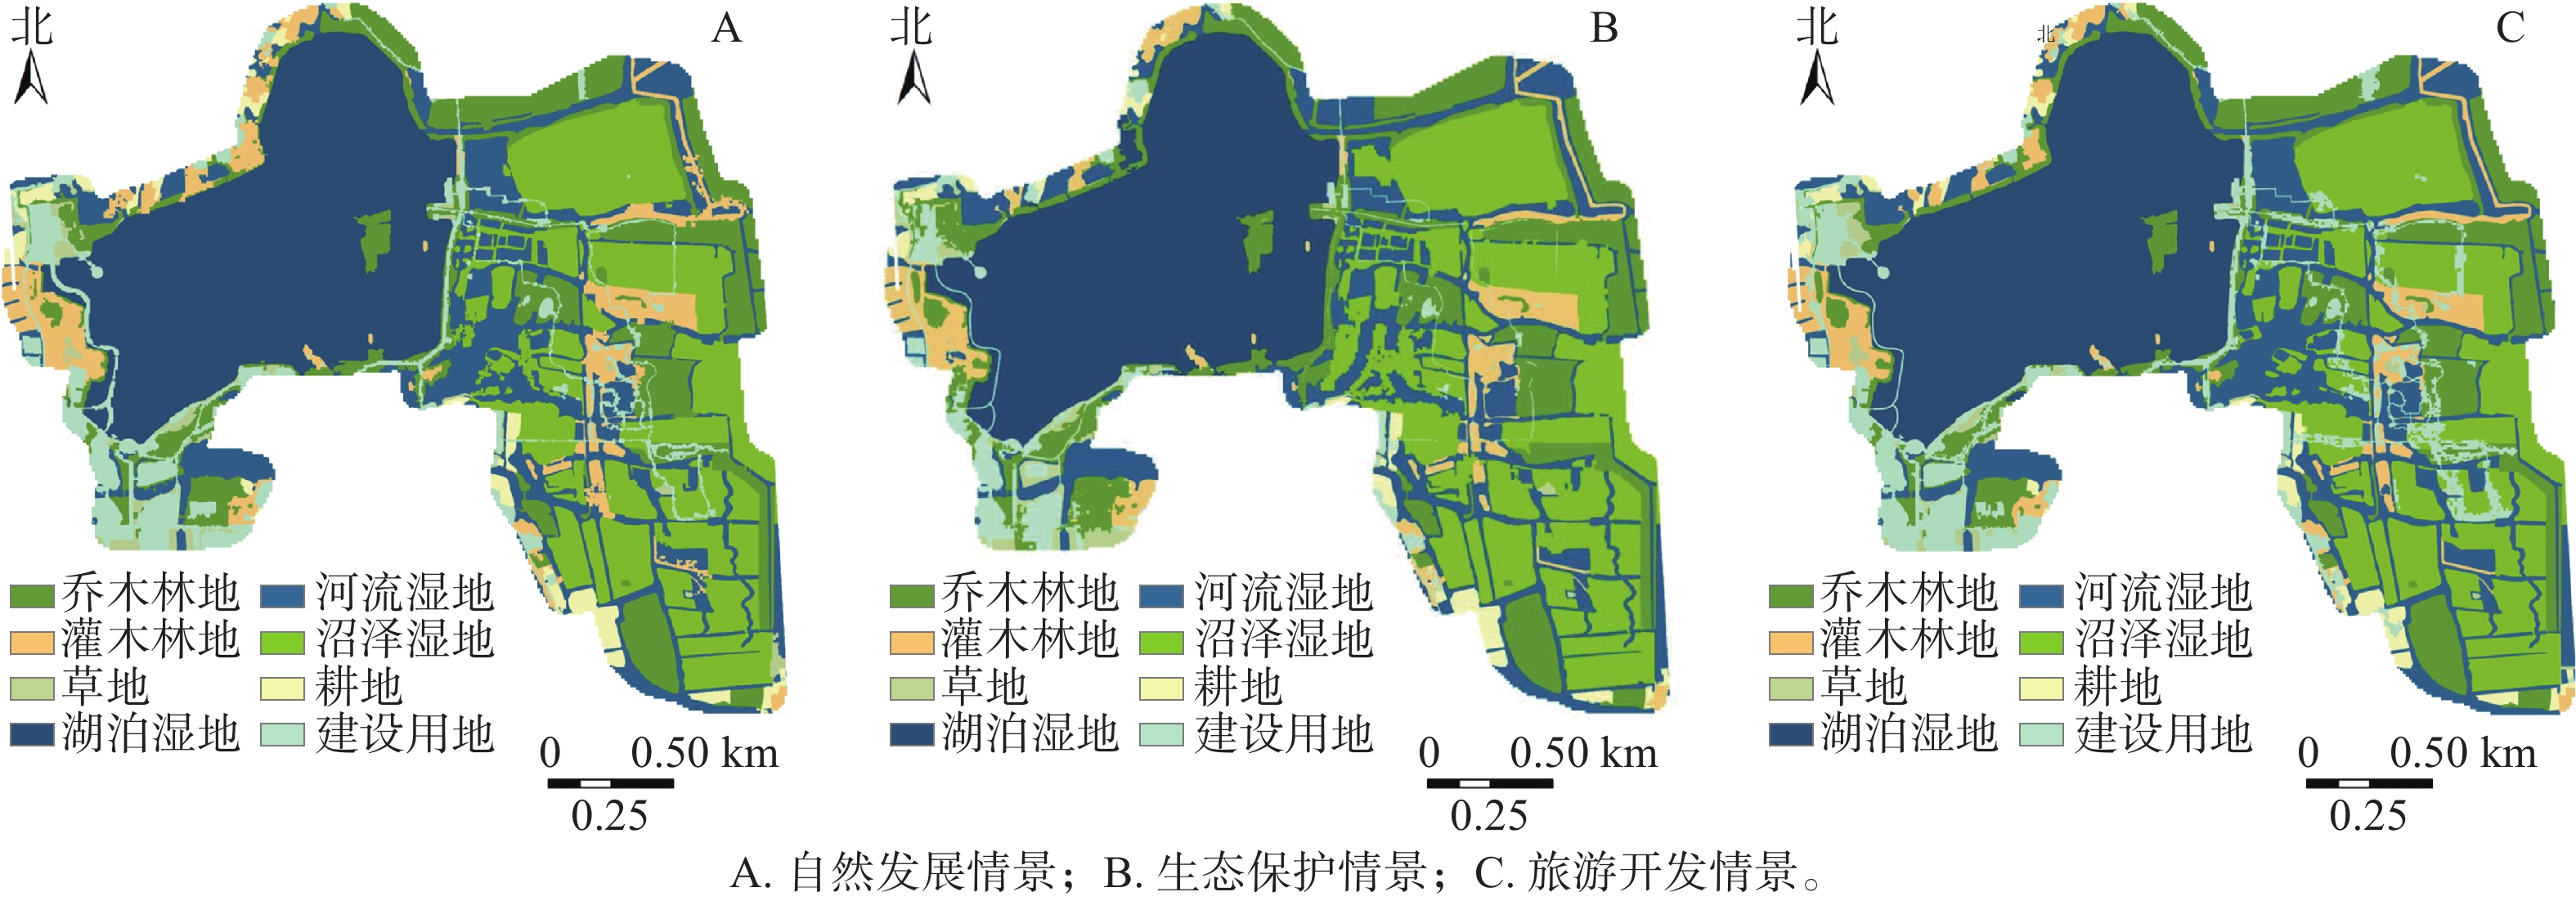
    • ①自然发展情景:未来10 a溱湖国家湿地公园的空间结构相比2020年并未发生重大变化,湖泊湿地仍是溱湖国家湿地公园的主导地类。具体来说:灌木林地变化最为明显,其在2020年的基础上逐步呈现出集聚化、不规则块状的分布特征,涨幅为32.27%;沼泽湿地的主体空间分布未发生较大变化,但局部较2020年更加破碎;建设用地变化呈扩张趋势,该趋势主要体现在研究区东中部和东南部,幅度为23.71%;湖泊湿地、河流湿地和耕地未发生较大变化,只有少量转化为其他用地类型。综上可知,不受任何约束的发展会使得湖泊湿地、乔木林地等生态价值高的地类被侵占,建设用地扩张趋势明显,无法保证研究区生态安全(图4A)。②生态保护情景:在该情景中,研究区中部的湖泊湿地和东部的河流湿地出现扩张趋势,两者转入来源主要是建设用地和耕地,其中建设用地减少了12.16%,耕地减少了25.95%,这2种是未来10 a间面积变化幅度较大的用地类型;相对于2020年,草地也呈现下降趋势,下降幅度为9.48%;沼泽湿地的扩张主要集中在研究区东北部和东中部,这使得研究区东部湿地分布更加密集;乔木林地主要在研究区西部增加;灌木林地主要在研究区南部入口处有所增加。可见在该情景中,建设用地扩张趋势得到有效控制,各类湿地、乔木林地、灌木林地等生态价值高的用地均得到了有力的保护(图4B)。③旅游开发情景:此情景的整体空间分布变化比自然发展情景更明显,即建设用地在研究区西南部和东中部扩张,扩张幅度为30.35%,在研究区边缘处也有新建设用地出现,呈现向东南部扩张的趋势;草地的减少主要出现在古寿圣寺景点处和公园入口处;耕地由于主要分布在研究区边缘处,故更易被转化为其他用地类型,研究区南部的大部分耕地被转化为了建设用地,降幅为−19.58%;乔木林地、灌木林地、各类湿地的空间分布无太大变化,只有少量区域转化为了建设用地,整体分布变化较小(图4C)。

      Figure 4.  Multi-scenario simulations for 2030 in the study area

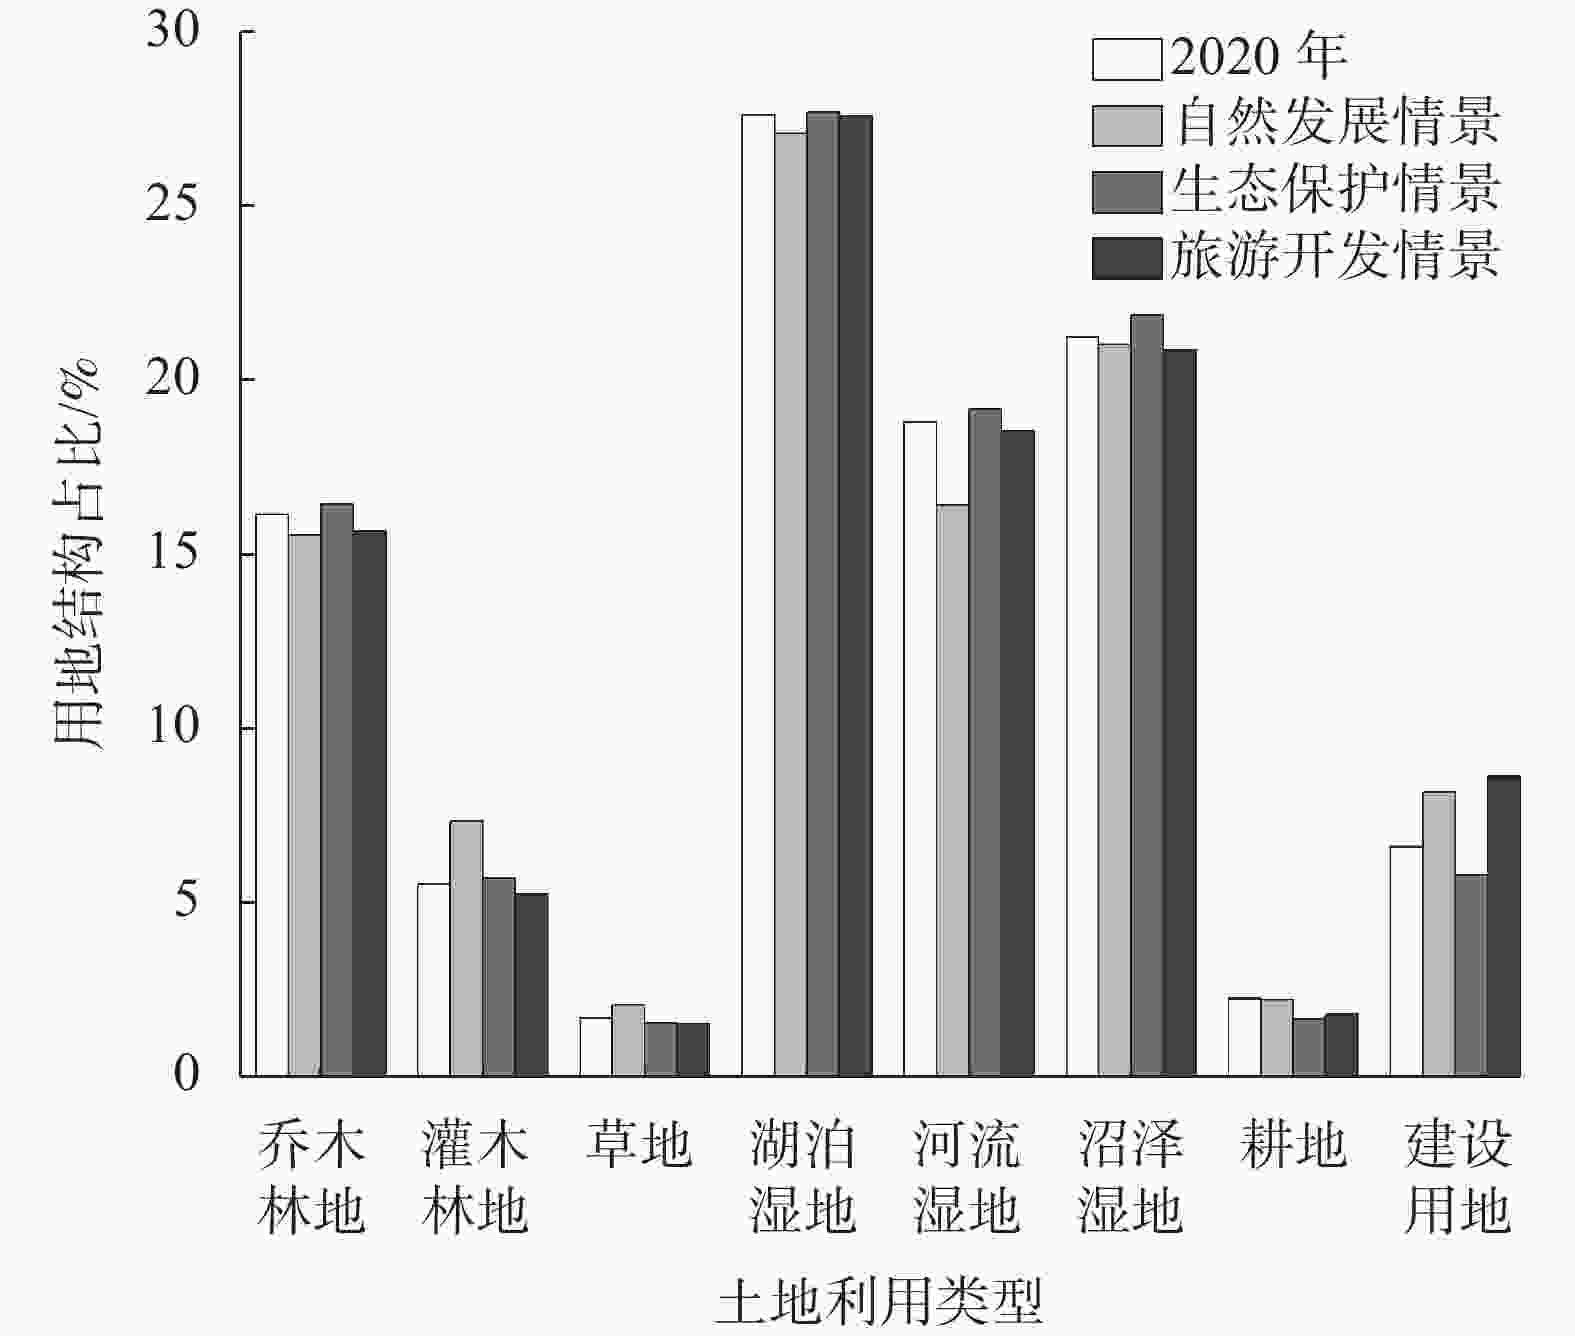
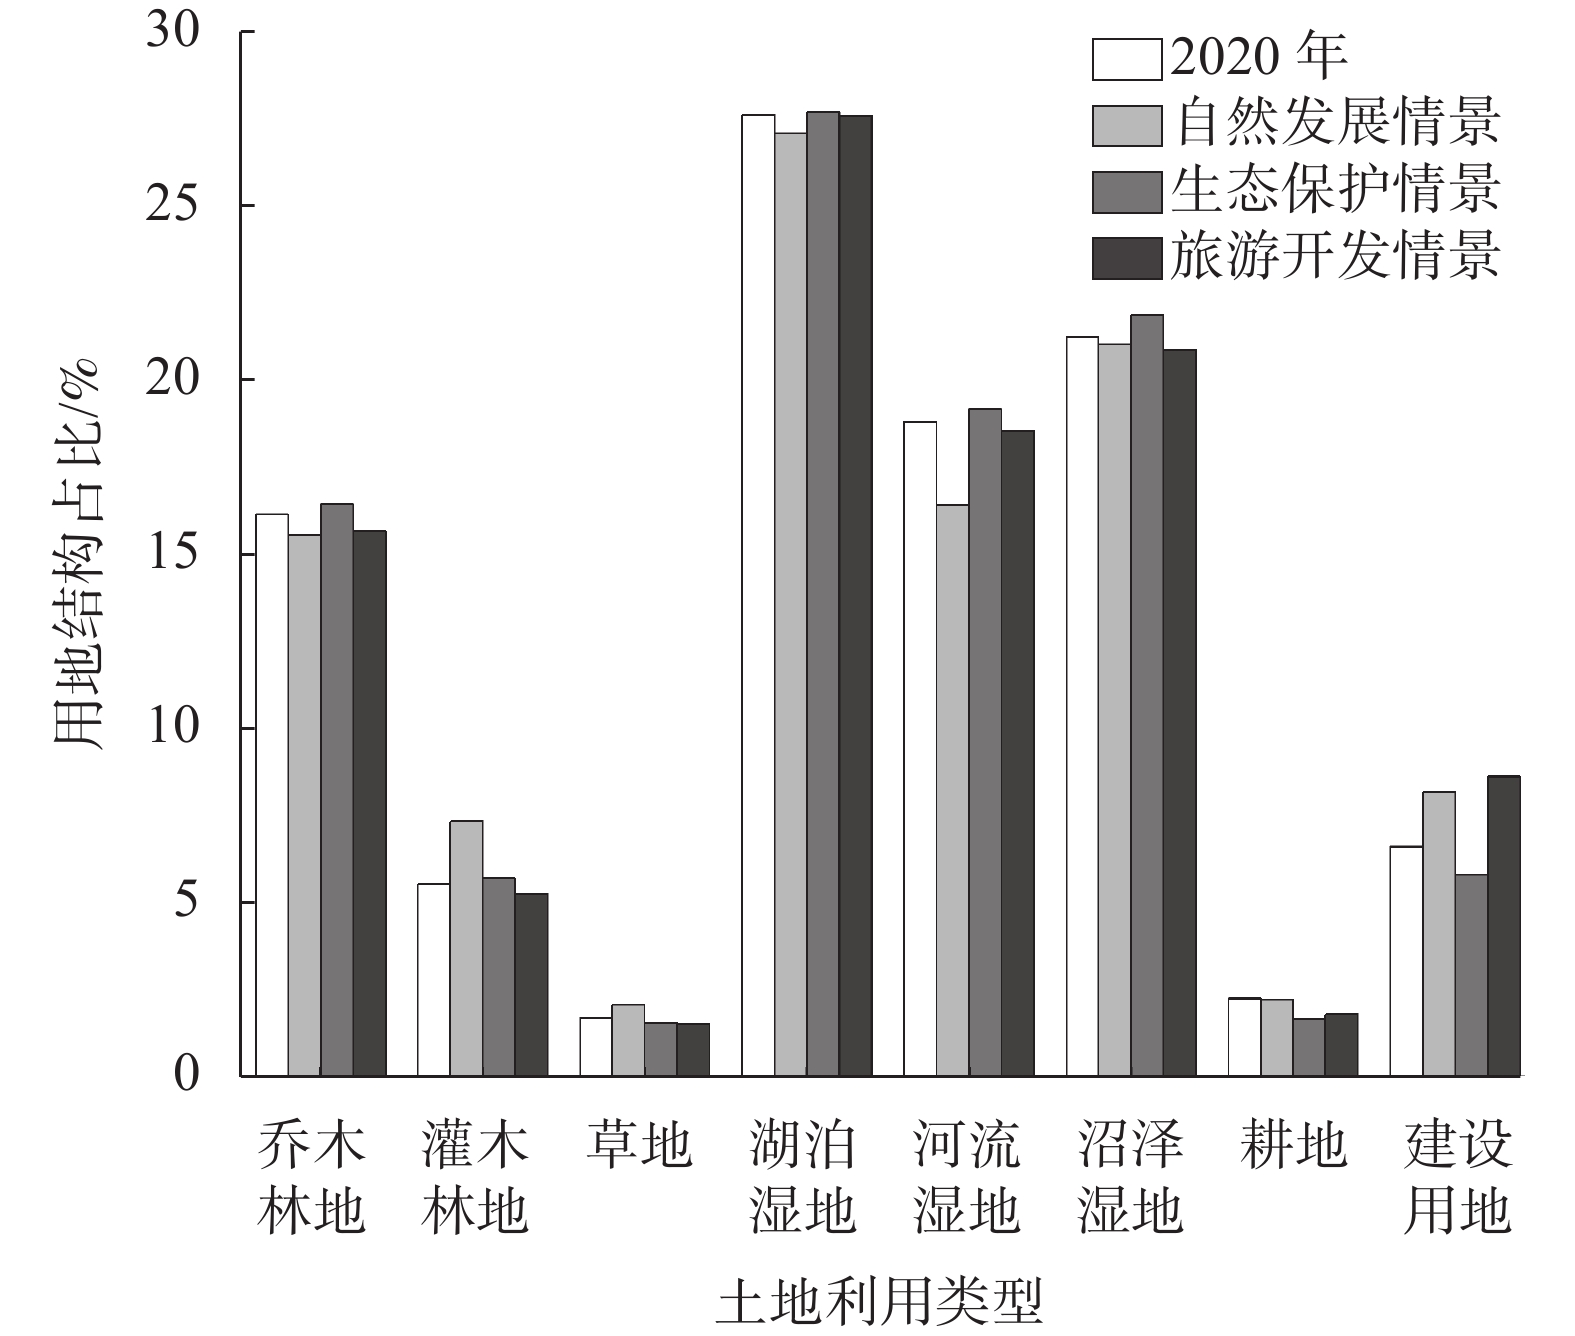
    • 将3种情景的模拟结果和用地结构进行对比分析(图5)可知:①自然发展情景:用地结构和空间分布变化的趋势与2015—2020年基本保持一致,但是由于缺少发展限制,建设用地出现一定程度扩张,区域内部分乔木林地、湖泊湿地、沼泽湿地、河流湿地等生态空间被侵占,河流湿地降幅达−12.78%。②旅游开发情景:建设用地的扩张程度和趋势更加明显,与2020年现状相比,增幅达30.35%,大量湿地、乔木林地等生态价值高的用地被侵占,对生态安全构成一定威胁。可见自然发展情景和旅游开发情景虽然保障了建设用地的数量,满足湿地资源利用的需求,但由于建设用地的扩张强度过大,将导致公园东南部的湿地保育区容易受到人为干扰,不利于湿地的保护与恢复。③生态保护情景:各类湿地和林地面积全部实现了有效增长,尤其是湿地得到一定保护,同时建设用地向研究区东南部继续扩张的趋势和速率得到极大控制。但由于研究区东中部建设用地被转化为乔木林地等其他用地类型,使得建设用地更加破碎化,难以满足合理利用的要求。

      Figure 5.  The proportion of land use types in the study area under different scenarios

      综上所述,3种情景对用地变化有一定调控作用,但无论是自然发展情景、旅游开发情景还是生态保护情景都无法较好协调湿地公园的生态保护和合理利用目标,难以实现用地结构和空间布局的合理优化。因此,需要根据3种情景模拟结果和湿地公园的目标发展需求,对湿地公园的用地结构和空间分布进行综合调控,以促进区域健康和可持续发展。

    • 根据研究区多情景模拟结果,结合泰州市姜堰区相关规划政策和专家建议,对各用地类型的占比进行综合调控(表4)。再根据相关生态保护规划,将极易受外界影响的湿地以及乔木林地区域作为综合限制区域,不允许其发生转化。最后根据规划目标,对邻域指数、转换矩阵等模型参数进行调整。

      约束条件描述
      $ \scriptsize{\displaystyle \sum _{i=1}^{8}{x}_{i}=} $23790391 研究区内所有用地类型的像元数量总和保持不变
      3 842 030 ≤ $ \scriptsize{{x}_{1}} $ 为体现研究区作为麋鹿保护地和鸟类栖息地的生态保护功能,控制乔木林地面积不小于2020年
      16%$\scriptsize{ \displaystyle \sum _{i=1}^{8}{x}_{i} }$ ≤$ {x}_{1} $≤ 20%$ \scriptsize{\displaystyle \sum _{i=1}^{8}{x}_{i} }$ 综合情景分析结果,将乔木林地面积占比控制在16%~20%
      6 572 196 ≤ $ \scriptsize{{x}_{4} }$ 根据《姜堰区国土空间规划》,溱湖属于禁止建设区,故设置湖泊湿地以2020年的面积为下限,
       使其不被建设用地、耕地侵占
      60%$\scriptsize{ \displaystyle \sum _{i=1}^{8}{x}_{i} }$ ≤ ($ \scriptsize{{x}_{4}+{x}_{5}+{x}_{6}} $) 《国家湿地公园建设规范》规定湿地面积占比应该大于60%
      $\scriptsize{ {x}_{8} }$≤ 2 047 008 为防止建设用地扩张过快,生态环境压力加剧,设置Markov预测的自然发展情景中研究区2030年
       建设用地面积的105%作为上限
      $ \scriptsize{{x}_{i} }$>0,i=1, 2$ \scriptsize{, \cdots , }$ 8 各用地类型的像元数量均为非负值
        说明:①$\scriptsize{ {x}_{1} \sim {x}_{8}} $分别为乔木林地、灌木林地、草地、湖泊湿地、河流湿地、沼泽湿地、耕地和建设用地的像元数量。②公式中的数值为像元数量。

      Table 4.  Constraint setting for optimization scenarios

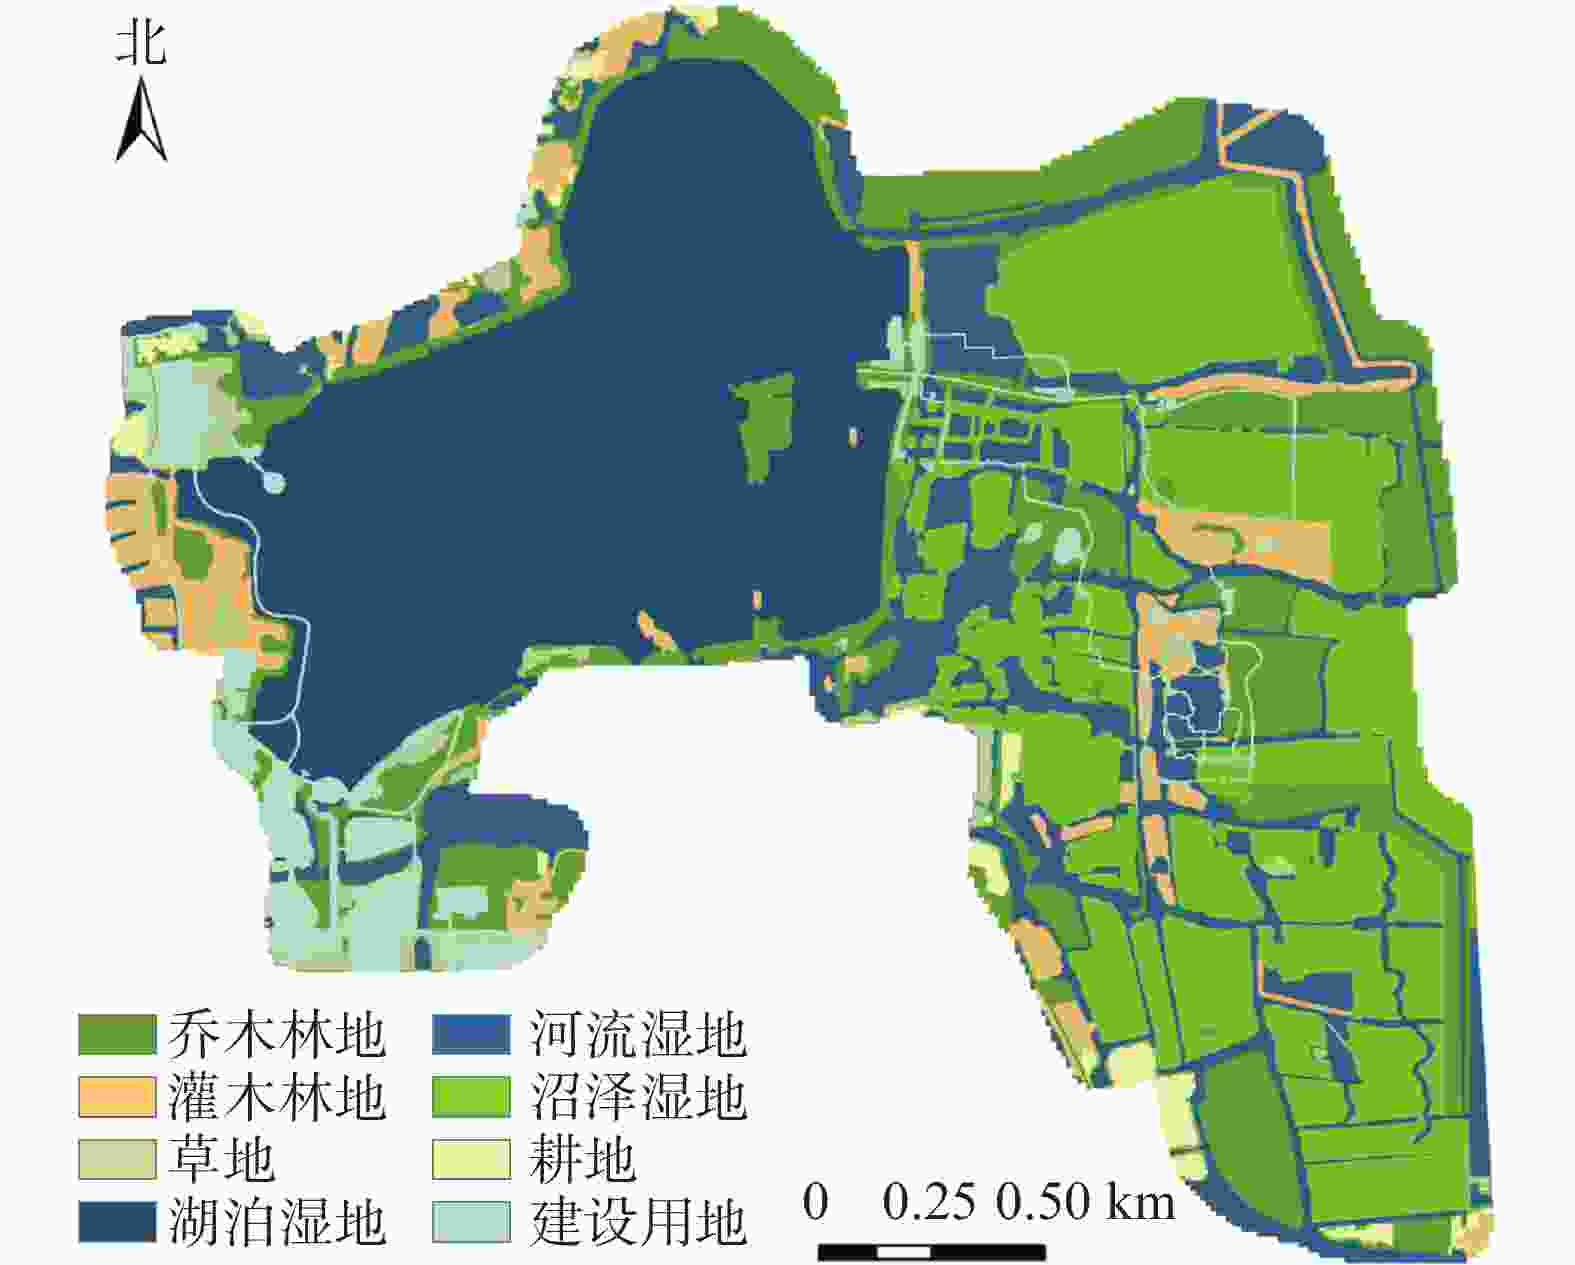
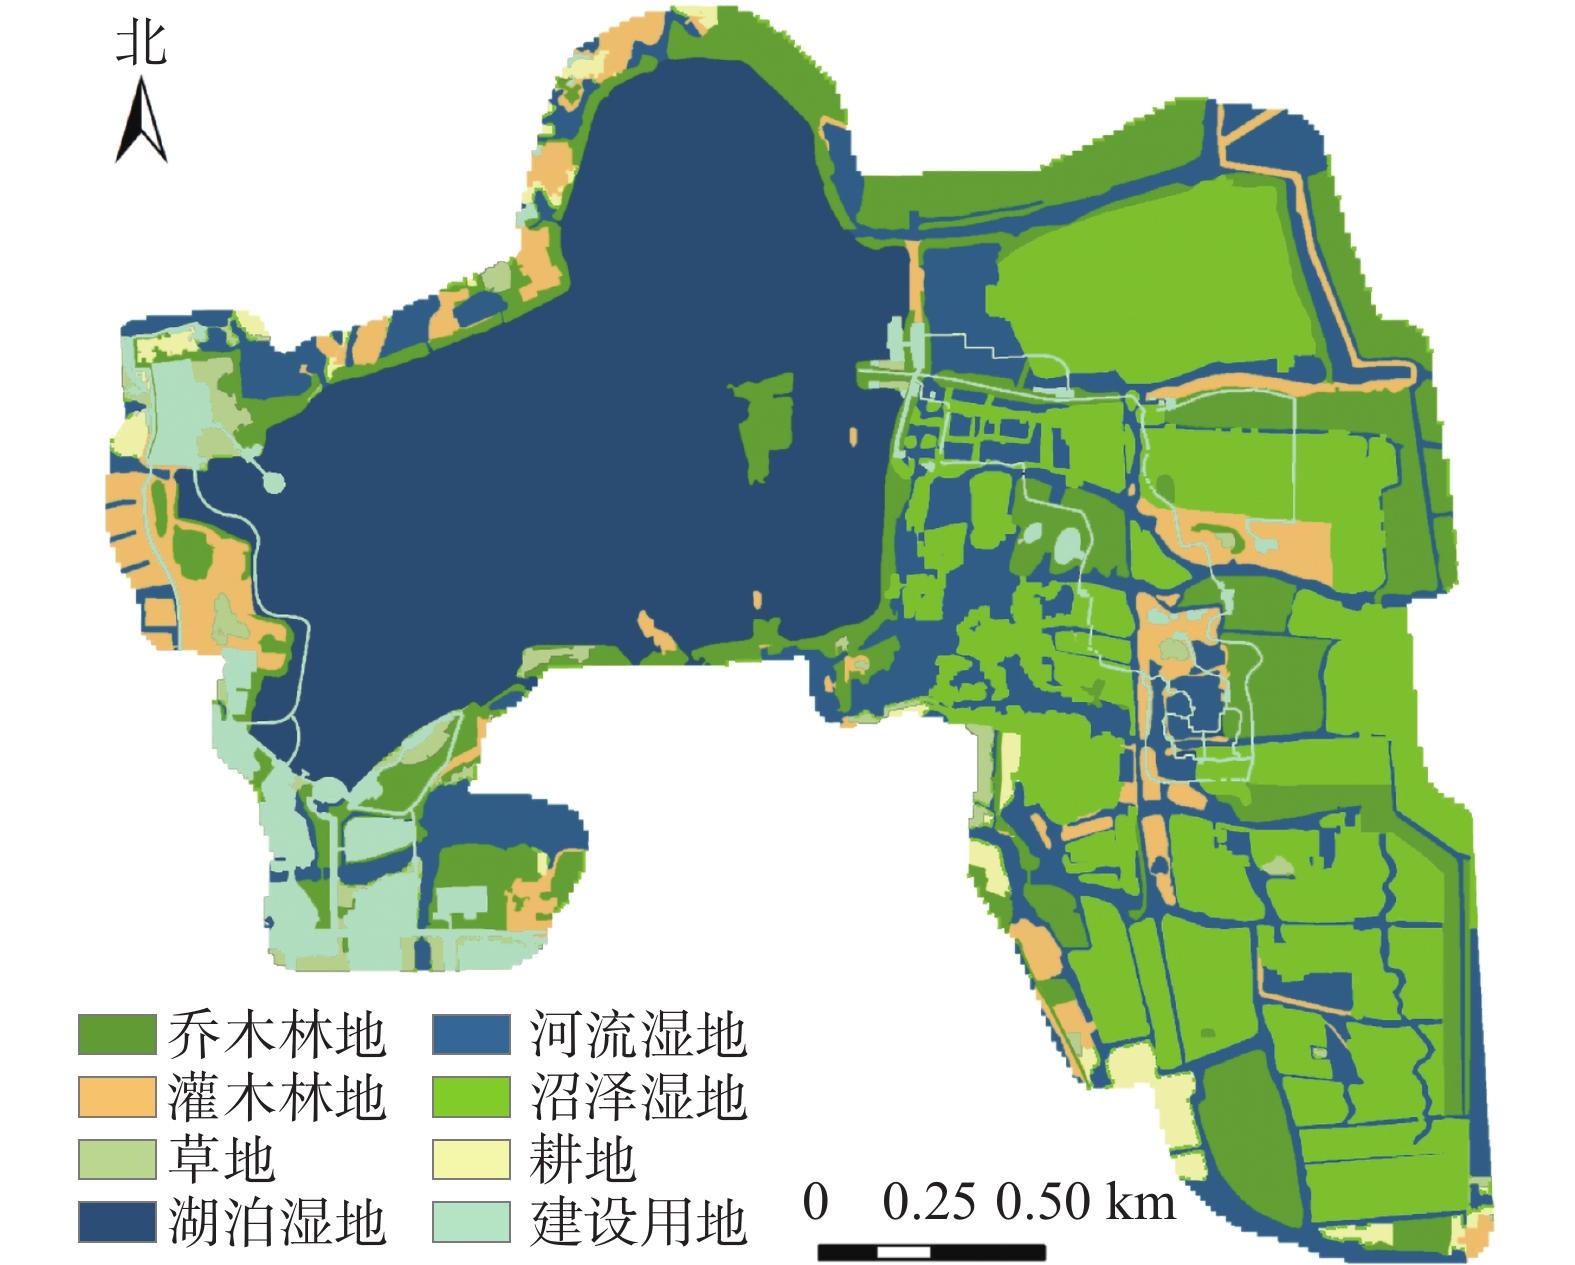
    • 将优化情景用地结构(图6)与2020年研究区用地结构进行比较(表5)可知:用地空间数量方面,优化情景下湖泊湿地面积占比达到27.65%,沼泽湿地面积占比达到22.20%,河流湿地面积占比为19.19%,三者总面积占比高达69.05%,远大于《国家湿地公园规划导则》中要求的60.00%。此外,乔木林地、灌木林地占比分别为16.19%、5.57%。可见通过保护高生态价值用地,限制敏感脆弱的生态区域转化,可使湖泊湿地、河流湿地等生态用地呈现不同幅度的扩张;建设用地占比为5.90%,与生态保护情景相比面积有所上涨,保证了旅游开发所需的建设用地面积,可见各地类均得到较为合理的调控。用地空间分布方面,通过将易被建设用地所挤占的区域设置为限制区域,优化情景保障了研究区东南部较脆弱湿地的生态安全。湖泊湿地未发生其他转化,仍呈现聚集形态,满足《姜堰区国土空间规划》中对溱湖禁止建设的要求,且与自然发展和旅游开发情景相比,乔木林地和灌木林地破碎化程度也有所减少。

      Figure 6.  Optimization scenario of Qinhu National Wetland Park

      土地利用类型2020年2030年像元变化量土地利用类型2020年2030年像元变化量
      像元个数比例/%像元个数比例/%像元个数比例/%像元个数比例/%
      乔木林地3 842 03016.153 852 72716.1910 697河流湿地4 479 03918.834 565 98319.1986 944
      灌木林地1 320 7545.551 324 5715.573 817沼泽湿地5 059 66121.275 282 58622.20222 925
      草地  403 8871.70369 6651.55−34 222耕地  536 9172.26410 7001.73−126 217
      湖泊湿地6 572 19627.636 579 15727.656 961建设用地1 575 9076.621 405 0025.91−170 905

      Table 5.  Comparison of optimization scenarios in 2030 and land use structures in 2020

      相比自然发展、生态保护和旅游开发情景,优化情景既保证生态系统的安全稳定,也留有一定建设用地用于旅游发展,在数量和空间布局上更接近湿地公园规划目标,能够使溱湖国家湿地公园的未来发展更具弹性和适应性。

    • 本研究将情景规划方法引入湿地公园规划研究领域,对溱湖国家湿地公园未来的规划建设进行了多目标导向下的情景模拟,包括自然发展情景、生态保护情景和旅游开发情景,并基于3个情景的比较分析,构建了优化情景。通过研究可知:①2015—2020年,研究区整体用地空间分布较为稳定,2个时期用地结构差异较小。5 a间溱湖国家湿地公园的灌木林地和建设用地的面积呈持续扩张的趋势,并且两者的转化幅度也为最大。草地则呈大幅度减少趋势,破碎化程度加剧,变化幅度为所有用地类型中最大。②自然发展情景和旅游开发情景均会使建设用地大幅度扩张,从而导致各类型湿地和林地等高生态价值用地被侵占,生态系统稳定性降低。生态保护情景下,湖泊湿地、河流湿地、沼泽湿地、乔木林地和灌木林地均实现不同幅度的增加,保障了湿地公园生态功能的实现,但也使得研究区东部的大量建设用地将被转化为其他用地类型,分布更加破碎化。③根据2015和2020年用地结构转化情况以及多情景模拟结果可知:某土地利用类型的斑块越小、越破碎化,其稳定性越差,越容易转化为其他用地类型,而斑块越大则越稳定。例如本研究区域内的耕地、草地就是变化幅度较大的地类,两者几乎一直处于高转化模式,是其他用地类型的主要转入来源。湖泊湿地由于面积占比最大,且聚集性特征最明显,故在任何情景下的变化幅度均较小。④2020年研究区用地空间分布模拟结果的Kappa系数达95.15%,表明PLUS模型对中小尺度景观类型同样具有较强的解释性,准确度和精度较高,未来可以将其广泛应用于森林公园、郊野公园等类似尺度的研究对象。

      本研究目前尚存在一定的局限性。受数据获取和模型运行的限制,本研究使用的遥感数据为15.0 m精度,虽然利用2.0 m精度的高清谷歌历史卫星地图进行提取和校对,但仍存在一定误差。在以后的研究中,可以尝试使用更高精度的遥感数据。另外,本研究选取了高程、坡度、坡向、到道路的距离、到水体的距离和植被指数等驱动因子进行分析,但用地空间分布模拟是一个复杂的过程,不仅仅是由这些因素所导致,因此可能会导致无法完全解释用地变化的原因。在今后的研究中,应导入更多的驱动因子,以针对不同湿地类型、湿地公园类型展开更为细致的研究。

    • 感谢江苏省城乡规划设计集团有限公司研究员级高级工程师刘小钊的指导与帮助。

Reference (30)

Catalog

    /

    DownLoad:  Full-Size Img  PowerPoint
    Return
    Return